flood of march 1997 in southern ohio - usgs · flood of march 1997 in southern ohio by k. scott...
TRANSCRIPT
Flood of March 1997 in Southern OhioBy K. Scott Jackson and Stephen A Vivian
U.S. GEOLOGICAL SURVEY Water-Resources Investigations Report 97-4149
Prepared in cooperation with the Ohio Department of Natural Resources
Columbus, Ohio 1997

U.S. DEPARTMENT OF THE INTERIOR BRUCE BABBITT, Secretary
U.S. GEOLOGICAL SURVEY Gordon P. Eaton, Director
Any use oi trade, product, or firm names is for descriptive purposes only and does not imply endorsement by the U.S. Government.
For additional information Copies of this report can be write to: purchased from:
District Chief USGS Branch of Information ServicesU.S. Geological Survey Box 25286975 West Third Avenue Denver, CO 80225Columbus, OH 43212-3192

CONTENTS
Abstract.................................................................................................................................................. 1Introduction........................................................................................................................................... 1
Purpose and Scope........................................................................................................................ 3Acknowledgments.......................................................................................................................... 3
Meteorology associated with the flood.................................................................................................. 3Antecedent conditions................................................................................................................... 3Storms of March 1-2, 1997 (By F. Julia Dian)............................................................................. 5
General description of the flood............................................................................................................ 5Areal distribution of flood............................................................................................................. 5Flood stages, streamflows, recurrence intervals, and high-water marks....................................... 8Flood damages (By Cynthia J. Crecelius)..................................................................................... 13
Effect of floods on public infrastructure............................................................................... 14Effect of floods on private property...................................................................................... 14
Historical perspective.................................................................................................................... 14Summary................................................................................................................................................ 21References cited..................................................................................................................................... 21
FIGURES
1. Map showing location of selected streamflow-gaging stations and corresponding recurrence-interval ranges for the March 1997 flood........................................................................ 2
2. Maps showing regionally averaged monthly total precipitation and percent of normal precipitation by National Weather Service Division, January and February 1997 ........................... 4
3. Map showing isolines of total accumulated precipitation for the 48-hour periodof March 1-2, 1997 ........................................................................................................................... 6
1. Photographs of:4. Ohio River floodwaters in Manchester, Ohio, March 7, 1997..................................................... 75. Ohio River floodwaters in New Richmond, Ohio, March 4, 1997.............................................. 76. Floodwaters of Ohio Brush Creek (Adams County, Ohio) splashing onto the
State Route 125 bridge during the morning of March 2, 1997, looking downstream to the south................................................................................................................................... 9
7. U.S. Geological Survey field crew making a streamflow measurement on the State Route 125 bridge over Ohio Brush Creek (Adams County, Ohio) during the afternoon of March 2, 1997, looking to the southeast................................................................. 9
8. Floodwaters of Raccoon Creek, prior to the peak streamflow, surrounding historic log cabins at The Bob Evans Farm in Adamsville, Ohio, March 2, 1997, looking to the northeast, flow direction from the left to right............................................................................ 12
9. The Wickline and Post Office log cabins being swept off their foundations by Raccoon Creek floodwaters at The Bob Evans Farm in Adamsville, Ohio, March 4, 1997, looking downstream to the southwest.......................................................................................... 12
Contents
10. White Oak Creek floodwaters piling up on the piers at the State Route 221 bridge nearGeorgetown, Ohio, March 2, 1997, looking to the northeast.................................................... 13
11. Flooding of the Ohio River at Cincinnati, Ohio, March 5, 1997, looking upstreamto the east................................................................................................................................. 11
TABLES
1. Peak stages and peak streamflows at selected U.S. Geological Survey streamflow-gaging stations in southern Ohio, March 1997.............................................................................................. 10
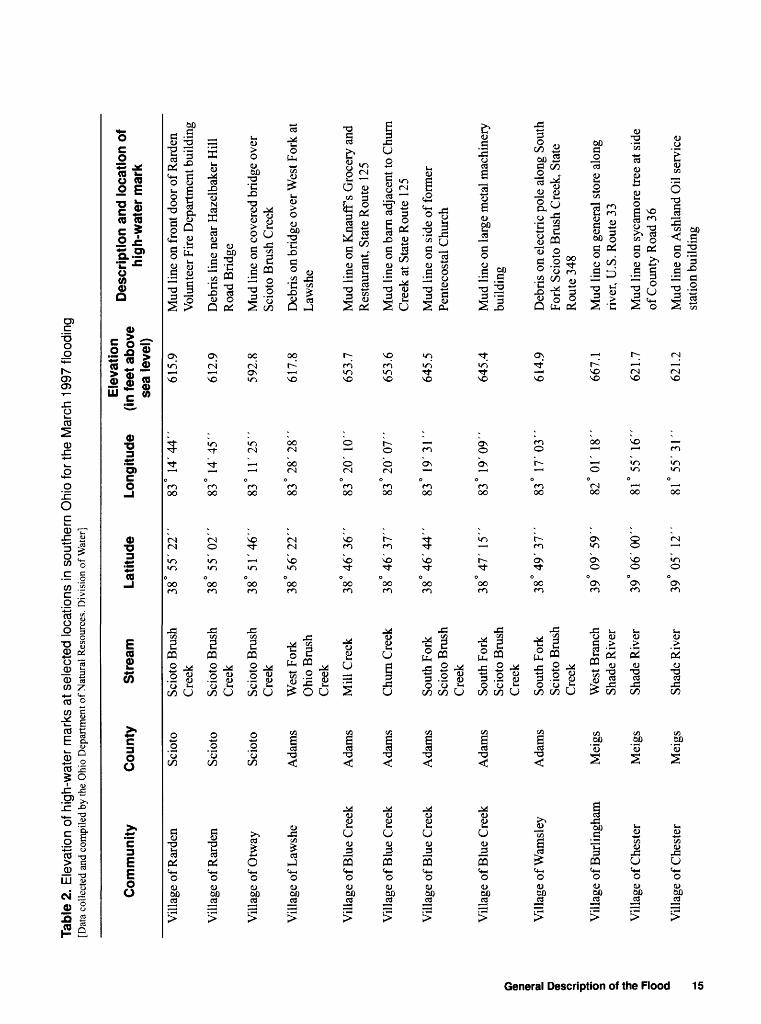
2. Elevation of high-water marks at selected locations in southern Ohio for the March 1997flooding.............................................................................................................................................. 15
3. Infrastructure-damage estimates related to the March 1997 flooding in southern Ohio.................... 174. Damages and (or) extreme flow conditions at publicly owned dams during the March 1997
flooding in southern Ohio.................................................................................................................. 185. Preliminary assessments of damage to residential structures related to the March 1997
flooding in southern Ohio.................................................................................................................. 196. Damages and (or) extreme flow conditions at privately owned dams during the March 1997
flooding in southern Ohio................................................................................................................... 20
CONVERSION FACTORS, ABBREVIATIONS, AND VERTICAL DATUM
Multiply By To obtain
foot (ft) 0.3048 meter
square mile (mi ) 2.590 square kilometer
cubic foot per second (ft3/s) 0.02832 cubic meter per second
Temperature is given in degrees Fahrenheit (F), which can be converted to degrees Celsius (C) by the following equation:
C = (F-32)/1.8
Sea level: In this report, "sea level" refers to the National Geodetic Vertical Datum of 1929 (NGVD of 1929}- a geodetic datum derived from a general adjustment of the first-order level nets of both the United States and Canada, formerly called Sea Level Datum of 1929.
IV Flood of March 1997 in southern Ohio
Flood of March 1997 in Southern Ohio
By K. Scott Jackson and Stephen A. Vivian
ABSTRACT
Rainfall amounts of up to 12 inches pro duced by thunderstorms during March 1 2, 1997, resulted in severe flooding throughout much of southern Ohio. Eighteen counties were declared Federal and State disaster areas. Cost estimates of damage in Ohio from the flooding are nearly $180 million. About 6,500 residences and more than 800 businesses were affected by flooding. Nearly 20,000 persons were evacuated, and 5 deaths were attributed to the flooding.
Record peak stage and streamflow were recorded at U.S. Geological Survey (USGS) streamflow-gaging stations on Ohio Brush Creek near West Union and Shade River near Chester. The peak streamflow at these two locations exceeded the estimate of the 100-year-recurrence- interval peak streamflow.
The recurrence intervals of peak stream- flow at selected USGS streamflow-gaging stations throughout southern Ohio ranged from less than 2 years to greater than 100 years. The most severe flooding in the State was generally confined to areas within 50 to 70 miles of the Ohio River. Many communities along the Ohio River experi enced the worst flooding in more than 30 years.
INTRODUCTION
Thunderstorms and heavy rains during March 1 2, 1997, in southern Ohio resulted in flooding that caused widespread damage to public and private prop erty. Preliminary cost estimates of the damage for Ohio communities as result of the March 1997 flooding total nearly $180 million (Ohio Governor's
Office of Budget and Management, oral commun., 1997).
Record peak stage and peak streamflow were recorded at two USGS streamflow-gaging stations, one on Ohio Brush Creek and the other on Shade River. The peak streamflow at each gaging station exceeded estimates of the 100-year-recurrence-inter val peak streamflow. The storms produced heavy rain fall in a band along the Ohio River stretching from western Kentucky to West Virginia, causing floods on many tributaries to the Ohio River. As these and other tributaries drained into the Ohio River, communities along the Ohio River experienced some of the most severe flooding in more than 30 years.
Some of the flooding resulted in tragic conse quences in Ohio. The Ohio State Highway Patrol attributed five deaths to the flooding: two in Adams County, and one each in Brown, Pike, and Gallia Counties (fig. 1). These individuals were swept into floodwaters while attempting to drive through flooded roadways (Baird and Dempsey, 1997). Areas of south ern Adams and Brown Counties received 10 12 inches of rain, which were the largest recorded accumulations during the March 1-2 storms in Ohio. Areas of Athens and Vinton Counties received about 6 inches of rainfall during the storm. Four inches or more of rain fell over most of the counties located along or near the southern border of Ohio. Eighteen counties were declared Federal and State disaster areas, which qualified them for Federal and State disaster assistance: Adams, Athens, Brown, Clermont, Gallia, Hamilton, Highland, Hocking, Jackson, Lawrence, Meigs, Monroe, Morgan, Pike, Ross, Scioto, Vinton, and Washington (fig. 1).
Although the March 1997 flood and the accom panying damages were covered by the news media and by bulletins and real-time data provided by the U.S. Geological Survey (USGS) Internet sites, there was a
Introduction 1

, - MICHIGAN^ _ L _ _ _ _zro|^oLUCAS
WILLIAMS 'If FULTON I 4>
I
FAIRFIELD
1A 03157000
3i575oa:MORGHOCKING
ayton 03241500GREENE
(Cincinnati 0325500Q£ HIGHLAND .^ » 03159540Chester
3237500
Portsmouth GALUALAWRENCE
EXPLANATION
ESTIMATED RECURRENCE-INTERVAL RANGE AT SELECTED GAGING STATIONS FOR MARCH 1997 PEAK STREAMFLOW-Eight-digit number is station number
if Less than 2
2 to 5
10 to 25
+ 25 to 50
A Greater than 100
10 20 I
30 40 MILES
I____II I I I
0 10 20 30 40 KILOMETERS
Figure 1. Selected stream!low-gaging stations and corresponding recurrence-interval ranges for the March 1997 flood.
Flood off March 1997 in Southern Ohio

need to document the southern Ohio flood and subse quent hydrologic analyses in one publication. Hence, the USGS, in close collaboration with the Ohio Department of Natural Resources (ODNR), began to work in March 1997 to synthesize information on the flood into a single publication.
Purpose and Scope
This report describes the flooding in southern Ohio in early March 1997. The meteorologic factors related to the storm are presented. A general descrip tion of the flooding, including specific hydrologic information based on data from USGS streamflow gages in the area, is provided. Flood-damage estimates are documented, and a historical perspective of flood ing in the area is included.
Acknowledgments
The authors thank F. Julia Dian of the National Weather Service, Wilmington, Ohio, for her coopera tion in providing meteorologic data about the storms and for writing the section of the report "Storms of March 1-2, 1997." The authors also thank Cynthia J. Crecelius of the ODNR, Division of Water, Columbus, Ohio, for compiling flood-damage esti mates for the March 1997 floods and writing the sec tion of the report on "Flood Damages." Also appreciated are the efforts of David H. Cashell for coordinating the ODNR contributions to this report.
METEOROLOGY ASSOCIATED WITH THE FLOOD
The storms of March 1-2, 1997, that affected southern Ohio occurred after a period when precipita tion in the area had ranged from 12 to 33 percent below normal 1 during the months of January and February (Cashell, 1997a, b). The floods from the March 1 2 storm may have been even more severe had antecedent precipitation in southern Ohio been closer to normal (if conditions had been wetter).
Antecedent Conditions
January 1997. Precipitation in southern Ohio during January was generally below normal. The National Weather Service (NWS) Divisions2 along Ohio's southern boundary, the Southwest, South Cen tral, and Southeast, received 84, 75, and 88 percent of the normal precipitation for the month, respectively (fig. 2) (Cashell, 1997a). Temperatures were high enough during January that precipitation was typically in the form of rain. In southern Ohio, the first 3 weeks of January were relatively dry, with only intermittent trace amounts of precipitation. The latter part of the month was much wetter and most areas in southern Ohio received about 1 2 inches of precipitation during this period. During the month, parts of the Southwest and South Central Divisions received about 3 inches of precipitation. The Shawnee State Forest in Scioto County received the most precipitation (4.67 inches) of any location in Ohio during January.
February 1997. Precipitation in southern Ohio during February was below normal, with rain being the dominant form. The NWS Southwest, South Cen tral, and Southeast Divisions received 78, 67, and 67 percent of normal precipitation, respectively (fig. 2), (Cashell, 1997b). The greatest accumulations of pre cipitation in southern Ohio during the month was on February 4 5; typical total accumulations were 0.5 to 1 inch in most areas and some locations received nearly 1.5 inches. The following 3 weeks of February were generally dry, although light precipitation fell on many days. On February 27, areas of southern Ohio received rainfall totaling about 0.25 inch. Light snow cover of 1 2 inches was reported in some areas of southern Ohio during the middle of the month. How ever, daily high temperatures for the latter half of February in these areas generally were well above freezing (40° to 60° Fahrenheit) and most snow cover had melted.
'Normal refers to the average value for the period 1931 80 in National Oceanic and Atmospheric Administration (1981).
A NWS Division is defined as an area within Ohio that has similar climatological characteristics. The NWS calculates Divi sion averages using data from stations that record both temperature and precipitation.
Meteorlogy Associated With the Flood 3

JANUARY 1997
EXPLANATION
2.28 AVERAGE IN INCHES 105 PERCENT OF NORMAL
FEBRUARY 1997
84<
40°-
Alters project
0 10 20 30 40 MILES
I .'..'.' 'i i n i0 10 20 30 40 KILOMETERS
Figure 2. Regionally averaged monthly total precipitation and percent of normal precipitation by National Weather Service Division, January and February 1997 (from Cashell, 1997a,b).
4 Flood of March 1997 in Southern Ohio

Storms of March 1-2,1997
By F. Julia Dian3
During the evening of February 28, 1997, a low- pressure center was established over the Upper Midwest region of the United States, with a stationary front extend ing southeast from the low to the Tennessee- Kentucky border. A cold front extended south from the low into Texas. The stationary front remained near this position until just after midnight on March 1, when it began to move north towards the Ohio River.
The former stationary front moved north as a warm front and slowed (nearly stalling) over central Ohio by the afternoon of March 1. Although the warm front moved out of the southern Ohio/northern Kentucky area, several boundaries of unstable air remained over northern Ken tucky. As typically happens with a surface low-pressure and frontal system with these characteristics, warm, mois ture-laden southerly air was pumped into the "warm sec tor" (the region ahead of the cold front and south of the warm front) from the Gulf of Mexico. This warm and moist air interacted with the boundaries of unstable air and triggered thunderstorms.
What caused these storms to produce such heavy rains was that the frontal system slowed dramatically and strong, persistent southerly winds continued to pump warm air into northern Kentucky and southern Ohio, sus taining the thunderstorms. The extremely slow movement of the cold front kept the thunderstorms over the Ohio Valley for nearly 36 hours. If the cold front had moved faster, it would have pushed the thunderstorms more quickly to the east, and rainfall amounts would have been much less.
What resulted on March 1-2, 1997, was a broad area of thunderstorms that produced as much as nearly 12 inches of rain in some areas of southern Ohio. The 48- hour total rainfall for this storm is shown in figure 3. The storm produced rainfall over the southern half of the State, the heaviest rain being concentrated to the south and east of a line generally extending from Cincinnati to Bellaire, Ohio.
GENERAL DESCRIPTION OF THE FLOOD
The water levels in many streams in southern Ohio rose rapidly in response to the heavy rainfall. At the USGS strcamflow-gaging station on Ohio Brush Creek near West Union (03237500)4 in Adams County, the water
level rose nearly 19 feet in 12 hours. The water level in the Ohio River was also observed to rise rapidly as a result of the storms; such a rise is generally uncommon in a large river. The USGS gaging station on the Ohio River at Portsmouth, Kentucky (03217200, across the river from Portsmouth, Ohio), recorded a water-level increase of about 14.3 feet during a 12-hour period. The gaging sta tion on the Ohio River at Cincinnati (03255000) recorded a water-level rise of about 10.6 feet in a 12-hour period.
A factor contributing to the rapid rise of the Ohio River is that the heaviest rainfall during the March 1 2, 1997, storms was concentrated in a relatively narrow band along the Ohio River. Thus, a large amount the runoff pro duced by the storms was downstream from most of the U.S. Army Corps of Engineers flood-control reservoirs on major tributaries to the Ohio River.
Areal Distribution of the Flood
Severe flooding within Ohio was generally con fined to stream reaches within 50 to 70 miles of the Ohio River. The most severe flooding in Ohio was in Adams, Brown, Gallia, Meigs, Lawrence, and Scioto Counties. Less severe flooding occurred in counties farther north, away from the Ohio River. Floodwaters draining from southern Ohio watersheds and from basins in Kentucky and West Virginia also produced flooding along the Ohio River. Ohio communities that border the Ohio River from Marietta downstream to Cincinnati were affected by floodwaters. Two communities along the Ohio River that were particularly hard hit by the flooding were Manches ter and New Richmond, Ohio (figs. 4 and 5).
Communities along the Ohio River in Kentucky, Indiana, and Illinois also experienced flooding as a result of the March 1997 storms. In Kentucky, the worst flooding was generally located within a 40- to 50-mile-wide band running approximately parallel to and south of the Ohio River (Kevin J. Ruhl, U.S. Geological Survey, written commun., April 1997). The city of Falmouth, Ky., at the confluence of the South Fork and main stem of the Lick ing River, was devastated by floodwaters; hundreds were left homeless and four deaths were attributed to the flood ing (Kevin J. Ruhl, U.S. Geological Survey, written com mun., April 1997).
National Weather Service, Wilmington, Ohio
USGS streamflow-gaging stations are assigned station num bers on the basis of a downstream-order system in which the order of listing is in a downstream direction along the main stream.
General Description of the Flood 5

84°
_ MICHIGAN, _ L __ - -
LUCAS WILLIAMS FULTON ,'
I DEFIANCE I HENRY wooo SANDUSKY
'Cleveland GEAUGA
CUYAHOGA
Data from National Weather Service, 1997
2
EXPLANATION
LINE OF EQUAL PRECIPITATION-lnterval, in inches, is variable
10I
20 30 40 MILES
I I II I I I I
0 10 20 30 40 KILOMETERS
Figure 3. Isolines of total accumulated precipitation for the 48-hour period of March 1-2, 1997.
6 Flood of March 1997 in Southern Ohio

Figure 4. Ohio River floodwaters in Manchester, Ohio, March 7, 1997.Columbus Dispatch/Eric Albrecht
(reproduction with permission)
Figure 5. Ohio River floodwaters in New Richmond, Ohio, March 4,1997.
Jamie Sabau (reproduced with permission)
General Description of the Flood 7

Flood Stages, Streamflows, Recurrence Intervals, and High-Water Marks
Peak-stage and peak-streamflow data from the March 1997 flooding are listed in table 1 for selected USGS streamflow-gaging stations in southern Ohio. Also listed for each gaging station are the record peak stage and peak streamflow prior to the March 1997 flooding, and the estimate of the 100-year-recurrence- interval peak streamflow. The 100-year peak stream- flow is the instantaneous peak streamflow with a 1 per cent chance of being equaled or exceeded in any given year. Estimates of the 100-year peak streamflow in table 1 (unless otherwise noted) were obtained from the most recently published USGS report for estimat ing flood-peak Streamflows (Koltun and Roberts, 1990), which is based on data collected through water year5 1987.
Ranges of recurrence intervals that bracket the estimated recurrence interval associated with the peak streamflow are included in table 1 to provide an indi cation of the relative magnitude of the March 1997 flooding at each of the gaging stations. The location and corresponding recurrence-interval range for the streamflow-gaging stations listed in table 1 are shown on figure 1.
Peak Streamflows for the March 1997 flood at the streamflow-gaging stations were determined by use of standard USGS techniques (Rantz and others, 1982). USGS personnel were able to obtain direct measurements of the streamflow at most of the gaging stations in southern Ohio during the March 1997 flood. At one gaging station, an indirect determination of the peak streamflow was made by use of the slope- area method (Benson and Dalrymple, 1967; Dalrymple and Benson, 1967).
Record peak stage and peak streamflow occurred during the March 1997 floods at two stream- flow-gaging stations:
Ohio Brush Creek near West Union (03237500, Adams County) The peak streamflow and corresponding stage at the USGS gaging station on Ohio Brush Creek near West Union, Ohio, were the highest recorded since the gaging station was estab lished (in water year 1927). The March 1997 peak
5 A water year is the 12-month period from October 1 through September 30 and is designated by the calendar year in which it ends.
streamflow of 77,700 ft3/s was greater than the esti mated 100-year peak-streamflow value and, therefore, is considered to have been greater than a 100-year flood.
On Sunday morning, March 2, 1997, the water level was high enough that highway officials closed the State Route 125 bridge over Ohio Brush Creek (about 6 miles east of West Union) because of con cerns about the structural integrity of the bridge (fig. 6). By the afternoon, the water level had dropped, and officials reopened the highway. USGS field per sonnel were able to obtain a direct measurement of the streamflow from the State Route 125 bridge (fig. 7).
Shade River near Chester (03159540, Meigs County) The peak stage and peak streamflow for the March 1997 flood were the highest recorded since the gaging station was established (in water year 1966). The March 1997 peak streamflow of 15,600 ft3/s exceeded the estimated 100-year peak- streamflow value and, therefore, is considered to have been greater than the 100-year flood.
During the March 1997 flood on the Shade River, all roads leading to the gaging station were inundated, and no direct measurement of streamflow could be made. Therefore, the slope-area indirect method of peak-streamflow determination (Benson and Dalrymple, 1967; Dalrymple and Benson, 1967) was used to determine the peak streamflow at this gag ing station. The indirect measurement site was approx imately 4,100 feet upstream from the gaging station.
Major flooding occurred at other streams in southern Ohio. Selected locations are discussed in the following paragraphs:
Raccoon Creek at Adamsville (03202000, Gallia County) The March 1997 peak streamflow of 16,500 ft3/s on Raccoon Creek at the USGS stream- flow-gaging station was the largest streamflow since May 1968. The recurrence interval corresponding to the March 1997 peak streamflow is estimated to be greater than 25 years but less than 50 years. Historic log cabins at the recreated 1800's village along the bank of Raccoon Creek at The Bob Evans Farms prop erty in Adamsville were damaged by the floodwaters (figs. 8 and 9).
White Oak Creek near Georgetown (03238500, Brown County) The March 1997 streamflow of 17,900 ft3/s at the USGS streamflow- gaging station White Oak Creek near Georgetown (fig. 10) was the largest streamflow since July 1980 (19,500 ft3/s). The March 1997 flood was the second largest streamflow
8 Flood of March 1997 in Southern Ohio

AP/WIDE WORLD PHOTOS (reproduced with permission)
Figure 6. Floodwater of Ohio Brush Creek (Adams County, Ohio) splashing onto theState Route 125 bridge during the morning of March 2,1997, looking downstream to the south.
Figure 7. U.S. Geological field crew making a streamflow measurement on the State Route 125 bridge over Ohio Brush Creek (Adams County, Ohio) during the afternoon of March 2, 1997, looking to the southeast.
General Description of the Flood 9

Tabl
e 1.
Pea
k st
ages
and
pea
k st
ream
flow
s at
sel
ecte
d U
.S.
Gel
ogic
al S
urve
y st
ream
flow
-gag
ing
stat
ions
in s
outh
ern
Ohi
o,
Mar
ch 1
997.
3 1 a f s 5' I 1 O 31 0
[Abb
revi
atio
ns; m
i2, s
quar
e m
iles;
ft'/s
, cub
ic f
eet p
er s
econ
d; --
,
Stat
ion
nam
e an
d nu
mbe
r
Capt
ina
Cree
k at
Arm
stro
ng M
ills
(031
1400
0)
Cle
ar C
reek
near
Roc
kbrid
ge(0
3157
000)
Hoc
king
Riv
erat
Ent
erpr
ise
(031
5750
0)
Hoc
king
Riv
erat
Ath
ens
(031
5950
0)
Shad
e R
iver
near
Che
ster
(031
5954
0)
Rac
coon
Cre
ekat
Ada
msv
ille
(032
0200
0)
Ohi
o B
rush
Cre
ekne
ar W
est U
nion
(032
3750
0)
Whi
te O
ak C
reek
near
Geo
rget
own
(032
3850
0)
Littl
e M
iam
iR
iver
near
Old
tow
n(0
3240
000)
Dra
inag
e ar
ea
(ml2
)
134
89.0
459
943
156
595
387
218
129
Perio
d of
hist
oric
al a
nd
syst
emat
ic
reco
rd
(wat
er y
ears
)1
1927
-35
1959
-cu
rren
t
1940
-cu
rren
t
1907
1932
-cur
rent
1907
1916
-cu
rren
t
1966
-cu
rren
t
1916
-352
1937
219
39-8
5219
39 -
curr
ent
1927
-35
1941
-cu
rren
t
1924
-35
1940
-cur
rent
1 953
- cu
rrent
not a
vaila
ble;
<, l
ess
than
; >, g
reat
er th
an.
Sour
ce:
Rec
urre
nce-
inte
rval
dat
a fr
om K
oltu
n an
d R
ober
ts (
1990
) un
less
oth
erw
ise
note
d]
Peak
val
ues
for p
erio
d of
rec
ord
prio
r to
Peak
val
ues
for M
arch
199
7 M
arch
199
7
Stag
e D
ate
(fee
t abo
vega
ge d
atum
)
08/1
1/80
17
.48
07/2
2/48
17
.68
03/-
/07
22.0
0
03/-
/07
27.0
0
05/2
5/68
27
.39
05/2
8/68
2 2S
.692
03/1
0/64
27
.91
03/1
0/64
14
.64
01/2
1/59
12
.20
Stre
amflo
w
Stag
e St
ream
flow
(ft
3/s)
(fee
t abo
ve
(ft3/S
)ga
ge d
atum
)
21,9
00
10.5
1 7,
160
16,0
00
10.2
2 3,
590
36,0
00
15.1
4 9,
060
50,0
00
22.4
6 17
,400
8,17
0 31
.38
15,6
00
20,0
002
29.1
1 16
,500
59,2
00
31.1
5 77
,700
22,4
00
9.32
17
,900
14,8
00
5.25
1,
220
Estim
ated
1 00-
year
pe
ak
Stre
amflo
w
(ft3/s
)
20,0
00
10,7
00
31,8
00
42,0
00
8,83
0
19,6
00
55,5
00
24,5
00
16,0
00
Estim
ated
recu
rren
ce-
inte
rval
ran
ge
for M
arch
199
7 pe
ak S
tream
flow
(y
ears
)
2-5
2-5
2-5
2-5
>100
25-5
0
>IOO
10-2
5
<2

g
0cCD_c «
oo)cC/}co
§toCD"6>to9>
^D
toCD « w>,CD£3
CO"rd o'en
O o CDoC/D=>T3CDOCDCD (/>
nj
g_g
toCDi_ « (/}.*nj CDQ."S-o
CO CD<"cCD.Ecn-p to k * ' * '«<?CO-I<u£;°:S
® 0-° rt£s
T3H oc
K1-E
0
a!
1
Oo^ o^
c-Io
at,T3crt
|q ^
|i 31Bc
ip3
1
0 C/3
1b
c3 U50
f\
Caj:
5 ^>V'
<L)
i
'1
rt
0
r a0
K
8. «> JJuIS3
WlJJ
a>
:viations; mi2 , squar
.0JD<^
Ti^ilCD u E T- p <->
!l-«is|ir?|^i- Sspio^
-Sg.
'- S
|lis|«|§&l£ 2- «
t^ S
1CO
^sen0)
1.K CO
ffQ.
s.0
Q. oO
IsT3?2.e o> ifQ. CO
.O
0)
§
5j«CO»Q.
«?E «citS E-tn
§?a, o 3gsstn q> «ll?"*** " O)
1e «« «:£ £ w
§"§
o>oBM*40 9 ST.3i o>*&
I
__ c o «r0 « S -o conil!HI£ |
2 ,*.
8> g S<^.Ecc co co £,Q
ECO 0) i.
II 1 =
8<n
«nr^ ^
V o
0 t
\o 8oo r-T
\or~
S 1«n«NSO
OO
TJ- -*.^ s
88 §ro M 0
£ oo
«r> «r> _CN «N P
-'- §
Os ro r~ vi \O ro
vB CN O «N i r«1 O O O
1 S !C§ ro «N r~ ^ o r-~ . ro TJ- -7 r- ' oo oo oo
R - g -- So^
oCN 00 M "1.\o \o r-~
J^ <D ._
^ 1 8 £ 1 8 u T; «r> -3 c ouj 0 ' O5 "o «^> 0 .0 * o C «^
ls| |o|S ta rt
o
o
oIc
.c
>,ro <~-i"^3 '?g e
-Si w-5C3 000 -,<u <*_ £ °tr C3 ^ 1 a rt
11II-S "° rt - j= "c 'I
o E ^ Sb fi 1 1IDii «CX <U o rg
oo g a-.1-£, £J " rtT: g<L» '
^ §
0 « ° to
| % tfc toT-J Cflo M
"C %& l
J3 g C rt O O? s .- -* J59^2
1A water year is tl 2 Prior to July 8, 1 5 From Hannum (
General Description of the Flood 11

Figure 8. Floodwaters of Raccoon Creek, prior to the peak streamflow, surrounding historic log cabins at The Bob Evans Farm in Adamsville, Ohio, March 2, 1997, looking to the northeast, flow direction from the left to right.
Figure 9. The Wickline and Post Office log cabins being swept off their foundations by Racoon Creek floodwaters at The Bob Evans Farm in Adamsville, Ohio, March 4,1997, looking downstream to the southwest.
12 Flood of March 1997 in Southern Ohio

Figure 10. White Oak Creek floodwaters piling up on the piers at the State Route 221 bridge near Georgetown, Ohio, March 2,1997, looking to the northeast.
recorded at this location since the peak streamflow of 22,400 ft' /s in March 1964. The recurrence interval for the March 1997 peak streamflow is estimated to be greater than 10 years but less than 25 years.
Ohio River at Cincinnati (03255000, Hamil ton County) The March 1997 peak streamflow of 625,000 ft3/s was the largest streamflow at the Ohio River at Cincinnati USGS streamflow-gaging station since March 1964. The recurrence interval corre sponding to the March 1997 peak streamflow is esti mated to be greater than 10 years but less than 25 years. Many low-lying areas along the Ohio River in the Cincinnati area the most densely populated part of southern Ohio were inundated during the March 1997 flood (fig. 11).
Shortly after the floodwaters receded in south ern Ohio, personnel from the Ohio Department of Nat ural Resources, Division of Water obtained high-water marks for selected streams. The high-water marks were initially identified and flagged in the field, and third-order-accuracy surveys were made at a later date to determine elevations of the high-water marks. These data (table 2) were collected to document water- surface elevations along various streams.
Flood Damages
By Cynthia J. Crecelius6
The human impact of the March 1997 flooding in southern Ohio was appreciable. Nearly 20,000 people were evacuated during the flooding, and 5 people lost their lives. The fatalities were in Adams, Brown, Pike, and Gallia Counties. The Ohio Emer gency Management Agency (OEMA) reported that 93 roads were closed as a result of the flooding on March 2, 1997. OEMA estimated that on March 5, 1997, 1200 residents of southern Ohio were without natural gas, 2032 were without electricity, and 1785 were without telephone service. OEMA also reported that 37 boil-water advisories were in effect for various southern Ohio communities, owing to potential contamination of water supplies by floodwaters on March 6, 1997.
Preliminary estimates prepared by the Ohio Governor's Office of Budget and Management indi cate that the economic impact of the March 1997 flood
1 Ohio Department of Natural Resources, Columbus, Ohio.
General Description of the Flood 13

The Cincinnati Enquirer/ Ernest Cplernan (reproduced with permission)
Figure 11. Flooding of the Ohio River at Cincinnati, Ohio, March 5,1997, looking upstream to the east.
on Ohio communities may approach $ 180 million. The following breakdown of the estimates (based upon information from the Ohio Emergency Manage ment Agency, May 1997) supports this determination: Individual Assistance, $12 million, Public Assistance, $45 million; Small Business Administration Loans (Businesses, Homes, Churches), $98 million; Agricul ture, $8 million; Mitigation, $12 million; and State- agency expenditures, $5 million.
The effects of the March 1997 flooding on residential structures are summarized in table 5; in all, more than 6,500 residences were damaged. The Small Business Administration's preliminary estimates indicate that about 833 business/commercial structures incurred damage during the floods in southern Ohio (Ohio Emergency Management Agency, written commun., May 1997). In addition, many privately owned dams were damaged (table 6).
Effect of Floods on Public Infrastructure
The March 1997 flood resulted in about $42 million damage to public infrastructure (such as roads, bridges, water-control facilities, public buildings, pub lic utilities, and parks and recreation facilities) in southern Ohio. Infrastructure damage by county and State agency is summarized in table 3. Additionally, several publicly owned and maintained dams were damaged as a result of the flooding in the area (table 4).
Effect of Floods on Private Property
Many residences and businesses in southern Ohio also were affected during the March 1997 floods.
Historical Perspective
Floods on the Ohio River and its tributaries within Ohio are not uncommon. Most of the major flooding in the past on the Shade River, Raccoon Creek, and Ohio Brush Creek has been part of wide spread flooding and has generally coincided with floods on the Ohio River. Damage that resulted from the March 1997 flood was mainly in towns along the Ohio River and, to a lesser extent, to dwellings that were in the flood plain of the smaller tributaries. Although hydrologically significant, past floods of the Shade River, Raccoon Creek, and Ohio Brush Creek have not produced as much damage as compared to
14 Flood of March 1997 in Southern Ohio
Tabl
e 2.
Ele
vatio
n of
hig
h-w
ater
mar
ks a
t sel
ecte
d lo
catio
ns in
sou
ther
n O
hio
for t
he M
arch
199
7 flo
odin
g[D
ata
colle
cted
and
com
pile
d by
the
Ohi
o D
epar
tmen
t of N
atur
al R
esou
rces
. D
ivis
ion
of W
ater
]
General Descri a o a 1 o"
o Q.
Com
mun
ity
Vill
age
of R
arde
n
Vill
age
of R
arde
n
Vill
age
of O
tway
Vill
age
of L
awsh
e
Vill
age
of B
lue
Cre
ek
Vill
age
of B
lue
Cre
ek
Vill
age
of B
lue
Cre
ek
Vill
age
of B
lue
Cre
ek
Vill
age
of W
amsl
ey
Vill
age
of B
urlin
gham
Vill
age
of C
hest
er
Vill
age
of C
hest
er
Cou
nty
Scio
to
Scio
to
Scio
to
Ada
ms
Ada
ms
Ada
ms
Ada
ms
Ada
ms
Ada
ms
Mei
gs
Mei
gs
Mei
gs
Stre
am
Scio
to B
rush
Cre
ek
Scio
to B
rush
Cre
ek
Scio
to B
rush
Cre
ek
Wes
t For
kO
hio
Bru
shC
reek
Mill
Cre
ek
Chu
rn C
reek
Sout
h Fo
rkSc
ioto
Bru
shC
reek
Sout
h Fo
rkSc
ioto
Bru
sh
Cre
ek
Sout
h Fo
rk
Scio
to B
rush
C
reek
Wes
t Bra
nch
Shad
e R
iver
Shad
e R
iver
Shad
e R
iver
Lat
itude
L
ongi
tude
(
38°
55' 2
2"
83°
14' 4
4"
38°
55' 0
2"
83°
14' 4
5"
38
°51
'46
" 83°1
1'2
5"
38°
56' 2
2"
83°
28' 2
8"
38°
46' 3
6"
83°
20'
10"
38°
46' 3
7"
83°
20' 0
7"
38°
46' 4
4"
83°
19' 3
1"
38°
47'
15"
83°1
9'0
9"
38°
49' 3
7"
83°
17' 0
3"
39°
09' 5
9"
82°
01'
18"
39°
06' 0
0"
81°
55'
16"
39°
05'
12"
81
°55
'31
"
inEf
e7taa
bov(
615.
9
612.
9
592.
8
617.
8
653.
7
653.
6
645.
5
645.
4
614.
9
667.
1
621.
7
621.
2
"-s
ssis
r01M
ud li
ne o
n fr
ont d
oor o
f Rar
den
Vol
unte
er F
ire
Dep
artm
ent b
uild
ing
Deb
ris
line
near
Haz
elba
ker H
illR
oad
Bri
dge
Mud
line
on
cove
red
brid
ge o
ver
Scio
to B
rush
Cre
ek
Deb
ris
on b
ridg
e ov
er W
est F
ork
atL
awsh
e
Mud
line
on
Kna
uff s
Gro
cery
and
Res
taur
ant,
Stat
e R
oute
125
Mud
line
on
bam
adj
acen
t to
Chu
mC
reek
at S
tate
Rou
te 1
25
Mud
line
on
side
of f
orm
erPe
ntec
osta
l Chu
rch
Mud
line
on
larg
e m
etal
mac
hine
rybu
ildin
g
Deb
ris
on e
lect
ric
pole
alo
ng S
outh
Fo
rk S
ciot
o B
rush
Cre
ek,
Stat
e R
oute
348
Mud
line
on
gene
ral s
tore
alo
ng
river
, U.S
. Rou
te 3
3
Mud
line
on
syca
mor
e tr
ee a
t sid
eof
Cou
nty
Roa
d 3 6
Mud
line
on
Ash
land
Oil
serv
ice
stat
ion
build
ing

Tabl
e 2.
Ele
vatio
n of
hig
h-w
ater
mar
ks a
t sel
ecte
d lo
catio
ns in
sou
ther
n O
hio
for t
he M
arch
199
7 flo
odin
g C
ontin
ued
[Dat
a co
llect
ed a
nd c
ompi
led
by th
e O
hio
Dep
artm
ent
of N
atur
al R
esou
rces
. D
ivis
ion
of W
ater
]
I £ 0) o 3-
tD 5 3 £ £ I 3 §
o
Com
mun
ity
Vill
age
of L
angs
ville
Vill
age
of L
angs
ville
Vill
age
of R
utla
nd
Vill
age
of R
utla
nd
Vill
age
of R
utla
nd
Vill
age
of R
utla
nd
Vill
age
of V
into
n
Vill
age
of V
into
n
Vill
age
of V
into
n
Vill
age
of V
into
n
Vill
age
of V
into
n
Cou
nty
Mei
gs
Mei
gs
Mei
gs
Mei
gs
Mei
gs
Mei
gs
Gal
lia
Gal
lia
Gal
lia
Gal
lia
Gal
lia
Stre
am
Lea
ding
Cre
ek
Lea
ding
Cre
ek
Litt
le L
eadi
ng
Cre
ek
Litt
le L
eadi
ng
Cre
ek
Litt
le L
eadi
ng
Cre
ek
Litt
le L
eadi
ng
Cre
ek
Rac
coon
Cre
ek
Rac
coon
Cre
ek
Rac
coon
Cre
ek
Rac
coon
Cre
ek
Rac
coon
Cre
ek
Lat
itude
39°
02' 4
4"
39°
02 '5
0"
39°
02' 2
0"
39°
02' 0
8"
39°
02' 2
6"
39°
02' 4
3"
38°
58' 4
4"
38°
58' 3
4"
38°
58' 3
1"
38°
58' 3
5"
38°
58' 3
4"
Lon
gitu
de
82°
11'
10"
82°
10' 5
3"
82°
07' 4
7"
82°
07 '4
4"
82°
07' 5
0"
82°
07' 4
9"
82°
20'
18"
82°
20'
19"
82°
20' 2
7"
82°
20' 2
8"
82°
20' 3
5"
Ele
vatio
n (in
fee
t abo
ve
sea
leve
l)
549.
2
546.
3
577.
1
576.
2
577.
2
581.
1
612.
2
612.
0
611.
5
612.
2
611.
5
Des
crip
tion
and
loca
tion
of
high
-wat
er m
ark
Mud
line
in
the
By-
the-
Way
Sto
re a
t w
est e
nd o
f vill
age
Mud
lin
e on
wel
com
e si
gn a
t eas
t end
of
vill
age
Mud
line
on
Joe'
s C
ount
ry M
arke
t
Mud
line
on
side
of h
ouse
alo
ng R
ut
land
Roa
d
Mud
lin
e on
off
ice
door
of U
niro
yal
busi
ness
alo
ng M
ain
Stre
et
Mud
lin
e on
sto
refr
ont a
t in
ters
ectio
n of
Mai
n St
reet
and
Sal
emSt
reet
Mud
line
on
side
pan
el o
f pic
nic
shel
ter
in p
ark
Mud
line
on
fron
t doo
r of
Col
ony
Vid
eo s
tore
alo
ng S
tate
Rou
te 1
60
Mud
line
on
side
of f
orm
er c
hurc
h at
co
rner
of C
lay
& C
herr
y St
reet
s
Post
mas
ter's
hig
h-w
ater
obs
erva
tion
at
base
of f
lagp
ole
Mud
line
on
side
of h
ouse
alo
ng
Jack
son
Stre
et

Tabl
e 3.
Inf
rast
ruct
ure-
dam
age
estim
ates
rel
ated
to th
e M
arch
199
7 flo
odin
g in
sou
ther
n O
hio
[All
figur
es in
dol
lars
; D
amag
e es
timat
es p
rovi
ded
by t
he O
hio
Em
erge
ncy
Man
agem
ent
Age
ncy,
Dep
artm
ent o
f Pu
blic
Saf
ety.
A
bbre
viat
ions
: O
DO
T, O
hio
Dep
artm
ent o
f Tra
nspo
rtat
ion;
OD
NR
, Ohi
o D
epar
tmen
t of N
atur
al R
esou
rces
; ON
G, O
hio
Nat
iona
l Gua
rd]
$ 1 §' 0 1 1 TJ
§
^
Cou
nty
or
Stat
e of
Ohi
o A
genc
y
Ada
ms
Ath
ens
Bro
wn
Cle
rmon
t
Gal
lia
Ham
ilton
Hig
hlan
d
Hoc
king
Jack
son
Law
renc
e
Mei
gs
Mon
roe
Mor
gan
Pike
Ros
s
Scio
to
Vin
ton
Was
hing
ton
OD
OT
OD
NR
ON
G
Tot
al d
olla
rs
Deb
ris
rem
oval
1,00
0,00
0
50,0
00
134,
000
205,
000
50,0
00
274,
000
41,5
00
42,0
00
40,0
00
43,0
00
10,0
00
36,0
00
11,2
00
77,7
00
32,3
00
450,
000
40,0
00 0
1,05
0,00
0 0 0
3,58
6,00
0
Em
erge
ncy
prot
ectit
ve
mea
sure
s 0 0
124,
000
45,0
00
40,0
00
85,0
00
5,00
0 0
20,0
00
72,0
00
16,0
00 0 0
70,0
00
30,4
00
57,0
00
8,00
0 0 0 0
3,00
0,00
0
3,57
2,40
0
Roa
ds a
nd
brid
ges
10,0
00,0
00
500,
000
2,09
5,00
0
1,63
0,00
0
1,05
0,00
0
1,90
0,00
0
55,0
00
568,
000
400,
000
2,30
0,00
0
2,30
0,00
0
1,20
0,00
0
55,4
00
418,
200
128,
000
1,83
2,00
0
960,
000
797,
000
165,
000
350,
000 0
28,7
03,6
00
Wat
er-
cont
rol
faci
litie
s
0 0 0 0 0 0 0
2,00
0 0
5,00
0 0
31,0
00 0 0 0 0 0 0 0
10,0
00 0
48,0
00
Publ
ic b
uild
ings
, fa
cilit
ies,
eq
uipm
ent
0 0
57,0
00
60,0
00 0
230,
000
2,00
0 0
360,
000
38,0
00
30,0
00
20,0
00 0
2,50
0 0 0
20,0
00
6,00
0 0
35,0
00 0
860,
500
Publ
ic
utili
ties
1,00
0,00
0 0
487,
000
375,
000
10,0
00
80,0
00
4,00
0
1,20
0
900,
000 0
100,
000
50,0
00 0
18,0
00
15,0
00
476,
000 0
85,0
00 0
3,00
0 0
3,60
4,20
0
Park
s an
d re
crea
tion 0 0
75,0
00 0
15,0
00
73,0
00
8,50
0 0
780,
000 0 0 0 0 0 0
25,0
00
15,0
00
1,00
0 0
965,
000 0
1,95
7,50
0
Tota
l do
llars
12,0
00,0
00
550,
000
2,97
2,00
0
2,31
5,00
0
1,16
5,00
0
2,64
2,00
0
116,
000
613,
200
2,50
0,00
0
2,45
8,00
0
2,45
6,00
0
1,33
7,00
0
66,6
00
586,
400
205,
700
2,84
0,00
0
1,04
3,00
0
889,
000
1,21
5,00
0
1,36
3,00
0
3,00
0,00
0
42,3
32,9
00

Table 4. Damages and (or) extreme flow conditions at publicly owned dams during the March 1997 flooding in southern Ohio[Data complied by the Ohio Department of Natural Resources, Division of Water]
Name County Latitude Longitude Comments
Lake White Dam
Pike Lake Dam
Stewart Lake Dam
Roosevelt Lake Dam
Turkey Creek Lake Dam
Bear Creek Lake Dam
Pond Lick Lake Dam
Lake Alma Dam
Pike
Pike
Ross
Scioto
Scioto
Scioto
Scioto
Vinton
39° 06 '24"
39° 09' 34"
39° I3'03"
38° 43' 33"
38° 44' 00"
38° 46' 52"
38°4l'5l"
39° 08 '40"
83° 00' 30"
83° 13' 08"
82° 57' 40"
83° 10' 24"
83° 11 '22"
83° 10' 35"
83° 10' 10"
82° 31' 05"
Overtopped ; downstream slope erosion
Overtopped; downstream slope erosion
Flow through the emergency spillway
Overtopped; downstream slope erosion
Flow through the emergency spillway
Erosion at the spillway outlet
Erosion at the spillway outlet
Overtopped; downstream slope erosion
Overtopped: Flow over the top of the dam embankment crest.Downstream slope erosion: Removal of soil from the downstream dam embankment.
the Ohio River floods probably because of the sparse- ness of development.
Ohio Brush Creek near West Union - TheMarch 1997 peak stage of 31.15 feet at the gaging sta tion on Ohio Brush Creek near West Union, in Adams County, surpassed the previous peak stage (27.91 feet) that occurred on March 10, 1964, by more than 3 feet. A major flood also occurred on the Ohio River in 1964, and Adams County residents along the Ohio River were forced to evacuate. According to the March 12, 1964, issue of "The People's Defender," a West Union newspaper, more than 175 families were affected by the Ohio Brush Creek flooding and more than 300 individuals sought emergency housing in local school buildings. State Route 52, in southern Adams County along the Ohio River, was closed because of the flooding of the Ohio River in 1964 and 1997.
Backwater caused by the Ohio River has con tributed to flooding on Ohio Brush Creek. During the 1937 Ohio River flood (the peak of record at many Ohio River gaging stations), the gaging station on Ohio Brush Creek near West Union had been tempo rarily discontinued because of funding restrictions. Connell Moore, Jr., a lifelong Adams County resident who lived adjacent to Ohio Brush Creek in 1937, stated that the flooding in Ohio Brush Creek was due to backwater caused by the Ohio River. He recalls that his father, Connell Moore, Sr., who was employed by the USGS as a gaging station observer on Ohio Brush
Creek from 1940 to 1970, was able to row a boat and touch the bottom of the old State Route 348 bridge that crosses Ohio Brush Creek at the station. The deck of the old State Route 348 bridge, which is no longer in service, was submerged by the flooded Ohio Brush Creek in March 1997.
Raccoon Creek at Adamsville - The village of Adamsville was originally established adjacent to Rac coon Creek in 1800, although residents began to relo cate to the vicinity of Rio Grande in the 1870's as a result of recurring flooding. This left only a few dwell ings in the community of Adamsville. Beginning in 1971, The Bob Evans Farm moved log cabins from various locations in southeastern Ohio to Adamsville in order to recreate an 1800's village. Two of these cabins (the Wickline and the Post Office) were swept away by the 1997 flood (fig. 9).
The largest flood of record at the USGS stream- flow-gaging station Raccoon Creek at Adamsville occurred in May 1968. Late spring rains produced flooding that forced the evacuation of homes and busi nesses in the town of Vinton, about 12 miles upstream from Adamsville. The peak stage of the May 1968 flood at the gaging station was 28.69 feet and, accord ing to an issue of the "Gallipolis Daily Tribune" dated May 27, 1968, the State Route 35 bridge (currently State Route 588) over Raccoon Creek at Adamsville was under water for the first time since construction in 1952.
18 Flood of March 1997 in Southern Ohio

Table 5. Preliminary assessments of damage to residential structures related to the March 1997 flooding in southern Ohio[Estimates and classification criteria provided by the Ohio Emergency Management Agency, Department of Public Safety]
Damage assessments (in numbers of structures)Vsuuiuy
Adams
Athens
Brown
Clermont
Gallia
Hamilton
Highland
Hocking
Jackson
Lawrence
Meigs
Monroe
Morgan
Pike
Ross
Scioto
Vinton
Washington
Totals
Destroyed 1 / Major2
292
37
261
511
153
358
3
4
156
246
82
2
0
60
4
300
41
20
2,530
Minor3
159
7
27
0
32
35
0
6
24
201
24
8
0
310
23
1,500
26
8
2,390
Affected4
158
18
7
0
29
187
0
83
9
28
28
1
0
194
97
800
6
7
1,652
1 Flood depth more than 4 feet above structure's first floor and (or) structure is uninhabitable or not repairable. 2 Flood depth less than 4 feet above structure's first floor and (or) structure is uninhabitable without major repair. 3 Flood depth between 1 to 4 feet above structure's first floor, utility damage and minor repair needed. 4 Flood depth generally less than 1 foot above structure's first floor, no utility damage.
In 1937, Raccoon Creek peaked at 25.20 feet, almost 4 feet less than the March 1997 flood. The Jan uary 26, 1937, issue of the "Gallipolis Daily Tribune" reported the Raccoon Creek flood as "smashing all records for height and devastation." The 1937 flood on Raccoon Creek was 4.1 feet higher than the previous peak stage (21.10 feet), which had been recorded at the gaging station in April 1920.
Shade River near Chester-The gaging station on the Shade River near Chester is situated in a remote area of eastern Meigs County (fig. 1). The March 1997 peak stage of 31.38 feet exceeded the previous record
of 27.39 feet, which was established May 25, 1968. The flood of 1968 affected much of southern Ohio, and it was reported in the May 24, 1968, edition of the "Daily Sentinel" (a Pomeroy newspaper) that thou sands of southern Ohio residents were forced to evacu ate their homes. It also was reported that the flood caused the closure of all major highways in Meigs County. Another flood that occurred in February 14, 1966, on the Shade River resulted in the closure of major highways in Meigs County. The peak stage of the February 1966 flood was 24.67 feet, 6.71 feet less than in 1997.
General Description of the Flood 19

Table 6. Damages and (or) extreme flow conditions at privately owned dams during the March 1997 flooding in southern Ohio[Data complied by the Ohio Department of Natural Resources, Division of Water]
Name County Latitude Longitude Comments
Thomas Pond Dam Adams 38° 48'38" 83° 20'33"
Laycock Farm Pond No. I Adams 38° 54'51" 83° 29'01" Dam
Wagon Wheel Brown 38° 56'00" 84° 00'32" Lake Dam
Russellville Reservoir Brown 38° 53'14" 83° 46'52" Dam
Jackson Lake Dam Jackson 39° 06'02" 82° 47'22"
Cecil Hollow Dam Lawrence 38° 35'40" 82° 41 "20"
Kerns Hollow Lawrence 38° 40'30" 82° 40'20" Impoundment
Cave Lake.Dam Pike 39° 05 30" 83° 19'12"
Long's Retreat Lake Dam Pike 39° 05 18" 83° 19'00"
Green Acres Levee Pike 39° 07'30" 82° 59'00"
Lake Frasure Dam Scioto 38° 55'17" 83° 02'57"
Overtopped and completely breached
Overtopped; downstream slope erosion 3
Overtopped; downstream slope erosion
Overtopped; severe emergency spillway erosion
Overtopped; severe downstream slope erosion
Overtopped and breached4
Overtopped; downstream slope erosion
Flow through the emergency spillway
Flow through the emergency spillway
Overtopped and breached
Overtopped; damage to principal spillway
'Overtopped: Flow over the top of the dam embankment crest.Completely breached: Formation of an opening or breakthrough of the dam embankment.Downstream slope erosion: Removal of soil from the downstream dam embankment.Breached: Formation of an opening of the dam embankment from the crest to the downstream toe of the dam.
Ohio River at Cincinnati - Floods on the Ohio River have been numerous and have been documented since 1773. The January 1937 flood resulted in a record peak stage of 80.0 feet at the Ohio River at Cin cinnati gaging station, surpassing the March 1997 peak stage by more than 15 feet. The 1937 flood caused an estimated $32 million in damage (1937 dol lars) and forced approximately 50,000 people from their homes (McNutt, 1995). Floodwaters toppled nine fuel tanks in the Mill Creek valley, spilling about 135,000 gallons of gasoline. The gasoline ignited, resulting in a fire that covered an area 1 mile long by 3.5 miles wide.
Legislation had been enacted in 1936 authoriz ing the U.S. Army Corps of Engineers (COE) to con struct flood-control projects throughout the Ohio River Basin, and the 1937 flood spurred an acceleration of the effort. The U.S. Army COE currently manages 78 flood-control projects in the-Ohio River Basin,
55 of which are located in the stream system upstream from Cincinnati. In addition, the construction of the Mill Creek barrier dam, which was completed in 1948, provides additional flood protection for Cincinnati from Ohio River backwater.
The gage on the Ohio River at Cincinnati has recorded stages in excess of 60 feet eight times since 1937, but this level was last exceeded in 1964 when the river reached a stage of 66.20 feet, almost 2 feet higher than the peak stage of 64.48 feet in 1997. In 1964, there were 34 flood-control reservoirs operating upstream from Cincinnati. The U.S. Army COE esti mates that the 55 flood-control projects currently in place helped to reduce the March 1997 peak stage at Cincinnati by about 2.5 feet (Steven Holmstrum, U.S. Army Corps of Engineers, written commun., 1997).
20 Flood of March 1997 in Southern Ohio

SUMMARY REFERENCES CITED
Storms that produced heavy rains during March 1-2, 1997, resulted in severe flooding in southern Ohio. Widespread damages to private and public property occurred throughout the area. The following 18 counties in southern Ohio were declared Federal and State disas ter areas: Adams, Athens, Brown, Clermont, Gallia, Hamilton, Highland, Hocking, Jackson, Lawrence, Meigs, Monroe, Morgan, Pike, Ross, Scioto, Vinton, and Washington. Preliminary estimates of the cost of the flood damage are set at nearly $180 million. Nearly 20,000 persons were evacuated and about 6,500 resi dences and 833 businesses were affected. Five deaths were attributed to the flooding, all of the fatalities the result of attempts to drive through flooded roads.
Record peak stage and peak streamflow were recorded at two USGS streamflow-gaging stations, Ohio Brush Creek near West Union (Adams County) and Shade River near Chester (Meigs County). The peak streamflows at both locations exceeded estimates of 100- year-recurrence-interval peak streamflow. The peak streamflow and the corresponding water level at the USGS gaging station on Ohio Brush Creek near West Union, Ohio, were the highest recorded since the gaging station began operation (in water year 1927). The peak stage and peak streamflow for the Shade River near Chester gaging station also were the highest since the station began operation (in water year 1966). The peak streamflow at the Shade River near Chester was deter mined by use of an indirect method (slope-area compu tation) because all roads leading to the gaging station were inundated during the flood.
The largest accumulations of rainfall in Ohio for the March 1 2, 1997, storms were recorded in southern Adams and Brown Counties and ranged from 10 to 12 inches. Parts of Athens and Vinton Counties received about 6 inches of rainfall during the storm. Generally, rainfall amounts of 4 or more inches fell on most of the counties along or near the southern border of Ohio.
The most severe flooding within the state of Ohio was observed in streams located within 50 to 70 miles north of the Ohio River. Recurrence intervals at selected USGS streamflow-gaging stations throughout southern Ohio ranged from less than 2 years to greater than 100 years. The streamflow-gaging stations where floods hav ing higher recurrence-interval floods occurred were on Ohio River tributaries in counties that border the Ohio River. These tributaries drain into the Ohio River, result ing in the flooding of many communities along the Ohio River and some of the worst flooding in over 30 years.
Baird, D., and Dempsey, E., 1997, Flooded areas brace for more: The Columbus (Ohio) Dispatch, March 4, 1997, p. 1A.
Benson, M.A., and Dalrymple, Tate, 1967, General field and office procedures for indirect discharge mea surements: U.S. Geological Survey Techniques of Water-Resources Investigations, book 3, chap. Al,30p.
Cashell, D.H., compiler, 1997a, Monthly water inven tory report for Ohio, January 1997: Ohio Depart ment of Natural Resources Division of Water, 4 p.
Cashell, D.H., compiler, 1997b, Monthly water inven tory report for Ohio, February 1997: Ohio Depart ment of Natural Resources Division of Water, 4 p.
Dalrymple, Tate. and Benson, M.A., 1967, Measurement of peak discharge by the slope-area method: U.S. Geological Survey Techniques of Water- Resources Investigations, book 3, chap. A2, 12 p.
Gallipolis (Ohio) Daily Tribune, 1937 [Untitled article]: January 26, 1937.
Gallipolis (Ohio) Daily Tribune, 1968, Worst flood in history: May 27, 1968.
Hannum, C.H., 1976, Technique for estimating magni tude and frequency of floods in Kentucky: U.S. Geological Survey Water-Resources Investiga tions Report 76-62, 70 p., Ipl.
Koltun, G.F., and Roberts, J.W., 1990, Techniques for estimating flood-peak discharges of rural, unregu lated streams in Ohio: U.S. Geological Survey Water-Resources Investigations Report 89-4126, 68 p., Ipl.
McNutt, R., 1995, Big washout: Ohio Magazine, v. 17, no. 12, March 1995, p. 32-38.
National Oceanic and Atmospheric Administration,1981, Divisional normals and standard deviations of temperature (°F) and precipitation (inches) 1931-30(1931-60, 1941-70, 1951-30): Cli- matography of the United States, no. 85, 175 p., 1 pi.
Pomeroy (Ohio) Daily Sentinel, 1968, Homes evacuated in Rutland: May 24, 1968.
Rantz, S.E., and others, 1982, Measurement and compu tation of streamflow, volume 1; measurement of stage and discharge: U.S. Geological Survey Water-Supply Paper 2175, 284 p.
West Union (Ohio) People's Defender, 1964, Expect flood crest at Manchester: March 12, 1964.
References Cited 21