flood light led lamp 140w cw by ledverlichting soest · lamp measurement report – 11 june 2010...
TRANSCRIPT

Lamp measurement report – 11 June 2010
Page 1 of 24
Flood Light Led Lamp 140W CW by
Ledverlichting Soest
Lamp measurement report – 11 June 2010
Page 2 of 24
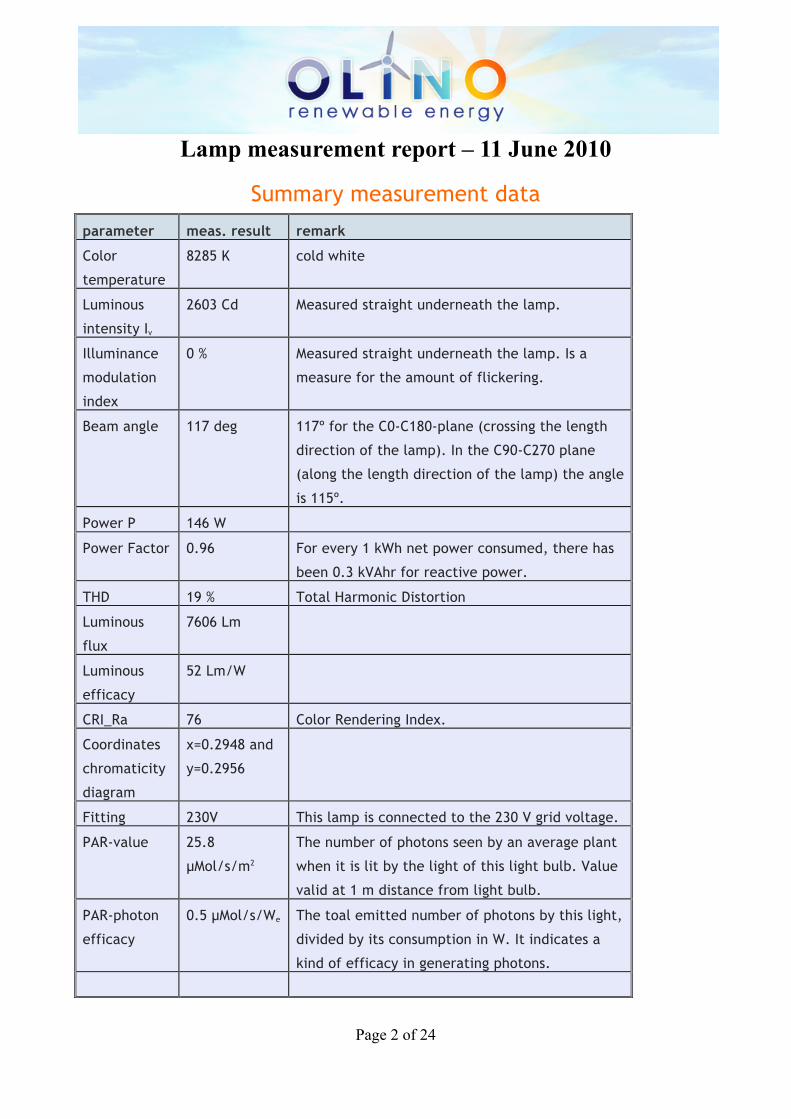
Summary measurement data
parameter meas. result remark
Color
temperature
8285 K cold white
Luminous
intensity Iv
2603 Cd Measured straight underneath the lamp.
Illuminance
modulation
index
0 % Measured straight underneath the lamp. Is a
measure for the amount of flickering.
Beam angle 117 deg 117º for the C0-C180-plane (crossing the length
direction of the lamp). In the C90-C270 plane
(along the length direction of the lamp) the angle
is 115º.
Power P 146 W
Power Factor 0.96 For every 1 kWh net power consumed, there has
been 0.3 kVAhr for reactive power.
THD 19 % Total Harmonic Distortion
Luminous
flux
7606 Lm
Luminous
efficacy
52 Lm/W
CRI_Ra 76 Color Rendering Index.
Coordinates
chromaticity
diagram
x=0.2948 and
y=0.2956
Fitting 230V This lamp is connected to the 230 V grid voltage.
PAR-value 25.8
µMol/s/m2
The number of photons seen by an average plant
when it is lit by the light of this light bulb. Value
valid at 1 m distance from light bulb.
PAR-photon
efficacy
0.5 µMol/s/We The toal emitted number of photons by this light,
divided by its consumption in W. It indicates a
kind of efficacy in generating photons.

Lamp measurement report – 11 June 2010
Page 3 of 24
S/P ratio 2.2 This factor indicates the amount of times more
efficient the light of this light bulb is perceived
under scotopic circumstances (ow environmental
light level).
L x W x H
external
dimensions
602 x 290 x
111 mm
External dimensions of the lamp.
L x W
luminous
area
378 x 240 mm Dimensions of the luminous area (used in
Eulumdat file). This is the surface of the
reflector at the front of the lamp.
General
remarks
The ambient temperature during the whole set of
measurements was 23-24.5 deg C. The
temperature of the lam between the fins of the
heatsink gets about 41 degrees hotter.
Warm up effect: during the warm up time the
illuminance decreases with 8 % and the consumed
power with 5 %.
Voltage dependency: the power consumption and
illuminance do not vary considerably when the
power voltage varies between 200-250 V.
An additional photo at the end of the article.

Lamp measurement report – 11 June 2010
Page 4 of 24
Overview table
The overview table is explained on the OliNo website. Please note that this overview table makes use of calculations, use this data with care as explained on the OliNo site. E (lux) values are not accurate, when within 5 x 448 mm (diagonal length) ≈ 2250 mm. Within this distance from the lamp, the measured lux values willl be less than the computed values in this overview as the measurements are then within the near field of the lamp.

Lamp measurement report – 11 June 2010
Page 5 of 24
Eulumdat light diagram This light diagram below comes from the program Qlumedit, that extracts these diagrams from an Eulumdat file. It is explained on the OliNo site.
The light diagram giving the radiation pattern. It indicates the luminous intensity around the light bulb. All the planes give the same results as the lamp is symmetrical along its 1st axis.
Lamp measurement report – 11 June 2010
Page 6 of 24
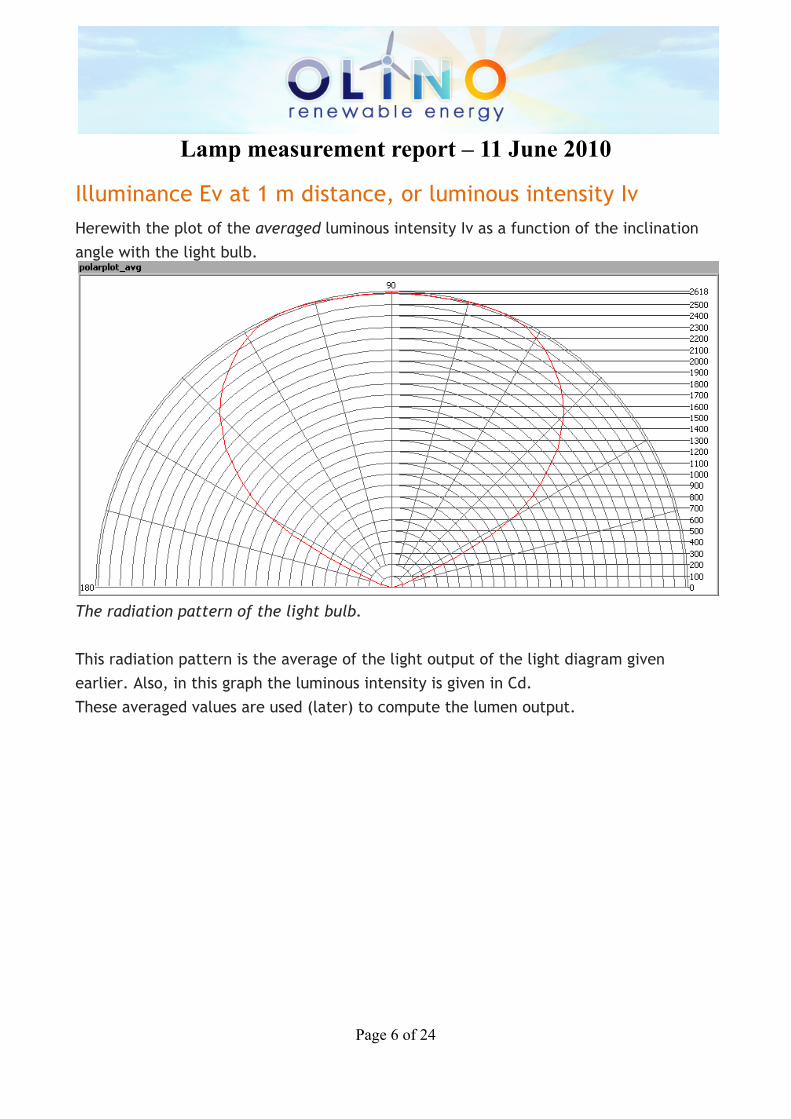
Illuminance Ev at 1 m distance, or luminous intensity Iv Herewith the plot of the averaged luminous intensity Iv as a function of the inclination angle with the light bulb.
The radiation pattern of the light bulb. This radiation pattern is the average of the light output of the light diagram given earlier. Also, in this graph the luminous intensity is given in Cd. These averaged values are used (later) to compute the lumen output.

Lamp measurement report – 11 June 2010
Page 7 of 24
Intensity data of every measured turn angle at each inclination angle. This plot shows per inclination angle the intensity measurement results for each turn angle at that inclination angle. There normally are differences in illuminance values for different turn angles. However for further calculations the averaged values will be used. When using the average values per inclination angle, the beam angle can be computed, being 115º-117º depending on the C-plane looked at.
Luminous flux With the averaged illuminance data at 1 m distance, taken from the graph showing the averaged radiation pattern, it is possible to compute the luminous flux. The result of this computation for this light spot is a luminous flux of 7606 Lm.
Luminous efficacy The luminous flux being 7606 Lm, and the power of the light bulb being 146 W, yields a luminous efficacy of 52 Lm/W.

Lamp measurement report – 11 June 2010
Page 8 of 24
Electrical properties A power factor of 0.96 means that for every 1 kWh net power consumed, a reactive component of 0.3 kVAr was needed.
Lamp voltage 230 VAC
Lamp current 664 mA
Power P 146 W
Apparent power S 153 VA
Power factor 0.93
Of this light bulb the voltage across ad the resulting current through it are measured and graphed. See the OliNo site how this is obtained.
Voltage across and current through the lightbulb This waveforms have been checked on requirements posed by the norm IEC 61000-3-2:2006 (including up to A2:2009). See also the explanation on the OliNo website.

Lamp measurement report – 11 June 2010
Page 9 of 24
Harmonics in in the current waveform and checked against IEC61000-3-2:2006 There are limits for the harmonics for lighting equipment > 25 W which are fulfilled. The Total Harmonic Distortion of the current is computed as 19 %.

Lamp measurement report – 11 June 2010
Page 10 of 24
Temperature measurements lamp
Overview image

Lamp measurement report – 11 June 2010
Page 11 of 24
Temperature measurement at the front, on the tape and directly on the glassplate. With an emissivity setting of 0.82 the temperature measured on the glassplate is the same as the temperature measured on the tape.

Lamp measurement report – 11 June 2010
Page 12 of 24
Frontview with emmissivity at 0.82.

Lamp measurement report – 11 June 2010
Page 13 of 24
Sideview. The sidevies has an emissivity equal to he tape. Except for the metal strip which has avery low emissivity and therefore only the measurement value on the tape is used.
Lamp measurement report – 11 June 2010
Page 14 of 24
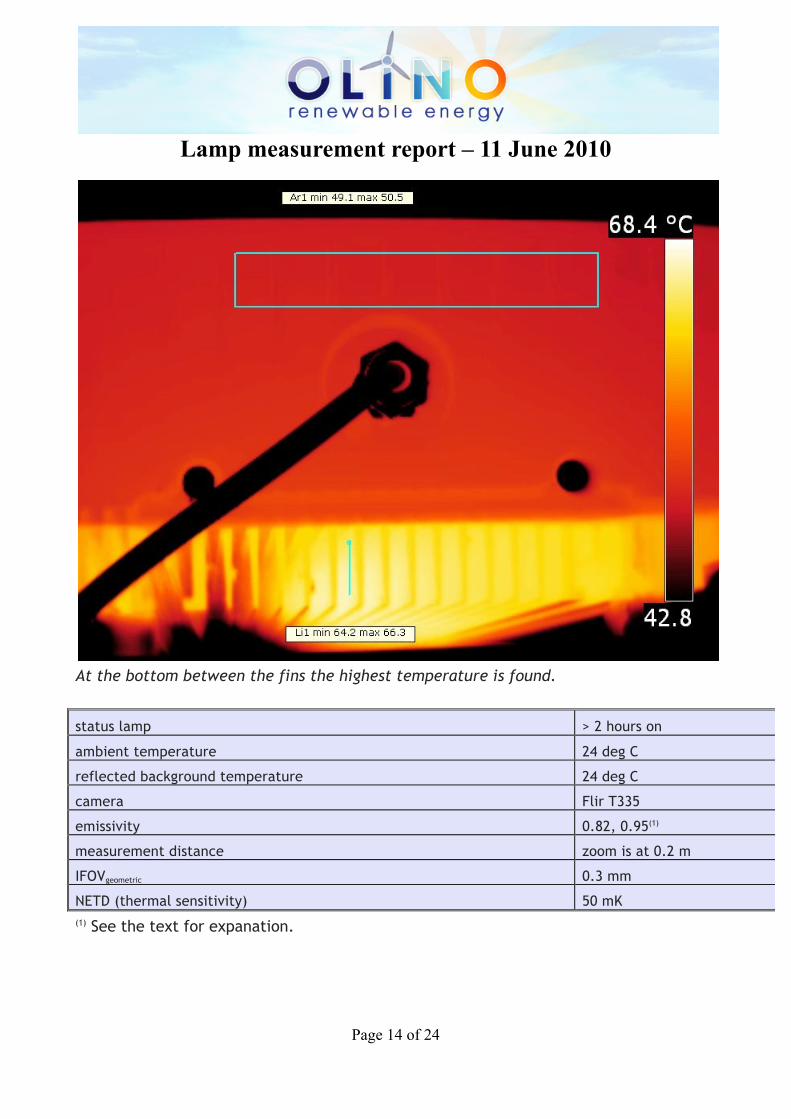
At the bottom between the fins the highest temperature is found.
status lamp > 2 hours on
ambient temperature 24 deg C
reflected background temperature 24 deg C
camera Flir T335
emissivity 0.82, 0.95(1)
measurement distance zoom is at 0.2 m
IFOVgeometric 0.3 mm
NETD (thermal sensitivity) 50 mK (1) See the text for expanation.

Lamp measurement report – 11 June 2010
Page 15 of 24
Color temperature and Spectral power distribution
The spectral power distribution of this light bulb, energies on y-axis valid at 1 m distance. The measured color temperature is about 8300 K which is cold white. This color temperature is measured straight underneath the light bulb. Below a graph showing the color temperature for different inclination angles.

Lamp measurement report – 11 June 2010
Page 16 of 24
Color temperature as a function of inclination angle. The measurement of CCT is measured for inclination angles up to 70º. The maximum beam angle is 117º, meaning a 58.5º inclination angle. In this area most of the light is present. The variation in correlated color temperature in this area is about 10 %.
Lamp measurement report – 11 June 2010
Page 17 of 24
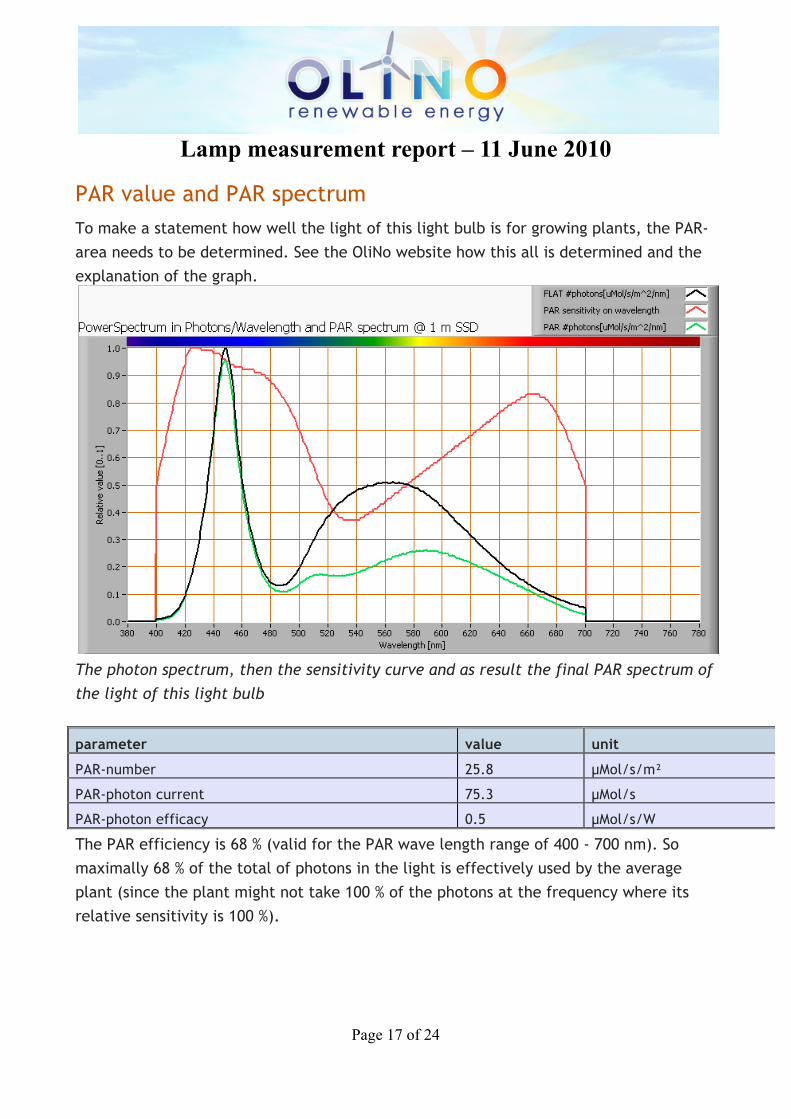
PAR value and PAR spectrum To make a statement how well the light of this light bulb is for growing plants, the PAR-area needs to be determined. See the OliNo website how this all is determined and the explanation of the graph.
The photon spectrum, then the sensitivity curve and as result the final PAR spectrum of the light of this light bulb
parameter value unit
PAR-number 25.8 µMol/s/m²
PAR-photon current 75.3 µMol/s
PAR-photon efficacy 0.5 µMol/s/W
The PAR efficiency is 68 % (valid for the PAR wave length range of 400 - 700 nm). So maximally 68 % of the total of photons in the light is effectively used by the average plant (since the plant might not take 100 % of the photons at the frequency where its relative sensitivity is 100 %).

Lamp measurement report – 11 June 2010
Page 18 of 24
S/P ratio The S/P ratio and measurement is explained on the OliNo website. Here the results are given.
The power spectrum, sensitivity curves and resulting scotopic and photopic spectra (spectra energy content defined at 1 m distance). The S/P ratio is 2.2. More info on S/P ratio can be found on the OliNo website.

Lamp measurement report – 11 June 2010
Page 19 of 24
Chromaticity diagram
The chromaticity space and the position of the lamp’s color coordinates in it. The light coming from this lamp is just outside the area (to the blue side) designated with class A. This class A is an area that is defined for signal lamps, see also the OliNo website. Its coordinates are x=0.2948 and y=0.2956.
Lamp measurement report – 11 June 2010
Page 20 of 24
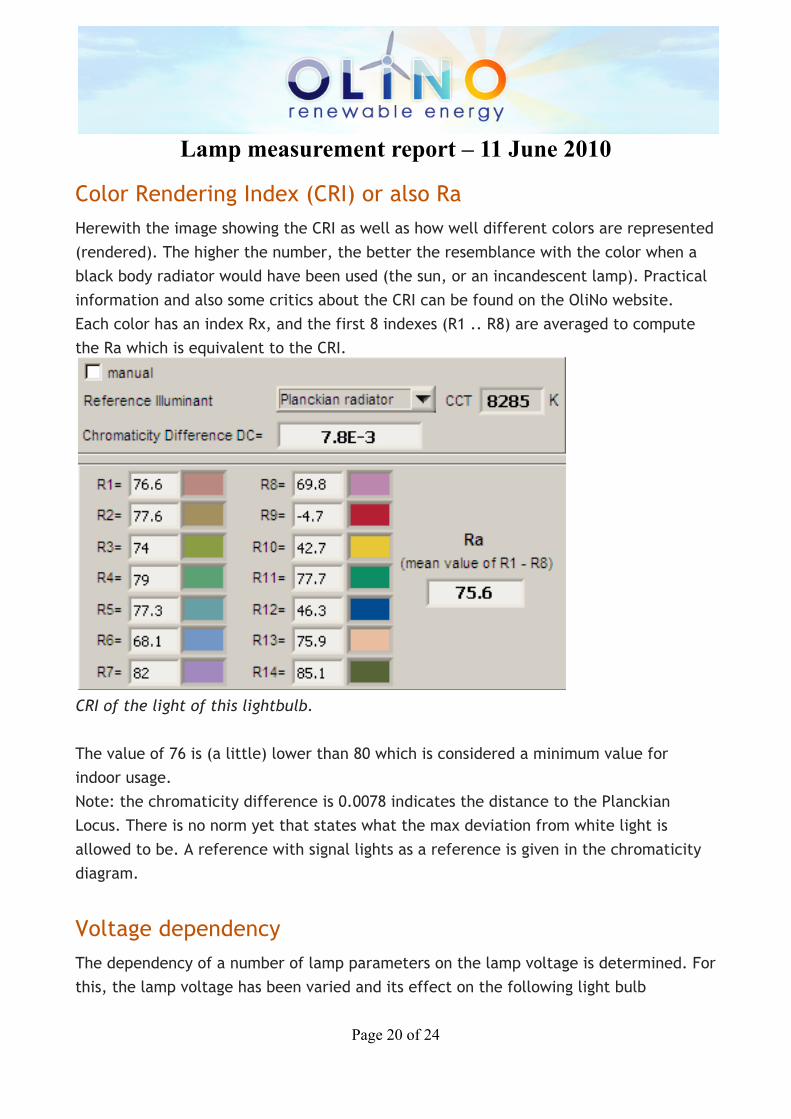
Color Rendering Index (CRI) or also Ra Herewith the image showing the CRI as well as how well different colors are represented (rendered). The higher the number, the better the resemblance with the color when a black body radiator would have been used (the sun, or an incandescent lamp). Practical information and also some critics about the CRI can be found on the OliNo website. Each color has an index Rx, and the first 8 indexes (R1 .. R8) are averaged to compute the Ra which is equivalent to the CRI.
CRI of the light of this lightbulb. The value of 76 is (a little) lower than 80 which is considered a minimum value for indoor usage. Note: the chromaticity difference is 0.0078 indicates the distance to the Planckian Locus. There is no norm yet that states what the max deviation from white light is allowed to be. A reference with signal lights as a reference is given in the chromaticity diagram.
Voltage dependency The dependency of a number of lamp parameters on the lamp voltage is determined. For this, the lamp voltage has been varied and its effect on the following light bulb
Lamp measurement report – 11 June 2010
Page 21 of 24
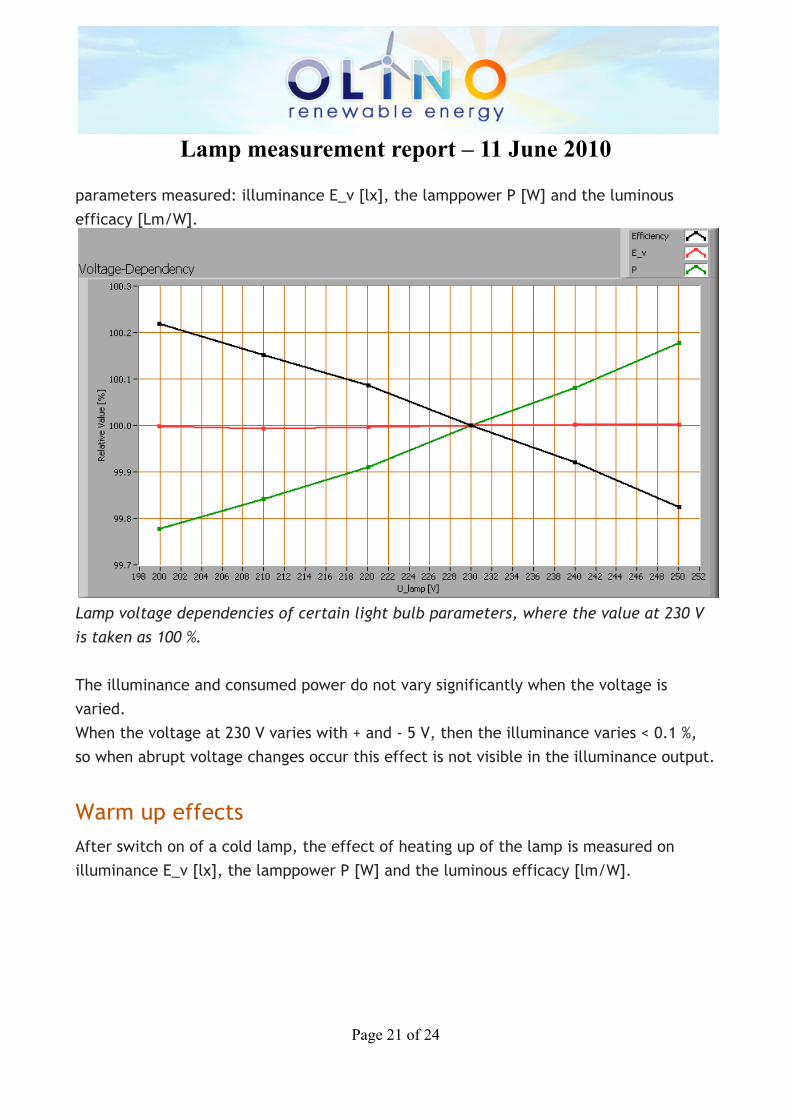
parameters measured: illuminance E_v [lx], the lamppower P [W] and the luminous efficacy [Lm/W].
Lamp voltage dependencies of certain light bulb parameters, where the value at 230 V is taken as 100 %. The illuminance and consumed power do not vary significantly when the voltage is varied. When the voltage at 230 V varies with + and - 5 V, then the illuminance varies < 0.1 %, so when abrupt voltage changes occur this effect is not visible in the illuminance output.
Warm up effects After switch on of a cold lamp, the effect of heating up of the lamp is measured on illuminance E_v [lx], the lamppower P [W] and the luminous efficacy [lm/W].
Lamp measurement report – 11 June 2010
Page 22 of 24
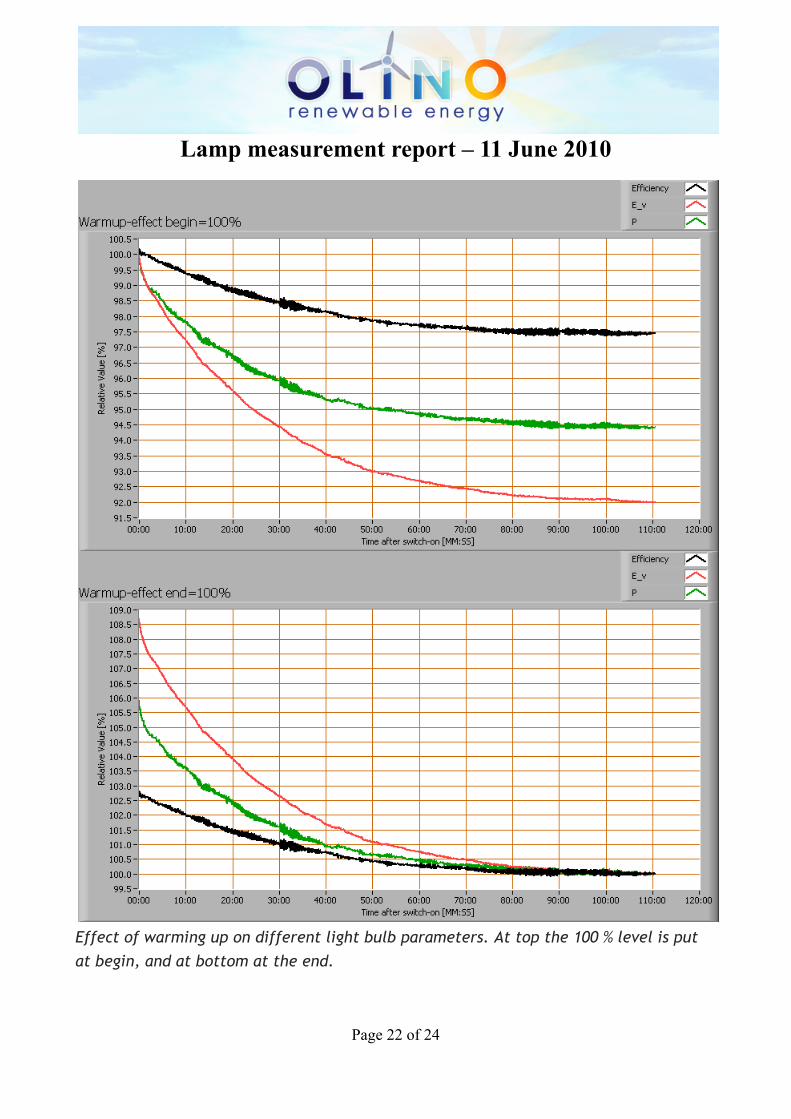
Effect of warming up on different light bulb parameters. At top the 100 % level is put at begin, and at bottom at the end.
Lamp measurement report – 11 June 2010
Page 23 of 24
The warm up time is about 100 minutes. During that time the illuminance decreases with 8 % and the consumed power with about 5 %.
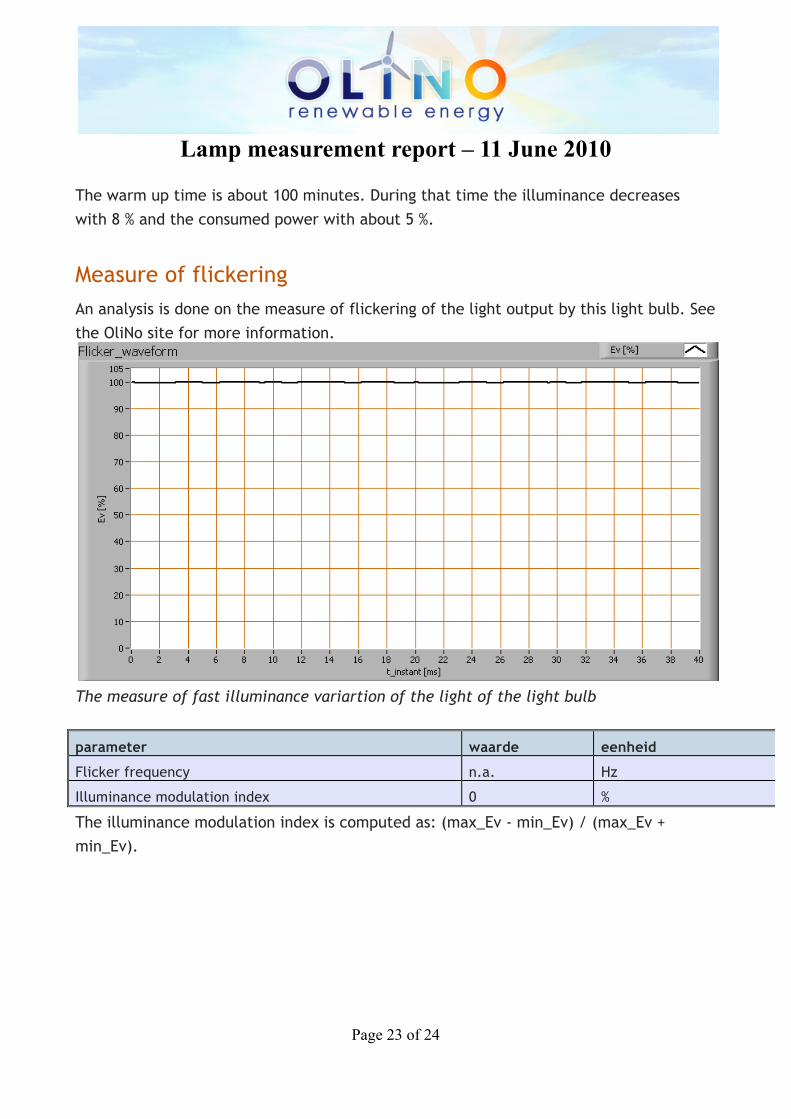
Measure of flickering An analysis is done on the measure of flickering of the light output by this light bulb. See the OliNo site for more information.
The measure of fast illuminance variartion of the light of the light bulb
parameter waarde eenheid
Flicker frequency n.a. Hz
Illuminance modulation index 0 %
The illuminance modulation index is computed as: (max_Ev - min_Ev) / (max_Ev + min_Ev).
Lamp measurement report – 11 June 2010
Page 24 of 24
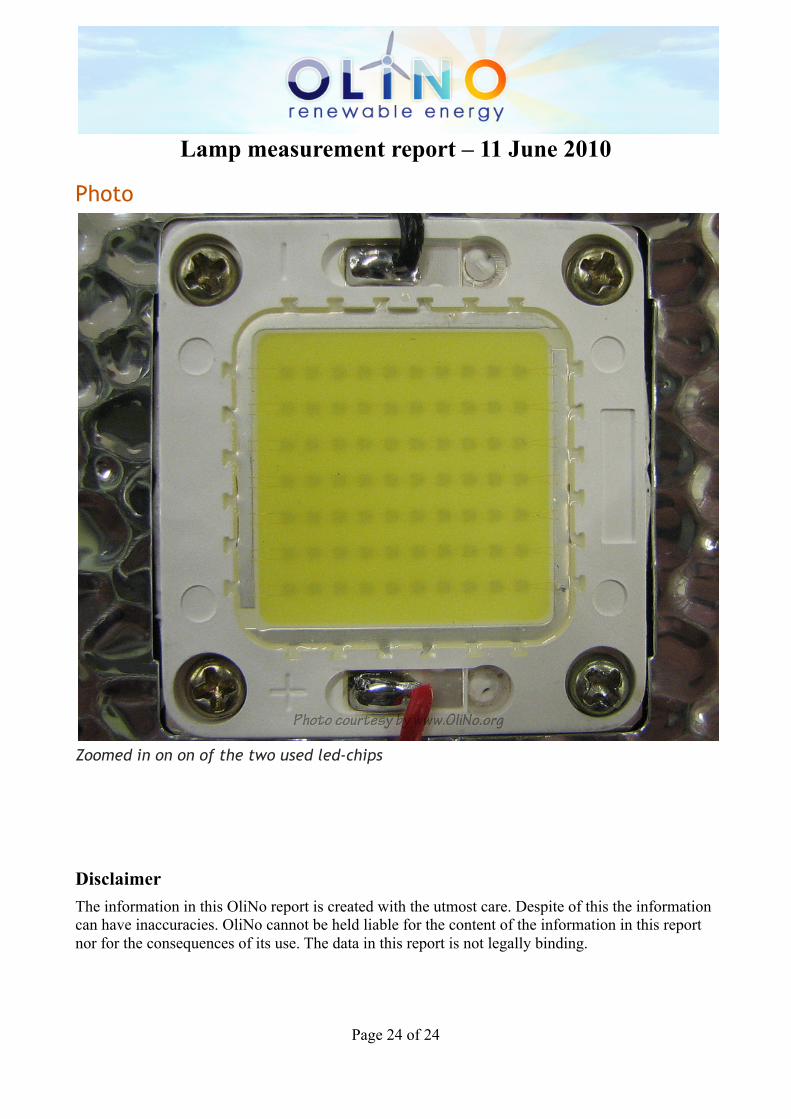
Photo
Zoomed in on on of the two used led-chips
Disclaimer The information in this OliNo report is created with the utmost care. Despite of this the information can have inaccuracies. OliNo cannot be held liable for the content of the information in this report nor for the consequences of its use. The data in this report is not legally binding.