floating-rate loan - eaton vance
TRANSCRIPT

Floating-Rate Loan
Market Monitor
Q3 2021
FLOATING-RATE LOAN GROUP
Floating-Rate Loan Market Monitor | Q3 2021
Asset Class Review 3
Market Update 8
Portfolio Applications 27
About Eaton Vance 33
Additional Information 36
2
Past performance is not a reliable indicator of future results. Data provided is for informational use only. See end of material for important additional information and disclosures.
Table of Contents
A leader in floating-rate loan investment management, Eaton Vance
presents Floating-Rate Loan Market Monitor, an in-depth review of
the loan market through clear and impactful charts. Providing
timely information across a broad array of topics relating to this
distinctive asset class, Floating-Rate Loan Market Monitor serves as
a helpful resource in providing connectivity between changing
market events and implications for investors’ loan allocation.
Use Floating-Rate Loan Market Monitor to educate on the loan
market, provide updates on loan market conditions and explain the
role of loans within portfolios.

Asset Class Review
Floating-Rate Loan Market Monitor | Q3 2021
Past performance is not a reliable indicator of future results. Data provided is for informational use only. It is not possible to invest directly in an Index. See end of material for important additional information and
disclosures.
4
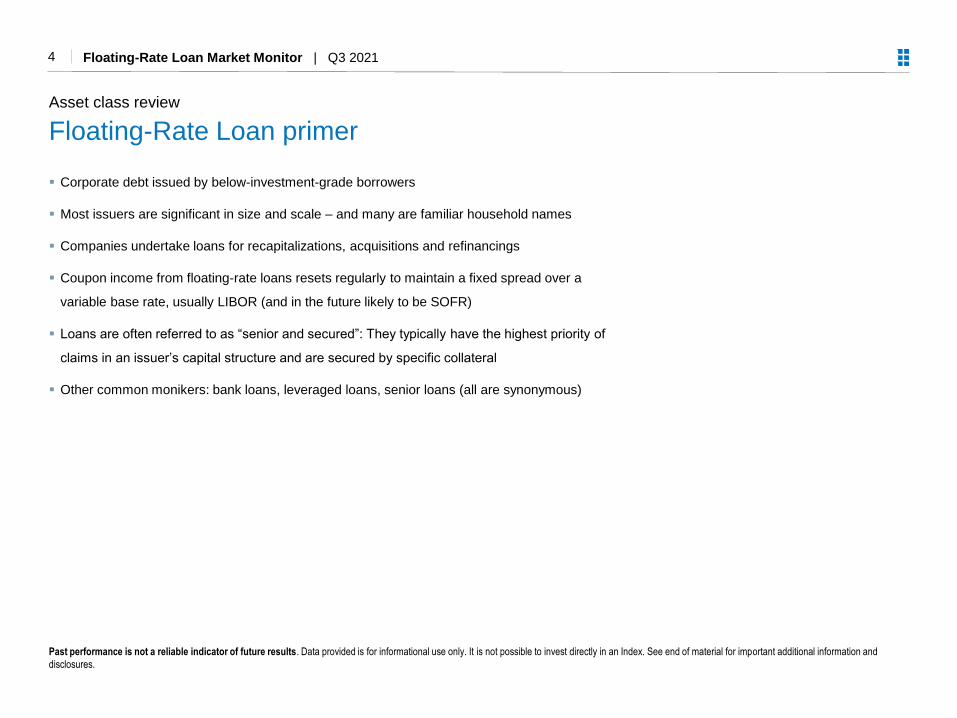
Corporate debt issued by below-investment-grade borrowers
Most issuers are significant in size and scale – and many are familiar household names
Companies undertake loans for recapitalizations, acquisitions and refinancings
Coupon income from floating-rate loans resets regularly to maintain a fixed spread over a
variable base rate, usually LIBOR (and in the future likely to be SOFR)
Loans are often referred to as “senior and secured”: They typically have the highest priority of
claims in an issuer’s capital structure and are secured by specific collateral
Other common monikers: bank loans, leveraged loans, senior loans (all are synonymous)
Asset class review
Floating-Rate Loan primer

Floating-Rate Loan Market Monitor | Q3 20215
Floating-rate loans represent a senior layer
of issuer capital structure
Substantial junior capital cushion provides
low loan-to-value
Secured by collateral including issuer
accounts receivable, inventory, property,
plant, equipment and/or stock
Source: Eaton Vance, December 31, 2020. Past performance is not a reliable indicator of future results. Data provided is for informational use only. See end of material for important additional information and
disclosures. The data is an average of all loans currently tracked across the Eaton Vance loan platform as of December 31, 2020. Does not represent any particular issuer or product. EBITDA is defined as earnings before
interest taxes depreciation and amortization. Data is based on the pre-pandemic equity multiple of 14.0x.
Asset class review
Fundamental lending proposition
Weighted Average Company Capital Structure
$4.1B Revenue & $872M EBITDA
Fixed Charge Coverage: 2.1x
Interest Coverage: 3.9x
$12.2 Billion Enterprise Value
4.1x
(29% of cap structure)
5.3x
(9% of cap structure)
14.0x
(62% of cap structure)
Floating-Rate Loans
Equity
$3,575 Million
$11,741 Million
High-Yield Bonds
$7,569 M
$1,046 M
$3,575 M

Floating-Rate Loan Market Monitor | Q3 20216
Sources: Bloomberg, ICE Data Indices LLC, and LCD, an offering of S&P Global Market Intelligence, September 30, 2021. Past performance is not a reliable indicator of future results. Data provided is for informational
use only. It is not possible to invest directly in an Index. See end of material for important additional information and disclosures. US Investment Grade measured by the Bloomberg US Corporate Index. US Floating-Rate
Loans measured by the S&P/LSTA Leveraged Loan Index. US High Yield measured by the ICE BofA US High Yield Index. Size of market is based on par outstandings.
Asset class review
Taxonomy of floating-rate loans
US Investment Grade US Floating-Rate Loans US High Yield
Size of Market $6.2 T $1.3 T $1.5 T
# of Issues 6,902 1,462 2,127
Avg. Credit Quality A3/Baa1 B+ B1
Base Rate US Treasuries LIBOR US Treasuries
Coupon Structure Fixed Floating Fixed
Avg. Duration 8.7 yrs. -- 4.2 yrs.
Avg. Yield to Maturity 2.2% 4.2% 4.7%
Avg. Maturity 12.3 yrs 4.8 yrs 6.7 yrs

Floating-Rate Loan Market Monitor | Q3 20217
Source: LCD, an offering of S&P Global Market Intelligence, September 30, 2021. Past performance is not a reliable indicator of future results. Data provided is for informational and illustrative purposes only. This is an
example only and is not intended to represent the allocation of any fund/account/strategy. This list represents a sample of some of the larger and more liquid loans in the S&P/LSTA Leveraged Loan Index. This sample is not
necessarily representative of the other issuers in this index, which will vary based on factors including size and liquidity. This information is not to be construed as investment advice or a recommendation to buy or sell any
particular security. Investors should consult an investment professional prior to making any investment decisions. It is not possible to invest directly in an index. See end of material for important additional information and
disclosures.
Asset class review
Sample loan market issuers
Issuer Industry Maturity Date Spread Corp. Ratings
Akzo Nobel Chemicals Chemicals & Plastics Oct 2025 L+300 B+/B1
Asurion Insurance Dec 2026 L+325 B+/Ba3
Avolon Aerospace Equipment Leasing Jan 2025 L+200 BBB-/Baa2
BMC Software Electronics/Electrical Oct 2025 L+375 B/B2
CenturyLink Telecom Mar 2027 L+225 BBB-/Ba3
Charter Communications Cable & Satellite Television Feb 2027 L+175 BBB-/Ba1
Dell Electronics/Electrical Sep 2025 L+175 BBB-/Baa3
Grifols Drugs Jan 2025 L+200 BB+/Ba2
HUB International Insurance Apr 2025 L+300 B/B2
Pilot Travel Centers Retailers (except food & drug) Aug 2028 L+200 BB+/Ba1
Scientific Games Lodging & Casinos Aug 2024 L+275 B+/Ba3
Univision Radio & Television Mar 2024 L+275 B/B2
Valeant Pharmaceuticals Drugs Jun 2025 L+300 BB-/Ba2
Virgin Media Cable & Satellite Television Jan 2028 L+250 BB-/Ba3
Zayo Group Telecom Mar 2027 L+300 B/B1

Market Update

Floating-Rate Loan Market Monitor | Q3 20219
Market update
Floating-rate loan quarterly dashboard
Top 10 Industries
Maturity Breakdown
Source: LCD, an offering of S&P Global Market Intelligence, September 30, 2021. Past performance is not a reliable indicator of future results. All data reflects the S&P/LSTA Leveraged Loan Index. Data provided is for
informational and illustrative purposes only. It is not possible to invest directly in an index. See end of material for important additional information and disclosures. Maturity breakdown excludes defaulted facilities and is
based on par amount outstanding. Spread, yield and maturity data excludes defaults.
Index Statistics
Total Par Outstanding ($B) $1,299.34
Number of Issuers 1,177
Number of Facilities 1,462
Bid Price $98.62
Nominal Spread L+372
Discounted Spread (3 Years) L+413
Years to Maturity 4.81 yrs.
Yield to Maturity 4.19%
Loan Type
First Lien 97.47%
Second Lien 2.53%
15.7%
9.8%
9.8%
4.4%
3.8%
3.8%
3.7%
3.7%
3.6%
3.4%
0% 5% 10% 15% 20%
Electronics/Electrical
Health Care
Business Equipment & Services
Chemicals & Plastics
Insurance
Telecom
Leisure Goods/Activities/Movies
Industrial Equipment
Cable & Satellite Television
Building & Development
0.1% 0.1%3.6%
13.2%
20.7% 20.6%
16.9%
23.9%
0.9%
0%
10%
20%
30%
40%
2021 2022 2023 2024 2025 2026 2027 2028 2029
Floating-Rate Loan Market Monitor | Q3 202110
Source: LCD, an offering of S&P Global Market Intelligence, September 30, 2021. Past performance is not a reliable indicator of future results. All data reflects the S&P/LSTA Leveraged Loan Index. Data provided is for
informational and illustrative purposes only. It is not possible to invest directly in an index. See end of material for important additional information and disclosures. Breakdown by bid price includes performing loans only.
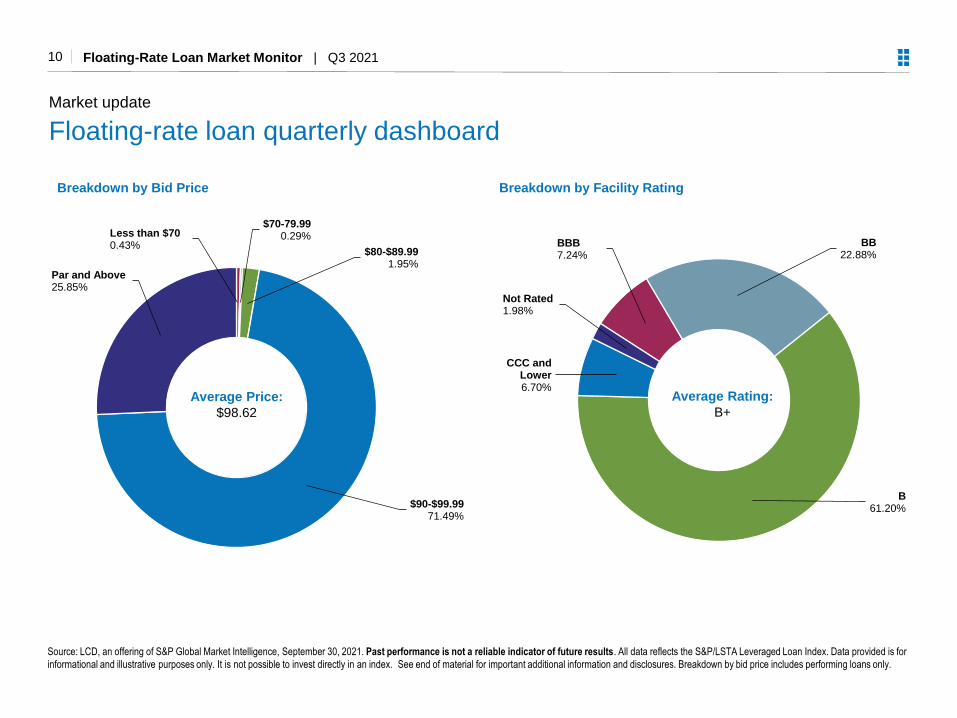
Market update
Floating-rate loan quarterly dashboard
Breakdown by Bid Price Breakdown by Facility Rating
Average Rating:
B+
Less than $700.43%
$70-79.990.29%
$80-$89.991.95%
$90-$99.9971.49%
Par and Above25.85%
BBB7.24%
BB22.88%
B61.20%
CCC and Lower6.70%
Not Rated1.98%
Average Price:
$98.62

Floating-Rate Loan Market Monitor | Q3 202111
Source: LCD, an offering of S&P Global Market Intelligence, September 30, 2021. Past performance is not a reliable indicator of future results. Data provided is for informational and illustrative purposes only. It is not
possible to invest directly in an index. See end of material for important additional information and disclosures. Data includes performing loans only in the S&P/LSTA Leveraged Loan Index.
Market update
Floating-rate loan quarterly dashboard
Price DistributionPercent of the Index
Price by Credit TierAverage Bid Price of Outstanding Loans
0%
10%
20%
30%
40%
50%
60%
70%
Dec 2019 Mar 2020 Sep 2021
Below 80 80-90 90-98 98-100 Par and above BB
B
CCC
$60
$65
$70
$75
$80
$85
$90
$95
$100
Dec 2
019
Jan
2020
Fe
b 2
02
0
Ma
r 20
20
Ap
r 202
0
May 2
020
Jun
2020
Jul 2020
Au
g 2
020
Se
p 2
020
Oct 202
0
Nov 2
020
Dec 2
020
Jan
2021
Feb 2
021
Ma
r 20
21
Ap
r 202
1
Ma
y 2
021
Jun
2021
Jul 2021
Au
g 2
021
Se
p 2
021

Floating-Rate Loan Market Monitor | Q3 2021
Source: LCD, an offering of S&P Global Market Intelligence, September 30, 2021. Past performance is not a reliable indicator of future results. Performance measures the S&P/LSTA Leveraged Loan Index. Data provided
is for informational use only. Indexes are unmanaged, do not reflect the deduction of fees and expenses, and are not available for direct investment.
12
Market update
Performance: Calendar year index returns
Last 12 Months: 8.40%
Median: 5.08%
-30% -25% -20% -15% -10% -5% 0% 5% 10% 15% 20% 25% 30% 35% 40% 45% 50% 55%
2009
2016
2010
2003
2012
2019
LTM
1997
2006
2013
1998
2004
2005
2000
2001
2017
1999
2020
2007
2002
2014
2011
2018
2015
2008
Return

Floating-Rate Loan Market Monitor | Q3 2021
Q3 2021Return1.11%
Median Return1.43%
0
0.2
0.4
0.6
0.8
1
1.2
1.4
1.6
1.8
2
-25%
-20%
-15%
-10%
-5%
0%
5%
10%
15%
20%
25%
Retu
rn
Source: LCD, an offering of S&P Global Market Intelligence, September 30, 2021. Past performance is not a reliable indicator of future results. Performance measures all quarterly returns of the S&P/LSTA Leveraged Loan
Index back to its inception in January 1997 and sorts them from lowest to highest. Data provided is for informational use only. Indexes are unmanaged, do not reflect the deduction of fees and expenses, and are not available
for direct investment.
13
Market update
Performance: Distribution of quarterly returns
Negative Quarters Positive Quarters
5 Worst Quarterly Performances 5 Best Quarterly Performances
Q4 2008 -22.94% Q2 2009 20.38%
Q1 2020 -13.05% Q3 2009 10.53%
Q3 2008 -6.99% Q1 2009 9.80%
Q1 2008 -5.74% Q2 2020 9.70%
Q3 2011 -3.85% Q2 2008 4.94%

Floating-Rate Loan Market Monitor | Q3 202114
Source: LCD, an offering of S&P Global Market Intelligence, September 30, 2021. Past performance is not a reliable indicator of future results. Performance measures the S&P/LSTA Leveraged Loan Index. Data
provided is for informational use only. Indexes are unmanaged, do not reflect the deduction of fees and expenses, and are not available for direct investment. See end of material for important additional information and
disclosures. Credit tier spreads measure discounted spread to three years over LIBOR.
Market update
Performance: Credit tier returns
Credit Tier PerformanceQ3 and Trailing 12 Months
1.1% 0.7% 0.8% 1.1%2.1%
0.6%
8.4%
4.0%5.2%
8.3%
22.7%
7.3%
0%
5%
10%
15%
20%
25%
Index BBB BB B CCC D
Retu
rn
Q3 2021Trailing 12 Months
Credit Tier % of Index Avg. Price Avg. Spread (bps)
Index -- $98.6 L+413
BBB 7.2 $99.6 L+210
BB 22.9 $99.4 L+309
B 61.2 $99.3 L+428
CCC 6.2 $92.9 L+827
D 0.4 $56.2 --
Floating-Rate Loan Market Monitor | Q3 202115
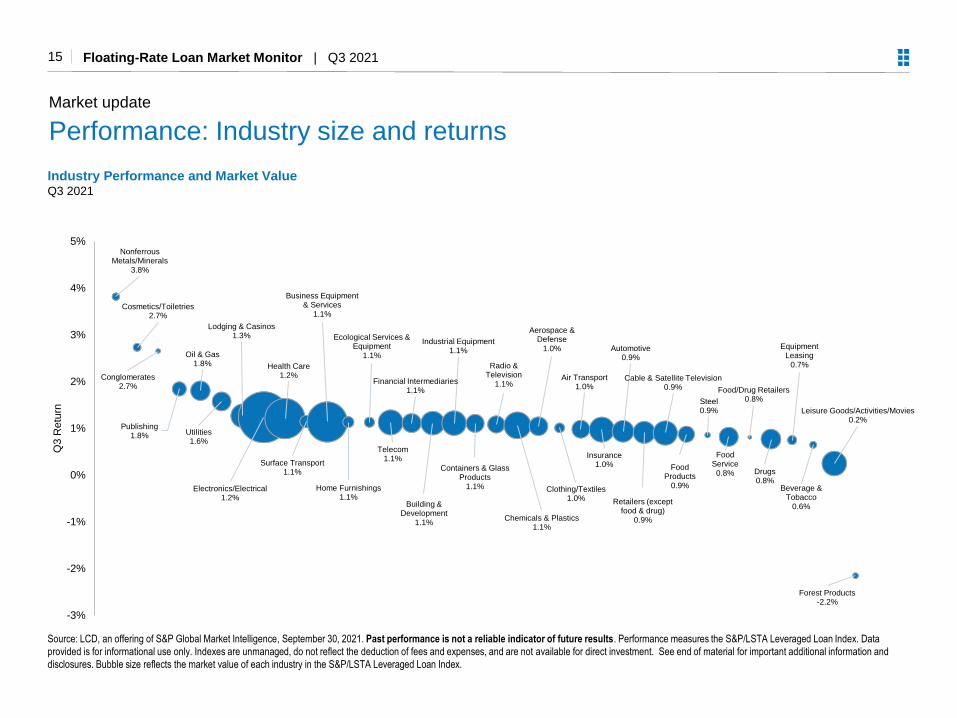
Source: LCD, an offering of S&P Global Market Intelligence, September 30, 2021. Past performance is not a reliable indicator of future results. Performance measures the S&P/LSTA Leveraged Loan Index. Data
provided is for informational use only. Indexes are unmanaged, do not reflect the deduction of fees and expenses, and are not available for direct investment. See end of material for important additional information and
disclosures. Bubble size reflects the market value of each industry in the S&P/LSTA Leveraged Loan Index.
Market update
Performance: Industry size and returns
Industry Performance and Market ValueQ3 2021
Nonferrous Metals/Minerals
3.8%
Cosmetics/Toiletries2.7%
Conglomerates2.7%
Publishing1.8%
Oil & Gas1.8%
Utilities1.6%
Lodging & Casinos1.3%
Electronics/Electrical1.2%
Health Care1.2%
Surface Transport1.1%
Business Equipment & Services
1.1%
Home Furnishings1.1%
Ecological Services & Equipment
1.1%
Telecom1.1%
Financial Intermediaries1.1%
Building & Development
1.1%
Industrial Equipment1.1%
Containers & Glass Products
1.1%
Radio & Television
1.1%
Chemicals & Plastics1.1%
Aerospace & Defense
1.0%
Clothing/Textiles1.0%
Air Transport1.0%
Insurance1.0%
Automotive0.9%
Retailers (except food & drug)
0.9%
Cable & Satellite Television0.9%
Food Products
0.9%
Steel0.9%
Food Service0.8%
Food/Drug Retailers0.8%
Drugs0.8%
Equipment Leasing
0.7%
Beverage & Tobacco
0.6%
Leisure Goods/Activities/Movies0.2%
Forest Products-2.2%
-3%
-2%
-1%
0%
1%
2%
3%
4%
5%
Q3 R
etu
rn

Floating-Rate Loan Market Monitor | Q3 2021
Source: LCD, an offering of S&P Global Market Intelligence, LSTA Trade Data Study. Par amount outstanding as of September 30, 2021. Trading and turnover as of June 30, 2021. Past performance is not a reliable
indicator of future results. Data provided is for informational use only. Amount of outstandings measures the S&P/LSTA Leveraged Loan Index. Trading and turnover data is sourced from 20 of the largest buy-side and sell-
side member institutions of the LSTA. The 1H 2021 trading volume and turnover data is annualized. It is not possible to invest directly in an Index.
16
Market update
Technical factors: Market size and trading volume
Market SizePar Amount of Outstanding Loan Market
Trading and TurnoverUS Trading Volume and Annual Loan Turnover Ratio
$881
$955
$1,147$1,193 $1,193
$1,299
$0 B
$100 B
$200 B
$300 B
$400 B
$500 B
$600 B
$700 B
$800 B
$900 B
$1000 B
$1100 B
$1200 B
$1300 B
2016
2017
2018
2019
2020
Se
p 2
021
$596
$635
$720 $743
$772
$824
69%
0%
25%
50%
75%
100%
$0B
$100B
$200B
$300B
$400B
$500B
$600B
$700B
$800B
$900B
2016
2017
2018
2019
2020
1H
2021 A
nn.
Volume Turnover Ratio (%)

Floating-Rate Loan Market Monitor | Q3 2021
Source: LCD, an offering of S&P Global Market Intelligence, September 30, 2021. Past performance is not a reliable indicator of future results. Data provided is for informational use only. It is not possible to invest directly
in an Index.
17
Market update
Technical factors: Loan demand and M&A volume
Institutional Loan Volume Backing M&ALeveraged Buyout (LBO) and Other M&A
Visible DemandQuarterly CLO Creation and Mutual Fund Flows
-$30 B
-$20 B
-$10 B
$0 B
$10 B
$20 B
$30 B
$40 B
$50 B
$60 B
$70 B
4Q
16
1Q
17
2Q
17
3Q
17
4Q
17
1Q
18
2Q
18
3Q
18
4Q
18
1Q
19
2Q
19
3Q
19
4Q
19
1Q
20
2Q
20
3Q
20
4Q
20
1Q
21
2Q
21
3Q
21
CLOs Loan Funds Total
$0 B
$10 B
$20 B
$30 B
$40 B
$50 B
$60 B
$70 B
$80 B
$90 B
$100 B
4Q
16
1Q
17
2Q
17
3Q
17
4Q
17
1Q
18
2Q
18
3Q
18
4Q
18
1Q
19
2Q
19
3Q
19
4Q
19
1Q
20
2Q
20
3Q
20
4Q
20
1Q
21
2Q
21
3Q
21
LBO Other M&A

Floating-Rate Loan Market Monitor | Q3 202118
Market update
Fundamental conditions: Revenue and earnings growth
Source: LCD, an offering of S&P Global Market Intelligence, Q2 2021. Past performance is not a reliable indicator of future results. Data provided is for informational use only. It is not possible to invest directly in an
Index. EBITDA refers to earnings before interest, taxes, depreciation and amortization. The data are based on approximately 150 public issuers included in the S&P/LSTA Leveraged Loan Index. See end of material for
important additional information and disclosures.
Year-Over-Year Revenue Growth Year-Over-Year EBITDA Growth
27%
-25%
-15%
-5%
5%
15%
25%
35%
1Q
09
3Q
09
1Q
10
3Q
10
1Q
11
3Q
11
1Q
12
3Q
12
1Q
13
3Q
13
1Q
14
3Q
14
1Q
15
3Q
15
1Q
16
3Q
16
1Q
17
3Q
17
1Q
18
3Q
18
1Q
19
3Q
19
1Q
20
3Q
20
1Q
21
21%
-25%
-15%
-5%
5%
15%
25%
35%
1Q
09
3Q
09
1Q
10
3Q
10
1Q
11
3Q
11
1Q
12
3Q
12
1Q
13
3Q
13
1Q
14
3Q
14
1Q
15
3Q
15
1Q
16
3Q
16
1Q
17
3Q
17
1Q
18
3Q
18
1Q
19
3Q
19
1Q
20
3Q
20
1Q
21

Floating-Rate Loan Market Monitor | Q3 202119
Market update
Fundamental conditions: Leverage and interest coverage
Source: Eaton Vance, September 30, 2021. Past performance is not a reliable indicator of future results. Data provided is for informational use only. See end of material for important additional information and
disclosures. The data is an average of all loans tracked across the Eaton Vance loan platform. Does not represent any particular issuer or product.
Weighted Average Leverage Interest Coverage
2x
3x
4x
5x
6x
7x
8x
2010
2011
2012
2013
2014
2015
2016
2017
2018
2019
2020
2021
Senior Leverage Total Leverage
0x
1x
2x
3x
4x
5x
2010
2011
2012
2013
2014
2015
2016
2017
2018
2019
2020
2021

Floating-Rate Loan Market Monitor | Q3 202120
Market update
Fundamental conditions: Loan upgrades outpacing downgrades
Source: LCD, an offering of S&P Global Market Intelligence, September 30, 2021. Past performance is not a reliable indicator of future results. All data reflects the S&P/LSTA Leveraged Loan Index. Data provided is for
informational and illustrative purposes only. It is not possible to invest directly in an index. See end of material for important additional information and disclosures.
Rolling 3-Month Count of Ratings Upgrades & Downgrades
-500
-400
-300
-200
-100
0
100
200
2008
2009
2010
2011
2012
2013
2014
2015
2016
2017
2018
2019
2020
2021
Dow
ngra
des
U
pgra
des

Floating-Rate Loan Market Monitor | Q3 2021
Source: LCD, an offering of S&P Global Market Intelligence, September 30, 2021. Past performance is not a reliable indicator of future results. All data reflects the S&P/LSTA Leveraged Loan Index. Data provided is for
informational use only. It is not possible to invest directly in an Index. See end of material for important additional information and disclosures.
21
Market update
Fundamental conditions: Default rate and distress ratio
Default RateLast 12 Months By Principal Amount
Distress RatioPercent of Performing Loans Trading Below $80
Credit Loss
(Assumes
70%
Recoveries)
Actual
Default
Rate
0.35%
0.11%0%
2%
4%
6%
8%
10%
12%
'00 '02 '04 '06 '08 '10 '12 '14 '16 '18 '20
0.72%0%
10%
20%
30%
40%
50%
60%
70%
80%
90%
'00 '02 '04 '06 '08 '10 '12 '14 '16 '18 '20

Floating-Rate Loan Market Monitor | Q3 2021
Sources: Eaton Vance, St. Louis Federal Reserve, and LCD, an offering of S&P Global Market Intelligence, September 30, 2021. Past performance is not a reliable indicator of future results. All spread and LIBOR floor
data reflects the S&P/LSTA Leveraged Loan Index. Data provided is for informational use only. Credit spread and floor benefit data are shown on a weighted average basis. LIBOR floor benefit is measured as the difference
between prevailing LIBOR rates and the average LIBOR floor. Data excludes facilities in default.
22
Market update
Valuations: Composition of average loan Index coupon
LIBOR Floor % of Par Outstanding
0% floor 49.8%
0.75% and less 34.4%
1.00% 14.9%
>1.00% 0.1%
No floor 0.8%
Credit Spread Corresponding All-In Rate
Max (Dec 2015) 4.04% 5.01%
Post-Crisis Average 3.60% 4.75%
Current 3.72% 4.18%
Long-Term Average 3.25% 5.52%
Min (June 2007) 2.42% 7.78%
0%
2%
4%
6%
8%
10%
12%
1999 2000 2001 2002 2003 2004 2005 2006 2007 2008 2009 2010 2011 2012 2013 2014 2015 2016 2017 2018 2019 2020 2021
All-
In C
oupon R
ate
Credit Spread 3-Month LIBOR Floor Benefit

Floating-Rate Loan Market Monitor | Q3 2021
Sources: Eaton Vance, St. Louis Federal Reserve, September 30, 2021. Past performance is not a reliable indicator of future results. Data provided is for informational use only.
23
Market update
Special topic: LIBOR transition
What does LIBOR’s end mean for loans?
In 2017, the Alternative Reference Rate Committee (ARRC), a
panel convened by the U.S. Federal Reserve, selected the Secured
Overnight Financing Rate (SOFR) as a replacement for U.S.
LIBOR to be effective no later than the end of 2021.
SOFR reflects a broad universe of overnight U.S. Treasury repo
activity based on more than $800 billion in daily transactions.
In November 2020, U.S. and U.K. banking regulators announced
that the December 31, 2021 sunset for LIBOR would remain in
place for newly originated loans.
However, they added that most U.S. dollar (USD) LIBOR maturities
could be extended to June 2023 for legacy contracts only.
Newly issued LIBOR-based loans will soon be a thing of the past,
and sometime later this year we expect to see the birth of SOFR-
based loans.
Meantime, the extension to remediate existing LIBOR-based loans
to mid-2023 means that the asset class has a nice long runway to
make a smooth transition.
30-Day Average SOFR
1-Month LIBOR
0.00%
0.25%
0.50%
0.75%
1.00%
1.25%
1.50%
1.75%
2.00%
2.25%
2.50%
2.75%
May2018
Sep2018
Jan2019
May2019
Sep2019
Jan2020
May2020
Sep2020
Jan2021
May2021
Sep2021
LIBOR vs SOFR

Floating-Rate Loan Market Monitor | Q3 2021
Sources: Eaton Vance, Citibank Velocity, Macrobond, LCD, an offering of S&P Global Market Intelligence, September 30, 2021. Past performance is not a reliable indicator of future results. Data provided is for
informational use only. All CLO data measures CLO tranches issued after the 2008 financial crisis. Loan data represented by the S&P/LSTA Leveraged Loan Index. US IG Corps represented by the ICE BofA US Corporate
Index 1-10 Year. US HY Corp represented by the ICE BofA US High Yield Index. EMD Sov represented by the J.P. Morgan EM Bond Index (EMBI) Global Diversified. Default and loss rates measure the S&P/LSTA Leveraged
Loan Index, with loss rates based on 65% recovery assumption.
24
Market update
Special topic: Collateralized Loan Obligations (CLOs)
Comparative Yields for BBB and BB tranches of CLOs
Illustrative capital structure for a US CLO
Credit RatingCredit
EnhancementCredit Spread
Average
Price
AAA 36% 80 – 120 $100.0
AA 25% 135 – 170 $99.8
A 17% 175 – 230 $99.7
BBB 13% 265 – 405 $99.0
BB 8% 575 – 800 $95.6
A Credit Support
BBB Credit Support
BB Credit Support
0%
2%
4%
6%
8%
10%
12%
14%
16%
18%
20%
199
9
200
1
200
3
200
5
200
7
200
9
201
1
201
3
201
5
201
7
201
9
202
1
Defa
ult a
nd
Lo
ss R
ate
CLO Tranche Support
Loss Rate Default Rate
4.6%
2.4% 2.3%
3.4%
8.3%
3.2% 3.2%
5.0%
0%
3%
6%
9%
CLO BBB US IG CorpBBB
US LoansBBB
EMD SovBBB
CLO BB US HYCorp BB
US LoansBB
EMD SovBB
Yie
ld t
o W
ors
t (%
)

Floating-Rate Loan Market Monitor | Q3 2021
Sources: Citibank Velocity and LCD, an offering of S&P Global Market Intelligence, September 30, 2021. Past performance is not a reliable indicator of future results. Data provided is for informational use only. All CLO
data measures CLO tranches issued after the 2008 financial crisis. Loans represented by the S&P/LSTA Leveraged Loan Index and show spread-to-maturity.
25
Market update
Special topic: Volatility of CLOs relative to underlying loans
0
200
400
600
800
1000
1200
1400
1600
1800
2000
2011 2012 2013 2014 2015 2016 2017 2018 2019 2020 2021
Spre
ad (
bps)
Post-Crisis CLO Spreads: A, BBB, BB vs. Loans
A BBB BB Loans

Portfolio Applications

Floating-Rate Loan Market Monitor | Q3 2021
Treasury
AggregateMBS
Investment Grade Corp.
Municipal
EM Sovereign (USD)
High-Yield Corp.Floating-Rate Loans1
0
1
2
3
4
5
6
0 1 2 3 4 5 6 7 8 9
Yie
ld to W
ors
t (%
)
Duration
Sources: Eaton Vance, Bloomberg, JPMorgan, ICE Data Indices, LLC, and LCD, an offering of S&P Global Market Intelligence, September 30, 2021. Past performance is not a reliable indicator of future results. Data
provided is for informational use only. It is not possible to invest directly in an Index. Yield to worst is the lowest potential yield that can be received on a bond without an issuer actually defaulting. Duration is a measure of the
sensitivity of a bond’s price to a change in interest rates. Treasury represented by Bloomberg U.S. Treasury Index. Agency represented by Bloomberg U.S. Agency Index. Aggregate represented by Bloomberg U.S. Aggregate
Index. MBS represented by Bloomberg U.S. Mortgage Backed Securities (MBS) Index. Investment-Grade Corp. represented by Bloomberg U.S. Corporate Index. Municipal represented by Bloomberg Municipal Bond Index. EM
Sovereign (USD) represented by J.P. Morgan EM Bond Index (EMBI) Global Diversified Index. High-Yield Corp. represented by Bloomberg U.S. Corporate High Yield Index. Floating-Rate Loans represented by S&P/LSTA
Leveraged Loan Index. 1Yield to maturity is shown for loans.
27
Portfolio applications
Loans among higher yielding asset classes with little duration

Floating-Rate Loan Market Monitor | Q3 2021
Source: Morningstar, September 30, 2021. Past performance is not a reliable indicator of future results. Data provided is for informational use only. It is not possible to invest directly in an Index. See end of material for
important additional information and disclosures. Correlation is a statistical measure of how two securities perform in relation to each other. Treasury represented by Bloomberg U.S. Treasury Index. Agency represented by
Bloomberg U.S. Agency Index. Aggregate represented by Bloomberg U.S. Aggregate Index. MBS represented by Bloomberg U.S. Mortgage Backed Securities (MBS) Index. Investment-Grade Corp. represented by
Bloomberg U.S. Corporate Index. Municipal represented by Bloomberg Municipal Bond Index. EM Sovereign (USD) represented by J.P. Morgan EM Bond Index (EMBI) Global Diversified Index. High-Yield Corp. represented
by Bloomberg U.S. Corporate High Yield Index. Floating-Rate Loans represented by S&P/LSTA Leveraged Loan Index.
28
Portfolio applications
Floating-rate structure key driver of negative correlation with bonds
1.00
0.890.82
0.550.49
0.10
-0.18
-0.33
-1.0
-0.8
-0.6
-0.4
-0.2
0.0
0.2
0.4
0.6
0.8
1.0
Treasury Aggregate MBS Municipal Investment-GradeCorp
EM Sovereign (USD) High-Yield Corp Floating-Rate Loans
Corr
ela
tio
n t
o 1
0-Y
ear
US
Tre
asurie
s

Floating-Rate Loan Market Monitor | Q3 2021
Sources: LCD, an offering of S&P Global Market Intelligence, Bloomberg, ICE Data Indices, LLC, J.P. Morgan, September 30, 2021. Past performance is not a reliable indicator of future results. Data provided is for
informational use only. Loans represents the S&P/LSTA Leveraged Loan Index. High-Yield Bonds presents the ICE BofA US High Yield Index. Emerging Markets represents the J.P. Morgan EMBI Global Diversified. US
Aggregate represents the Bloomberg US Aggregate Bond Index. 1Yield to maturity is shown for loans.
29
Portfolio applications
Loan yields are competitive with high-yield bonds and EM debt
Floating-Rate Loans4.19%1
High-Yield Bonds4.09%
Emerging Markets5.11%
US Aggregate1.56%
0%
2%
4%
6%
8%
10%
12%
'14 '15 '16 '17 '18 '19 '20 '21
Yie
ld to W
ors
t
Floating-Rate Loan Market Monitor | Q3 2021
Sources: Eaton Vance, Credit Suisse, Bloomberg, Federal Reserve, September 30, 2021. Past performance is not a reliable indicator of future results. Data provided is for informational use only. It is not possible to invest
directly in an Index. See end of report for important additional information. Loans are represented by Credit Suisse Institutional Leveraged Loan Index and bonds are represented by the Bloomberg U.S. Aggregate Index.
Analysis includes all rolling one-year periods since inception of Credit Suisse Institutional Leveraged Loan Index in 1992. Interest rate periods measures the year over year change in the fed funds rate.
30
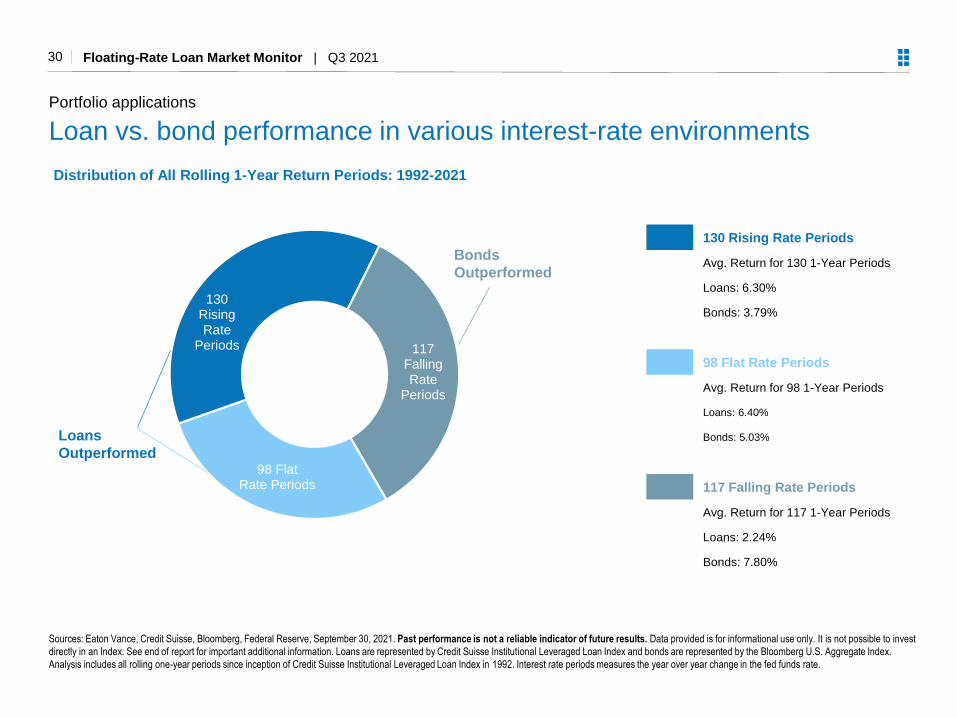
Portfolio applications
Loan vs. bond performance in various interest-rate environments
98 FlatRate Periods
130RisingRate
Periods 117 Falling Rate
Periods
Distribution of All Rolling 1-Year Return Periods: 1992-2021
Loans
Outperformed
Bonds
Outperformed
130 Rising Rate Periods
Avg. Return for 130 1-Year Periods
Loans: 6.30%
Bonds: 3.79%
98 Flat Rate Periods
Avg. Return for 98 1-Year Periods
Loans: 6.40%
Bonds: 5.03%
117 Falling Rate Periods
Avg. Return for 117 1-Year Periods
Loans: 2.24%
Bonds: 7.80%

Floating-Rate Loan Market Monitor | Q3 2021
Sources: LCD, an offering of S&P Global Market Intelligence, Bloomberg, Federal Reserve, Eaton Vance, September 30, 2021. Past performance is not a reliable indicator of future results. Data provided is for
informational use only. It is not possible to invest directly in an Index. See end of report for important additional information. Loans are represented by S&P/LSTA Leveraged Loan Index and bonds are represented by the
Bloomberg U.S. Aggregate Index. Analysis includes all rolling 12-month periods since inception of S&P/LSTA Leveraged Loan Index in 1997.
31
Portfolio applications
Performance tendencies: Historical relationship of loans to bonds
0%
1%
2%
3%
4%
5%
6%
7%
8%
-50%
-40%
-30%
-20%
-10%
0%
10%
20%
30%
40%
50%
1997
1998
1999
2000
2001
2002
2003
2004
2005
2006
2007
2008
2009
2010
2011
2012
2013
2014
2015
2016
2017
2018
2019
2020
5-Y
ear
Tre
asury
Yie
ld
Loans v
s B
onds E
xcess R
etu
rn
Loan Index vs Bond Index (12-Month Relative Rolling Returns)
Differential 5Y Treasury Yield
Bonds Outperform
Loans Outperform
2021

About Eaton Vance

Floating-Rate Loan Market Monitor | Q3 202133
Measurable track record since 1989
Significant floating-rate loan investment
resources and specialization
Extensive contiguous experience of
investment team
Long-term record of delivering incremental
outperformance with lower volatility than the
S&P/LSTA Leveraged Loan Index
Continuity of philosophy, process and team
over time
Systematic risk-weighted portfolio
construction underpinned by bottom-up
credit research
Source: eVestment, December 31, 2020. Past performance is not a reliable indicator of future results. Data provided is for informational use only. It is not possible to invest directly in an Index. See end of material for
important additional information and disclosures. Based on eVestment Floating-Rate Bank Loan Fixed Income universe using oldest investment offering for each firm.
Eaton Vance for floating-rate loans
The advantage of Eaton Vance’s experience
Median13 Years
0 5 10 15 20 25 30 35
Eaton Vance (1989) Competitor Floating-Rate Loan Managers
Eaton Vance
(Since 1989)

Floating-Rate Loan Market Monitor | Q3 202134
Eaton Vance for floating-rate loans
Investment team with extensive contiguous experience
Employee data and tenure as of September 30, 2021. **Rejoining the firm on November 1, 2021.
TEAM LEADERSHIP
Andrew Sveen, CFACo-Director, Portfolio Manager
26 Years of Experience
22 Years at the Firm
Craig RussCo-Director, Portfolio Manager
35 Years of Experience
24 Years at the Firm
CREDIT RESEARCH TRADING
John ReddingPortfolio Manager
36 Years of Experience
23 Years at the Firm
Ralph Hinckley, CFASenior Credit Analyst, Portfolio Manager
24 Years of Experience
18 Years at the Firm
Catherine McDermottSenior Credit Analyst, Portfolio Manager
33 Years of Experience
20 Years at the Firm
Michael Turgel, CFASenior Credit Analyst, Portfolio Manager
18 Years of Experience
15 Years at the Firm
Jake Lemle, CFADirector of Loan Trading & Capital Markets
14 Years of Experience
14 Years at the Firm
Audrey Grant**Credit Analyst
5 Years of Experience
5 Years at the Firm
Jeff Hesselbein, CFASenior Credit Analyst, Portfolio Manager
24 Years of Experience
21 Years at the Firm
Heath Christensen, CFASenior Credit Analyst, Portfolio Manager
22 Years of Experience
18 Years at the Firm
Brian Hickey, CFASenior Credit Analyst
24 Years of Experience
1 Year at the Firm
Kathryn ThompsonTrader
9 Years of Experience
2 Years at the Firm
Sarah ChoiSenior Credit Analyst
14 Years of Experience
1 Years at the Firm
William Holt, CFASenior Credit Analyst, Portfolio Manager
19 Years of Experience
16 Years at the Firm
Daniel McElaney, CFASenior Credit Analyst, Portfolio Manager
18 Years of Experience
16 Years at the Firm
Christopher ReeseTrader
3 Years of Experience
<1 Year at the Firm
Ellen GreenResearch Associate
2 Years of Experience
2 Years at the Firm
Anna GribovskySenior Credit Analyst
13 Years of Experience
8 Years at the Firm
Anish GuhaAssociate Credit Analyst
3 Years of Experience
3 Years at the Firm
Elizabeth McDonoughTrading Associate
7 Years of Experience
7 Years at the Firm
Erik ManditchAssociate Credit Analyst
3 Years of Experience
3 Years at the Firm
Jimmy JiangResearch Associate
1 Year of Experience
1 Year at the Firm
STRUCTURED PRODUCTSPRODUCT & PORTFOLIO
STRATEGY
Michael Kinahan, CFAHead of Structured Products
34 Years of Experience
23 Years at the Firm
Christopher RemingtonInstitutional Portfolio Manager
20 Years of Experience
13 Years at the Firm
Matt Sosland, CFALead CLO Portfolio Manager
24 Years of Experience
1 Year at the Firm
John BrodbineSenior Structured Portfolio Analyst
20 Years of Experience
17 Years at the Firm
Edward Greenaway, CFASenior Structured Portfolio Analyst,
Portfolio Manager
15 Years of Experience
13 Years at the Firm
April FengStructuring & Tranche Investing
11 Years of Experience
1 Year at the Firm
Robert Holmes, CFASenior Income Portfolio Specialist
9 Years of Experience
9 Years at the Firm
Karthik ShankarSenior Structured Portfolio Analyst
26 Years of Experience
13 Years at the Firm
Phil DillonSenior Structured Portfolio Analyst
11 Years of Experience
1 Year at the Firm
Stephen MonradStructured Portfolio Associate
2 Years of Experience
2 Years at the Firm
CREDIT ADVISORY OPERATIONS
Patrick DanielloCredit Advisory
33 Years of Experience
2 Years at the Firm
Michael BotthofDirector of Bank Loan Operations
31 Years of Experience
24 Years at the Firm
6 Operations/Compliance Professionals

Additional Information

Floating-Rate Loan Market Monitor | Q3 2021
INDEX DEFINITIONS:
Bloomberg Global Aggregate Ex-USD Index is a broad-based measure of
global investment grade fixed-rate debt investments, excluding USD-
denominated debt.
Bloomberg Municipal Bond Index is an unmanaged index of municipal bonds
traded in the U.S.
Bloomberg U.S. Agency Index measures agency securities issued by U.S
government agencies, quasi-federal corporations, and corporate or foreign debt
guaranteed by the U.S. government.
Bloomberg U.S. Aggregate Index is an unmanaged index of domestic
investment-grade bonds, including corporate, government and mortgage-backed
securities.
Bloomberg U.S. Corporate Index is an unmanaged index that measures the
performance of investment-grade corporate securities within the Bloomberg U.S.
Aggregate Index.
Bloomberg U.S. Mortgage Backed Securities (MBS) Index measures agency
mortgage-backed pass-through securities issued by GNMA, FNMA, and FHLMC.
Bloomberg U.S. Treasury Index measures public debt instruments issued by
the U.S. Treasury.
Credit Suisse Institutional Leveraged Loan Index is an unmanaged index of
the institutional leveraged loan market.
JPMorgan Emerging Markets Bond Index Plus (EMBI+) is a market-cap
weighted index that measures USD-denominated Brady Bonds, Eurobonds, and
traded loans issued by sovereigns.
Standard & Poor’s 500 Index is an unmanaged index of large-cap stocks
commonly used as a measure of U.S. stock market performance.
S&P/LSTA Leveraged Loan Index is an unmanaged index of the institutional
leveraged loan market.
36
ABOUT RISK:
Floating-Rate Loans: An imbalance in supply and demand in the income
market may result in valuation uncertainties and greater volatility, less
liquidity, widening credit spreads and a lack of price transparency in the
market. There can be no assurance that the liquidation of collateral
securing an investment will satisfy the issuer’s obligation in the event of
nonpayment or that collateral can be readily liquidated. The ability to
realize the benefits of any collateral may be delayed or limited.
Investments in income securities may be affected by changes in the
creditworthiness of the issuer and are subject to the risk of non–payment
of principal and interest. The value of income securities also may decline
because of real or perceived concerns about the issuer’s ability to make
principal and interest payments. Borrowing to increase investments
(leverage) will exaggerate the effect of any increase or decrease in the
value of investments. Investments rated below investment grade (typically
referred to as “junk”) are generally subject to greater price volatility and
illiquidity than higher rated investments. As interest rates rise, the value of
certain income investments is likely to decline. Bank loans are subject to
prepayment risk. Investments in foreign instruments or currencies can
involve greater risk and volatility than U.S. investments because of
adverse market, economic, political, regulatory, geopolitical or other
conditions. Changes in the value of investments entered for hedging
purposes may not match those of the position being hedged.
Duration – Securities with longer durations tend to be more sensitive to
interest rate changes than securities with shorter durations. Equity –
Equity investment values are sensitive to stock market volatility. Gov’t
Agency – While certain U.S. Government-sponsored agencies may be
chartered or sponsored by acts of Congress, their securities are neither
issued nor guaranteed by the U.S. Treasury. Maturity – Longer-term bonds
typically are more sensitive to interest rate changes than shorter-term
bonds. Prepayment – MBS – Mortgage-backed securities are subject to
prepayment risk. Smaller Companies – Smaller companies are generally
subject to greater price fluctuations, limited liquidity, higher transaction
costs and higher investment risk than larger, established companies.
Important information and disclosure
Floating-Rate Loan Market Monitor | Q3 202137
ABOUT ASSET CLASS COMPARISONS:
Elements of this report include comparisons of different asset classes, each of which has distinct risk and return characteristics. Every investment carries risk, and
principal values and performance will fluctuate with all asset classes shown, sometimes substantially. Asset classes shown are not insured by the FDIC and are
not deposits or other obligations of, or guaranteed by, any depository institution. All asset classes shown are subject to risks, including possible loss of principal
invested.
The principal risks involved with investing in the asset classes shown are interest-rate risk, credit risk and liquidity risk, with each asset class shown offering a
distinct combination of these risks. Generally, considered along a spectrum of risks and return potential, U.S. Treasury securities (which are guaranteed as to the
payment of principal and interest by the U.S. government) offer lower credit risk, higher levels of liquidity, higher interest-rate risk and lower return potential,
whereas asset classes such as high-yield corporate bonds and emerging market bonds offer higher credit risk, lower levels of liquidity, lower interest-rate risk and
higher return potential. Other asset classes shown carry different levels of each of these risk and return characteristics, and as a result generally fall varying
degrees along the risk/return spectrum.
Costs and expenses associated with investing in asset classes shown will vary, sometimes substantially, depending upon specif ic investment vehicles chosen. No
investment in the asset classes shown is insured or guaranteed, unless explicitly stated for a specific investment vehicle. Interest income earned on asset classes
shown is subject to ordinary federal, state and local income taxes, excepting U.S. Treasury securities (exempt from state and local income taxes) and municipal
securities (exempt from federal income taxes, with certain securities exempt from federal, state and local income taxes). In addition, federal and/or state capital
gains taxes may apply to investments that are sold at a profit. Eaton Vance does not provide tax or legal advice. Prospective investors should consult with a tax or
legal advisor before making any investment decision.
ICE BofA Indexes: Unless otherwise stated, index returns do not reflect the effect of any applicable sales charges, commissions, expenses, taxes or leverage, as
applicable. It is not possible to invest directly in an index. Historical performance of indexes illustrates market trends and does not represent the past or future
performance of any fund. ICE BofA™ indices not for redistribution or other uses; provided "as is", without warranties, and with no liability. Eaton Vance has
prepared this report, ICE BofA does not endorse it, or guarantee, review, or endorse Eaton Vance's products.
Credit ratings that may be referenced are based on Moody's, S&P or Fitch, as applicable. Credit ratings are based largely on the rating agency's investment
analysis at the time of rating and the rating assigned to any particular security is not necessarily a reflection of the issuer's current financial condition. The rating
assigned to a security by a rating agency does not necessarily reflect its assessment of the volatility of a security's market value or of the liquidity of an investment
in the security. Ratings of BBB or higher by Standard and Poor's or Fitch (Baa or higher by Moody's) are considered to be investment grade quality.
Important information and disclosure

Floating-Rate Loan Market Monitor | Q3 202138
Important additional information and disclosureSource of all data: Eaton Vance, as at September 30, 2021, unless otherwise specified.
This material is presented for informational and illustrative purposes only. This material
should not be construed as investment advice, a recommendation to purchase or sell
specific securities, or to adopt any particular investment strategy; it has been prepared
on the basis of publicly available information, internally developed data and other third-
party sources believed to be reliable. However, no assurances are provided regarding
the reliability of such information and Eaton Vance has not sought to independently
verify information taken from public and third-party sources. Investment views, opinions,
and/or analysis expressed constitute judgments as of the date of this material and are
subject to change at any time without notice. Different views may be expressed based
on different investment styles, objectives, opinions or philosophies. This material may
contain statements that are not historical facts, referred to as forward-looking
statements. Future results may differ significantly from those stated in forward-looking
statements, depending on factors such as changes in securities or financial markets or
general economic conditions.
This material is for the benefit of persons whom Eaton Vance reasonably believes it is
permitted to communicate to and should not be forwarded to any other person without
the consent of Eaton Vance. It is not addressed to any other person and may not be
used by them for any purpose whatsoever. It expresses no views as to the suitability of
the investments described herein to the individual circumstances of any recipient or
otherwise. It is the responsibility of every person reading this document to satisfy himself
as to the full observance of the laws of any relevant country, including obtaining any
governmental or other consent which may be required or observing any other formality
which needs to be observed in that country. Unless otherwise stated, returns and market
values contained herein are presented in US Dollars.
In the EU this material is issued by MSIM Fund Management (Ireland) Limited (“MSIM
FMIL”) registered in the Republic of Ireland with Registered Office at 7-11 Sir John
Rogerson's Quay, Dublin 2, D02 VC42, Ireland. MSIM FMIL is regulated by the Central
Bank of Ireland with Company Number: 616661.
Outside of the US and EU, this material is issued by Eaton Vance Management
(International) Limited (“EVMI”) 125 Old Broad Street, London, EC2N 1AR, UK, and is
which is authorised and regulated in the United Kingdom by the Financial Conduct
Authority.
This material is only intended for and will only be distributed to persons resident in
jurisdictions where such distribution or availability would not be contrary to local laws or
regulations.
EVMI/MSIM FMIL markets the services of the following strategic affiliates: Eaton Vance
Management ("EVM"), Eaton Vance Advisers International Ltd (“EVAIL”), Parametric
Portfolio Associates® LLC ("PPA"), Calvert Research and Management (“CRM”), and
Atlanta Capital Management Company LLC ("Atlanta "). EVM, EVAIL, PPA, CRM and
Atlanta are SEC registered investment advisor and are part of Morgan Stanley
Investment Management, the asset management division of Morgan Stanley.
This material is for Professional Clients/Accredited Investors only.
This material does not constitute an offer to sell or the solicitation of an offer to buy any
services referred to expressly or impliedly in the material in the People's Republic of
China (excluding Hong Kong, Macau and Taiwan, the "PRC") to any person to whom it is
unlawful to make the offer or solicitation in the PRC.
The material may not be provided, sold, distributed or delivered, or provided or sold or
distributed or delivered to any person for forwarding or resale or redelivery, in any such
case directly or indirectly, in the People's Republic of China (the PRC, excluding Hong
Kong, Macau and Taiwan) in contravention of any applicable laws.
In Singapore, Eaton Vance Management International (Asia) Pte. Ltd. (“EVMIA”) holds a
Capital Markets Licence under the Securities and Futures Act of Singapore (“SFA”) to
conduct, among others, fund management, is an exempt Financial Adviser pursuant to
the Financial Adviser Act Section 23(1)(d) and is regulated by the Monetary Authority of
Singapore (“MAS”). Eaton Vance Management, Eaton Vance Management
(International) Limited and Parametric Portfolio Associates® LLC holds an exemption
under Paragraph 9, 3rd Schedule to the SFA in Singapore to conduct fund management
activities under an arrangement with EVMIA and subject to certain conditions.
In Australia, EVMI is exempt from the requirement to hold an Australian financial
services license under the Corporations Act in respect of the provision of financial
services to wholesale clients as defined in the Corporations Act 2001 (Cth) and as per
the ASIC Corporations (Repeal and Transitional) Instrument 2016/396.
EVMI is registered as a Discretionary Investment Manager in South Korea pursuant to
Article 18 of Financial Investment Services and Capital Markets Act of South Korea.
Morgan Stanley Investment Management (“MSIM”) (the asset management division of
Morgan Stanley (NYSE: MS)) and its affiliates have arrangements in place to market
each other’s products and services. Each MSIM affiliate is regulated as appropriate in
the jurisdiction it operates. Please refer to the MSIM ADVs for details of affiliates.
In the United States:
Eaton Vance Management is an SEC –registered investment advisor and part of Morgan
Stanley Investment Management, the asset management division of Morgan Stanley.
Eaton Vance Distributors, Inc. (“EVD”), Two International Place, Boston, MA 02110,
(800) 225-6265. Member of FINRA/ SIPC.
Eaton Vance WaterOak Advisors. Two International Place, Boston, MA 02110. Eaton
Vance WaterOak is an SEC-registered investment advisor and part of Morgan Stanley
Investment Management, the asset management division of Morgan Stanley.
Investing entails risks and there can be no assurance that Eaton Vance will
achieve profits or avoid incurring losses. It is not possible to invest directly in an
index. Past performance is not a reliable indicator of future results.

6140 | 10.06.2021
About Eaton Vance
Eaton Vance is part of Morgan Stanley Investment Management, the asset management division of Morgan Stanley. It provides advanced investment strategies and wealth management solutions to
forward-thinking investors around the world. Through its distinct investment brands Eaton Vance Management, Parametric, Atlanta Capital and Calvert, the Company offers a diversity of investment
approaches, encompassing bottom-up fundamental active management, responsible investing, systematic investing and customized implementation of client-specified portfolio exposures. Exemplary
service, timely innovation and attractive returns across market cycles have been hallmarks of Eaton Vance since 1924.
For more information or to subscribe
for updates visit
eatonvance.com
Eaton VanceTwo International PlaceBoston, MA 02110800 225 6265617 482 8260eatonvance.com
@2021 Eaton Vance Management
For more information, please contact:
:
Eaton Vance Management
(International) Limited
125 Old Broad Street, London,
EC2N 1AR, United Kingdom
+44 (0)203 207 1900
eatonvance.co.uk
MSIM Fund Management (Ireland) Limited
7-11 Sir John Rogerson's Quay
Dublin 2, D02 VC42, Ireland
+353 1 799 8700
Eaton Vance Management
International (Asia) Pte. Ltd.
8 Marina View, 13–01 Asia Square Tower
1, Singapore 018960
+65 6713 9241
eatonvance.sg
Eaton Vance Management
(International) Limited
Suite 05, Level 25, 259 George Street
Sydney NSW 2000 Australia
+61 2 8229 0200
eatonvance.com.au
NOT FDIC INSURED | OFFER NO BANK GUARANTEE | MAY LOSE VALUE | NOT INSURED BY ANY FEDERAL GOVERNMENT AGENCY | NOT A DEPOSIT