flight safety digest july 2001
TRANSCRIPT

F L I G H T S A F E T Y F O U N D A T I O N
FLIGHT SAFETY
F L I G H T S A F E T Y F O U N D A T I O N
JULY 2001
D I G E S T
An Analysis of theSafety Performance ofAir Cargo Operators
SINCE 1947SINCE 1947

FLIGHT SAFETY FOUNDATIONFor Everyone Concerned With the Safety of Flight
Officers and StaffCarl W. Vogt
Chairman, Board of Governors
Stuart MatthewsPresident and CEO
Robert H. VandelExecutive Vice President
James S. Waugh Jr.Treasurer
ADMINISTRATIVE
Ellen PlaugherExecutive Assistant
Linda Crowley HorgerManager, Support Services
FINANCIAL
Crystal N. PhillipsDirector of Finance and Administration
TECHNICAL
James BurinDirector of Technical Programs
Joanne AndersonTechnical Programs Specialist
Louis A. Sorrentino IIIManaging Director of Internal Evaluation Programs
Robert FeelerQ-Star Program Administrator
Robert Dodd, Ph.D.Manager, Data Systems and Analysis
Darol V. HolsmanManager of Aviation Safety Audits
MEMBERSHIP
Ann HillDirector, Membership and Development
Kim GranadosMembership Manager
Ahlam WahdanMembership Services Coordinator
PUBLICATIONS
Roger RozelleDirector of Publications
Mark LacagninaManaging Editor
Wayne RosenkransSenior Editor
Linda WerfelmanSenior Editor
Karen K. EhrlichWeb and Print Production Coordinator
Ann L. MullikinProduction Designer
Susan D. ReedProduction Specialist
Patricia SetzeLibrarian, Jerry Lederer Aviation Safety Library
Jerome LedererPresident Emeritus
Flight Safety Foundation is an international membership organizationdedicated to the continuous improvement of aviation safety. Nonprofit andindependent, the Foundation was launched officially in 1947 in response tothe aviation industry’s need for a neutral clearinghouse to disseminate objectivesafety information, and for a credible and knowledgeable body that wouldidentify threats to safety, analyze the problems and recommend practicalsolutions to them. Since its beginning, the Foundation has acted in the publicinterest to produce positive influence on aviation safety. Today, the Foundationprovides leadership to more than 830 member organizations in more than 150countries.
Flight Safety DigestVol. 20 No. 7 July 2001
In This IssueAn Analysis of the Safety PerformanceOf Air Cargo OperatorsNighttime operations and an aging aircraft fleet are amongfactors affecting the safety of cargo operations worldwide.Data from 1970 through June 1999 show that accidents duringtakeoff and climb occur more frequently in cargo operationsthan in passenger operations.
Five Accidents on Takeoff and InitialClimb in 2000 Involved Western-builtLarge Commercial JetsBoeing data also show that, during the decade that ended in2000, 17 percent of all accidents involving Western-built largecommercial jets — and 16 percent of fatalities — occurredduring takeoff and initial climb.
U.K. CAA Document ProvidesInformation on Developing SafetyManagement SystemsGuidance from the regulatory authority and the civil aviationindustry includes recommendations for civil aviation transportoperations and maintenance activities.
Landing Gear SeparatesFrom Fuselage After TouchdownThe flight crew of the Fokker 100 said that the separationoccurred after a stable approach and a normal touchdown.
1
21
17
19
Cover photograph: © Copyright 2001 PhotoDisc, Inc.

FLIGHT SAFETY FOUNDATION • FLIGHT SAFETY DIGEST • JULY 2001 1
An Analysis of the Safety PerformanceOf Air Cargo Operators
Aviation authorities in Europe perform SAFA inspections(ramp checks) of aircraft operated by non-Europeancompanies. SAFA inspections include determinations ofcompliance with specific International Civil AviationOrganization (ICAO) standards.
Characteristics of Cargo Operations
Definitions
Cargo operations, for the purpose of this study, were definedas flights in which no fare-paying passengers are carried; theflights are conducted primarily for the purpose of carryingcargo (including mail).
Passenger operations were defined as flights conducted withaircraft that are equipped primarily for the transportation offare-paying passengers — that is, the cabin does not containany significant cargo area (generally, however, some cargo willbe carried in the cargo section of the aircraft).
Combi flights — flights conducted with aircraft in which thecabin is partially equipped to carry cargo and partially equippedto carry fare-paying passengers — were excluded from thestudy because of their relative infrequency (less than 1 percentof all scheduled flights).
Nighttime operations and an aging aircraft fleet are among factors affectingthe safety of cargo operations worldwide. Data from 1970 through June 1999
show that accidents during takeoff and climb occur more frequentlyin cargo operations than in passenger operations.
A.L.C. RoelenA.J. Pikaar
W. Ovaa
Introduction
A previous study by the National Aerospace Laboratory(NLR)–Netherlands and the U.K. Civil Aviation Authority(CAA) indicated that cargo operators have a disproportionatelyhigh number of accidents.1 Because of the limited scope ofthe study, the accident rates for different categories of cargooperations were not calculated. Calculation of accident ratesrequires accurate information on flight activity, such as thetotal number of flights conducted. Many flights conducted bycargo operators are unscheduled, and obtaining accurateinformation on the number of unscheduled flights that takeplace around the globe is difficult. In this study, an innovativemethod — based on using flight-cycle information forindividual aircraft — was used to determine accurately thenumber of unscheduled flights that are being conducted.
This study focused on the quantification of the accident ratesof different categories of cargo operations and the factors thatinfluence the safety of cargo operations.
The study also examined whether results of inspectionsconducted in the Netherlands under the Joint AviationAuthorities (JAA) Safety Assessment of Foreign Aircraft(SAFA) program can provide additional insight into the causesof the relatively high accident rates among air cargo operations.
2 FLIGHT SAFETY FOUNDATION • FLIGHT SAFETY DIGEST • JULY 2001
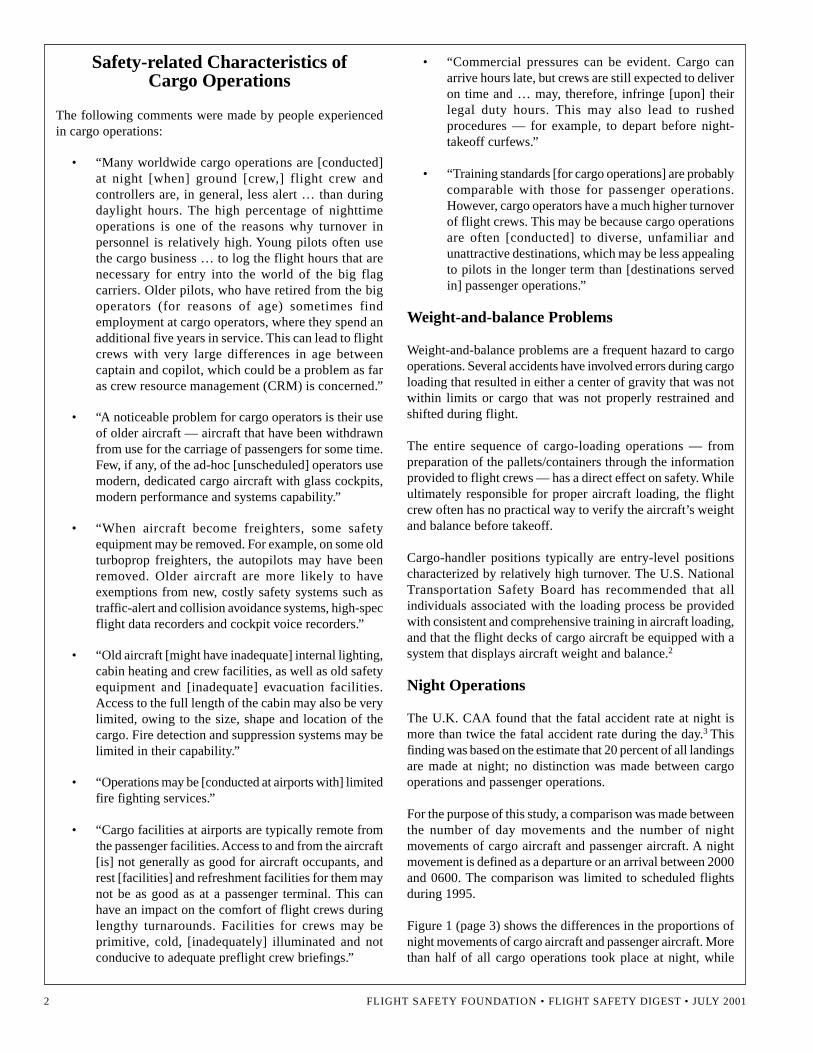
Safety-related Characteristics ofCargo Operations
The following comments were made by people experiencedin cargo operations:
• “Many worldwide cargo operations are [conducted]at night [when] ground [crew,] flight crew andcontrollers are, in general, less alert … than duringdaylight hours. The high percentage of nighttimeoperations is one of the reasons why turnover inpersonnel is relatively high. Young pilots often usethe cargo business … to log the flight hours that arenecessary for entry into the world of the big flagcarriers. Older pilots, who have retired from the bigoperators (for reasons of age) sometimes findemployment at cargo operators, where they spend anadditional five years in service. This can lead to flightcrews with very large differences in age betweencaptain and copilot, which could be a problem as faras crew resource management (CRM) is concerned.”
• “A noticeable problem for cargo operators is their useof older aircraft — aircraft that have been withdrawnfrom use for the carriage of passengers for some time.Few, if any, of the ad-hoc [unscheduled] operators usemodern, dedicated cargo aircraft with glass cockpits,modern performance and systems capability.”
• “When aircraft become freighters, some safetyequipment may be removed. For example, on some oldturboprop freighters, the autopilots may have beenremoved. Older aircraft are more likely to haveexemptions from new, costly safety systems such astraffic-alert and collision avoidance systems, high-specflight data recorders and cockpit voice recorders.”
• “Old aircraft [might have inadequate] internal lighting,cabin heating and crew facilities, as well as old safetyequipment and [inadequate] evacuation facilities.Access to the full length of the cabin may also be verylimited, owing to the size, shape and location of thecargo. Fire detection and suppression systems may belimited in their capability.”
• “Operations may be [conducted at airports with] limitedfire fighting services.”
• “Cargo facilities at airports are typically remote fromthe passenger facilities. Access to and from the aircraft[is] not generally as good for aircraft occupants, andrest [facilities] and refreshment facilities for them maynot be as good as at a passenger terminal. This canhave an impact on the comfort of flight crews duringlengthy turnarounds. Facilities for crews may beprimitive, cold, [inadequately] illuminated and notconducive to adequate preflight crew briefings.”
• “Commercial pressures can be evident. Cargo canarrive hours late, but crews are still expected to deliveron time and … may, therefore, infringe [upon] theirlegal duty hours. This may also lead to rushedprocedures — for example, to depart before night-takeoff curfews.”
• “Training standards [for cargo operations] are probablycomparable with those for passenger operations.However, cargo operators have a much higher turnoverof flight crews. This may be because cargo operationsare often [conducted] to diverse, unfamiliar andunattractive destinations, which may be less appealingto pilots in the longer term than [destinations servedin] passenger operations.”
Weight-and-balance Problems
Weight-and-balance problems are a frequent hazard to cargooperations. Several accidents have involved errors during cargoloading that resulted in either a center of gravity that was notwithin limits or cargo that was not properly restrained andshifted during flight.
The entire sequence of cargo-loading operations — frompreparation of the pallets/containers through the informationprovided to flight crews — has a direct effect on safety. Whileultimately responsible for proper aircraft loading, the flightcrew often has no practical way to verify the aircraft’s weightand balance before takeoff.
Cargo-handler positions typically are entry-level positionscharacterized by relatively high turnover. The U.S. NationalTransportation Safety Board has recommended that allindividuals associated with the loading process be providedwith consistent and comprehensive training in aircraft loading,and that the flight decks of cargo aircraft be equipped with asystem that displays aircraft weight and balance.2
Night Operations
The U.K. CAA found that the fatal accident rate at night ismore than twice the fatal accident rate during the day.3 Thisfinding was based on the estimate that 20 percent of all landingsare made at night; no distinction was made between cargooperations and passenger operations.
For the purpose of this study, a comparison was made betweenthe number of day movements and the number of nightmovements of cargo aircraft and passenger aircraft. A nightmovement is defined as a departure or an arrival between 2000and 0600. The comparison was limited to scheduled flightsduring 1995.
Figure 1 (page 3) shows the differences in the proportions ofnight movements of cargo aircraft and passenger aircraft. Morethan half of all cargo operations took place at night, while

FLIGHT SAFETY FOUNDATION • FLIGHT SAFETY DIGEST • JULY 2001 3
only about one-fifth of all passenger operations took place atnight.
A U.S. National Aeronautics and Space Administration reporton the effects of night operations concluded that flying at nightpresents a number of physiological challenges that are notpresent in comparable daytime operations.4 The physiologicalchallenges can cause lower performance. The report said thatthe quality of daytime sleep obtained by overnight cargocrewmembers is inferior to the quality of sleep obtained bycrewmembers who sleep at night. In addition, factors such asrestricted visibility, loss of depth perception and loss of visualacuity affect the safety of night operations.
Fleet Characteristics
Figure 2 shows the average fleet-age history for 1980–1998for cargo aircraft and for passenger aircraft built in theCommonwealth of Independent States (CIS). The fleet includesjet aircraft and turboprop aircraft. The average age of bothcargo aircraft and passenger aircraft increased fromapproximately 10 years to 20 years.
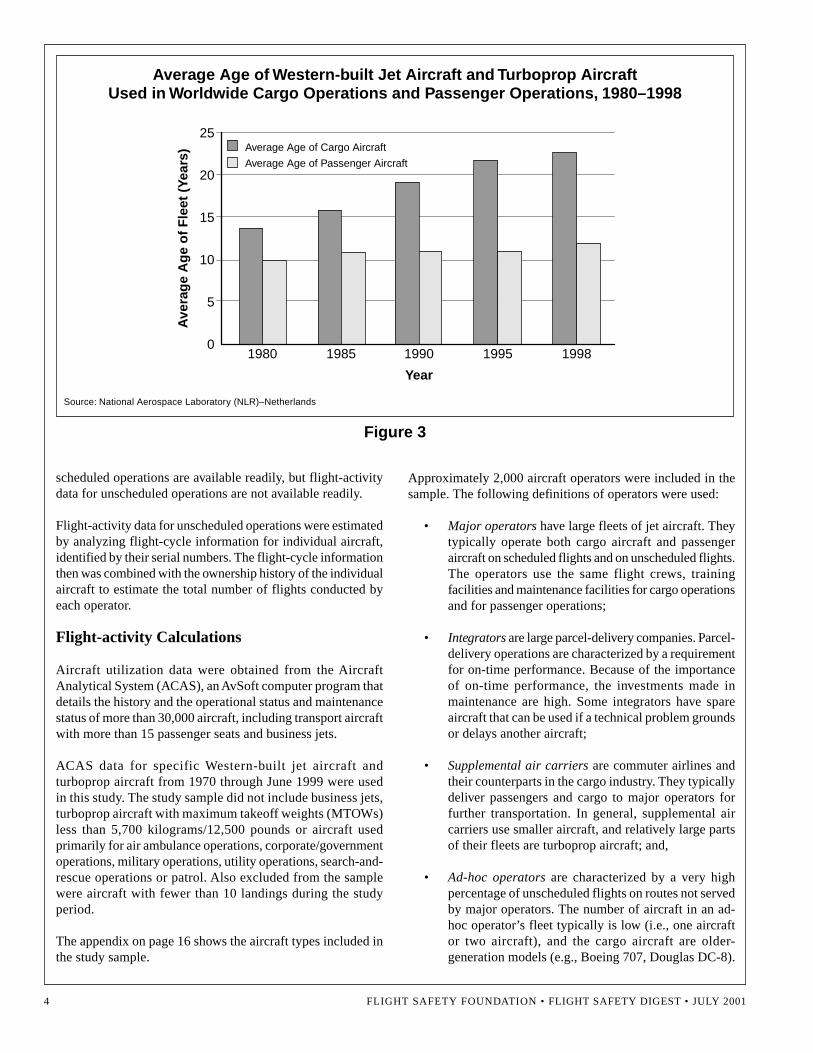
Figure 3 (page 4) shows the average fleet-age history for1980–1998 for Western-built cargo aircraft and passengeraircraft. The fleet includes jet aircraft and turboprop aircraft.The average age of cargo aircraft increased steadily from 14years to 22 years, whereas the average age of passengeraircraft remained relatively constant at approximately 10years.
A comparison of Western-built aircraft flight cycles and design-life information indicates that, on average, jet cargo aircrafthave been utilized for 50 percent of the original design life inflight cycles and that jet passenger aircraft have been utilizedfor 33 percent of the original design life in flight cycles.5 (Theoriginal design-lives for many aircraft have been adjusted toincrease their service lives.)
Calculating Accident Rates
Method
To calculate an accident rate, the number of accidents and flightactivity, such as the total number of flights conducted duringa specific period, must be known. Flight-activity data for
Aircraft Movements in ScheduledOperations by Time of Day, 1995
Night55%
Day45%
Night18%
Day82%
Cargo Operations Passenger Operations
Source: National Aerospace Laboratory (NLR)–Netherlands
Figure 1
Average Age of CIS-built Jet Aircraft and Turboprop AircraftUsed in Worldwide Cargo Operations and Passenger Operations, 1980–1998
CIS = Commonwealth of Independent States
Source: National Aerospace Laboratory (NLR)–Netherlands
Figure 2
1980 1985 1990 1995 1998
Year
Ave
rag
e A
ge
of
Fle
et (
Year
s)
25
20
15
10
5
0
Average Age of Cargo Aircraft
Average Age of Passenger Aircraft
4 FLIGHT SAFETY FOUNDATION • FLIGHT SAFETY DIGEST • JULY 2001
scheduled operations are available readily, but flight-activitydata for unscheduled operations are not available readily.
Flight-activity data for unscheduled operations were estimatedby analyzing flight-cycle information for individual aircraft,identified by their serial numbers. The flight-cycle informationthen was combined with the ownership history of the individualaircraft to estimate the total number of flights conducted byeach operator.
Flight-activity Calculations
Aircraft utilization data were obtained from the AircraftAnalytical System (ACAS), an AvSoft computer program thatdetails the history and the operational status and maintenancestatus of more than 30,000 aircraft, including transport aircraftwith more than 15 passenger seats and business jets.
ACAS data for specific Western-built jet aircraft andturboprop aircraft from 1970 through June 1999 were usedin this study. The study sample did not include business jets,turboprop aircraft with maximum takeoff weights (MTOWs)less than 5,700 kilograms/12,500 pounds or aircraft usedprimarily for air ambulance operations, corporate/governmentoperations, military operations, utility operations, search-and-rescue operations or patrol. Also excluded from the samplewere aircraft with fewer than 10 landings during the studyperiod.
The appendix on page 16 shows the aircraft types included inthe study sample.
Approximately 2,000 aircraft operators were included in thesample. The following definitions of operators were used:
• Major operators have large fleets of jet aircraft. Theytypically operate both cargo aircraft and passengeraircraft on scheduled flights and on unscheduled flights.The operators use the same flight crews, trainingfacilities and maintenance facilities for cargo operationsand for passenger operations;
• Integrators are large parcel-delivery companies. Parcel-delivery operations are characterized by a requirementfor on-time performance. Because of the importanceof on-time performance, the investments made inmaintenance are high. Some integrators have spareaircraft that can be used if a technical problem groundsor delays another aircraft;
• Supplemental air carriers are commuter airlines andtheir counterparts in the cargo industry. They typicallydeliver passengers and cargo to major operators forfurther transportation. In general, supplemental aircarriers use smaller aircraft, and relatively large partsof their fleets are turboprop aircraft; and,
• Ad-hoc operators are characterized by a very highpercentage of unscheduled flights on routes not servedby major operators. The number of aircraft in an ad-hoc operator’s fleet typically is low (i.e., one aircraftor two aircraft), and the cargo aircraft are older-generation models (e.g., Boeing 707, Douglas DC-8).
Average Age of Western-built Jet Aircraft and Turboprop AircraftUsed in Worldwide Cargo Operations and Passenger Operations, 1980–1998
1980 1985 1990 1995 1998
Year
Ave
rag
e A
ge
of
Fle
et (
Year
s)
25
20
15
10
5
0
Average Age of Cargo Aircraft
Average Age of Passenger Aircraft
Source: National Aerospace Laboratory (NLR)–Netherlands
Figure 3

FLIGHT SAFETY FOUNDATION • FLIGHT SAFETY DIGEST • JULY 2001 5
Most ad-hoc passenger operations are conducted duringholiday seasons.
The ACAS database includes, for each aircraft, the total numberof flights for the period that a specific operator owned theaircraft. Consequently, for aircraft whose ownership beganbefore 1970 and ended after 1970, the number of flights after1970 were estimated for this study by assuming that aircraftutilization (number of flights per day) was constant for a givenaircraft/ownership combination.
Utilization data for several aircraft — typically, older aircraft(e.g., Aerospatiale Caravelle, Boeing 707) operated by smallcompanies on an ad-hoc basis — are not included in the ACASdatabase. Deleting these aircraft from the study sample mighthave resulted in the calculation of incorrect accident rates;therefore, the number of flights conducted in these aircraftwas estimated based on the average utilization of the aircraftin the ACAS database.
Table 1 shows average aircraft utilization (i.e., flights per day)by the various operators.
Table 2 shows total aircraft utilization (i.e., total flights) bythe various operators. Integrators are, by definition, cargooperators. The small number of flights in the “Integrator,Passenger” category were conducted to transport companypersonnel in passenger aircraft operated by the companies.
Accident Sample
The primary source of accident information was the ICAOAccident/Incident Reporting (ADREP) database. The databasecontains worldwide accident information and incidentinformation from 1970 for jet aircraft and for turboprop aircraftwith MTOWs greater than 5,700 kilograms. Fatal accidentsand hull-loss accidents from the ADREP database wereincluded in the study sample.6
The study sample did not include the following:
• Fatal accidents involving no damage or minor damageto the aircraft (e.g., fatal accidents involving in-flightturbulence, jet blast, people falling from aircraft stairsduring boarding); and,
• Hull-loss accidents that occurred while the aircraft wereon the ground with no payload aboard (e.g., collisionswhile the aircraft were being taxied for maintenancepurposes).
The resulting accident sample included 606 accidents. Eachaccident was categorized as having involved an aircraftconfigured to carry cargo or configured to carry passengers,having involved a revenue flight or a non-revenue (training,ferry, positioning or test) flight, and having involved ascheduled flight or an unscheduled flight.
Table 1Average Aircraft Utilization
By Operators, 1970–June 1999
Operator Type of Flight Flights per Day
Major1 Cargo 2.80Major Passenger 4.79Integrator2 Cargo 2.29Integrator Passenger 2.70Supplemental3 Cargo 6.77Supplemental Passenger 6.27
Ad-hoc4 Cargo 3.22
Ad-hoc Passenger 3.68
Note: The data include Western-built jet aircraft (excludingbusiness jets) and turboprop aircraft with maximum takeoffweights of 5,700 kilograms/12,500 pounds or more.1Major operators are defined as large companies with largefleets of jet aircraft.2Integrators are defined as large parcel-delivery operators.3Supplemental air carriers are defined as commuter airlines andequivalent cargo operators that typically deliver cargo andpassengers to major operators.4Ad-hoc operators are defined as operators with a largepercentage of unscheduled flights.
Source: National Aerospace Laboratory (NLR)–Netherlands
Table 2Total Number of Flights by Operators,
1970–June 1999
Operator Type of Flight Flights
Major1 Cargo 13,098,005Major Passenger 329,754,290Integrator2 Cargo 5,899,989Integrator Passenger 198,852Supplemental3 Cargo 4,861,079Supplemental Passenger 89,245,965
Ad-hoc4 Cargo 6,707,868
Ad-hoc Passenger 17,149,140
Note: The data include Western-built jet aircraft (excludingbusiness jets) and turboprop aircraft with maximum takeoffweights of 5,700 kilograms/12,500 pounds or more.1Major operators are defined as large companies with largefleets of jet aircraft.2Integrators are defined as large parcel-delivery operators.3Supplemental air carriers are defined as commuter airlines andequivalent cargo operators that typically deliver cargo andpassengers to major operators.4Ad-hoc operators are defined as operators with a largepercentage of unscheduled flights.
Source: National Aerospace Laboratory (NLR)–Netherlands

6 FLIGHT SAFETY FOUNDATION • FLIGHT SAFETY DIGEST • JULY 2001
Table 3 shows the distribution of the 606 accidents among thevarious operators.
Regional Accident Rates
Accident rates for operations involving Western-built aircraftwere calculated for the following regions:7
• Africa — Algeria, Angola, Benin, Botswana, BurkinaFaso, Burundi, Cameroon, Cape Verde Islands, CentralAfrican Republic, Chad, Ciskei, Comoros, Congo,Democratic Republic of Congo, Djibouti, Egypt,Ethiopia, Gabon, Gambia, Ghana, Guinea,Guinea-Bissau, Ivory Coast, Kenya, Lesotho, Liberia,Libya, Madagascar, Malawi, Mali, Mauritania,Mauritius, Morocco, Mozambique, Namibia, Niger,Nigeria, Republic of Bophuthatswana, Rwanda, SaoTome and Principe, Senegal, Seychelles, Sierra Leone,Somalia, South Africa, Sudan, Swaziland, Tanzania,Togo, Tunisia, Uganda, Zambia and Zimbabwe;
• Asia — Afghanistan, Bahrain, Bangladesh, Bhutan,Brunei, Cambodia, China, Hong Kong, India,Indonesia, Iran, Iraq, Israel, Japan, Jordan, Korea,Kuwait, Laos, Lebanon, Macau, Malaysia, Maldives,Mongolia, Myanmar, Nepal, Oman, Pakistan, Palestine,Philippines, Qatar, Saudi Arabia, Singapore, Sri Lanka,Syria, Taiwan, Thailand, Vietnam and Yemen;
• Australasia — American Samoa, Australia, CookIslands, Fiji, French Polynesia, Guam, Kiribati,Marshall Islands, Nauru, New Caledonia, NewZealand, Northern Marianas Islands, Pacific Islands,Palau, Papua New Guinea, Solomon Islands, Tonga,Vanuatu and Western Samoa;
• Central America and South America — Argentina,Belize, Bolivia, Brazil, Chile, Colombia, Costa Rica,Ecuador, El Salvador, Falkland Islands, French Guyana,Guatemala, Guyana, Honduras, Mexico, Nicaragua,Panama, Paraguay, Peru, Suriname, Uruguay andVenezuela;
• Europe — Albania, Austria, Belgium, Bosnia-Herzegovina, Bulgaria, Croatia, Cyprus,Czechoslovakia, Czech Republic, Denmark, Estonia,Faroe Islands, Finland, France, Germany, Gibraltar,Greece, Greenland, Hungary, Iceland, Ireland, Italy,Latvia, Lichtenstein, Lithuania, Luxembourg,Macedonia, Malta, Monaco, Montenegro, Netherlands,Norway, Poland, Portugal, Romania, Serbia, Slovakia,Slovenia, Spain, Sweden, Switzerland, Turkey, UnitedKingdom and Yugoslavia; and,
• North America — Anguilla, Antigua and Barbuda,Aruba, Bahamas, Barbados, Bermuda, Canada,Cayman Islands, Cuba, Dominica, DominicanRepublic, Grenada, Guadeloupe, Haiti, Jamaica,Martinique, Montserrat, Puerto Rico, St. Kitts andNevis, St. Lucia, St. Pierre and Miquelon, St. Vincent
Table 3Fatal Accidents and Hull-lossAccidents,1 1970–June 1999
Type of Flight
Operator Cargo Passenger
Major2 46 355Integrator3 6 0Supplemental4 9 98Ad-hoc5 46 46
Total 107 499
Note: The data include Western-built jet aircraft (excludingbusiness jets) and turboprop aircraft with maximum takeoffweights of 5,700 kilograms/12,500 pounds or more.1A hull-loss accident is an accident involving damage to acommercial airplane that is substantial and beyond economicrepair, an airplane that remains missing after search forwreckage has been terminated or an airplane that issubstantially damaged and inaccessible.2Major operators are defined as large companies with largefleets of jet aircraft.3Integrators are defined as large parcel-delivery operators.4Supplemental air carriers are defined as commuter airlines andequivalent cargo operators that deliver cargo and passengers tomajor operators.5Ad-hoc operators are defined as operators with a largepercentage of unscheduled flights.
Source: National Aerospace Laboratory (NLR)–Netherlands
Analysis of the Results
Accident Rates Among Operators
The accident rate for each of the operators was calculated bydividing the number of accidents (Table 3) by the total numberof flights (Table 2). The results are shown in Figure 4 (page 7)as accidents per million flights.
The accident rate for ad-hoc cargo operations was almost seventimes higher than the accident rate for passenger operationsconducted by major operators. The accident rate for ad-hocpassenger operations was almost three times higher than theaccident rate for passenger operations conducted by majoroperators.
Among the major operators, the accident rate for cargooperations was more than three times higher than the accidentrate for passenger operations.
Among all of the operators, the accident rate for cargooperations was higher than the accident rate for passengeroperations.

FLIGHT SAFETY FOUNDATION • FLIGHT SAFETY DIGEST • JULY 2001 7
and the Grenadines, Trinidad and Tobago, Turks andCaicos Islands, United States and Virgin Islands.
The total number of flights conducted in Western-built aircraftby operators in the CIS was too low to calculate accident ratesthat are statistically robust.
For the purpose of this study, the criterion for assigning an accidentto a region was the state of registry of the accident aircraft.
Figure 5 (page 8) shows that the highest accident rates in cargooperations involved aircraft registered in Africa, Asia andCentral America/South America. The variation in the accidentrates among the regions generally is much greater for cargooperations than for passenger operations. Also noteworthy isthat Europe’s cargo-operations accident rate is relatively lowand does not differ significantly from the accident rate forpassenger operations.
A possible explanation for the variation in regional accidentrates is the variation in regional economic performance. Figure6 (page 8) shows the 1996 gross domestic product per capitain U.S. dollars for the regions.
Figure 5 and Figure 6 indicate that the regions with the lowesteconomic performance have the highest accident rates.
Figure 7 (page 9) shows the accident rates among the variousoperators in the regions. The accident rates are relatively highin Africa, Asia and Central America/South America. Theaccident rates among Australasian operators and Europeanoperators are relatively low, and there is little differencebetween the accident rates for cargo operations and forpassenger operations. The accident rates among NorthAmerican operators also are relatively low, but there is asignificant difference between the accident rates for cargooperations and the accident rates for passenger operations.The accident rate for ad-hoc cargo operations in NorthAmerica is higher than the accident rate for unscheduledpassenger operations in Africa and in Central America/SouthAmerica.
State-owned Airlines
Figure 8 (page 10) shows the accident rates among state-owned airlines and privately owned airlines in Africa. Anairline was classified as state-owned if more than 50 percent
Accident Rates Among Operators, 1970–June 1999
0
1
2
3
4
5
6
7CargoPassenger
Ad-hoc4Supplemental3Integrator2Major1
1.08
3.51
0
1.02 1.10
1.85
2.68
6.85
Acc
iden
ts p
er M
illio
n F
ligh
ts
Note: The data include Western-built jet aircraft (excluding business jets) and turboprop aircraft with maximum takeoff weightsof 5,700 kilograms/12,500 pounds or more.1Major operators are defined as large companies with large fleets of jet aircraft.2Integrators are defined as large parcel-delivery operators.3Supplemental air carriers are defined as commuter airlines and equivalent cargo operators that deliver cargo and passengersto major operators.4Ad-hoc operators are defined as operators with a large percentage of unscheduled flights.
Source: National Aerospace Laboratory (NLR)–Netherlands
Figure 4

8 FLIGHT SAFETY FOUNDATION • FLIGHT SAFETY DIGEST • JULY 2001
Accident Rates by Operator Region, 1970–June 1999
0.200
2
4
6
8
10
12
14
16
18
Cargo
Passenger
Central America/South America
North America
EuropeAustralasiaAsiaAfrica
16.79
3.69
6.16
3.83
Acc
iden
ts p
er M
illio
n F
ligh
ts
0
1.08 1.16
2.50
0.52
9.02
2.12
Note: The data include Western-built jet aircraft (excluding business jets) and turboprop aircraft with maximum takeoff weightsof 5,700 kilograms/12,500 pounds or more.
Source: National Aerospace Laboratory (NLR)–Netherlands
Figure 5
Gross Domestic Product per Capita, 1996
of the shares in the company were held by the state in whichthe airline was based.
Whereas there is little difference between the accident ratesfor passenger operations conducted by state-owned airlines
and the accident rate for passenger operations conducted byprivately owned airlines, the accident rate for cargo operationsconducted by state-owned airlines is two times higher thanthe accident rate for cargo operations conducted by privatelyowned airlines.
Less Than US$1,000
$1,000 to $3,000
$3,000 to $10,000
$10,000 to $15,000
More Than $15,000
Note: Amounts are in 1996 U.S. dollars.
Source: National Aerospace Laboratory (NLR)–Netherlands
Figure 6

FLIGHT SAFETY FOUNDATION • FLIGHT SAFETY DIGEST • JULY 2001 9
Types of Accidents
The reason for the higher accident rates among cargooperations worldwide was further examined by comparingthe different types of accidents that occurred in cargooperations and in passenger operations. The identificationof accident types was based on information listed for eachaccident in the sample of 606 accidents from the ADREPdatabase.
The results of this comparison are shown in Figure 9 (page10). Of the 107 accidents that occurred in cargo operations,28 accidents (26 percent) involved collisions with the ground.Of the 499 accidents that occurred in passenger operations,130 accidents (26 percent) involved collisions with the ground.Nearly equal distributions also are shown for several otherfrequent accident types, including engine failure, loss of
control, runway undershoot, fire/explosion, landing-gearfailure and hard landing.
The higher frequency of accidents involving criminal acts inpassenger operations most likely is because these events areintended by their perpetrators to have the highest-possibleimpact on society. Military-intervention accidents might occurmore frequently during cargo operations because cargooperations are conducted more often than passenger operationsin regions with high military activity (e.g., for weapons deliveryor humanitarian purposes). Most accidents in the cargo-relatedcategory were caused by weight-and-balance problems (e.g.,improper loading or cargo shifting in flight).
The absence of major differences in the distribution of accidenttypes between cargo operations and passenger operationsindicates that the higher accident rate in cargo operations
Accident Rates Among Operators by Region, 1970–June 1999
Note: The data include Western-built jet aircraft (excluding business jets) and turboprop aircraft with maximum takeoff weightsof 5,700 kilograms/12,500 pounds or more.
1Major operators are defined as large companies with large fleets of jet aircraft.2Integrators are defined as large parcel-delivery operators.3Supplemental air carriers are defined as commuter airlines and equivalent cargo operators that deliver cargo and passengersto major operators.4Ad-hoc operators are defined as operators with a large percentage of unscheduled flights.
Source: National Aerospace Laboratory (NLR)–Netherlands
Figure 7
Maj
or1
Inte
grat
or2
Sup
plem
enta
l3
Ad-
hoc4
Maj
orIn
tegr
ator
Sup
plem
enta
lA
d-ho
c
Maj
orIn
tegr
ator
Sup
plem
enta
lA
d-ho
c
Maj
orIn
tegr
ator
Sup
plem
enta
lA
d-ho
c
Maj
orIn
tegr
ator
Sup
plem
enta
lA
d-ho
c
Maj
orIn
tegr
ator
Sup
plem
enta
lA
d-ho
c
NorthAmerica
Central America/South America
EuropeAustralasiaAsiaAfrica
Acc
iden
ts p
er M
illio
n F
ligh
ts
20
18
16
14
12
10
8
6
4
2
0
CargoPassenger

1 0 FLIGHT SAFETY FOUNDATION • FLIGHT SAFETY DIGEST • JULY 2001
Accident Rates Among State-owned Airlines andPrivately Owned Airlines in Africa, 1970–June 1999
Note: The data include Western-built jet aircraft (excluding business jets) and turboprop aircraft with maximum takeoff weightsof 5,700 kilograms/12,500 pounds or more.
Source: National Aerospace Laboratory (NLR)–Netherlands
Figure 8
Types of Accidents, 1970–June 1999
Note: The data include Western-built jet aircraft (excluding business jets) and turboprop aircraft with maximum takeoff weightsof 5,700 kilograms/12,500 pounds or more.
Source: National Aerospace Laboratory (NLR)–Netherlands
Figure 9
02468
101214161820
State-owned Airlines Privately Owned Airlines
Acc
iden
ts p
er M
illio
n F
ligh
ts
CargoPassenger
CargoPassenger
Collision with Ground
Engine Failure
Loss of Control
Runway Overrun
Runway Undershoot
Fire/Explosion
Gear Failure
Criminal Acts
Weather-related
Hard Landing
Other/Unknown
Component/System Failure
Midair Collision
Collision of Aircraft on Ground
Structural Failure
Flight Control System Failure
Collision With Object
Military Intervention
Tail/Wing Tip Scrape
Navigation Error
Landing Beside Runway
Bird Strike
Cargo-related
Wake Turbulence
Percentage of Accidents
0 5 10 15 20 25 30

FLIGHT SAFETY FOUNDATION • FLIGHT SAFETY DIGEST • JULY 2001 1 1
cannot be attributed to a single cause. The previous study8
concluded that the five most frequent causal factors of fatalaccidents are the same for cargo operations and for passengeroperations. These causal factors — all attributed to crew —are the following:
• Flight handling;
• Inappropriate action;
• Lack of positional awareness;
• Inadequate professional judgment; and,
• Slow/low on approach.
Accident Flight Phase
Figure 10 shows the flight phases in which the accidentsoccurred during cargo operations and passenger operations.
The six flight phases used in this study were adapted from the22 ADREP flight-phase classifications as follows:
• Takeoff — aborted takeoff, takeoff, takeoff run;
• Climb — initial climb, climb to cruise;
• Cruise — change of cruise level, cruise, en route;
• Approach — approach, approach/holding, base leg,uncontrolled descent, final approach, intermediateapproach, missed approach/go-around, normaldescent;
• Landing — landing, touchdown, landing roll, level-off/touchdown; and,
• Taxi — taxiing/pushback/tow, taxi to runway/taxi fromrunway.
Figure 10 shows that relatively more accidents during takeoffand climb occurred in cargo operations than in passengeroperations. Relatively fewer accidents during cruise andapproach occurred in cargo operations than in passengeroperations. The percentage of landing accidents was nearlythe same for cargo operations and passenger operations.
Aircraft Generation
Figure 11 shows accidents rates involving three generationsof aircraft used in cargo operations and in passengeroperations.
Flight Phase in Which AccidentsOccurred, 1970–June 1999
Note: The data include Western-built jet aircraft (excluding businessjets) and turboprop aircraft with maximum takeoff weights of 5,700kilograms/12,500 pounds or more.
Source: National Aerospace Laboratory (NLR)–Netherlands
Figure 10
Accident Rates by Aircraft Generation,1970–June 1999
Note: The data include Western-built jet aircraft (excludingbusiness jets) and turboprop aircraft with maximum takeoffweights of 5,700 kilograms/12,500 pounds or more.1First-generation aircraft typically were designed in the 1950sand certified before 1965. Flight decks were characterized bylimited automation and relatively simple equipment for navigationand instrument approaches.2Second-generation aircraft were designed in the 1960s and1970s and certified between 1965 and 1980. Flight decks werecharacterized by more advanced autopilots, autothrottles, flightdirectors and navigational equipment.3Third-generation aircraft, designed in the 1980s and 1990s,include electronic flight instrument systems and improvedautopilots, and some types have fly-by-wire systems.
Source: National Aerospace Laboratory (NLR)–Netherlands
Figure 11
Takeoff
Climb
Cruise
Approach
Landing
TaxiCargoPassenger
0 10 20 30 40 50
Percentage of Accidents
0
1
2
3
4
5
6Cargo
Passenger
Third Generation3
Second Generation2
First Generation1
2.43
5.24
1.13
1.53
0.48
1.41

1 2 FLIGHT SAFETY FOUNDATION • FLIGHT SAFETY DIGEST • JULY 2001
For the purpose of this study, the aircraft generations weredefined as follows:
• First-generation aircraft typically were designed in the1950s. Most of the aircraft were certified before 1965.The aircraft have limited flight deck automation andrelatively simple equipment for navigation andinstrument approaches. Examples are the Boeing 707and Fokker F-27;
• Second-generation aircraft typically were designed inthe 1960s and 1970s, and certified between 1965 and1980. The aircraft have more reliable engines and moreadvanced equipment and systems than first-generationaircraft. Examples are the Airbus A300, Boeing737-200 and Fokker F-28; and,
• Third-generation aircraft, designed and certified in the1980s and 1990s, typically have electronic flightinstrument systems and advanced flight managementsystems. Examples are the Airbus A320, Boeing737-700 and Fokker 50.
Figure 11 shows that the accident rate for cargo operationsconducted in first-generation aircraft was more than twiceas high as the accident rate for passenger operationsconducted in first-generation aircraft. The accident rate forcargo operations in second-generation aircraft wassignificantly lower than the accident rate for cargo operationsin first-generation aircraft and was much closer to the accidentrate for passenger operations in second-generation aircraft.Although the accident rate for passenger operations in third-generation aircraft was much lower than the accident ratefor passenger operations in second-generation aircraft, theaccident rate for cargo operations decreased only slightly.(The accident rate for cargo operations in third-generationaircraft is based on a very small number of accidents,however, and is not reliable statistically.)
As shown in Figure 3, the average age of Western-built cargoaircraft is higher than the average age of Western-built passengeraircraft. This indicates that a larger portion of the cargo fleet iscomposed of older-generation aircraft. To test this assumption,the percentages of flights conducted in aircraft of each generationwere calculated. The results are shown in Figure 12.
While more than half of all passenger flights were conductedwith second-generation aircraft and almost a third with third-generation aircraft, the majority of cargo flights wereconducted with first-generation aircraft.
SAFA Inspections
The SAFA program began in the Netherlands at the end of1997. In 1997 and in 1998, a total of 273 SAFA inspectionswere performed on aircraft operated by 83 of the 85 foreignoperators that conducted scheduled services in the Netherlands
and 26 of the 98 foreign operators that conducted unscheduledservices in the Netherlands.
SAFA inspections performed in the Netherlands in 1999focused on operators that were found during previousinspections to have deviated significantly from ICAOstandards. A total of 162 inspections of aircraft operated by98 foreign operators were conducted in 1999.
Figure 13 (page 13) shows the percentages of SAFA inspectionsconducted in 1999 on aircraft operated by unscheduled (ad-hoc)cargo operators, scheduled cargo operators, unscheduledpassenger operators and scheduled passenger operators.
Inspection Findings
SAFA inspections include checks for compliance withICAO Annex 1 (Personnel Licensing), Annex 6 (Operation
Flights by Aircraft Generation,1970–June 1999
Note: The data include Western-built jet aircraft (excludingbusiness jets) and turboprop aircraft with maximum takeoffweights of 5,700 kilograms/12,500 pounds or more.1First-generation aircraft typically were designed in the 1950sand certified before 1965. Flight decks were characterized bylimited automation and relatively simple equipment for navigationand instrument approaches.2Second-generation aircraft were designed in the 1960s and1970s and certified between 1965 and 1980. Flight decks werecharacterized by more advanced autopilots, autothrottles, flightdirectors and navigational equipment.3Third-generation aircraft, designed in the 1980s and 1990s,include electronic flight instrument systems and improvedautopilots, and some types have fly-by-wire systems.
Source: National Aerospace Laboratory (NLR)–Netherlands
Figure 12
0%
20%
40%
60%
80%
Third Generation3
Second Generation2
First Generation1
Cargo Operations Passenger Operations
15.8%
55.7%
28.5%
4.2%
31.3%
64.5%

FLIGHT SAFETY FOUNDATION • FLIGHT SAFETY DIGEST • JULY 2001 1 3
SAFA Inspections of AircraftOperators in the Netherlands by
Type of Operation, 1999
SAFA = The European Joint Aviation Authorities SafetyAssessment of Foreign Aircraft program.
Source: National Aerospace Laboratory (NLR)–Netherlands
Figure 13
of Aircraft) and Annex 8 (Airworthiness of Aircraft). Theinspection findings are categorized as follows:
• Category 0 — No deviations from ICAO standardswere found;
• Category 1 — Deviations from ICAO standards werefound; no immediate safety concern;
• Category 2 — Major deviations from ICAO standardswere found; corrective action was required; no directsafety concern;
• Category 3a — Major deviations from ICAO standardswere found; corrective action was required before flightbecause of safety concern; and,
• Category 3b — Major deviations from ICAO standardswere found; corrective action was required beforeflight; corrective action was not accepted by flight crew,therefore enforced by SAFA team.
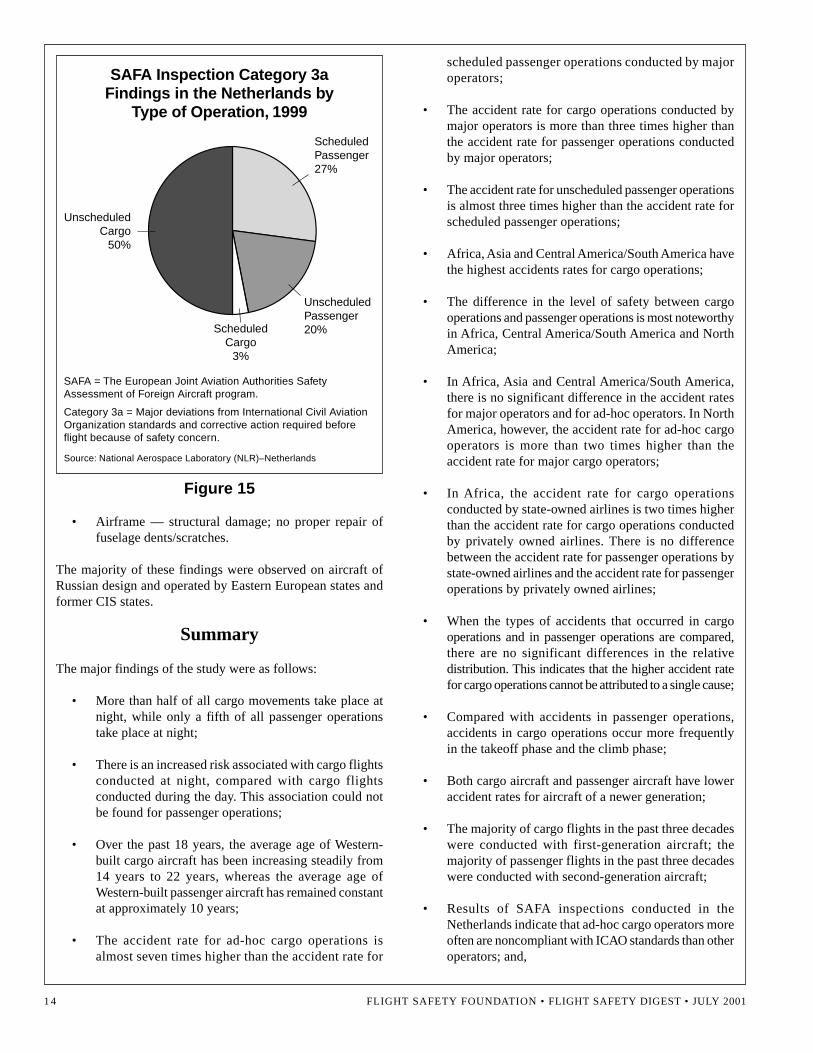
Figure 14 shows the findings of the 162 SAFA inspectionsperformed in the Netherlands in 1999. Because of the focuson operators that had serious findings in previous inspections,the number of category 3a findings (18.5 percent of allinspections) was relatively high.
Figure 15 (page 14) shows the distribution of category 3afindings among the various operators. Fifty percent of the
Findings of SAFA InspectionsConducted in the Netherlands, 1999
SAFA = The European Joint Aviation Authorities SafetyAssessment of Foreign Aircraft program.
Category 0 = No deviations from International Civil AviationOrganization (ICAO) standards.
Category 1 = Deviations from ICAO standards but no immediatesafety concern.
Category 2 = Major deviations from ICAO standards andcorrective action required but no direct safety concern.
Category 3a = Major deviations from ICAO standards andcorrective action required before flight because of safetyconcern.
Category 3b = Major deviations from ICAO standards andcorrective action required before flight; action not accepted bythe flight crew and therefore enforced by the SAFA team.
Source: National Aerospace Laboratory (NLR)–Netherlands
Figure 14
category 3a findings resulted from inspections of aircraftoperated by ad-hoc cargo operators.
Ad-hoc Cargo Operator Inspection Findings
Typical deviations observed during SAFA inspections ofaircraft operated by ad-hoc cargo operators in the Netherlandswere the following:
• Flight deck — improper flight preparation (e.g.,weight-and-balance calculations, fuel calculations);absence of safety equipment (e.g., shoulder harnesses);pilot license not available or expired; navigation mapsout of date or not available;
• Cabin — insufficient oxygen supply for passengers;baggage not properly stowed; dangerous goods incabin; insufficient numbers of seats for passengersaboard; no (spare) seat belts or no seat belt extensions;seats blocking access to emergency exits; and,
UnscheduledCargo
20%
ScheduledCargo
8%
UnscheduledPassenger
20%
ScheduledPassenger52%
0
20
40
60
80
100
3b3a210
0
3032
17
83
Category of SAFA Inspection Finding
Nu
mb
er o
f F
ind
ing
s
1 4 FLIGHT SAFETY FOUNDATION • FLIGHT SAFETY DIGEST • JULY 2001
scheduled passenger operations conducted by majoroperators;
• The accident rate for cargo operations conducted bymajor operators is more than three times higher thanthe accident rate for passenger operations conductedby major operators;
• The accident rate for unscheduled passenger operationsis almost three times higher than the accident rate forscheduled passenger operations;
• Africa, Asia and Central America/South America havethe highest accidents rates for cargo operations;
• The difference in the level of safety between cargooperations and passenger operations is most noteworthyin Africa, Central America/South America and NorthAmerica;
• In Africa, Asia and Central America/South America,there is no significant difference in the accident ratesfor major operators and for ad-hoc operators. In NorthAmerica, however, the accident rate for ad-hoc cargooperators is more than two times higher than theaccident rate for major cargo operators;
• In Africa, the accident rate for cargo operationsconducted by state-owned airlines is two times higherthan the accident rate for cargo operations conductedby privately owned airlines. There is no differencebetween the accident rate for passenger operations bystate-owned airlines and the accident rate for passengeroperations by privately owned airlines;
• When the types of accidents that occurred in cargooperations and in passenger operations are compared,there are no significant differences in the relativedistribution. This indicates that the higher accident ratefor cargo operations cannot be attributed to a single cause;
• Compared with accidents in passenger operations,accidents in cargo operations occur more frequentlyin the takeoff phase and the climb phase;
• Both cargo aircraft and passenger aircraft have loweraccident rates for aircraft of a newer generation;
• The majority of cargo flights in the past three decadeswere conducted with first-generation aircraft; themajority of passenger flights in the past three decadeswere conducted with second-generation aircraft;
• Results of SAFA inspections conducted in theNetherlands indicate that ad-hoc cargo operators moreoften are noncompliant with ICAO standards than otheroperators; and,
• Airframe — structural damage; no proper repair offuselage dents/scratches.
The majority of these findings were observed on aircraft ofRussian design and operated by Eastern European states andformer CIS states.
Summary
The major findings of the study were as follows:
• More than half of all cargo movements take place atnight, while only a fifth of all passenger operationstake place at night;
• There is an increased risk associated with cargo flightsconducted at night, compared with cargo flightsconducted during the day. This association could notbe found for passenger operations;
• Over the past 18 years, the average age of Western-built cargo aircraft has been increasing steadily from14 years to 22 years, whereas the average age ofWestern-built passenger aircraft has remained constantat approximately 10 years;
• The accident rate for ad-hoc cargo operations isalmost seven times higher than the accident rate for
SAFA Inspection Category 3aFindings in the Netherlands by
Type of Operation, 1999
SAFA = The European Joint Aviation Authorities SafetyAssessment of Foreign Aircraft program.
Category 3a = Major deviations from International Civil AviationOrganization standards and corrective action required beforeflight because of safety concern.
Source: National Aerospace Laboratory (NLR)–Netherlands
Figure 15
ScheduledPassenger27%
UnscheduledPassenger20%Scheduled
Cargo3%
UnscheduledCargo
50%

FLIGHT SAFETY FOUNDATION • FLIGHT SAFETY DIGEST • JULY 2001 1 5
• The main cause for the higher accident rates amongcargo operators in regions with the lowest economicperformance is lack of financial resources.
Recommendations
Based on these findings, the study resulted in the followingrecommendations:
• Airlines should adopt a “safety first” attitude towardcargo operations;
• Cargo operators should know the potential problemsassociated with night flying and minimize the negativeeffects of night flying;
• The operation of older aircraft does not, in itself,compromise safety if adequate maintenance andadequate inspection are performed. Identification ofrequired maintenance procedures and requiredinspection procedures is the combined responsibilityof regulators, operators and manufacturers; theseorganizations should cooperate in the continuedanalysis of problems affecting aging aircraft;
• The civil aviation authorities in regions with the lowesteconomic performance should be supported in theirefforts to become strong and effective; and,
• Although grounding of aircraft by civil aviationauthorities is necessary if an immediate safety concernexists, grounding of aircraft does not solve problems.The prime instrument for safety improvement shouldbe support.♦
[FSF editorial note: To ensure wider distribution in the interestof aviation safety, this report has been adapted from theNational Aerospace Laboratory (NLR)–Netherlands’ Ananalysis of the safety performance of air cargo operators,NLR-TP-2000-210, March 2000. Some editorial changes weremade by FSF staff for clarity and for style. A.L.C. Roelen andA.J. Pikaar are NLR research scientists. W. Ovaa is nationalSAFA (Safety Assessment of Foreign Aircraft program)coordinator for the Netherlands Directorate General of CivilAviation. Albertine Verweij and Hans Knuvers (Air TransportAssociation, Netherlands), Robert Baltus (Schreiner Airways),Jos van der Woensel (Zygene European Freight Consult) andAdrian Sayce (U.K. Civil Aviation Authority) contributed tothe research and preparation of the NLR report.]
Notes and References
1. Roelen, A.L.C.; van Es, Gerard W.H.; Goei, Hok; Sayce,Adrian G.; Doherty, Sarah. “Safety Aspects of Air CargoOperations.” In Flight Safety: Management, Measurementand Margins: Proceedings of the 11th annual European
Aviation Safety Seminar. Amsterdam, Netherlands: FlightSafety Foundation, 1999.
2. U.S. National Transportation Safety Board (NTSB). AircraftAccident Report: Uncontrolled Impact With Terrain, FineAirlines Flight 101, Douglas DC-8-61, N27UA, Miami,Florida, August 7, 1997. NTSB/AAR-98/02, June 1998.The aircraft struck terrain during takeoff, killing the threeflight crewmembers, a security guard aboard the aircraftand one person on the ground. NTSB said that the accident“resulted from the airplane being misloaded to produce amore aft center of gravity and a correspondingly incorrectstabilizer trim setting that precipitated an extreme pitch-upat rotation.” NTSB said that the probable causes of theaccident were “the failure of Fine Air to exercise operationalcontrol over the cargo loading process and the failure ofAeromar [a freight-forwarding company] to load theairplane as specified by Fine Air.”
3. U.K. Civil Aviation Authority. Global Fatal AccidentReview 1980–1996. Civil Aviation Publication (CAP) 681,March 1998.
4. Gander, P.H.; Gregory, K.B.; Connell, L.J.; Miller, D.L.;Graeber, R.C.; Rosekind, M.R. Crew Factors in FlightOperations VII: Psychophysiological Responses toOvernight Cargo Operations, U.S. National Aeronauticsand Space Administration (NASA) TechnicalMemorandum 110380, NASA Ames Research Center.
5. Kingsley-Jones, M.; Sheppard, I. “Aging Airliner Census,1997,” Flight International Volume 152 (July 9–15, 1997).
6. A hull-loss accident is defined as an accident involvingdamage to a commercial airplane that is substantial andbeyond economic repair, an airplane that remains missingafter search for wreckage has been terminated or anairplane that is substantially damaged and inaccessible.
7. The definitions of the regions and the countries in each regionwere derived from U.K. Civil Aviation Authority CAP 681.
8. Roelen et al.
Further Reading from FSF Publications
FSF Editorial Staff. “Destabilized Approach Results in MD-11Bounced Landing, Structural Failure.” Accident PreventionVolume 58 (January 2001).
FSF Editorial Staff. “Improper Loading of Cargo Causes Lossof Aircraft Control on Approach.” Accident Prevention Volume57 (May 2000).
FSF Editorial Staff. “NTSB Recommends Changes in MD-11Cargo Control Units.” Aviation Mechanics Bulletin Volume48 (January–February 2000): 6–7.

1 6 FLIGHT SAFETY FOUNDATION • FLIGHT SAFETY DIGEST • JULY 2001
FSF Editorial Staff. “Cargo Airplane Strikes Building DuringRejected Takeoff.” Accident Prevention Volume 57 (January2000).
Blake, David. “Project Assesses Flight Attendants’ Abilitiesto Fight In-flight Fires in Cargo Compartments.” Cabin CrewSafety Volume 34 (September–October 1999).
Caldwell, J. Lynn. “Managing Sleep for Night Shifts RequiresPersonal Strategies.” Human Factors & Aviation MedicineVolume 46 (March–April 1999).
FSF Editorial Staff. “After Smoke Detected in CargoCompartment, Crew Lands DC-10, Then Fire DestroysAircraft.” Accident Prevention Volume 55 (November–December 1998).
FSF Editorial Staff. “Airline’s Five Unrestrained-cargo Incidentsin Four Months Reveal Loading-procedure Deficiencies.”Airport Operations Volume 24 (November–December 1998).
FSF Editorial Staff. “Misloaded Douglas DC-8 Pitches UpExcessively on Takeoff, Then Stalls and Strikes the Ground.”Accident Prevention Volume 55 (September 1998).
FSF Editorial Staff. “Chemical Oxygen Generator Activatesin Cargo Compartment of DC-9, Causes Intense Fire and
Results in Collision With Terrain.” Accident Prevention Volume54 (November 1997).
FSF Editorial Staff. “Hidden, Smoky Fire in MD-87 Aft CabinForces Emergency Evacuation After Landing.” AccidentPrevention Volume 53 (December 1996).
Sarkos, Constantine P. “FAA Proposes New Rules on CargoCompartment Fire Detection and Suppression.” Cabin CrewSafety Volume 31 (November–December 1996).
U.S. National Transportation Safety Board. “U.S. NationalTransportation Safety Board Issues ‘Urgent’ Recommendationsfor Hazardous Cargo.” Aviation Mechanics Bulletin Volume44 (May–June 1996).
Chipkevich, Robert J. “Safeguarding Against Hazardous CargoPresents a Variety of Challenges.” Airport Operations Volume20 (November–December 1994).
Lawton, Russell. “Steep Turn by Captain During ApproachResults in Stall and Crash of DC-8 Freighter.” AccidentPrevention Volume 51 (October 1994).
FSF Editorial Staff. “Sudden Aileron Lock Sends CargoTurboprop Plummeting to the Ground.” Accident PreventionVolume 49 (August 1992).
AppendixAircraft Types Included in Study Sample
Manufacturer Model(s)
Airbus A300, A300-600, A310, A319, A320, A321, A330, A340Aerospatiale Caravelle, Corvette, Nord 262Aerospatiale/BAe ConcordeATR ATR 42, ATR 72BAe 146, ATP, J-31, J-41, 1-11, 748, Vanguard, Viscount, VC-10Beech 1900Boeing 707, 720, 727, 737, 747, 757, 767, 777Bombardier DHC-7, DHC-8CASA C-212, CN-235Convair CV-580, CV-600, CV-640Dassault MercureDouglas/MDD DC-8, DC-9, DC-10, MD-80, MD-90, MD-11Dornier 228, 328Embraer BrasiliaFairchild Metro, F27Fokker F27, F28, F50, F100Grumman Gulfstream 1Handley Page HeraldIPTN NC-212, NC-235Lockheed L-1011, L-188, C-130NAMC YS-11Saab 340, 2000Shorts 330, 360
ATR = Avions de Transport Regional, BAe = British Aerospace, CASA = Construcciones Aeronauticas SA, IPTN = Industri Pesawat TerbanNusantara (Nusantara Aircraft Industries), MDD = McDonnell Douglas, NAMC = Nanchang Aircraft Manufacturing Co.

FLIGHT SAFETY FOUNDATION • FLIGHT SAFETY DIGEST • JULY 2001 1 7
Aviation Statistics
Five Accidents on Takeoff and Initial ClimbIn 2000 Involved Western-built
Large Commercial Jets
Boeing data also show that, during the decade that ended in 2000,17 percent of all accidents involving Western-built large commercial jets —
and 16 percent of fatalities — occurred during takeoff and initial climb.
FSF Editorial Staff
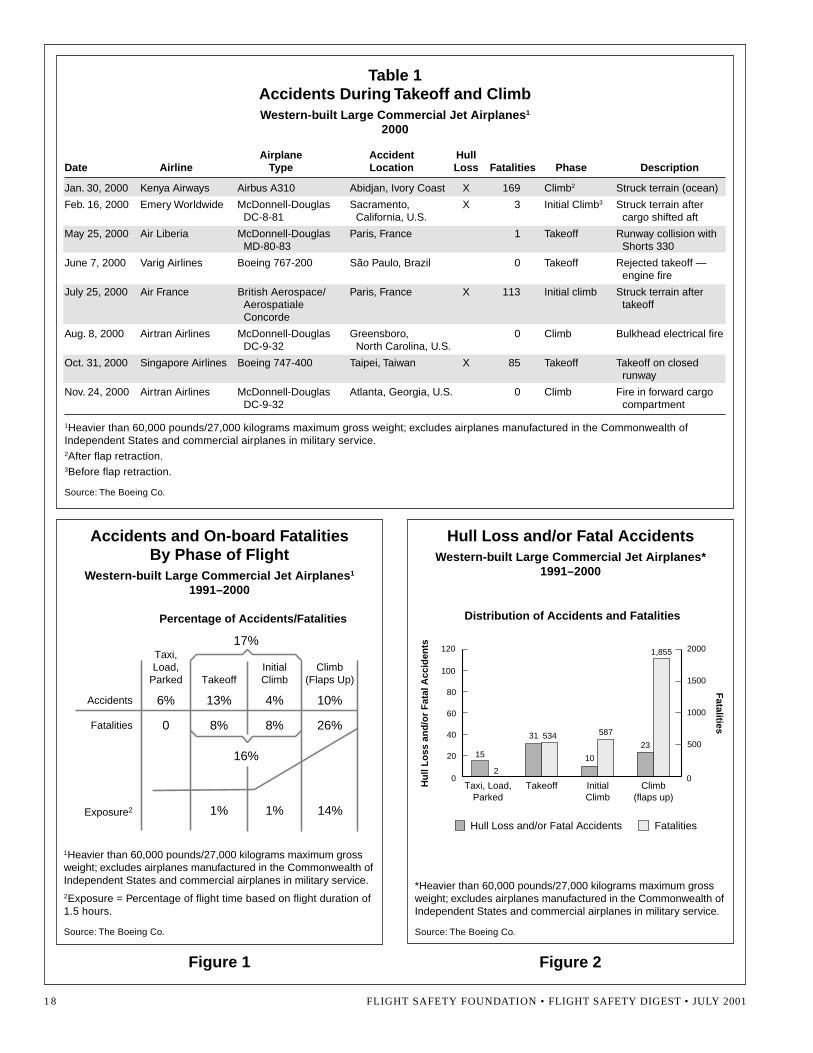
Data compiled by The Boeing Co. show that five airplanesin the worldwide fleet of Western-built large commercial jetswere involved in accidents during takeoff and initial climb(before the airplane’s flaps were retracted) in 2000 (Table 1,page 18). Three other accidents occurred in the climb phase(after flaps were retracted).
The Boeing data include Western-built commercialjet airplanes with maximum gross weights of more than60,000 pounds/27,000 kilograms. The data exclude airplanesmanufactured in the Commonwealth of Independent Statesbecause of a lack of operational data. Commercial airplanesin military service also are excluded.
Three of the five accidents that occurred during takeoff andinitial climb were classified as “hull loss” accidents, whichBoeing defines as accidents that involve damage to anairplane that is substantial and beyond economic repair.Boeing also classifies an accident as a hull loss if the airplane
is missing, if the wreckage has not been found and the searchhas been terminated, or if the airplane is substantiallydamaged and is inaccessible. Four of the five accidentsinvolved fatalities.
Figure 1 (page 18) shows that from 1991 through 2000, 17percent of all accidents — and 16 percent of fatalities —occurred during takeoff and initial climb.
Data show that, during the same 10-year period, 10 percent ofall accidents — and 26 percent of fatalities — occurred in theclimb phase.
Figure 2 (page 18) shows that, from 1991 through 2000, 41hull loss accidents and/or fatal accidents occurred duringtakeoff and initial climb. Those accidents resulted in 1,121fatalities. Twenty-three hull loss accidents and/or fatalaccidents occurred during the climb phase; those accidentsresulted in 1,855 fatalities.♦
1 8 FLIGHT SAFETY FOUNDATION • FLIGHT SAFETY DIGEST • JULY 2001
Table 1Accidents During Takeoff and ClimbWestern-built Large Commercial Jet Airplanes1
2000
Airplane Accident HullDate Airline Type Location Loss Fatalities Phase Description
Jan. 30, 2000 Kenya Airways Airbus A310 Abidjan, Ivory Coast X 169 Climb2 Struck terrain (ocean)
Feb. 16, 2000 Emery Worldwide McDonnell-Douglas Sacramento, X 3 Initial Climb3 Struck terrain after DC-8-81 California, U.S. cargo shifted aft
May 25, 2000 Air Liberia McDonnell-Douglas Paris, France 1 Takeoff Runway collision with MD-80-83 Shorts 330
June 7, 2000 Varig Airlines Boeing 767-200 São Paulo, Brazil 0 Takeoff Rejected takeoff — engine fire
July 25, 2000 Air France British Aerospace/ Paris, France X 113 Initial climb Struck terrain after Aerospatiale takeoff Concorde
Aug. 8, 2000 Airtran Airlines McDonnell-Douglas Greensboro, 0 Climb Bulkhead electrical fire DC-9-32 North Carolina, U.S.
Oct. 31, 2000 Singapore Airlines Boeing 747-400 Taipei, Taiwan X 85 Takeoff Takeoff on closed runway
Nov. 24, 2000 Airtran Airlines McDonnell-Douglas Atlanta, Georgia, U.S. 0 Climb Fire in forward cargo DC-9-32 compartment
1Heavier than 60,000 pounds/27,000 kilograms maximum gross weight; excludes airplanes manufactured in the Commonwealth ofIndependent States and commercial airplanes in military service.2After flap retraction.3Before flap retraction.
Source: The Boeing Co.
Accidents and On-board FatalitiesBy Phase of Flight
Western-built Large Commercial Jet Airplanes1
1991–2000
1Heavier than 60,000 pounds/27,000 kilograms maximum grossweight; excludes airplanes manufactured in the Commonwealth ofIndependent States and commercial airplanes in military service.2Exposure = Percentage of flight time based on flight duration of1.5 hours.
Source: The Boeing Co.
Figure 1
Hull Loss and/or Fatal AccidentsWestern-built Large Commercial Jet Airplanes*
1991–2000
*Heavier than 60,000 pounds/27,000 kilograms maximum grossweight; excludes airplanes manufactured in the Commonwealth ofIndependent States and commercial airplanes in military service.
Source: The Boeing Co.
Figure 2
Percentage of Accidents/Fatalities
Takeoff
13%
8%
1%
InitialClimb
4%
8%
1%
6%
0
Climb(Flaps Up)
10%
26%
14%
17%
16%
Accidents
Fatalities
Exposure2
Taxi,Load,
Parked
Hull Loss and/or Fatal Accidents Fatalities
Taxi, Load,Parked
Takeoff InitialClimb
Climb(flaps up)
Fatalities
15
2
31
Hu
ll L
oss
an
d/o
r F
atal
Acc
iden
ts
534
29810
23
1,855
0
20
40
60
80
100
120
0
500
1000
1500
2000
587
Distribution of Accidents and Fatalities

FLIGHT SAFETY FOUNDATION • FLIGHT SAFETY DIGEST • JULY 2001 1 9
Publications Received at FSFJerry Lederer Aviation Safety Library
U.K. CAA Document Provides Information onDeveloping Safety Management Systems
Guidance from the regulatory authority and the civil aviation industry includesrecommendations for civil aviation transport operations and maintenance activities.
FSF Library Staff
Reports
Safety Management Systems for Commercial Air TransportOperations: A Guide to Implementation. U.K. Civil AviationAuthority (CAA) Safety Regulation Group (SRG), Air TransportOperations — Safety Management Group. May 2001. CivilAviation Publication (CAP) 712. 43 pp. Tables, appendixes.
The U.K. CAA SRG and operating sectors and maintenancesectors of the U.K. civil aviation industry comprise a workinggroup called the Air Transport Operations — SafetyManagement Group (ATO-SMG). The group is responsiblefor developing guidance material for commercial air transportoperators and maintenance organizations to use in establishingeffective, comprehensive systems for managing safety withintheir own operations.
This guidance document answers three questions: What is asafety management system (SMS), what is it expected toachieve, and how is it implemented and maintained? Thedocument defines safety management as “the systematicmanagement of the risks associated with flight operations,related ground operations and aircraft engineering ormaintenance activities to achieve high levels of safetyperformance.” An SMS is defined as “an explicit element ofthe corporate management responsibility which sets out acompany’s safety policy and defines how it intends to managesafety as an integral part of its overall business.”
FAA Aerospace Forecasts — Fiscal Years 2001–2012. U.S.Department of Transportation, Federal Aviation Administration(FAA) Office of Aviation Policy and Plans, Statistics andForecast Branch. FAA APO-01-1. March 2001. 296 pp.Figures, tables. Available through NTIS.*
The FAA Statistics and Forecast Branch develops annualforecasts of aviation activity for the agency’s use in planningand decision making. The report covers four major areas ofaviation activity:
• U.S. and world economic environment, assumptionsand predictions used in developing this forecast;
• Historical data and detailed forecasts of future aviationdemand and aircraft activity for major nonmilitary usergroups — large commercial air carriers, regionalairlines and commuter airlines, general aviation andhelicopter operators;
• Workload measures for FAA air traffic control towersand contracted air traffic control towers, en routecenters and flight service stations; and,
• Outlook for commercial space transportation.
FAA said that the outlook for its 12-year forecast period is formoderate economic growth and inflation and declining fuelprices. Based on these assumptions, aviation activity is forecastto increase by 33.2 percent at towered airports and by 34.0percent at en route traffic control centers. U.S. scheduleddomestic passenger enplanements are expected to increase 53.8percent. International passenger traffic between the UnitedStates and other countries is projected to increase 91.8 percent.
Assessment of Compatibility between Ultrawideband (UWB)Systems and Global Positioning Systems (GPS) Receivers.U.S. Department of Commerce, National Telecommunicationsand Information Administration (NTIA). Anderson, David S.;Drocella, Edward F.; Jones, Steven K.; Settle, Mark A. NTIASpecial Publication 01-45. February 2001. 150 pp. Figures,
2 0 FLIGHT SAFETY FOUNDATION • FLIGHT SAFETY DIGEST • JULY 2001
tables, appendixes. Available through NTIS* and on theInternet at http://www.ntia.doc.gov/osmhome/reports.html.
NTIA is the U.S. government agency responsible fordeveloping domestic telecommunications policy and U.S.policy on international telecommunications. NTIA isresponsible for managing U.S. government use of the radiofrequency spectrum and making recommendations to the U.S.Federal Communications Commission (FCC), whichmanages use of the radio frequency spectrum by those outsidethe federal government.
NTIA, FCC, the U.S. Federal Aviation Administration andother interested organizations have conducted studies todetermine the effect of ultrawideband (UWB) transmissionsystems upon other parts of the radio spectrum. Of particularconcern is the global positioning system (GPS), a satellite-based system that uses radio operating frequencies in restrictedbands for aviation navigation, marine navigation and landnavigation. Two aviation navigation applications beingimplemented are the wide area augmentation system (WAAS)and the local area augmentation system (LAAS).
The report said that GPS “will become the cornerstone of airnavigation for all phases of flight (en route, precision[approach] and nonprecision approach).”
The objective of this technical study was to define themaximum allowable UWB levels that can be tolerated by GPSreceivers, as they are used in various operational applications,without causing performance degradation of GPS receivers.The researchers found scenarios in which UWB could interfereor did interfere with GPS.
Measurements to Determine Potential Interference to GPSReceivers from Ultrawideband Transmission Systems. U.S.Department of Commerce, National Telecommunications andInformation Administration (NTIA), Institute forTelecommunication Sciences. Hoffman, J. Randy; Cotton,Michael G.; Achatz, Robert J.; Statz, Richard N.; Dalke, RogerA. NTIA Report 01-384. February 2001. 218 pp. Figures,tables, appendixes. Available through NTIS* and on theInternet at http://www.its.bldrdoc.gov/pub/pubs.html.
The report says that use of new wireless technologies presentsan inevitable conflict in radio frequency spectrum use and systemcompatibilities. Two such technologies are the global positioningsystem (GPS) and ultrawideband (UWB) transmission systems.
The GPS system consists of 24 satellites that transmit positioncodes and time codes around the world. UWB signals consistof short pulses that vary in timing and position across a widebandwidth. One example of UWB technology is wirelesscommunication.
Various organizations have conducted studies to determine theeffect of UWB transmission systems on other parts of the radio
spectrum. The Institute for Telecommunication Sciences(ITS), the research and engineering branch ofNTIA, U.S. Department of Commerce, recently investigatedthe general characteristics of UWB. ITS also measuredinterference from UWB signals to GPS receivers. Thistechnical report describes laboratory measurements of GPSreceiver vulnerability to UWB interference.
Advisory Circulars
Announcement of Availability: FAA-S-8081-9B, FlightInstructor Instrument Practical Test Standards for Airplaneand Helicopter. U.S. Federal Aviation Administration (FAA)Advisory Circular (AC) 61-133. May 9, 2001. 2 pp. Availablethrough Superintendent of Documents.**
This AC announces the availability of test standards andinformation on obtaining copies of the AC or electronic accessto the AC. FAA inspectors and designated pilot examinersconduct practical tests using standards established by FAA.This AC is intended to aid flight instructors and applicantsduring training and when preparing for the practical tests.
Books
Safety Through Design. Edited by Christensen, Wayne C.;Manuele, Fred A. U.S.: National Safety Council, 1999. 330 pp.
This book discusses the need to design safety into the jobfrom the outset rather than to try to incorporate the elementsof safety later. The book comprises 19 chapters bycontributing authors with diverse backgrounds, includingaviation and aerospace. For example, John M. Thaler,manager of occupational safety and industrial hygiene forSikorsky Aircraft, writes about the use of safety throughdesign techniques to improve employee health, safety andproductivity. The book is written for engineers, managersand safety, health and environmental practitioners, andpresents divergent viewpoints, insights into the concept andexamples for integration and application in existingoperations.♦
Sources
*National Technical Information Service (NTIS)5285 Port Royal RoadSpringfield, VA 22161 U.S.Internet: http://www.ntis.org
**New OrdersSuperintendent of DocumentsP.O. Box 371954Pittsburgh, PA 152-50-7954

FLIGHT SAFETY FOUNDATION • FLIGHT SAFETY DIGEST • JULY 2001 2 1
Accident/Incident Briefs
Landing Gear Separates From FuselageAfter Touchdown
The flight crew of the Fokker 100 said that the separation occurredafter a stable approach and a normal touchdown.
FSF Editorial Staff
The following information provides an awareness of problemsthrough which such occurrences may be prevented in the future.Accident/incident briefs are based on preliminary informationfrom government agencies, aviation organizations, pressinformation and other sources. This information may not beentirely accurate.
inner piston — along with the scissor and wheel assembly —and pieces of the outer case of the gear-strut assembly werefound on the runway.
MEL Revised AfterDepressurization Incident
Airbus A320. No damage. No injuries.
The airplane was in cruise flight at Flight Level (FL) 370 (37,000feet) during a domestic flight in Australia when the flight crewobserved that the left-engine bleed-air fault-warning light hadilluminated. The pressurization system and the air-conditioningsystem automatically shut down, and cabin pressure altitudebegan increasing at about 700 feet per minute.
The flight crew tried unsuccessfully to reselect the left-engine bleed air to the “ON” position, started the auxiliarypower unit (APU) and contacted air traffic control to requestan emergency descent to 10,000 feet. As the airplane reachedFL 200 during the descent, the pressurization system andthe air-conditioning system were restored using the APUbleed-air supply. The flight crew leveled the airplane at FL180 and continued to the destination airport for a normallanding.
When the flight began, the airplane was operating with aminimum equipment list (MEL) restriction because of thefailure of the right-engine high-pressure valve (HPV). Therestriction required that the right-engine bleed-air HPV belocked in the closed position. The engine HPV normally isopened to supplement the bleed-air supply during periods oflow engine speed; at higher speeds, the bleed-air system wassupplied with enough air without using the HPV.
The operator’s MEL (which differed in wording from themanufacturer’s master MEL) said:
Crew Used Rudder toMaintain Directional Control
Fokker 100. Minor damage. No injuries.
Visual meteorological conditions prevailed for the approachand landing at an airport in the United States. The approachwas flown visually, and the flight crew said that the approachwas “stable, and the touchdown was normal.”
After touchdown, however, the flight crew heard a bang.
The preliminary accident report said, “The right wing wentdown, and the aircraft started to move to the right.”
The flight crew used the rudder to maintain directional controlof the airplane, and they stopped the airplane on the runway.The passengers deplaned using mobile stairs.
An initial investigation showed that the lower portion of theright-main landing gear had separated from the airplane. The

2 2 FLIGHT SAFETY FOUNDATION • FLIGHT SAFETY DIGEST • JULY 2001
(1) At low engine power (around idle thrust) setting:
(a) Associated bleed is selected “OFF.”
(b) Cross-bleed valve is selected open.
(c) If wing anti-ice is required, one pack is selected “OFF.”
The incident report said, “The crew interpreted the operator’sMEL to mean that, at engine ‘idle thrust,’ they were to turnthe bleed air from that engine to ‘OFF.’ That prevented anysupply of bleed air for the pressurization [system] and air-conditioning system coming from that engine. They thenopened the bleed-air cross-bleed valve and operated both air-conditioning packs from the right engine only.
“The aircraft then flew with a usable bleed-air systemisolated. Therefore, when the left-engine bleed-air systemfailed, there was a loss of pressurization and air conditioning.”
After the incident, the operator revised the MEL “to reflectthe intention of the manufacturer’s [master] MEL” and to“reduce the possibility of incorrect system operation with oneHP bleed source inoperative,” the report said.
hydroplaned on the wet runway, and all four main-wheel tiresfailed. The flight crew stopped the airplane on the runway.
A post-landing inspection revealed flat spots and deflation ofall four tires. There was no indication of overheating or damageto the brake assemblies, the accident report said. Maintenancepersonnel said that the anti-skid system probably was notturned off.
The accident report said that the probable cause of the accidentwas hydroplaning after touchdown.
Cabin ‘Smoke’ PromptsOrder to Deplane Passengers
De Havilland Dash 8. No damage. No injuries.
The flight crew was about to start the no. 2 engine in preparationfor departure from an airport in Canada when a cabin crewmembertold the captain that there was smoke in the cabin. The flightcrew abandoned the engine-start procedure and called the aircraftrescue and fire fighting service. Passengers were deplaned.
The incident report said that maintenance personnel discoveredthat the “source of the ‘smoke’ was likely steam rising from awet carpet that was exposed to bright sunlight through thepassenger-cabin window.”
Four Tires Fail DuringLanding on Wet Runway
Learjet 35A. Minor damage. No injuries.
The airplane was landed at an airport in South Africa after alate-afternoon heavy rain. After touchdown, the airplane
CorporateBusiness
Airplane Stops on Access RoadAfter Landing Overrun
Hawker Siddeley HS 125-3A. Substantial damage. No injuries.
Instrument meteorological conditions prevailed for theafternoon instrument landing system (ILS) approach to anairport in the United States.
The airplane was flown out of overcast clouds about 400 feetabove ground level. The runway appeared to be dry, withblowing snow, and the two pilots — the only people in theairplane — continued the approach. The accident report saidthat, after touchdown, “dump flaps” and emergency brakesfailed to slow the airplane, and the first officer applied theparking brake. The airplane continued off the departure endof the runway, struck a fence and stopped, with part of theairplane on a public access road.
An air traffic controller said that the airplane was landed at “ahigh rate of speed.”
The pilot of a Piper PA-31 who had flown the same approachahead of the accident airplane described braking action as“good,” although there was slush and snow on the runway. Anairport operations officer who conducted a braking-action teston the runway after the accident, driving a vehicle at 40 milesper hour (64 kilometers per hour), said that braking actionwas “good,” with patches of slush between 0.13 inch (3.30millimeters) and 0.25 inch (6.35 millimeters) thick.
An examination of the airplane showed that the emergencybrake lever on the flight deck was in the release position andthat the accumulator pressure was full-scale high.
“When the emergency brake was selected, a ‘squishing sound’was heard, and the brake pads of the left [-main landing gear]

FLIGHT SAFETY FOUNDATION • FLIGHT SAFETY DIGEST • JULY 2001 2 3
and right-main landing gear were observed to move. Theemergency brake was then released. The brake pedals on theleft [side] and right side of the cockpit were appliedindividually. Each time pressure was applied to a brake pedal,a ‘squishing sound’ was heard, and the brake pads of therespective main landing gear were observed to move.”
A notice to airmen (NOTAM) had been issued about two hoursbefore the accident for “thin wet snow all surfaces.” Therewere no subsequent NOTAMs that discussed runway surfaceoperations.
Airplane Strikes Terrain DuringNight Approach for Landing
Cessna 310. Airplane destroyed. Four fatalities.
Night visual meteorological conditions prevailed for thelanding at an airport in Australia. Police officers on the groundsaid that there was no apparent obstruction to visibility butthat the night was “very dark,” with the moon obscured byclouds. Thunderstorms had been observed north of the airport,but no storms were reported along the airplane’s inbound path.
The accident report said that the police officers observed theairplane northeast of the airport and heard the engines “coughand sputter.”
“They saw the red and green navigation lights on the aircraft’swings start to alternate as the aircraft appeared to rotate,descending vertically towards the ground,” the report said.“For the last part of the descent, there was no apparent noisefrom the engines. The sound of an impact was heard a shorttime after the aircraft had disappeared from view.”
An investigation showed that the airplane had struck the groundat a low forward speed in a nose-down attitude while rotatingto the left. The accident report said that damage was “consistentwith the aircraft being in a spin.”
rudder pedal was stuck. The pilot was given priority for landingand conducted a normal landing.
An inspection found that one of the two rudder-return springswas disconnected from the rudder-control pedal’s aft rudderbar. The spring had been installed on the incorrect side of therudder-bar lever.
Airplane Veers Off RunwayDuring Crosswind Landing
Cessna 172N. Minor damage. No injuries.
Before his mid-afternoon departure from an airport in Englandfor a local flight, the pilot obtained an area weather forecastthat called for visual meteorological conditions and surfacewinds from 210 degrees at 18 knots.
After takeoff, the pilot heard radio transmissions from pilots whowere diverting to another airport because of bad weather. Air trafficcontrol at the departure airport told the pilot that a storm wasdeveloping over the airport. The pilot flew to another airport.
During final approach to land at the other airport, the pilotreceived a report of turbulence from the pilot of the previouslanding aircraft, and the pilot observed a “significant” crosswind,the accident report said. The airplane touched down normally,and the pilot closed the throttle. Then the airplane’s right wingdropped, and the airplane veered to the right and onto the grassnext to the runway. After the airplane slowed, the pilot taxiedthe airplane back onto the runway. The pilot later observed thatthe propeller had been damaged by striking the ground and saidthat the incident was a result of a strong crosswind gust.
Pilot Conducts Normal LandingDespite Failed Rudder Pedal
Cessna 172M. No damage. No injuries.
The airplane was being flown on a night approach to an airportin Canada when the pilot told air traffic control that the left
Tail Boom SeveredDuring Crosswind Landing
Hughes 369HS. Minor damage. No injuries.
The helicopter was being hover-taxied to a fueling facility at anairport in England. After touchdown, the helicopter rotated left.The accident report said that after one complete revolution, thehelicopter “appeared to become airborne briefly,” the rate ofturn increased, and the helicopter rotated another half revolutionbefore stopping near the fuel pumps. After shutting down theengines, the pilot observed that the tail boom had been severed.
2 4 FLIGHT SAFETY FOUNDATION • FLIGHT SAFETY DIGEST • JULY 2001
Surface wind was from 60 degrees at 16 knots, with gusts to25 knots. The touchdown was on a heading of 170 degrees.
Inspection showed that the tail-rotor flapping stops had beendestroyed.
The accident report said, “The combination of low rotor rpm[revolutions per minute] and high yaw-pedal demand couldhave allowed the tail rotor to flap excessively during thegyration, causing pounding damage to the flapping stops,followed by the blades coming into contact with the tail boom.The normal clearance between the tail-rotor blade tips and thetail boom is about three inches (7.6 centimeters).
“[A maintenance technician] reported that the pilot’s initialassessment was that the helicopter began to rotate to the right,so he applied left pedal to prevent this. The video recording ofthe event showed that the helicopter had rotated to the left.The tendency to rotate left was also exacerbated by thecrosswind from the left side.”
Faulty Switch Likely inNavigation Discrepancy
Aerospatiale AS 332L Super Puma. No damage. No injuries.
Instrument meteorological conditions prevailed for the flight toan airport in Australia, and the pilot was using the helicopter’sglobal positioning system (GPS) to navigate to the initialapproach fix for a very-high-frequency omnidirectional radio/distance measuring equipment (VOR/DME) approach.
After the pilot received clearance for the approach, he switchedthe navigation source-control switch from “A NAV” (for GPSnavigation) to “NAV 2” and “VOR 2” (for the approach).
The incident report said, “Immediately, the navigation‘EMERG MODE’ light on the pilot’s bearing pointer’s controlpanel illuminated. In accordance with the emergency checklist,the pilot selected his radio navigation sources to [automaticdirection finder] 1, ‘VOR 2’ and ‘NAV 2’.”
After the helicopter was established on the final approach, thepilot observed that the course bar on the horizontal situationindicator (HSI) was centered but that the “NAV 2” bearingpointer indicated that the helicopter was five degrees to 10degrees to the right of course.
“The course bar on the copilot’s HSI was indicating half-scaleleft of track, and the copilot’s bearing pointer was also showing
that the helicopter was to the left of track,” the report said.
The helicopter then entered visual meteorological conditions, andthe crew discontinued the instrument approach. After thehelicopter was landed, the problem was no longer apparent, andmaintenance personnel were unable to reproduce the problem onthe ground. Maintenance personnel said later that they believedthere had been an internal fault in the navigation switching system.
Inadequate LubricationCited in Engine Failure
Bell 206B. Substantial damage. No injuries.
The helicopter was being flown from South Africa toMozambique when the pilot heard a bang, and the helicopteryawed to the left. As the pilot applied right anti-torque pedalto counter the yaw, the engine-out warning light illuminatedand the engine-out audio warning sounded.
The accident report said, “With the throttle still at full power,the main-rotor rpm [revolutions per minute] was decreasing,[and] the helicopter was established in autorotational flight.”
The pilot decided to land the helicopter in an open area on ariverbank. During the descent, he observed that the power turbinerpm exceeded the main-rotor rpm. The pilot, who recently hadcompleted recurrent training in which a similar scenario wasdiscussed, left the engine running to maintain tail-rotor controlfor the landing. Nevertheless, the pilot observed that, with thethrottle open, the engine gas generator speed (Ng) was at idle(58 percent), the power turbine was at 100 percent and the main-rotor rpm was at 45 percent and decreasing.
During the descent, the pilot also observed that the engine-chip warning light had illuminated.
As the helicopter touched down, a main-rotor blade severedthe tail boom and the tail-rotor drive shaft.
The accident report said that the probable cause of the accidentwas that “the power transferred from the engine by the maindrive shaft via the inner coupling to the outer coupling,combined with the relative movement between the twocouplings, caused the generation of heat.
“The generation of excessive heat between the outer-[coupling-teeth] and inner-coupling-teeth mating faces is attributed toinadequate lubrication, resulting in seizure of the inner-teethmating faces and, consequently, fractures of the fixationbolts.”♦


Want more information about Flight Safety Foundation?
Contact Ann Hill, director, membership and developmentby e-mail: [email protected] or by telephone: +1 (703) 739-6700, ext. 105.
Visit our World Wide Web site at http://www.flightsafety.org
We Encourage ReprintsArticles in this publication, in the interest of aviation safety, may be reprinted in whole or in part, but may not be offered for sale, used commerciallyor distributed electronically on the Internet or on any other electronic media without the express written permission of Flight Safety Foundation’sdirector of publications. All uses must credit Flight Safety Foundation, Flight Safety Digest, the specific article(s) and the author(s). Please send twocopies of the reprinted material to the director of publications. These reprint restrictions apply to all Flight Safety Foundation publications.
What’s Your Input?In keeping with FSF’s independent and nonpartisan mission to disseminate objective safety information, Foundation publications solicit crediblecontributions that foster thought-provoking discussion of aviation safety issues. If you have an article proposal, a completed manuscript or a technicalpaper that may be appropriate for Flight Safety Digest, please contact the director of publications. Reasonable care will be taken in handling amanuscript, but Flight Safety Foundation assumes no responsibility for material submitted. The publications staff reserves the right to edit allpublished submissions. The Foundation buys all rights to manuscripts and payment is made to authors upon publication. Contact the PublicationsDepartment for more information.
Flight Safety DigestCopyright © 2001 Flight Safety Foundation Inc. ISSN 1057-5588
Suggestions and opinions expressed in FSF publications belong to the author(s) and are not necessarily endorsed byFlight Safety Foundation. Content is not intended to take the place of information in company policy handbooks
and equipment manuals, or to supersede government regulations.
Staff: Roger Rozelle, director of publications; Mark Lacagnina, managing editor; Wayne Rosenkrans, senior editor; Linda Werfelman, senior editor;Karen K. Ehrlich, web and print production coordinator; Ann L. Mullikin, production designer; Susan D. Reed, production specialist; and
Patricia Setze, librarian, Jerry Lederer Aviation Safety Library
Subscriptions: One year subscription for twelve issues includes postage and handling: US$480. Include old and new addresses whenrequesting address change. • Attention: Ahlam Wahdan, membership services coordinator, Flight Safety Foundation, Suite 300, 601 MadisonStreet, Alexandria, VA 22314 U.S. • Telephone: +1 (703) 739-6700 • Fax: +1 (703) 739-6708
What can you do toimprove aviation safety?Join Flight Safety Foundation.AVIATION SAFETY RESOURCES TO THE WORLD FOR more than 50 YEARS
• Read internationally recognized publicationsincluding Accident Prevention, Cabin CrewSafety and Flight Safety Digest.
• Use resources of the Jerry Lederer Aviation SafetyLibrary.
• Attend renowned safety seminars for airline andcorporate aviation managers.
• Access convenient links to member-companyhome pages.
• Benefit from safety services including safetyaudits and internal evaluation programs.
An independent, industry-supported,nonprofit organization for theexchange of safety information
SINCE 1947SINCE 1947
Flight Safety Foundation