flexural bending behaviour of built-up glulam box
TRANSCRIPT
Lakehead University
Knowledge Commons,http://knowledgecommons.lakeheadu.ca
Electronic Theses and Dissertations Electronic Theses and Dissertations from 2009
2018
Flexural bending behaviour of built-up
glulam box-selection beams at ambient
and elevated temperatures
Verma, Nishant
http://knowledgecommons.lakeheadu.ca/handle/2453/4259
Downloaded from Lakehead University, KnowledgeCommons
FLEXURAL BENDING BEHAVIOUR OF BUILT-UP GLULAM
BOX-SECTION BEAMS AT AMBIENT AND ELEVATED
TEMPERATURES
by
Nishant Verma
A thesis
submitted to the Faculty of Graduate Studies
in partial fulfilment of the requirements for the
Degree of Master of Science
in
Civil Engineering
Supervisor
Dr. O. Salem, Ph.D., P. Eng.
Associate Professor – Dept. of Civil Engineering
Lakehead University
Thunder Bay, Ontario
June 2018
© Nishant Verma, 2018

ii
Preface
This thesis is the original, unpublished, independent work conducted by the author under the
supervision of Dr. O. Salem.
I understand that my thesis may be made electronically available to the public.
iii
Abstract
The recent increasing trend of sustainable construction and advancement in the manufacturing
of engineered wood have made products such as glued-laminated timber (glulam) and cross-
laminated timber (CLT) preferred building materials. The intensifying demand for engineered-
wood products in Canada also has prompted amendments to the building codes of several
provinces by reducing the height restriction of timber structures from four to six stories.
Unfortunately, the design of built-up timber beams has not yet been incorporated in most wood
design standards worldwide. Thus, this lack of design guidelines brings forth the demand of
acceptable methods to analyze, design and manufacture such built-up beam sections.
The experimental research study detailed here in this thesis has been carried out to investigate
the flexural bending behaviour of built-up glulam box-section beam assemblies fabricated
using two engineered-control techniques at both, ambient and elevated temperatures. Seven
full-size built-up glulam beam test assemblies were experimentally examined under four-point
flexural bending to determine their maximum bending strengths at ambient temperature. Five
of the seven beam assemblies tested at ambient temperature were fabricated using self-tapping
screws; while the other two assemblies were built using industrial structural adhesive. The
outcomes of ambient testing showed that reducing the spacing from 800 mm to 200 mm for the
screws connecting the built-up beam section’s top and bottom flange panels to the web panels
increased the beam flexural bending strength by about 45%. While reducing the spacing from
200 mm to 100 mm only for the screws connecting the bottom flange panel to the web panels
over a distance equal to one-third beam span length from each support, where shear stresses
are maximum, increased the beam flexural bending strength by an additional 10%. However,
the experimental results of the glued beam assemblies showed considerable flexural bending
strengths that are almost equal to the calculated strength of an equivalent hollow-section glulam
beam. The influence of the bonding technique and configuration followed in fabricating the
built-up beam sections, whether screwed or glued, was also investigated through observing the
different failure modes that the built-up beam assemblies exhibited during testing. In addition,
the experimental results of the ambient tests were used to verify the calculated bending strength
capacity of the built-up glulam beams.
Out of each of the glued and screwed assembly groups, only the strongest built-up beam
assembly was examined under the effect of CAN/ULC-S101 standard fire while subjected to
monotonic loading that was equivalent to the full-capacity design load of the weakest screwed
built-up beam assembly with 200-mm screw spacings. The fire resistance tests were conducted
iv
using the large-size fire testing furnace accommodated at Lakehead University’s Fire Testing
and Research Laboratory (LUFTRL).
Outcomes of the fire resistance tests revealed that the glued built-up beam assemblies
experienced greater mid-span deflections as well as beam end rotations in comparison to the
screwed built-up beam assemblies. This inferior behaviour can be interpreted to the low fire
resistance of the adhesive used in fabricating the built-up beam assemblies, which excessively
limited the beam’s shear and bending strengths at elevated temperatures. On contrary, the self-
tapping screws noticeably helped in keeping the built-up beam assemblies intact for longer
time during fire testing even when the screws were exposed to direct fire heating.
v
Acknowledgement
The successful completion of this thesis is the outcome of constant guidance and
encouragement provided by Dr. Salem throughout the duration of my graduate program.
This research project was funded using NSERC- Discovery Grant held by Dr. Salem, as well
as in-kind contribution by Nordic Structures Inc.
The author would like to also thank research assistant C. Hubbard for his assistance in preparing
test specimens and in conducting the experiments of this research project. Thanks, are also
extended to C. Hagstrom and R. Timmon for their assistance in the Civil Engineering Structures
Laboratory at Lakehead University.

vi
Dedication
The author would like to dedicate this thesis to his parents and Dr. Salem as a gesture of
gratitude towards the invaluable support provided by them.
vii
Table of Contents
Abstract .................................................................................................................................... iii
Acknowledgement .................................................................................................................... v
List of Tables ............................................................................................................................ x
List of Equations ...................................................................................................................... xi
List of Figures ......................................................................................................................... xii
Nomenclature .......................................................................................................................... xv
Chapter 1 Introduction ...................................................................................................... 1
1.1 Background ............................................................................................................. 1
1.2 Problem Statement .................................................................................................. 1
1.3 Scope and Objectives .............................................................................................. 2
Chapter 2 Literature Review ............................................................................................. 4
2.1 Glulam Grading and Manufacturing Process .......................................................... 4
2.1.1 Lumber Drying and Grading ............................................................................ 5
2.1.2 End Jointing ...................................................................................................... 5
2.1.3 Face Gluing ...................................................................................................... 7
2.1.4 Finishing and Fabrication ................................................................................. 7
2.2 Self-Tapping Screws ................................................................................................ 7
2.3 Adhesives ................................................................................................................ 9
2.4 Flexural Behaviour of Timber Beams .................................................................... 10
2.4.1 Solid Timber Beams ....................................................................................... 10
2.4.2 Glulam Timber ............................................................................................... 12
2.4.2.1 Solid glulam sections ........................................................................... 12
2.4.2.2 Built-up glulam sections ...................................................................... 14
2.5 Flexural Behaviour of Glulam Beams with Reinforcement ................................... 15
2.5.1 Fibre-reinforced Polymer ............................................................................... 15
2.5.2 Pre-Stressing .................................................................................................. 17
2.5.3 Miscellaneous Techniques .............................................................................. 18
2.6 Numerical Analysis of Beams ............................................................................... 19
2.6.1 Euler-Bernoulli Theory .................................................................................. 19
2.6.2 Timoshenko Beam Theory ............................................................................. 21
2.6.3 Vlasov’s Energy Theorem .............................................................................. 23
2.7 Finite Element Analysis of Beams ......................................................................... 23
viii
2.8 Fire Resistance of Structures ................................................................................. 24
2.8.1 Standards and their Limitations ...................................................................... 27
2.8.2 Characteristics of Compartment Fires ............................................................ 28
2.8.2.1 Pre-flashover fire ............................................................................... 29
2.8.2.2 Flashover ............................................................................................ 30
2.8.2.3 Post-flashover ..................................................................................... 30
2.8.3 Behaviour of Timber in Fire ........................................................................... 31
2.8.3.1 Effect of moisture content .................................................................... 31
2.8.3.2 Effect of density ....………………………………………………....... 32
2.8.3.3 Effect of shape and fabrication of timber ............................................. 34
2.8.3.4 Charring depth ....…………………………….…………………....... 35
2.8.3.5 Fire retardant treatments ..................................................................... 36
2.9 Summary ............................................................................................................... 37
Chapter 3 Research Methodology ……………………………………………………... 39
3.1 Materials ………………………………………………………………………… 39
3.1.1 Glulam Panels ……………………………………………………………… 39
3.1.2 Self-Tapping Screws ……………………………………………………….. 40
3.1.3 Polyurethane Adhesive ……………………………………………………... 41
3.2 Analytical Study ………………………………………………………………… 42
3.2.1 Design Load Capacity of Built-up Beam ...……….............………………… 42
3.2.2 Ultimate Load Capacity of Hollow Glulam Beam ………………………….. 46
3.2.3 Ultimate Load Capacity of Solid Glulam Beam ……………………………. 47
3.3 Fabrication Process of Experimental Test Assemblies …………………………... 49
3.3.1 Screwed Test Specimens …………………………………………………… 49
3.3.2 Glued Test Specimens ……………………………………………………… 53
Chapter 4 Experimental Testing at Ambient Temperature …………………………... 56
4.1 Experimental Testing Program ………………………………………………….. 56
4.2 Data Acquisition ………………………………………………………………… 57
4.3 Experimental Test Setup and Details ……………………………………………. 57
4.4 Experimental Results ……………………………………………………………. 58
4.4.1 Beam Mid-Span Deflections ……………………………………………….. 58
4.4.2 Beam End Rotations ……......………………………………………………. 60
4.4.3 Beam Relative Slips ..………………………………………………………. 62
4.4.4 Summary of Results ......……………………………………………………. 64
ix
4.5 Observed Failure Modes ………………………………………………………… 64
Chapter 5 Experimental Testing at Elevated Temperatures …………………………. 70
5.1 Experimental Testing Program ………………………………………………….. 70
5.2 Data Acquisition ………………………………………………………………… 72
5.3 Experimental Test Setup and Procedure ………………………………………… 73
5.4 Experimental Results ……………………………………………………………. 77
5.4.1 Effect of Elevated Temperatures on the Beam Mid-Span Deflections ........... 77
5.4.2 Effect of Elevated Temperatures on the Beam End Rotations ...……......…... 78
5.4.3 Time-Temperature Curves ………………………………………………….. 80
5.5 Observed Failure Modes ………………………………………………………… 83
Chapter 6 Discussion of Experimental Results ……………………………………….. 85
6.1 Ambient Temperature Results ...………………………………………………… 85
6.2 Elevated Temperature Results ...………………………………………………… 86
Chapter 7 Conclusions and Recommendations for Future Work …………………… 89
7.1 Conclusions ……………………………………………………………………... 89
7.1.1 At Ambient Temperature …………………………………………………… 89
7.1.2 At Elevated Temperatures ………………………………………………….. 90
7.2 Recommendations for Future Work ……………………………………………... 90
References ………………………………………………………………………………….. 92
Appendix – I
x
List of Tables
Table 3.1 Mechanical properties of glulam panels ............................................................... 40
Table 3.2 Mechanical properties of self-tapping screws ...................................................... 40
Table 3.3 Summary of design load capacity of screwed beam assemblies .......................... 46
Table 4.1 Ambient temperature tests matrix ...………………............................................. 58
Table 4.2 Comparison of ultimate load-carrying capacities of built-up beams ................... 64
Table 5.1 Fire resistance tests matrix ..………………......................................................... 76
Table 5.2 Summary of fire resistance tests results …........................................................... 83
xi
List of Equations
Equation 2.1 Factored bending moment resistance .............................................................. 12
Equation 2.2 Factored bending moment resistance, Mr1 ................................................................................... 13
Equation 2.3 Factored bending moment resistance, Mr2 ................................................................................... 13
Equation 2.4 Relationship between load applied on a beam and beam deflection .............. 20
Equation 2.5 Equation to calculate stresses in the beam ..................................................... 20
Equation 2.6 Bending moment of the beam ........................................................................ 20
Equation 2.7 Equation for displacement of the beam in Timoshenko beam theory ............ 22
Equation 2.8 Equation for bending moment of the beam in Timoshenko beam theory ...... 22
Equation 2.9 Equation for shear force of the beam in Timoshenko beam theory ............... 22
Equation 2.10 Equation to calculate rotation of the beam using Vlasov’s theorem .............. 23
Equation 2.11 Equation to determine fire resistance of a construction material as per British
code ................................................................................................................ 27
Equation 3.1 Centroidal axis of the built-up section in x direction ..................................... 43
Equation 3.2 Centroidal axis of the built-up section in y direction ..................................... 43
Equation 3.3 Moment of inertia of the beam in x direction ................................................ 43
Equation 3.4 Moment of inertia of the beam in y direction ................................................ 43
Equation 3.5 Shear stress formula ....................................................................................... 44
Equation 3.6 Formula to calculate shear flow in beam ....................................................... 45
Equation 3.7 Formula to calculate shear force on the beam ................................................ 45
Equation 3.8 Mid-span deflection experienced by the beam ............................................... 46
Equation 3.9 Maximum deflection of the beam .................................................................. 47
Equation 3.10 Factored bending moment resistance of the beam, Mr1 ...................................................... 48
Equation 3.11 Factored bending moment resistance of the beam, Mr2 ...................................................... 48
Equation 3.12 Factored Shear resistance of the beam, Vr ........................................................ 48
xii
List of Figures
Figure 2.1 Flow diagram of glulam manufacturing process ............................................... 5
Figure 2.2 Illustration of finger joint of laminates .............................................................. 6
Figure 2.3 Illustration of scarf joint of laminates ............................................................... 6
Figure 2.4 Curved glulam beam reinforced with self-tapping screws ............................... 8
Figure 2.5 Imaginary links of adhesive bond between two pieces of wood ...................... 9
Figure 2.6 Principal axes of wood with respect to grain direction and growth rings ........ 11
Figure 2.7 Solid glulam beams ......................................................................................... 13
Figure 2.8 I-section glulam beam ..................................................................................... 14
Figure 2.9 BFRP spike layout .......................................................................................... 16
Figure 2.10 Pre-stressing in timber beams .......................................................................... 18
Figure 2.11 Euler-Bernoulli beam theory .......................................................................... 20
Figure 2.12 Comparison of Euler-Bernoulli beam model with Timoshenko beam ............. 21
Figure 2.13 Standard time-temperature curves .................................................................. 27
Figure 2.14 Comparison of the time-temperature curve of a compartment fire to that
of a standard fire …..……………………………………………………….... 29
Figure 2.15 Relationship between density () and rate of combustion (RC) ...................... 33
Figure 2.16 Engineered timber I-section joist ..................................................................... 34
Figure 2.17 Comparison of different layers of wood after and before exposure to fire ...... 36
Figure 2.18 Charring of glulam beams in three and four-face fire exposure ….................. 36
Figure 3.1 Glued-laminated timber production process .................................................. 39
Figure 3.2 Glulam box-section beam components and dimensions ................................ 39
Figure 3.3 GRK-RSS self-tapping screw ........................................................................ 41
Figure 3.4 Illustration of coordinate axes and parts of the beam built-up cross section . 42
Figure 3.5 Illustration of neutral axis of the beam built-up cross section ....................... 43
Figure 3.6 Shear stresses in the beam built-up cross section ........................................... 44
Figure 3.7 Hollow glulam beam ...................................................................................... 46
Figure 3.8 Solid glulam Beam ......................................................................................... 47
Figure 3.9 Placement of web and top and bottom flange panels ..................................... 50
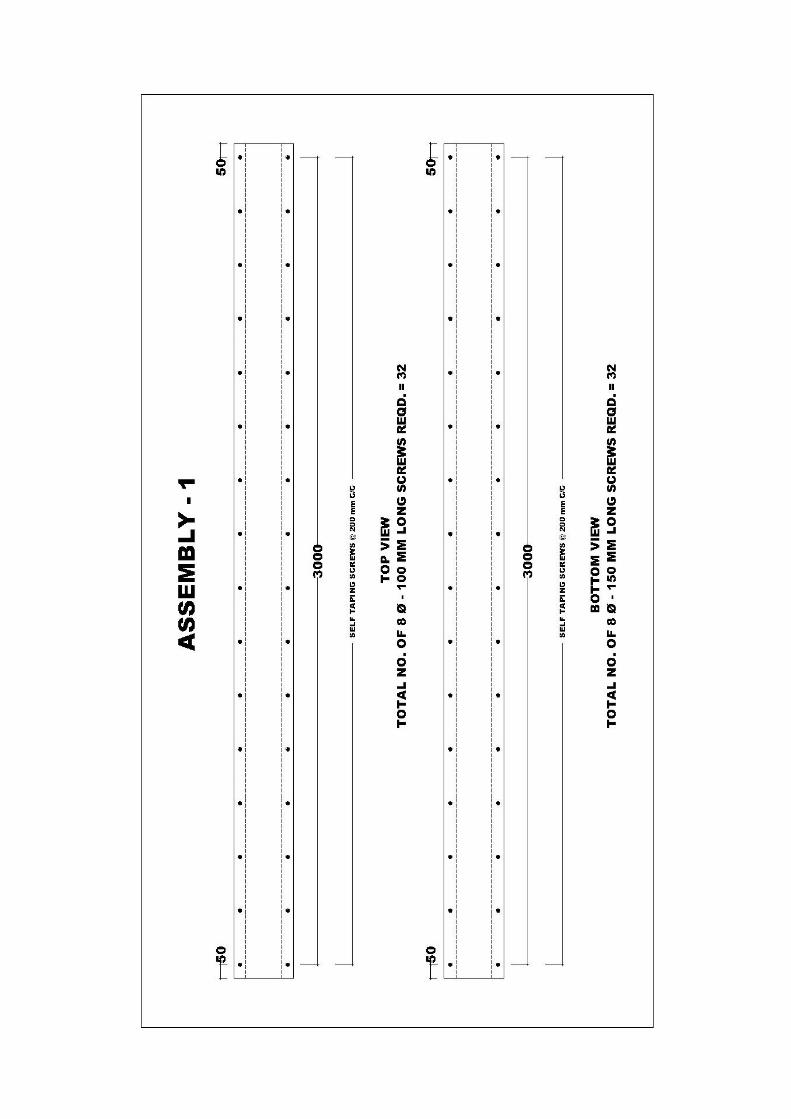
Figure 3.10 Top and bottom views of the built-up beam showing placement of
self-tapping screws ......................................................................................... 51
Figure 3.11 Pilot holes drilling through the top side of the beam assembly ...................... 51
Figure 3.12 Screws thrusting at top side of the beam assembly ........................................ 52
xiii
Figure 3.13 Bottom side of a finished screwed beam assembly …………........................ 52
Figure 3.14 Bottom flange temporary placed in hydraulic compression press system ..... 53
Figure 3.15 Built-up beam assembly right before applying pressure ................................ 54
Figure 3.16 Applying compressive pressure on built-up beam assembly ......................... 54
Figure 3.17 Finished glued beam assembly ....................................................................... 55
Figure 4.1 A general built-up glulam box-section beam assembly undergoing testing .. 56
Figure 4.2 A general test setup with transducers layout for ambient temperature
testing ............................................................................................................. 58
Figure 4.3 Load vs. mid-span deflections of test assemblies ........................................... 59
Figure 4.4 A built-up glulam beam assembly undergoing deflection .............................. 60
Figure 4.5 Load vs. beam end rotations of test assemblies ….......................................... 61
Figure 4.6 Beam end rotations of test assembly during experiment …............................ 61
Figure 4.7 Load vs. relative slips at the top flange of test assemblies ............................. 63
Figure 4.8 Load vs. relative slips at the bottom flange of test assemblies ....................... 63
Figure 4.9 Rolling shear failure in the web panel of a general test beam assembly ........ 65
Figure 4.10 Brittle failure in bottom flange of a general screwed test beam assembly ..... 66
Figure 4.11 Illustration of relative slips in a general screwed test beam assembly ........... 67
Figure 4.12 Illustration of yielding in self-tapping screws ................................................ 68
Figure 4.13 Rolling shear failure in top flange of glued specimen .................................... 68
Figure 4.14 Cross-grain tensile failure in side web of glued specimen ............................. 69
Figure 4.15 Ultimate shear failure in glue line .................................................................. 69
Figure 5.1 Lakehead University Fire Testing and Research Laboratory (LUFTRL) ...... 71
Figure 5.2 Large custom-designed furnace accommodated at LUFTRL ........................ 71
Figure 5.3 Human-machine interface (HMI) of LUFTRL furnaces’ control panel ......... 73
Figure 5.4 A general fire test setup up with displacement transducers and thermocouples
schematics ...................................................................................................... 75
Figure 5.5 A general test setup inside the fire testing furnace ........................................ 76
Figure 5.6 A general beam test assembly undergoing fire resistance testing .................. 77
Figure 5.7 Beam’s mid-span deflection vs. temperature curves in fire resistance tests .. 78
Figure 5.8 Beam end rotations vs. temperature in fire resistance tests …........................ 79
Figure 5.9 Time-Temperature curves of screwed beam assemblies ................................ 81
Figure 5.10 Time-temperature curves of glued beam assemblies ..................................... 82
Figure 5.11 Wood charring and exposed screw in a screwed assembly during fire
resistance testing ............................................................................................ 83

xiv
Figure 5.12 Excessive yielding in top and bottom screws due to degradation of mechanical
properties of screws ….................................................................................... 84
xv
Nomenclature
Roman
A cross-sectional area
E modulus of elasticity
ECw warping stiffness
𝑓𝑏 specified strength in bending
G shear modulus
I cross-sectional moment of inertia
𝐾𝐷 load duration factor
𝐾𝐻 system factor
𝐾𝑆𝑏 service condition factor
𝐾𝑇 treatment factor
𝐾𝑍𝑏 size factor
𝐾𝐿 lateral stability factor
𝐾𝑋 curvature factor
𝐾𝑆𝑣 longitudinal shear
Timoshenko shear coefficient
mx distributed torsion moment along the beam
𝑀𝑟 factored resistive bending moment
𝑀 bending moment
P applied concentrated force
𝑃𝑢𝑙𝑡. ultimate load capacity
𝑄 shear force
q distributed load
xvi
𝑅𝑓 minimum load capacity
𝑆 section modulus
t shear stress
t* width of the member’s cross-sectional area
𝑡𝑓𝑎𝑖𝑙 time of failure of the element
𝑡𝑠 duration of fire
𝑇𝑚𝑎𝑥 maximum temperature
𝑇𝑓𝑎𝑖𝑙 temperature to cause failure
t time from start of test in minutes
T temperature at time t (C)
To initial temperature (C)
𝑈𝑓 applied load at the time of fire
𝑉𝑟 factored resistive shear force
V internal resultant shear force
Greek
reduction factor for wood
∆ maximum beam deflection
1
CHAPTER 1 INTRODUCTION
1.1 Background
With the increasing trend of sustainable building construction, timber has been gaining great
attention as a “green solution” for construction. Timber as a sustainable construction material
has several advantages over other alternatives, such as ease of fabrication, lower cost and being
environmental friendly material. Even though commercial sawn lumber even though can be
easily attainable, it has size limitations which can restrict designers when larger sections are
required. Thus, the development of engineered-wood products, such as glued-laminated timber
(glulam) and cross-laminated timber (CLT), has opened new possibilities to further utilize
wood in engineering design and construction. Not only does glulam have good fire resistance
mainly due to large section sizes, it also has good product dimensional stability; therefore, the
chances of cupping, crowning, wrapping and other defects found in traditional sawn lumber
are rarely found in engineered wood (Smulski, 1997). These advantages allowed the use of
glulam in the construction of mid- and high-rise structures. An outstanding example of such
tall wood buildings in North America is University of British Columbia’s Brock Commons
Residence located in Vancouver, Canada. It is the tallest modern timber building in the world
with eighteen stories that has been in operation since 2017.
The intensifying demand of engineered-wood products in mid- and high-rise construction,
especially glulam, compels the development of more effective design of structural elements
made of such high strength-to-weight ratio materials. This can be achieved by optimizing the
cross-sectional distribution of timber sections which uses a lesser amount of wood. Timber
built-up sections are an example of such optimized systems that can achieve almost the same
strength and stiffness as solid beams.
1.2 Problem Statement
Unfortunately, the design of such built-up sections has not been fully incorporated yet in most
wood design manuals available around the world including the Canadian Design Manual
(Canadian Wood Council, 2015). Thus, this lack of design specifications brings forth the
demand for developing acceptable techniques to analyse and design such built-up sections. The
findings of some research studies showed that weakness of the bond between web and flange
panels of a built-up timber section is the main cause of premature failure of such sections
(Hoger et al., 2013). Accordingly, it is very crucial to strengthen the bond between the panels
of a built-up section. Some researchers used nails at a dense spacing to enable this type of built-
2
up sections to behave more rigidly as consolidated section (Milner and Tan, 2001). However,
because of the low shear resistance capacity of nails, they are more prone to rapid deformation
causing a considerable decrease in the flexural bending strength of built-up section beams.
Therefore, to enhance the strength and rigidity of built-up section timber beams, alternative
bonding agents, such as high strength adhesives or fasteners with high withdrawal and shear
strengths, are more practical options. Some European standards have provided guidelines on
the minimum and maximum spacing between screws to be used in built-up sections of
structural members (ETA 12/0062, 2012 and ETA 11/0190, 2013). The techniques of utilizing
self-tapping screws to fabricate and strengthen built-up timber beams have been explored by
very few researchers (Hashim, 2012).
Also, with the increasing awareness of structural fire safety, building codes and design
standards are being amended to incorporate procedures to determine the fire resistance of
structural elements based on the performance of these elements in experimental fire testing.
Timber being a combustible material, the study of the behaviour of timber structures subjected
to fire is more crucial in comparison to other construction materials, such as concrete or steel.
So far, built-up timber beams have been used as insulating components to protect inner post-
tensioning steel systems (Costello et al., 2014). Accordingly, a good understanding of the
flexural bending behaviour of built-up timber beams is required so that they can be efficiently
implemented in building construction. To calculate the flexural bending strength of a built-up
timber box-section beam, the major causes of deformations, i.e., bending and shear stresses,
are very crucial to be considered and accurately analysed. As a simple, yet practical approach,
basic mechanics of material principals were used here in this thesis to evaluate the design
flexural bending strength of the built-up glulam box-section beam assemblies under transverse
loading.
1.3 Scope and Objectives
The experimental research study detailed here in this thesis has been carried out to investigate
the flexural bending behaviour of built-up glulam box-section beams at both ambient and
elevated temperatures. The experimental testing program consisted of seven full-size built-up
box-section beam assemblies that were subjected to monotonic loading till failure at ambient
temperature, as well as four selected test assemblies that were exposed to elevated temperatures
of standard fire while subjected to monotonic loading that was equivalent to the full-capacity design
load of the weakest screwed built-up beam assembly. Test variables investigated in this research
3
project included two different engineered controlled joining techniques: using self-tapping
screws and industry-grade adhesive for joining the components of beam assemblies together,
as well as the effects of these variables on ambient and fire performance of the different beam
assemblies.
At ambient temperature, seven test specimens fabricated using three test assembly
configurations were examined, representing two assemblies based on the different spacing of
self-tapping screws and one assembly using Loctite PURBOND adhesive to fabricate the
specimens. The results of the ambient tests were used to verify the calculated design load and
strength of the test assemblies so they all can be loaded to the full design load of the weakest
screwed assembly before being exposed to CAN/ULC-S101 standard fire. The primary
objectives of the research project presented herein this thesis are listed below:
1. Develop geometries to provide the spacing limit of screws used to join the web and
flange panels of the built-up glulam box-section beam assemblies;
2. Determine the ultimate flexural bending strength and dominant failure modes of the
experimentally examined built-up beam assemblies at ambient temperature;
3. Observe and compare the behaviour of the strongest screwed beam assembly against
the comparable glued beam assembly in standard fire condition.
4
CHAPTER 2 LITERATURE REVIEW
Glued-laminated timber (glulam) is an engineered-wood product that is fabricated using
individual pieces of kiln-dried lumber, then laminated together under pressure to form
structural members of larger cross sections that retain the traditional beauty of wood along with
enhanced mechanical properties. The recent amendments to the Canadian national and several
provincial building codes that currently allowing the use of timber as the primary construction
material for up to six story buildings have resulted in growth in the use of glulam as a reliable
construction material. However, research focusing on the fire performance of heavy-timber
structures mainly built of glulam as well as the development of efficient design guidelines for
such buildings is still undergoing. While standards are available for fire resistance design of
glulam structural members in Canada, there is still lack of design guidelines for built-up glulam
sections. More in-depth research in this primary area of concern is necessary in order to
efficiently utilize glulam sections in mid and high-rise timber buildings.
2.1 Glulam Grading and Manufacturing Process
Glulam is a stress-rated structural product that is manufactured by joining small lumber
together to form larger structural members for applications such as floor beams, arches and
ridge beams (Wood Handbook, 2010). One advantage of glulam manufacturing process is the
possibility of use of different wood species and/or grades to fabricate glulam sections. In North
America, major species group and combinations which are commonly used for glued-laminated
timber are Douglas fir-latch, spruce pine-fir and southern pine (Canadian Wood Council,
2015). To obtain a quality product with specified engineering design values, the manufacturing
of glulam must be followed as specified in recognized standards, such as ANSI/AITC A190.1
for United States of America and CAN/CSA 0122-16 for Canada. The glulam manufacturing
process consists of four main phases, as listed below and shown in Figure 2.1 (Smulski, 1997;
Wood Handbook, 2010);
1. Drying and grading of lumber
2. End jointing
3. Face gluing
4. Finishing and Fabrication.

5
Figure 2.1. Flow diagram of glulam manufacturing process (United States
Environmental Protection Agency – AP42, 2002).
2.1.1 Lumber Drying and Grading
As per the specification of manufacturing standards for structural glued-laminated products, to
avoid any dimensional change during the process, it is critical that the lumber which is to be
used to manufacture glulam must be dried either onsite or through kiln drying (CSA-0122-16).
For most applications, CSA-0122-16 permits a maximum moisture content between 12% and
16%. Once the desired moisture content is achieved, the lumber stock is then checked for
natural deformities such as knots. This allows rectification of almost all major deformities
before the lumber is graded. In Canada, lumber stock is divided into four grade groups which
are B, B-F, D or C, with B and B-F for high-quality lumber and D and C for studs (Canadian
Wood Council, 2015). Based on the grades received, the lumber is then sorted into stacks for
further processing.
2.1.2 End Jointing
Since glulam members can be manufactured in lengths longer than those generally available
for sawn lumber, the laminates must be end-jointed. Majority of glulam manufacturers
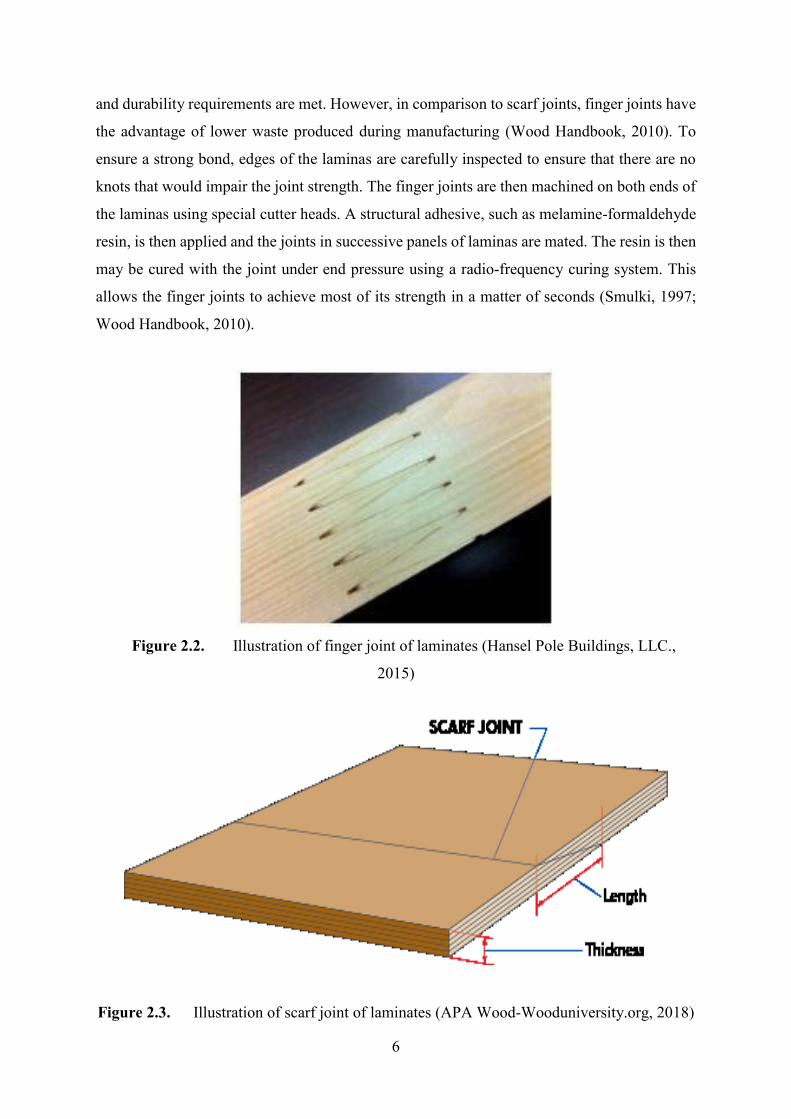
commonly use finger joints of 1.0-in length to make continuous laminations (Figure 2.2)
(Smulski, 1997; CSA-0122-16). Other end joint configuration, such as scarf jointing, shown in
Figure 2.3, is also accepted by glulam manufacturing standards, provided that specific strength
6
and durability requirements are met. However, in comparison to scarf joints, finger joints have
the advantage of lower waste produced during manufacturing (Wood Handbook, 2010). To
ensure a strong bond, edges of the laminas are carefully inspected to ensure that there are no
knots that would impair the joint strength. The finger joints are then machined on both ends of
the laminas using special cutter heads. A structural adhesive, such as melamine-formaldehyde
resin, is then applied and the joints in successive panels of laminas are mated. The resin is then
may be cured with the joint under end pressure using a radio-frequency curing system. This
allows the finger joints to achieve most of its strength in a matter of seconds (Smulki, 1997;
Wood Handbook, 2010).
Figure 2.2. Illustration of finger joint of laminates (Hansel Pole Buildings, LLC.,
2015)
Figure 2.3. Illustration of scarf joint of laminates (APA Wood-Wooduniversity.org, 2018)
7
2.1.3 Face Gluing
Prior to face gluing process, the full length of each end-jointed lumber is planned on both sides
to ensure clean surfaces for gluing (Wood Handbook, 2010). The glue extruder is then used to
spread the resin on the laminates evenly. Phenol-resorcinol formaldehyde and melamine-urea-
formaldehyde are the most popular resins used for face gluing (Smulski, 1997). The laminates
are then assembled in a specified lay-up pattern, and the straight glulam beams are then
clamped in a clamping bed where a hydraulic system applies the required pressure on the
assembled beams. To avoid cambering, the glulam beams are left to cure under pressure at
room temperature for 5 to 16 hours. Once the face gluing process is completed, small samples
are then taken from the end trim cut-off to evaluate the quality of the adhesive bond (Wood
Handbook, 2010).
2.1.4 Finishing and Fabrication
After removing the glulam beams from the clamping system, the sides of the beam are then
sanded to remove resin beads that may have squeezed out because of the applied pressure.
Based on the appearance requirements, the top and bottom faces of the beams may be lightly
planed, and the corners of the beam are eased off as well. To provide aesthetic appeal, knots
holes may also be filled with putty patch and further sanded. After finishing, glulam members
may also be treated with preservatives to allow the use of the product in a real-life service
environment where moisture content of the glulam may exceed 20% (Wood Handbook, 2010).
2.2 Self-Tapping Screws (STS)
Self-tapping screws (STS), as the name implies, they are screws that can tap into wood material
without needing pre-drilled holes. Contrary to conventional wood screws, self-tapping screws
are made from high strength steel with wider threads. The threaded part of the screw embedded
in wood section, termed effective length, provides withdrawal resistance for the connection.
Hence, adequately designed connection using self-tapping screws is much stronger than those
used conventional screws (Dietsch and Brander, 2015). For the best function of such
connections, these screws should be inserted at an angle to the grain direction and then loaded
in the screw withdrawal direction. However, for the ease of assembly, a 90° insertion is
commonly preferred (GRK, 2017).
Since in self-tapping screws, the threaded part is mostly continuous all over the length, which
allows the equal distribution of axial load between screws and wood section under axial load.
8
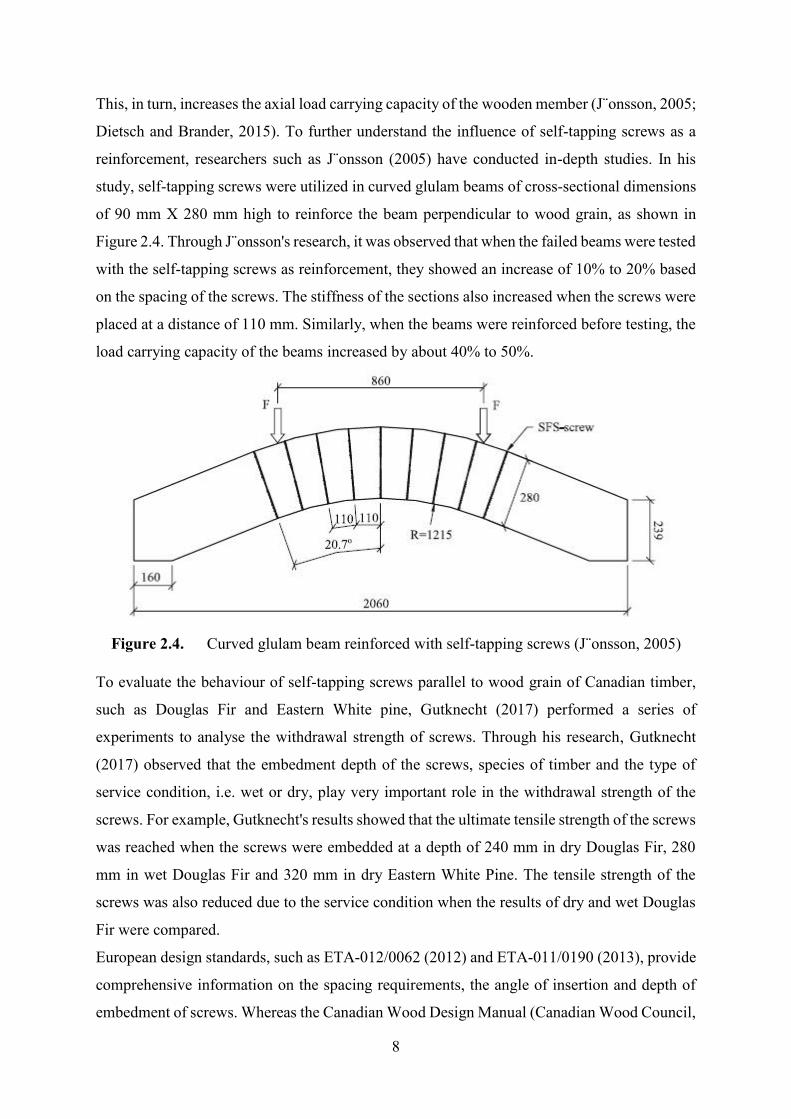
This, in turn, increases the axial load carrying capacity of the wooden member (J¨onsson, 2005;
Dietsch and Brander, 2015). To further understand the influence of self-tapping screws as a
reinforcement, researchers such as J¨onsson (2005) have conducted in-depth studies. In his
study, self-tapping screws were utilized in curved glulam beams of cross-sectional dimensions
of 90 mm X 280 mm high to reinforce the beam perpendicular to wood grain, as shown in
Figure 2.4. Through J¨onsson's research, it was observed that when the failed beams were tested
with the self-tapping screws as reinforcement, they showed an increase of 10% to 20% based
on the spacing of the screws. The stiffness of the sections also increased when the screws were
placed at a distance of 110 mm. Similarly, when the beams were reinforced before testing, the
load carrying capacity of the beams increased by about 40% to 50%.
Figure 2.4. Curved glulam beam reinforced with self-tapping screws (J¨onsson, 2005)
To evaluate the behaviour of self-tapping screws parallel to wood grain of Canadian timber,
such as Douglas Fir and Eastern White pine, Gutknecht (2017) performed a series of
experiments to analyse the withdrawal strength of screws. Through his research, Gutknecht
(2017) observed that the embedment depth of the screws, species of timber and the type of
service condition, i.e. wet or dry, play very important role in the withdrawal strength of the
screws. For example, Gutknecht's results showed that the ultimate tensile strength of the screws
was reached when the screws were embedded at a depth of 240 mm in dry Douglas Fir, 280
mm in wet Douglas Fir and 320 mm in dry Eastern White Pine. The tensile strength of the
screws was also reduced due to the service condition when the results of dry and wet Douglas
Fir were compared.
European design standards, such as ETA-012/0062 (2012) and ETA-011/0190 (2013), provide
comprehensive information on the spacing requirements, the angle of insertion and depth of
embedment of screws. Whereas the Canadian Wood Design Manual (Canadian Wood Council,
9
2015) lacks such specifications. Therefore, there is a requirement of in-depth understanding of
the use of self-tapping screws for connections and reinforcement, so that these screws can be
fully utilized.
2.3 Adhesives
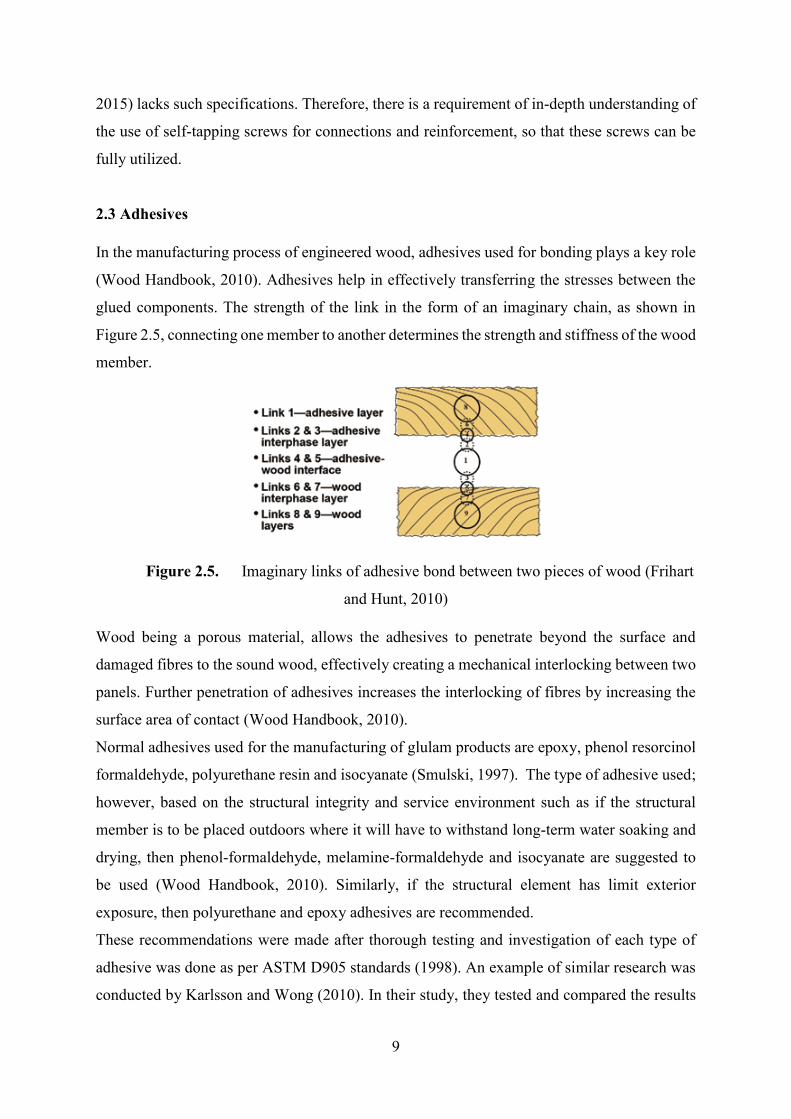
In the manufacturing process of engineered wood, adhesives used for bonding plays a key role
(Wood Handbook, 2010). Adhesives help in effectively transferring the stresses between the
glued components. The strength of the link in the form of an imaginary chain, as shown in
Figure 2.5, connecting one member to another determines the strength and stiffness of the wood
member.
Figure 2.5. Imaginary links of adhesive bond between two pieces of wood (Frihart
and Hunt, 2010)
Wood being a porous material, allows the adhesives to penetrate beyond the surface and
damaged fibres to the sound wood, effectively creating a mechanical interlocking between two
panels. Further penetration of adhesives increases the interlocking of fibres by increasing the
surface area of contact (Wood Handbook, 2010).
Normal adhesives used for the manufacturing of glulam products are epoxy, phenol resorcinol
formaldehyde, polyurethane resin and isocyanate (Smulski, 1997). The type of adhesive used;
however, based on the structural integrity and service environment such as if the structural
member is to be placed outdoors where it will have to withstand long-term water soaking and
drying, then phenol-formaldehyde, melamine-formaldehyde and isocyanate are suggested to
be used (Wood Handbook, 2010). Similarly, if the structural element has limit exterior
exposure, then polyurethane and epoxy adhesives are recommended.
These recommendations were made after thorough testing and investigation of each type of
adhesive was done as per ASTM D905 standards (1998). An example of similar research was
conducted by Karlsson and Wong (2010). In their study, they tested and compared the results
10
of specimens prepared using three types of adhesives; epoxy (EP), phenol-resorcinol-
formaldehyde (PRF) and polyurethane-resin (PUR). They compared the results of 500
specimens which were prepared as per EN 302-01 and ASTM D905-98 standards. The results
of their study showed that European code EN 302-01 was more sensitive to errors made in
cutting during specimen preparation. The comparison of both EN 302-01 test specimens and
ASTM D905-98 test specimen also revealed that both testing procedures gave different results
for epoxy adhesive but not for PRF. Their study also revealed that results of PUR adhesive
were not consistent and sometimes showed low shear strengths.
Another important aspect that should be considered while choosing the adhesive for the
manufacturing of engineered wood products is the performance of adhesive in fire condition
(Smulski, 1997). Adhesives such as phenol formaldehyde and isocyanate are thermoset
polymer, which means that in fire condition these adhesives melt and lose their bonding
strength. However, phenol-resorcinol-formaldehyde keeps the member intact even when wood
charring occurred. Researchers such as Sernek et al. (2007), studied the in-depth bond
performance of melamine-urea-formaldehyde (MUF), phenol-resorcinol-formaldehyde (PRF)
and polyurethane (PUR) adhesives under industrial heat treatment process Plato®.
In their study, four lamellas of Norway spruce, Douglas fir, polar and birch were bonded using
the before mentioned adhesives, and shear tests were conducted. Through their study, it was
observed that the heat treatment process affected the shear strength and delamination of
laminated wood. The MUF and PUR adhesives performed similarly and resulted in much better
bonding than PRF adhesive. However, the difference in the shear strength when the beams
were untreated, intermediate and fully heat-treated wood specimens was less prominent in PUR
adhesive. Which is why polyurethane (PUR) adhesives are majorly used in the production
process of glulam and CLT products (Nordic Structures, 2016).
2.4 Flexural Bending Behaviour of Timber Beams
2.4.1 Solid Timber Beams
Flexural bending strength of a structural element is defined as the greatest stress a structural
member can sustain before it fails under bending moment (Ashby, 2013). In comparison to
other construction materials like concrete and steel, timber is an anisotropic material; therefore,
its strength differs along the different axes as shown in Figure 2.6 (Buchanan, 1990). Due to
this characteristic of timber, a complex relationship can be developed between its tension,
compression and bending strengths. To understand these relationships, researchers such as
11
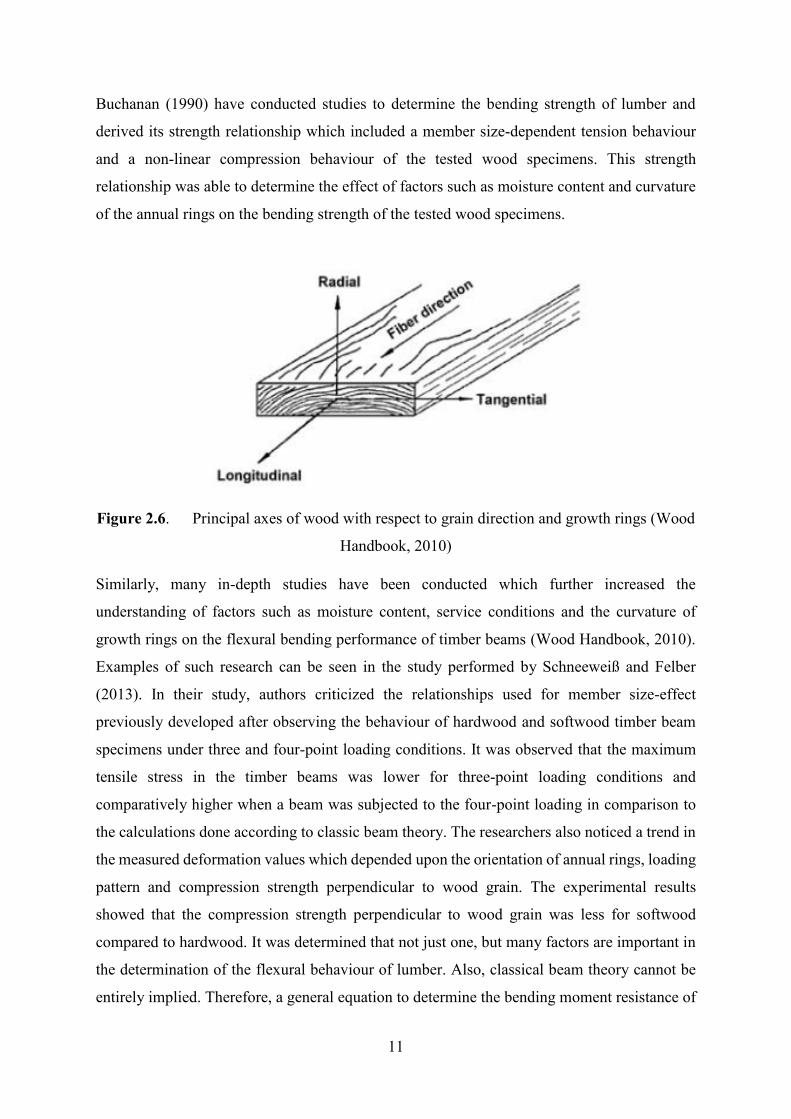
Buchanan (1990) have conducted studies to determine the bending strength of lumber and
derived its strength relationship which included a member size-dependent tension behaviour
and a non-linear compression behaviour of the tested wood specimens. This strength
relationship was able to determine the effect of factors such as moisture content and curvature
of the annual rings on the bending strength of the tested wood specimens.
Figure 2.6. Principal axes of wood with respect to grain direction and growth rings (Wood
Handbook, 2010)
Similarly, many in-depth studies have been conducted which further increased the
understanding of factors such as moisture content, service conditions and the curvature of
growth rings on the flexural bending performance of timber beams (Wood Handbook, 2010).
Examples of such research can be seen in the study performed by Schneeweiß and Felber
(2013). In their study, authors criticized the relationships used for member size-effect
previously developed after observing the behaviour of hardwood and softwood timber beam
specimens under three and four-point loading conditions. It was observed that the maximum
tensile stress in the timber beams was lower for three-point loading conditions and
comparatively higher when a beam was subjected to the four-point loading in comparison to
the calculations done according to classic beam theory. The researchers also noticed a trend in
the measured deformation values which depended upon the orientation of annual rings, loading
pattern and compression strength perpendicular to wood grain. The experimental results
showed that the compression strength perpendicular to wood grain was less for softwood
compared to hardwood. It was determined that not just one, but many factors are important in
the determination of the flexural behaviour of lumber. Also, classical beam theory cannot be
entirely implied. Therefore, a general equation to determine the bending moment resistance of
12
sawn lumber was generated and incorporated in Clause 6.5.4.1 of the Canadian Wood Design
Manual (2015), illustrated in Equation 2.1. In this equation, all the major factors such as size,
dry or wet service conditions, species of lumber, duration of the load applied, which influences
the bending moment of sawn lumber, were considered. This resulted in safe analyse of the
behaviour of sawn lumber beams.
Equation 2.1, The factored bending moment resistance, Mr, of sawn lumber members
𝑀𝑟 = 𝐹𝑏 𝑆 𝐾𝑍𝑏 𝐾𝐿 (Eqn. 2.1)
Where,
= 0.9
𝐹𝑏 = 𝑓𝑏 (𝐾𝐷 𝐾𝐻 𝐾𝑆𝑏 𝐾𝑇)
𝑓𝑏 = Specified bending strength
𝑆 = Section Modulus
𝐾𝐷 = Load duration factor
𝐾𝐻 = System factor
𝐾𝑆𝑏 = Service condition factor
𝐾𝑇 = Treatment factor
𝐾𝑍𝑏 = Size factor
𝐾𝐿 = Lateral Stability factor.
2.4.2 Glulam Timber
2.4.2.1 Solid glulam sections
Modern technology has enabled wood manufacturers to further improve the structural
durability of wood and inspired the production of new engineered-wood products, such as
plywood, glulam and CLT. Engineered-wood products such as glulam are made by bonding
small sawn lumber laminas with an industry-grade adhesive so that the grain of all laminas runs
parallel along the longitudinal direction (APA, 2016). This engineered process allows
command over the location of the material of different quality within the member cross section.
By laying the most structurally stronger material in the regions of highest stresses, such as near
13
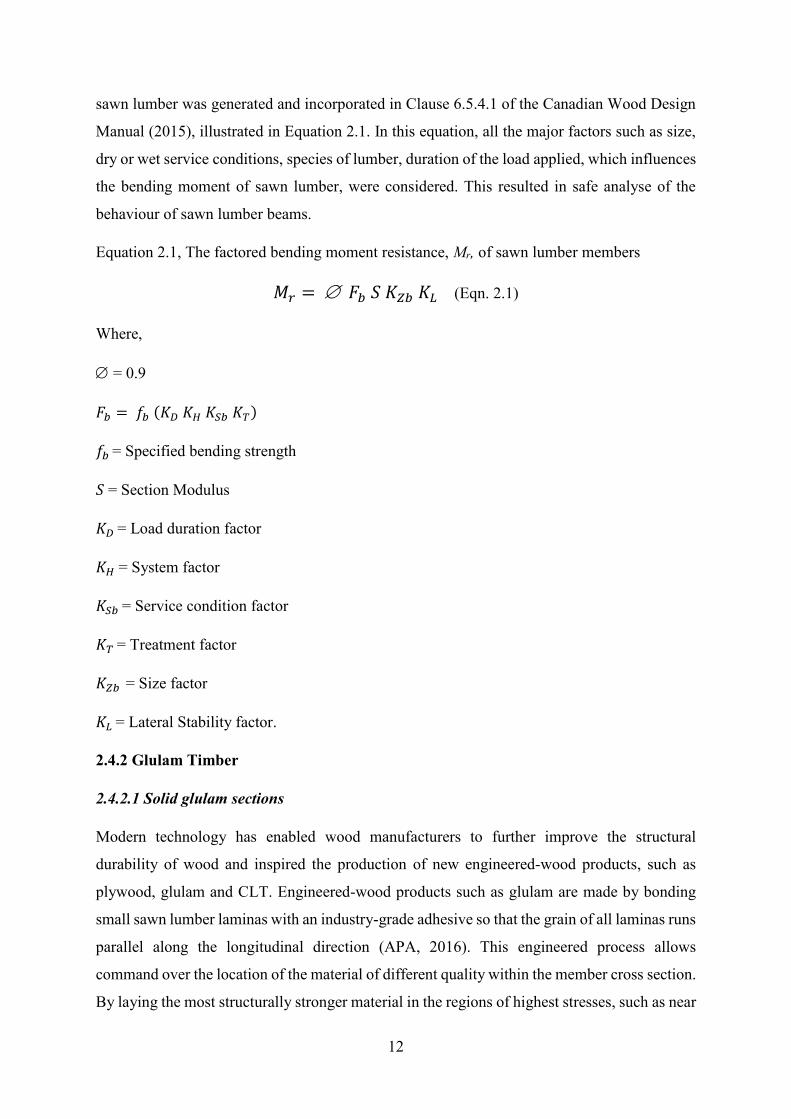
the top and bottom fibres in the case of a flexural member, the flexural bending performance
of the member can be enhanced. This technique also allows the distribution of lumber defects
along the length of the glulam member and across its section. Figure 2.7 illustrates a finished
solid glulam beam.
Figure 2.7. Solid glulam beams (Atlantic Forest Products, 2013).
However, many research studies indicate that the configuration of the laminas can improve the
overall strength of the glulam sections (Yang et al., 2008). Therefore, to draw out the full
potential of a glulam member, manufacturing standards for glued-laminated timber, such as
AITC 117 (2010), were developed. These standards describe the combination of lumber grades
that must be used to achieve specific design values. Thus, simplifying the analysis and design
of solid glulam beams using numerical equations. An example of such an equation is in Clause
7.5.6.5.1 of the Canadian wood design manual (2015), which is a modification of the moment
resistance design equation of sawn lumber. These formulas provide a numerical way to
determine the bending moment resistance of a glulam beam based on all the factors that affect
its strength. The factored bending moment resistance, Mr, of glued-laminated timber members
shall be taken as the lesser of Mr1 or Mr2 (Equations 2.2 and 2.3, respectively);
𝑀𝑟1 = 𝐹𝑏 𝑆 𝐾𝑋 𝐾𝑍𝑏𝑔 (Eqn. 2.2)
𝑀𝑟2 = 𝐹𝑏 𝑆 𝐾𝑋 𝐾𝐿 (Eqn. 2.3)
Where,
𝐾𝑋 = Curvature factor
14
𝐾𝑍𝑏𝑔 = (130
𝑏)
1
10 (
610
𝑑)
1
10 (
9100
𝐿)
1
10≤ 1.3
2.4.2.2 Built-up glulam sections
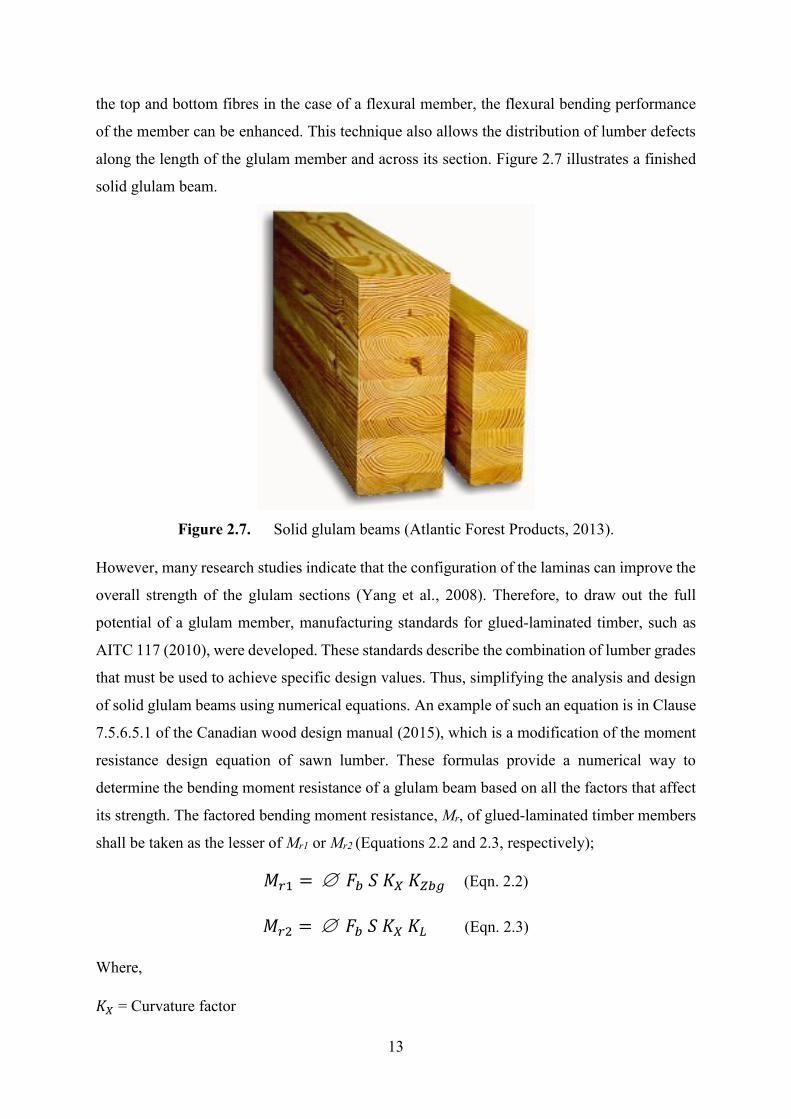
With its strength to weight ratio are considerably high, fabricating built-up glulam sections to
make different shapes not only decreases the weight of a building structural member but it also
helps in utilizing less material (Smulski,1997). Like any other construction material, shapes
such as I-sections, as shown in Figure 2.8, rectangular sections and hollow sections can be
achieved. With the availability of many bonding agents such as high strength adhesives,
structural screws, bolts and connecting plates, the process of creating a complex cross section
can be attained easily even on site without the use of specialized machinery or process
(O’Loinsingh et. al, 2012).
Figure 2.8. I-section glulam beam (APAwood.org, 2006).
However, with the modification in shape and size, the mechanical properties of built-up
sections change in comparison to the traditional solid timber beams and the classic theories to
analyse such beams are not able to provide the exact results (Newlin and Trayer, 1924; Gotou
et al., 2014; Ezeagu et al., 2015). Therefore, to better understand the behaviour of built-up
glulam sections, Newlin and Trayer (1924) developed a series of reports with the primary goal
to determine the deflections of beams with particular reference to shear deformations and the
influence of form/shape of a wooden beam on its stiffness and strength. On the analysis of
different forms of built-up beams ranging from rectangular to box as well as T-sections. Newlin
and Trayer (1924) found that in a built-up section, the beam deflection is not the only important
factor, but shear deformation also plays a vital role. Shear stresses in a built-up beam are more
critical when a curvature is introduced, such as in curved beams or domes, as highlighted in
the research work carried out by Erik Persson (2008) who analysed curved glulam beams with
15
built-up box cross section. Through his study, it can be observed that bending moment creates
considerable stresses that are perpendicular to wood grain in a curved beam element. However,
these stresses can be minimized by altering the slope of the arch so that the structure can be
designed using curved beams with smaller cross sections.
Although several research works have been done so far, such as the study performed by Newlin
and Trayer (1924) on the deflection and form factors of beams subjected to transverse loading,
as well as the research conducted by Dong et al. (2010) on the modification of the shear
correction factors in Timoshenko Beam Theory to accommodate non-symmetrical beam cross
sections. The appropriate numerical method to determine the flexural bending strength of built-
up glulam beams is still not available.
2.5 Flexural Behaviour of Glulam Beams with Reinforcement
2.5.1 Fibre-reinforced Polymer
Fibre-reinforced polymers (FRP) are composite materials that were first adopted in the
construction of boats and airplanes due to their light weight and ability to resist deforming
forces and stresses (Tang, 1997). Some unique fibres possess additional valuable characteristics
such as glass fibre which is a very good insulator and can be used in resisting high temperatures
(Zoghi, 2014).
Because of its flexible characteristics and strength, FRP made its way into building
construction. There are different types of FRP available in the market, but the primary types
which are used for construction are (Zaman et al., 2013):
1. Glass fibre-reinforced polymer (GFRP)
2. Carbon fibre-reinforced polymer (CFRP)
3. Basalt fibre-reinforced polymer (BFRP).
FRP can be utilized to reinforce slabs, beams or columns of a building, even after a structure
has been damaged due to excessive loading (Jain and Lee, 2012). FRP are mainly utilized using
two techniques, shear strengthening technique and flexural strengthening technique (Schober
et al., 2015).
In shear strengthening technique, the FRP material is applied to the sides of a structural member
with the orientation of fibres in the transverse direction to the beam length (Hollaway and Teng,
2008; Schober et al., 2015). This technique helps in resisting the shear forces just like the

16
internal stirrups. However, researchers are also trying to use FRP rods or spikes to reinforce
timber structural elements. Example of such research work is the experimental study conducted
by Righetti et al. (2015), where they tested the use of Basalt FRP spikes used for repairing
wood beams. In their proposed repair technique, BFRP spikes were inserted into timber beams
at an angle of 45 degrees, as shown in Figure 2.9, where a number of predrilled holes were
injected with epoxy putty to fill up and create a solid bond between the inserted spikes and the
cracked beams. Through their study, it was observed that insertion of spikes increased the beam
capacity and stiffness in comparison to the undamaged beams.
Figure 2.9. BFRP spike layout (Righetti et al., 2015).
Another technique of strengthening a structural timber member is flexural strengthening. In
this technique, a layer of FRP material is bonded to the tension face of the beam to enhance the
flexural bending strength of the beam (Hollaway and Teng, 2008). It is one of the most common
techniques used in the strengthening of timber beams against brittle failures of timber,
especially under tensile stresses.
Researchers such as Ambrisi et al. (2014) investigated the flexural behaviour of timber beams
repaired with carbon fibre-reinforced polymer (CFRP) plates. In their study, six new timber
beams and six damaged beams which were taken out of an ancient building had CFRP plates
attached to the tension sides of the beams to check the beams’ flexural behaviour. It was
observed that the CFRP plates not only helped in repairing the old beams and restoring its
strength, but they also increased the strength of the new beams.
Another example of such strengthening technique is illustrated in the research work carried out
by Mosallam (2016), who conducted experiments on timber specimens made of Douglas-Fir
and glulam beams using two types of composites: sandwich panels and wet layup laminates.
Through his experiments, it was observed that both composite materials when used for external
repair and rehabilitation, increased stiffness and strength of the tested beams. Similarly,
researchers such as Elghazaly et al. (2014) explored the effect of number and orientation of the
17
FRP on the deformation of the beam. Based on the cited research studies, it can be deduced
that FRP materials are an excellent tool to repair and strengthen timber and/or glulam beams
against both, flexural and shear failures.
2.5.2 Pre-stressing
Pre-stressing is a process in which the steel or prestressing tendon is stressed (or tensioned)
before the primary material shall support the service loads (Brzev and Pao, 2016). The pre-
stressing tendons, which usually are pre-stressing steel cables are placed inside a sleeve and
are positioned in the configuration before the primary element is placed. This technique has
been used in concrete construction for a quite long time now, mainly because of its advantages
such as allowing designers to design structural elements of longer spans as well as keeping
cracks in concrete, if formed, tightly together (Priestley et al., 1999; Spellman et al., 2012).
However, use of this technique in timber construction is relatively new, and the process has not
been fully developed (Luca and Marano, 2011; McConnell and Taylor, 2014). A general pre-
stressing system installed inside a timber beam is illustrated in Figure 2.10.
Some researchers have attempted to create an appropriate process to use this technique in
timber construction so that it can be efficiently utilized as it has been in concrete construction.
Illustration of such research can be seen in the work conducted by McConnell and Taylor
(2014). They studied the behaviour of timber beams under service loads and to failure by
conducting a series of four-point flexural bending tests on unreinforced, reinforced and post-
tensioned glulam beams. The aim of their study was to the determine the benefits of active
reinforcement in comparison to passive reinforcement, incorporating effects of bonding
tendons over the material properties. Their results showed that in comparison to unreinforced
glulam beams, there was an increase in the flexural strength and stiffness of the glulam beams
because of reinforcement; however, the post-tensioning system showed an additional
increment of 40% in flexural strength and 30% in stiffness of the beam.
Similar research area was explored by Luca and Marano (2012) where their experiments
targeted the behaviour of glulam beams when reinforced with steel bars. Their research results
also supported the same conclusion as McConnell and Taylor (2014), that when a pre-stressing
system is used inside a timber beam, its characteristics like ductility, flexural strength and
stiffness also increased.
18
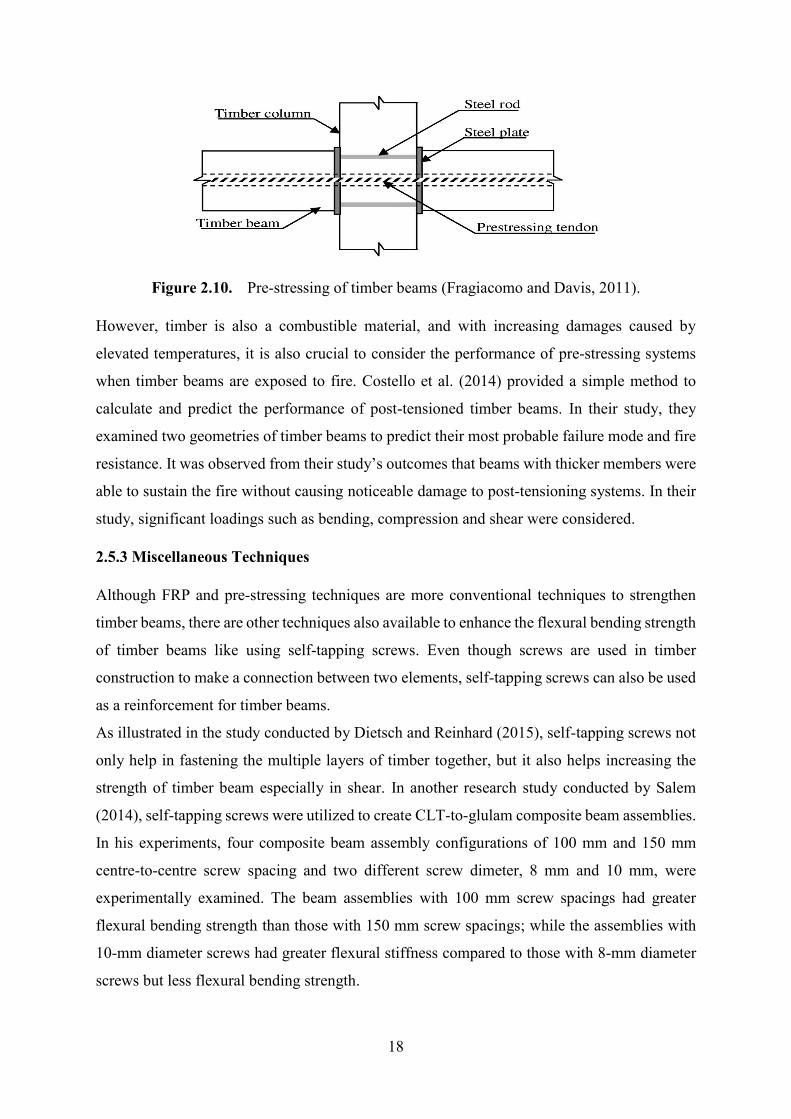
Figure 2.10. Pre-stressing of timber beams (Fragiacomo and Davis, 2011).
However, timber is also a combustible material, and with increasing damages caused by
elevated temperatures, it is also crucial to consider the performance of pre-stressing systems
when timber beams are exposed to fire. Costello et al. (2014) provided a simple method to
calculate and predict the performance of post-tensioned timber beams. In their study, they
examined two geometries of timber beams to predict their most probable failure mode and fire
resistance. It was observed from their study’s outcomes that beams with thicker members were
able to sustain the fire without causing noticeable damage to post-tensioning systems. In their
study, significant loadings such as bending, compression and shear were considered.
2.5.3 Miscellaneous Techniques
Although FRP and pre-stressing techniques are more conventional techniques to strengthen
timber beams, there are other techniques also available to enhance the flexural bending strength
of timber beams like using self-tapping screws. Even though screws are used in timber
construction to make a connection between two elements, self-tapping screws can also be used
as a reinforcement for timber beams.
As illustrated in the study conducted by Dietsch and Reinhard (2015), self-tapping screws not
only help in fastening the multiple layers of timber together, but it also helps increasing the
strength of timber beam especially in shear. In another research study conducted by Salem
(2014), self-tapping screws were utilized to create CLT-to-glulam composite beam assemblies.
In his experiments, four composite beam assembly configurations of 100 mm and 150 mm
centre-to-centre screw spacing and two different screw dimeter, 8 mm and 10 mm, were
experimentally examined. The beam assemblies with 100 mm screw spacings had greater
flexural bending strength than those with 150 mm screw spacings; while the assemblies with
10-mm diameter screws had greater flexural stiffness compared to those with 8-mm diameter
screws but less flexural bending strength.
19
Another technique to increase the shear and flexural strength of timber beams is binding the
different layers of timber plies using wood dowels. O'Lionsingh et al. (2012) used this
technique in their experiments to demonstrate the ability to produce multi-layered sectioned
timber beams using timber dowels. Through several experiments, they were able to illustrate
that multiple wood plies can achieve a high level of composite action and that they can increase
the stiffness and strength of such timber beams.
Over the years, some inventors have been able to obtain patents for their unique box-section
beam strengthening techniques. One of those inventors is Shimabukuro (1988), who fabricated
a wooden synthetic beam in which the top and bottom flanges and two curved web plates were
adhered together. The curved web plates not only helped distributing the applied vertical loads
but also its curved shape enhanced the bending stiffness of the beam assemblies.
2.5 Numerical Analysis of Beams
Analysis of a structure provides an understanding of the behaviour of such structure to
withstand all applied loads. Research studies such as those conducted by Newlin and Trayer
(1924) and Labuschagne et al. (2009) revealed that incorporation of beam deflections due to
compression and elongation of its fibres due to bending as well as shear stresses further
increases the deformations of a beam. Thus, without considering the effects of deformation due
to shear, an amplitude of errors can be introduced in determining the distortion of a wooden
beam (Newlin and Trayer 1924). Hence, many beam theories were used to analyse the
structural behaviour of beams made of thin web panels, such as T-beams or box-section beams.
Some of these theories are discussed in the following sections. Such theories have been used
to analyse and assess the behaviour of the built-up section timber beams.
2.6.1 Euler-Bernoulli Theory
Euler-Bernoulli beam theory also known as classical beam theory is a fraction of the linear
theory of elasticity which aids in calculating deflection and load carrying properties of a beam
(Logan, 2000). According to this theory, for a beam with plane cross section perpendicular to
its longitudinal centroidal axis before bending remains the same after bending occurs, as shown
in Figure 2.11. This theory was implemented by Newlin and Trayer (1924) in their study on
the behaviour of built-up section beams.
20
Figure 2.11. Euler-Bernoulli beam theory (Poutre Definitions, 2010)
Equation 2.4 describes the relationship between the load applied on a beam and its deflection
(Logan, 2000);
𝑑²
𝑑𝑥² (𝐸𝐼
𝑑²𝑤
𝑑𝑥²) = 𝑞 (Eqn. 2.4)
Where,
E = Elastic modulus.
I = Moment of Inertia; to be calculated with respect to the axis perpendicular to the
applied load and centroidal axis of the beam cross section.
w(x) = curve which describes the deflection of beam in z direction at point x.
q = distributed load (i.e. force / unit length).
After deflection has been determined, stresses in a beam can be calculated using Equations 2.5
and 2.6:
𝑀 = −𝐸𝐼 𝑑2𝑤
𝑑𝑥2 (Eqn. 2.5)
which is the bending moment of the beam, and
𝑄 = − 𝑑
𝑑𝑥 (𝐸𝐼
𝑑2𝑤
𝑑𝑥2 ) (Eqn. 2.6)
21
is the shear force developed in the beam.
For numerical analysis of a beam using Euler-Bernoulli theory, following assumptions are to
be considered:
1. The beam is long relative to its depth and width. Thus, stresses perpendicular to the
beam centroidal axis are much smaller than stresses parallel to it and can be neglected;
2. The cross section of the beam is constant along its length;
3. The beam is symmetrical along the vertical axis, resulting in no torsion occurrence;
4. The beam is subjected to small deflections;
5. The material used is isotropic and abides by Hooke’s Law;
6. The cross section of the beam remains plane after deformation. This is true only when
the beam is subjected to pure bending and experiences zero shear deformation.
However, these assumptions are rational for slender structural elements with solid cross
sections and are subjected to bending deformations only. Experimental observations show that
when one or more of these conditions are not met, the beam model based on Euler-Bernoulli
theory produces inaccurate results (Newlin and Taylor, 1924; Logan, 2000). Therefore, to
achieve more precise results, other beam theories are used to generate beam models.
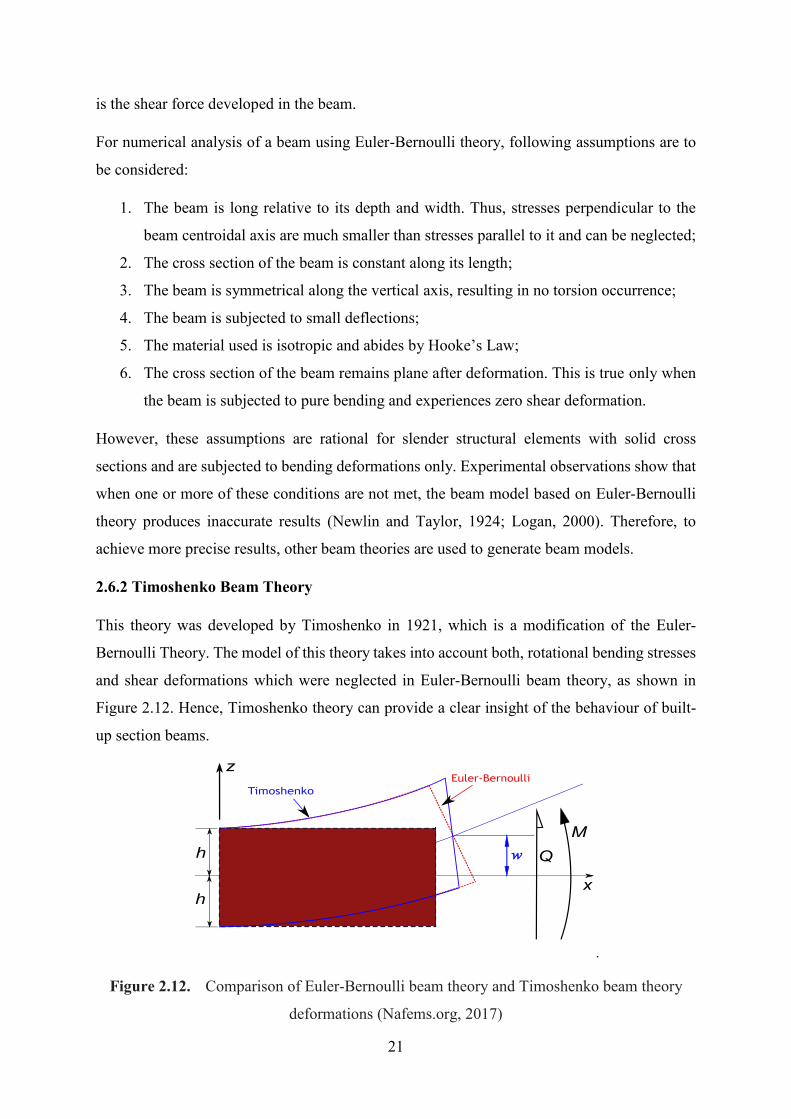
2.6.2 Timoshenko Beam Theory
This theory was developed by Timoshenko in 1921, which is a modification of the Euler-
Bernoulli Theory. The model of this theory takes into account both, rotational bending stresses
and shear deformations which were neglected in Euler-Bernoulli beam theory, as shown in
Figure 2.12. Hence, Timoshenko theory can provide a clear insight of the behaviour of built-
up section beams.
.
Figure 2.12. Comparison of Euler-Bernoulli beam theory and Timoshenko beam theory
deformations (Nafems.org, 2017)
22
Since the development of Timoshenko theory, many researchers have used it in generating
various beam models. Doshi (1979) used Timoshenko theory to analyse a beam with and
without internal damping and observed that when a particular type of load, such as random
load or impulse load, were applied on a beam and stress analysis was conducted, the results
obtained were not well suited with physical assumptions and were erroneous. Upon further
investigation, it was observed that in such cases Timoshenko beam theory needs to be modified.
In Timoshenko beam theory, displacement of the beam is given by Equation 2.7
𝐸𝐼 𝑑4 𝑤
𝑑𝑥4= 𝑞(𝑥) −
𝐸𝐼
𝐴𝐺 𝑑2𝑞
𝑑𝑥2 (Eqn. 2.7)
Where,
A = Area of cross-section
G = Shear modulus,
= Timoshenko shear coefficient, = 10(1+𝑣)
12+11v , 𝑓𝑜𝑟 𝑠𝑜𝑙𝑖𝑑 𝑟𝑒𝑐𝑡𝑎𝑛𝑔𝑢𝑙𝑎𝑟 𝑠𝑒𝑐𝑡𝑖𝑜𝑛
And, = 6(1+𝑣)
7+6v , 𝑓𝑜𝑟 𝑠𝑜𝑙𝑖𝑑 𝑐𝑖𝑟𝑐𝑢𝑙𝑎𝑟 𝑠𝑒𝑐𝑡𝑖𝑜𝑛
Equations 2.8 and 2.9 are used to determine bending moment (Mxx) and shear force (Qx ) which
are related to displacement(w) and rotation() as follows:
𝑀𝑥𝑥 = −𝐸𝐼 𝜕
𝜕𝑥 (Eqn. 2.8)
𝑄𝑥 = 𝐴𝐺 (− + 𝜕𝑤
𝜕𝑥) (Eqn. 2.9)
Dong et al. (2010) conducted a study to generate two series of equations for shear correction
factors for a non-symmetrical beam cross section. Through their research work, they
challenged the need for principal shear axes which is used to calculate shear correction factors
from two transverse forces applied on the beam cross section. To clarify this hypothesis,
Kennedy et al. (2011) conducted further research and provided accurate equations for the shear
correction factor. This research work demonstrated that the analysis conducted on vibration
problems using Timoshenko beam theory which was introduced to account for the difference
between average shear strain and shear strain distribution are equivalent to the original
equations.
23
Gotou et al. (2014) used an interesting approach comparing experimental results against finite
element models’ outcomes of two types of on-site timber stress-laminated box-section beams,
implementing Timoshenko beam theory. This comparative study revealed that the results of
FEM and Timoshenko theory were close to the experimental results, but the results obtained
using Euler-Bernoulli theory were considerably off.
Even though Timoshenko beam theory is close to two-dimensional theory for practical
significance (Labuschagne, 2009), the conflict of accurate shear coefficients is still present
which hinders in obtaining reliable results. Thus, Timoshenko beam theory cannot be employed
for all beam models.
2.6.3 Vlasov’s Energy Theorem
Vlasov developed a torsional theory in the 1940’s, that is a modification of De Saint Venant
theorem by including function for restrained warping. In Vlasov theorom, the beam specific
torsion is not constant along the beam longitudinal axis. Also, the rotation of the beam
follows Equation 2.10:
𝐸𝐶𝑤 𝑑4
𝑑𝑥4− 𝐺𝐼𝑡
𝑑2
𝑑𝑥2= 𝑚𝑥 (Eqn. 2.10)
Where,
GIt = torsion stiffness,
ECw = warping stiffness, and
mx = distributed torsion moment along the beam.
Ezeagu et al. (2014, 2015), used Vlasov's theorem to analyse wrapping torsion and bending of
timber box-section beams. Their study was focused on validating the analytical outcomes with
experimental results, which was confirmed in their studies depicting that even beams with
variable web thickness complies with the analytical outcomes computed using Vlasov’s
theorem. Thus, Vlasov’s theorem can be used to obtain reliable results.
2.7 Finite Element Analysis of Beams
Finite Element Method (FEM) is one of the most effective approaches used to analysis
structures. It is based on the hypothesis that an approximate solution to any complex
engineering problem can be reached by subdividing a more extensive complex structure into
smaller components of simple geometry called finite elements (Logan, 2000). Complex partial
24
differential equations that describe these structures can be reduced to a set of linear equations
that can easily be solved using FEM. Several software programs are available in the market
that can be used to analyse and solve finite element models; however, software such as ANSYS,
ABAQUS and MATLAB are commonly used for research purposes. The example of such
research work using FEM can be seen in the work performed by Gunakala et al. (2012), who
used the finite element method to generate a solution of beam equations using MATLAB to
determine the behaviour of beams of both, homogeneous and non-homogeneous boundary
conditions and projected the FE model outcomes in the form of graphs. Equations would be
very complex to solve by hand and would take extensive time. However, with the help of FEM
reasonable characteristics of elements can be determined, and their structural analysis results
can be compared in less time.
Another example of the use of FEM in quantitative research is the work carried out by Erik
Persson (2008) who used FEM to develop a simple method to analyse curved glulam beams
with box cross sections. In his study, he used an external MATLAB toolkit called CALFEM to
create a tool box that can be used to analyse a curved glulam box-section beam on a commercial
platform.
Finite element model if accurately prepared, can also be used to validate and conduct
parametric studies, decreasing the need to conduct several experiments (Logan, 2000; Gotou
et al., 2014). Many researchers such as Gotou et al. (2014) have used FEM to validate and
compare the results of their lab experiments, numerical analysis and finite element models.
From their research work, it can be seen that the FE model projected almost same graphs as
were extracted by experiments.
2.8 Fire Resistance of Structures
Fire resistance can be defined as the ability of the structural member to withstand prolonged
exposure to fire without the loss of its load-bearing capability (Lie, 1977). This ability provides
enough time to enable people to evacuate the building in the event of fire; it is also essential to
confine the fire in the compartment where it started. The structural design of buildings during
fire has been developing at a significant rate. Advancement in new risk assessment techniques
and analytical methods enable experienced engineers to develop performance-based design for
structures fire safety. The major loss of life during events such as the Manchester Woolworth’s
Fire (1979) and most recently devastating fire which ripped through the Grenfell Tower, West
25
London (2017), increased the demand for development of more strict regulations to minimise
the loss of lives during such devastating fire incident.
During medieval time, attempts were made to control the fire at the source, by introducing
chimneys made of non-combustible material (IStructE, 2003). As far as history goes, because
of the disastrous fires which caused major loses in a city like London, stone walls were required
to be built between buildings to prevent fire spreading. Since then, the regulation of non-
combustible parting walls has been a governing feature in building construction, from where
the dictum of fireproof floors in parts of buildings, such as staircase and corridors for an escape
exit, was included as a general practice. In the early 20th-century, new construction materials
such as cast iron, steel and reinforced concrete were introduced, and the concept of standard
fire tests was initiated which helped to attain the knowledge of the performance of these
materials in fire condition through testing. Testing has always been an essential part of
improving the understanding of the performance of a building since individual materials do not
possess the ability to resist the external forces on individual strength. However, the standards
were limited to assessing relative risks, firefighting methods and fire separation techniques.
The increasing development of the fire resistance testing techniques enabled in finding a way
to evaluate the buildings and its elements based on fire resistance ratings. These ratings are
mostly assigned in parts of hours, in order to facilitate a more practical way to compare and
match the specified requirements in building codes.
Fire resistance is one of the components of the fire protection measures that are necessary to
sufficiently save structures. The prime aim of fire safety is to prevent, delay or reduce the
effects of rapid transformation of fire from its growth stage to fully-developed stage (IStructE,
2003; Wood Handbook, 2010; Purkiss and Li, 2013; Buchanan and Abu, 2017). A substantial
research work of fire safety engineering is concerned with the suppression of fires during its
growth stage, which is achieved by designing active fire protection systems such as smoke and
heat detectors, sprinklers and smoke control systems. The growth rate of fire can also be
predicted on the basis of amount, type, available ventilation, geometry of compartment and
arrangement of fuel (Buchanan and Abu, 2017).
Active fire protection systems, such as sprinkler systems, provide many benefits for fire
resistance of buildings. The inclusion of this kind of systems reduces the level of fire resistance
required by the applicable building code for the design of different structural components
and/or assemblies. The use of active fire protection systems can also involve the followings;
1. Perform the dual functions of detection and suppression
26
2. Increases permissible compartment size
3. Provides certainty over design fire size
4. Reduces the size of the fire to make it easy to tackle.
With the availability of active fire protection systems, fire resistance of the designed building
components and/or assemblies becomes the second line of defence. Fire resistance is also
described as the passive measure for fire safety (IStructE, 2003; Purkiss and Li, 2013). The
purpose of providing fire resistance for buildings and structures is influenced by several other
factors such as reduction in the chance of collateral damage in case the structure collapses,
protecting adjacent buildings from fire and protecting serviceability and continuation of
important services such as hospitals. There are methods to determine the ability of a structural
element to carry the applied load during a fire (Phan et al. 2010; Buchanan and Abu, 2017):
1. Time Domain
2. Strength Domain
3. Temperature Domain.
Time Domain is the commonly adopted method in fire safety engineering. In this method, time
to failure in a fire testing furnace must be greater than the fire duration as set by appropriate
building code.
𝑡𝑓𝑎𝑖𝑙 ≥ 𝑡𝑠
Where tfail is the time of failure of the structural element, and ts is the fire duration as specified
by the code. The time of failure is usually a fire-resistance rating of a building element and fire
duration is standard fire exposure specified by a building code.
In Strength Domain, it is the comparison between load-carrying capacity of a structural
member when the load is applied at time of fire with the capacity of the same member
throughout the fire, so that;
𝑅𝑓 ≥ 𝑈𝑓
Where, Rf is the minimum load capacity reached during fire, and Uf is the applied load at the
time of fire. These values may be expressed in units of resistance and force for an individual
member of a structure or for the whole building.
Another engineering approach is Temperature Domain, it dictates that maximum temperature
(C) in part of structure is not greater than temperature (C) which would create failure. It
requires that;
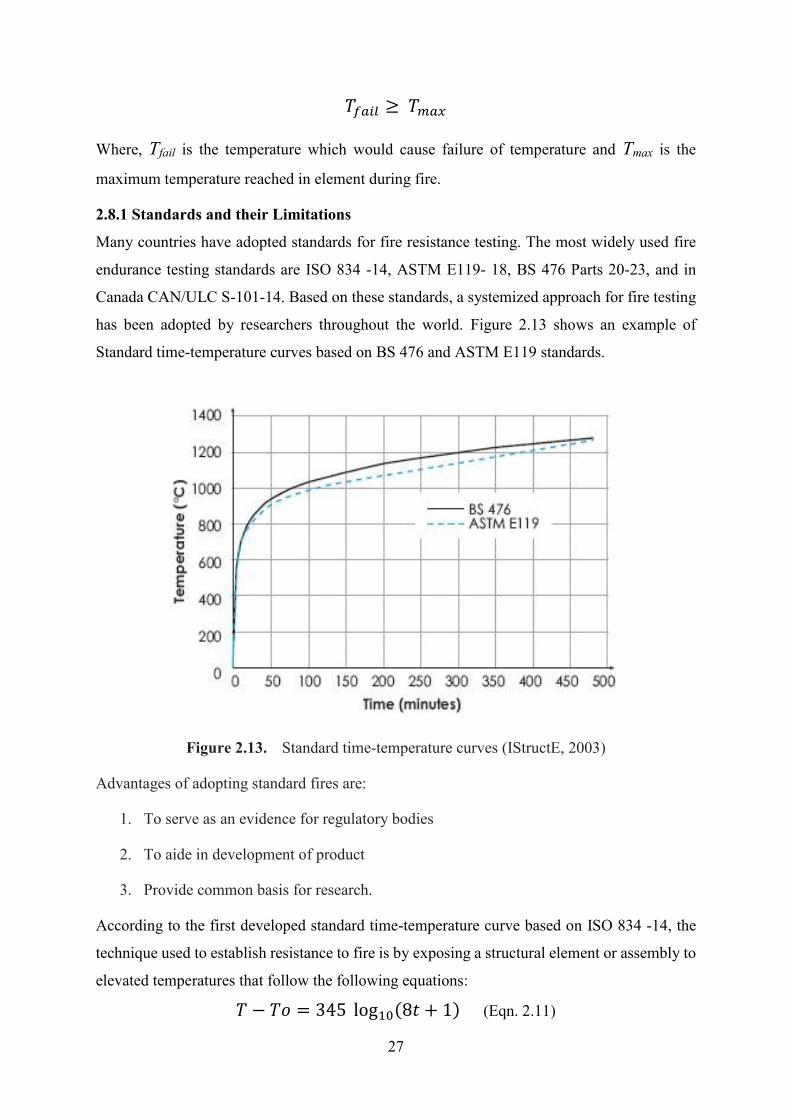
27
𝑇𝑓𝑎𝑖𝑙 ≥ 𝑇𝑚𝑎𝑥
Where, Tfail is the temperature which would cause failure of temperature and Tmax is the
maximum temperature reached in element during fire.
2.8.1 Standards and their Limitations
Many countries have adopted standards for fire resistance testing. The most widely used fire
endurance testing standards are ISO 834 -14, ASTM E119- 18, BS 476 Parts 20-23, and in
Canada CAN/ULC S-101-14. Based on these standards, a systemized approach for fire testing
has been adopted by researchers throughout the world. Figure 2.13 shows an example of
Standard time-temperature curves based on BS 476 and ASTM E119 standards.
Figure 2.13. Standard time-temperature curves (IStructE, 2003)
Advantages of adopting standard fires are:
1. To serve as an evidence for regulatory bodies
2. To aide in development of product
3. Provide common basis for research.
According to the first developed standard time-temperature curve based on ISO 834 -14, the
technique used to establish resistance to fire is by exposing a structural element or assembly to
elevated temperatures that follow the following equations:
𝑇 − 𝑇𝑜 = 345 log10(8𝑡 + 1) (Eqn. 2.11)
28
Where,
t = time from start of test in minutes
T = furnace temperature at time t (C)
To= initial furnace temperature (C)
Even though the standard time-temperature curve provides in most cases more severe fire
exposure environment that what it could be in real situation for a structural element or
assembly, it cannot be assumed that the element tested in a standard fire test will behave and
survive when embedded as a part of a building. This is due to the fact that real fire does not
always follow the time-temperature profile used in standard fire tests, and the building will not
behave as set of individual members (Gales et al. 2012).
During fire resistance testing, the internal temperatures of a furnace are relatively uniform,
which is not the case in a real fire condition. In reality, the temperature varies depending on
other adjacent structural members which weren’t available during fire testing. Although all fire
endurance testing standards specify to perform a test on same control temperatures, different
furnaces are not harmonized as the heat fluxes experienced by test specimens depend upon the
location of burners, type of fuel used and form of construction of the utilized furnace.
Another limitation of fire testing furnaces is that they are not capable of simulating complicated
structural behaviour (IStructE, 2003). The influence of the surrounding structure, such as in the
case of structural continuity, is hence ignored. In a standard fire test setup, only idealized end
or support conditions can be used. Whereas in case of a real fire, there will be a variation in
end or support conditions since fire can affect the surrounding areas. Despite these
shortcomings, standard fire tests are usually performed by researchers to determine the fire
resistance of individual structural element or assembly.
2.8.2 Characteristics of Compartment Fires
The customary way to design a structure for fire safety using a fire endurance testing standard
such as CAN/ULC S-101-14 can result in the design of a structure a little on the conservative
side. Therefore, resulting in inefficient cost of the building and improper utilization of the
material, for example thicker fire protection coating for steel members or thicker concrete cover
for reinforced concrete elements in a building (Zehfuss and Hosser, 2006). Hence, it is required
to create a concept for fire design based on the performance-based behaviour of a structure in
natural fire conditions. Zehfuss and Hosser (2006) worked on creating such design concept.
They developed IBMB (Institute of Building Materials, Berlin) fire curves based on simplified
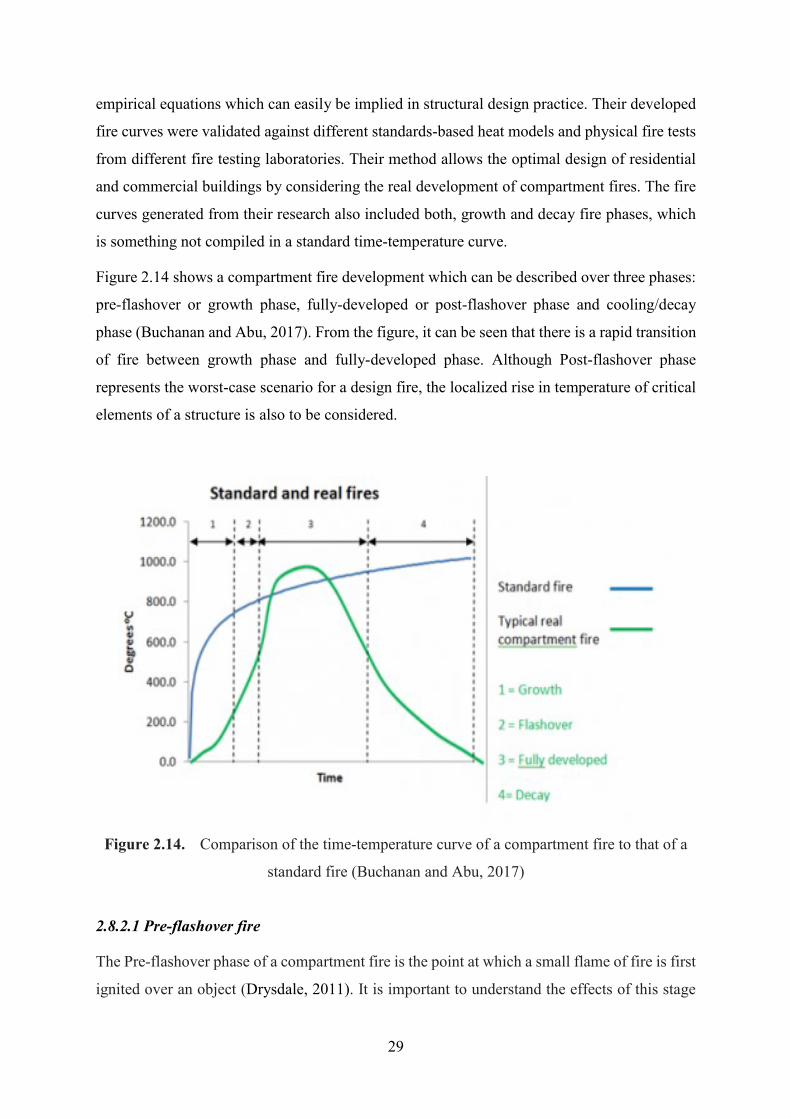
29
empirical equations which can easily be implied in structural design practice. Their developed
fire curves were validated against different standards-based heat models and physical fire tests
from different fire testing laboratories. Their method allows the optimal design of residential
and commercial buildings by considering the real development of compartment fires. The fire
curves generated from their research also included both, growth and decay fire phases, which
is something not compiled in a standard time-temperature curve.
Figure 2.14 shows a compartment fire development which can be described over three phases:
pre-flashover or growth phase, fully-developed or post-flashover phase and cooling/decay
phase (Buchanan and Abu, 2017). From the figure, it can be seen that there is a rapid transition
of fire between growth phase and fully-developed phase. Although Post-flashover phase
represents the worst-case scenario for a design fire, the localized rise in temperature of critical
elements of a structure is also to be considered.
Figure 2.14. Comparison of the time-temperature curve of a compartment fire to that of a
standard fire (Buchanan and Abu, 2017)
2.8.2.1 Pre-flashover fire
The Pre-flashover phase of a compartment fire is the point at which a small flame of fire is first
ignited over an object (Drysdale, 2011). It is important to understand the effects of this stage
30
because it plays the most important role in life safety of the occupants of a building. In a
compartment, the fire plume provides transmission of combustible products to the ceiling; this
plume involves a large amount of cold air which dilutes the combustible products, which in
return forms a hot upper layer within the room (SFPE, 2015). The radiative heat received from
the dense hot smoke increases the level of hot gases near the ceiling. It is crucial to understand
and calculate the effects of pre-flashover fires since it can also be influential for the adjacent
critical structures. Pre-flashover fire can be calculated by two models which are Zone model
or Field model (Purkiss and Li, 2013; Buchanan and Abu, 2017). Zone models are simple
computer models which models the behaviour of pre-flashover fires by considering
compartment fires in terms of two separate homogeneous zones and a connecting fire plume.
Whereas in Field models, fires are modelled using a great number of discrete zones in a three-
dimensional grid.
2.8.2.2 Flashover
If the pre-flashover fire is allowed to grow without any intervention and with the sufficient
availability of burning fuel, temperatures in the hot upper layer will increase with increasing
the radiation of heat flux to all objects in the room and at a critical level all exposed combustible
objects will start to burn, resulting in rapid increase in heat release rate and temperature. This
transformation in fire development is called Flashover (Drysdale, 2011; Buchanan and Abu,
2017). The necessary pre-condition for the occurrence of flashover is that there should be
sufficient burning fuel and ventilation for allowing the growth of fire to reach a significant size.
2.8.2.3 Post-flashover
After flashover, the behaviour of fire changes drastically as high temperatures remain constant
until the burning fuel is completely consumed (Feasey and Buchanan, 2002). At this stage, the
rate of heat release is at its highest. Also, the radiant heat fluxes throughout the compartment
make all combustible materials to pyrolyze and produce a significant amount of combustible
gases which burns with the sufficient supply of oxygen. The important piece of information
which helps in adequate structural fire design are the temperature of the room during post-
flashover and burning rates (Drysdale, 2011). Classification of post-flashover fires are as
follows (IStructE, 2003; Purkiss and Li, 2013; Buchanan and Abu, 2017):
Ventilation controlled fire: It is a typical type of post-flashover fire, in this case, all the air
inside the room is diluted, and there is now an insufficient supply to allow all combustible
gases to burn inside the room. As a result, the flames start extending to the windows, and after
31
additional combustion, the hot unburned gaseous fuels mix with outer air, and slowly the fire
starts to diminish.
Fuel controlled fire: In this case, the rate of burning can be controlled by the surface area of
the available fuel. Especially in case of large ventilated rooms, the fire can only sustain until
there is sufficient supply of burning fuel inside the compartment and as soon as all the burning
fuel is consumed, and the hot gases are ventilated outside the fire burning rate decreases.
2.8.3 Behaviour of Timber in Fire
Timber consists of lignin and cellulose, which themselves are made of carbon, hydrogen and
oxygen, thus making it highly combustible. When timber is exposed to fire, the surface of the
wood burns rapidly, and the burned layer becomes a layer of char which in turns insulates the
solid timber underneath (Frangi and Fontana, 2003; Buchanan and Abu, 2017). This results in
a steady drop in the initial burning rate and linear increase in the charring rate throughout fire.
The formation of char layer means that the cross-sectional area of the solid part of a timber
beam, for example, is decreasing and therefore its load-carrying capacity is decreased as well.
As the charring continue to develop, there comes a time when the timber section will even lose
the capacity to support its self-weight and will eventually collapse. To calculate the duration
up to which a member is capable of sustaining the applied load, it is necessary to be aware of
the followings (Lie,1997):
1. Charring rate
2. Strength and deformation properties of the material as a temperature function
3. Distribution of temperature in the charred part of the wood section.
With sufficient familiarity with these factors, one can easily assess the efficiency and behaviour
of wood in fire condition.
2.8.3.1 Effect of moisture content
In inclusion of elevated temperatures, interaction with moisture content is also very important.
Moisture content which can be expressed as the percentage weight of water in wood by the
weight of oven-dry wood (Wood Handbook, 2010). Important properties of wood such as
weight, shrinkage, density and strength are all dependent upon the moisture content of wood.
For wood to be used as a structural element, two important moisture content numbers are to be
considered, which are 19% which means that wood starts to become dry and 28% which marks
the fibre saturation point in wood (Canadian Design Council, 2015). Therefore, to use wood
for heavy-timber construction in Canada, its moisture content shall be maintained at about 20%.
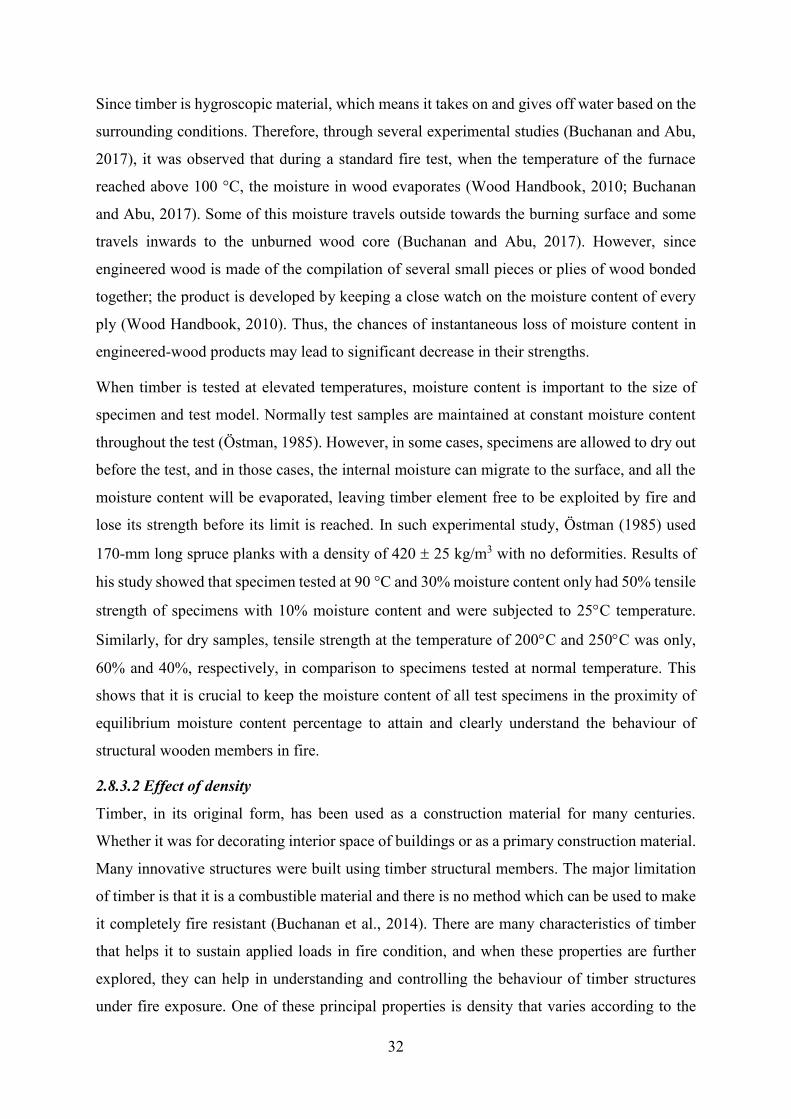
32
Since timber is hygroscopic material, which means it takes on and gives off water based on the
surrounding conditions. Therefore, through several experimental studies (Buchanan and Abu,
2017), it was observed that during a standard fire test, when the temperature of the furnace
reached above 100 °C, the moisture in wood evaporates (Wood Handbook, 2010; Buchanan
and Abu, 2017). Some of this moisture travels outside towards the burning surface and some
travels inwards to the unburned wood core (Buchanan and Abu, 2017). However, since
engineered wood is made of the compilation of several small pieces or plies of wood bonded
together; the product is developed by keeping a close watch on the moisture content of every
ply (Wood Handbook, 2010). Thus, the chances of instantaneous loss of moisture content in
engineered-wood products may lead to significant decrease in their strengths.
When timber is tested at elevated temperatures, moisture content is important to the size of
specimen and test model. Normally test samples are maintained at constant moisture content
throughout the test (Östman, 1985). However, in some cases, specimens are allowed to dry out
before the test, and in those cases, the internal moisture can migrate to the surface, and all the
moisture content will be evaporated, leaving timber element free to be exploited by fire and
lose its strength before its limit is reached. In such experimental study, Östman (1985) used
170-mm long spruce planks with a density of 420 25 kg/m3 with no deformities. Results of
his study showed that specimen tested at 90 °C and 30% moisture content only had 50% tensile
strength of specimens with 10% moisture content and were subjected to 25C temperature.
Similarly, for dry samples, tensile strength at the temperature of 200C and 250C was only,
60% and 40%, respectively, in comparison to specimens tested at normal temperature. This
shows that it is crucial to keep the moisture content of all test specimens in the proximity of
equilibrium moisture content percentage to attain and clearly understand the behaviour of
structural wooden members in fire.
2.8.3.2 Effect of density
Timber, in its original form, has been used as a construction material for many centuries.
Whether it was for decorating interior space of buildings or as a primary construction material.
Many innovative structures were built using timber structural members. The major limitation
of timber is that it is a combustible material and there is no method which can be used to make
it completely fire resistant (Buchanan et al., 2014). There are many characteristics of timber
that helps it to sustain applied loads in fire condition, and when these properties are further
explored, they can help in understanding and controlling the behaviour of timber structures
under fire exposure. One of these principal properties is density that varies according to the

33
family, class, species and botanical order of the tree from which the timber is obtained. Thus,
different specimens produced vary significantly under the influence of fire. As shown in Figure
2.15, if the density of a wooden element is greater, the rate of its combustion is slower.
Figure 2.15. Relationship between density () and rate of combustion (RC) (IStructE,
2003).
A demonstration of this characteristic can be seen in the study conducted by Richardson and
Batista (2001). The main objective of their experimental study was to assess the fire resistance
of timber decking for heavy-timber construction. They tested several specimens of Douglas Fir
species with different thickness and attachment arrangements. From their study, it can be
deduced that specimens with greater thickness, i.e. 64 mm, when exposed to fire have lower
charring rate in comparison to the specimens with thin sizes, i.e. 38 mm thickness. This has
also been proven through empirical methods that members made up of specific species and
density has better resistance to elevated temperatures than any other group (IStructE, 2003).
However, with the development of engineered timber, these hereditary characteristics can be
controlled and improved by gluing different layers of different species of timber together to
make one composite section (Wood Handbook, 2010). This also allows the designers to
manipulate the fire resistance characteristics of a building element by bonding species which
have greater strength at external surfaces and using timber which can provide ductility
internally (Buchanan and Abu, 2017). For example, the results of a research study conducted
by White (2000) on the fire performance of hardwood species, showed that hardwoods such as
red oak and hard maple had a charring rate of around 0.72 mm/min when exposed to ASTM E
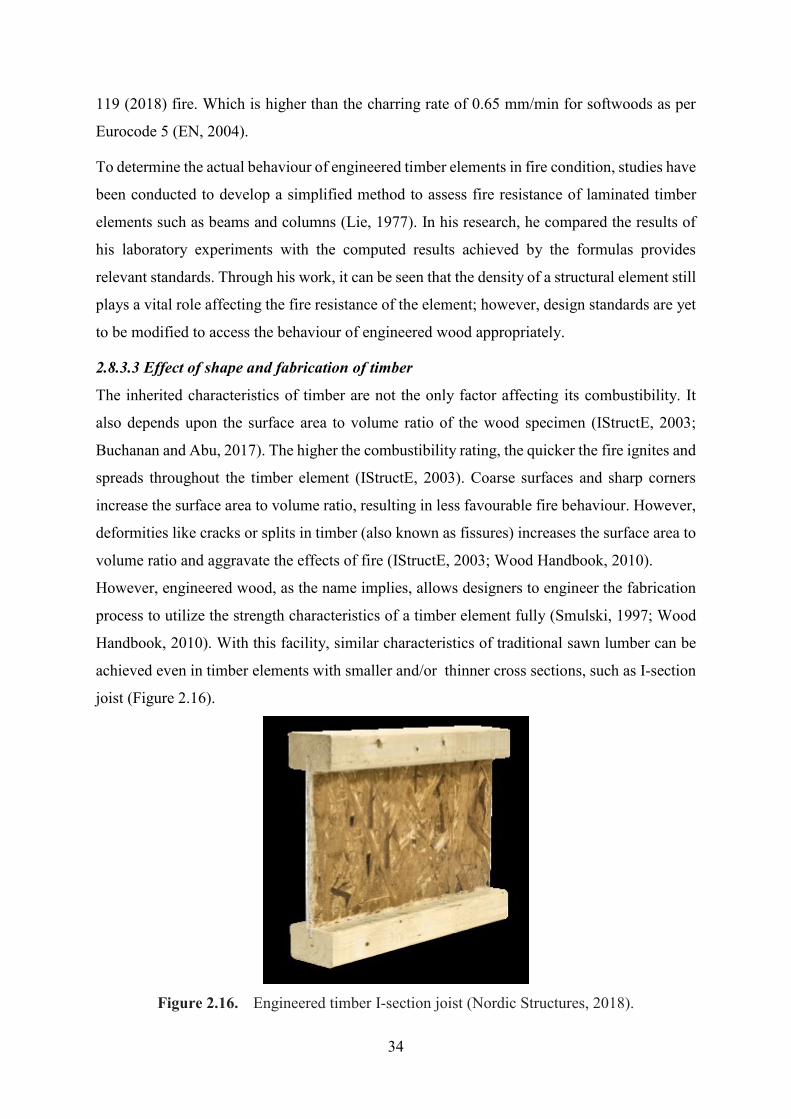
34
119 (2018) fire. Which is higher than the charring rate of 0.65 mm/min for softwoods as per
Eurocode 5 (EN, 2004).
To determine the actual behaviour of engineered timber elements in fire condition, studies have
been conducted to develop a simplified method to assess fire resistance of laminated timber
elements such as beams and columns (Lie, 1977). In his research, he compared the results of
his laboratory experiments with the computed results achieved by the formulas provides
relevant standards. Through his work, it can be seen that the density of a structural element still
plays a vital role affecting the fire resistance of the element; however, design standards are yet
to be modified to access the behaviour of engineered wood appropriately.
2.8.3.3 Effect of shape and fabrication of timber
The inherited characteristics of timber are not the only factor affecting its combustibility. It
also depends upon the surface area to volume ratio of the wood specimen (IStructE, 2003;
Buchanan and Abu, 2017). The higher the combustibility rating, the quicker the fire ignites and
spreads throughout the timber element (IStructE, 2003). Coarse surfaces and sharp corners
increase the surface area to volume ratio, resulting in less favourable fire behaviour. However,
deformities like cracks or splits in timber (also known as fissures) increases the surface area to
volume ratio and aggravate the effects of fire (IStructE, 2003; Wood Handbook, 2010).
However, engineered wood, as the name implies, allows designers to engineer the fabrication
process to utilize the strength characteristics of a timber element fully (Smulski, 1997; Wood
Handbook, 2010). With this facility, similar characteristics of traditional sawn lumber can be
achieved even in timber elements with smaller and/or thinner cross sections, such as I-section
joist (Figure 2.16).
Figure 2.16. Engineered timber I-section joist (Nordic Structures, 2018).
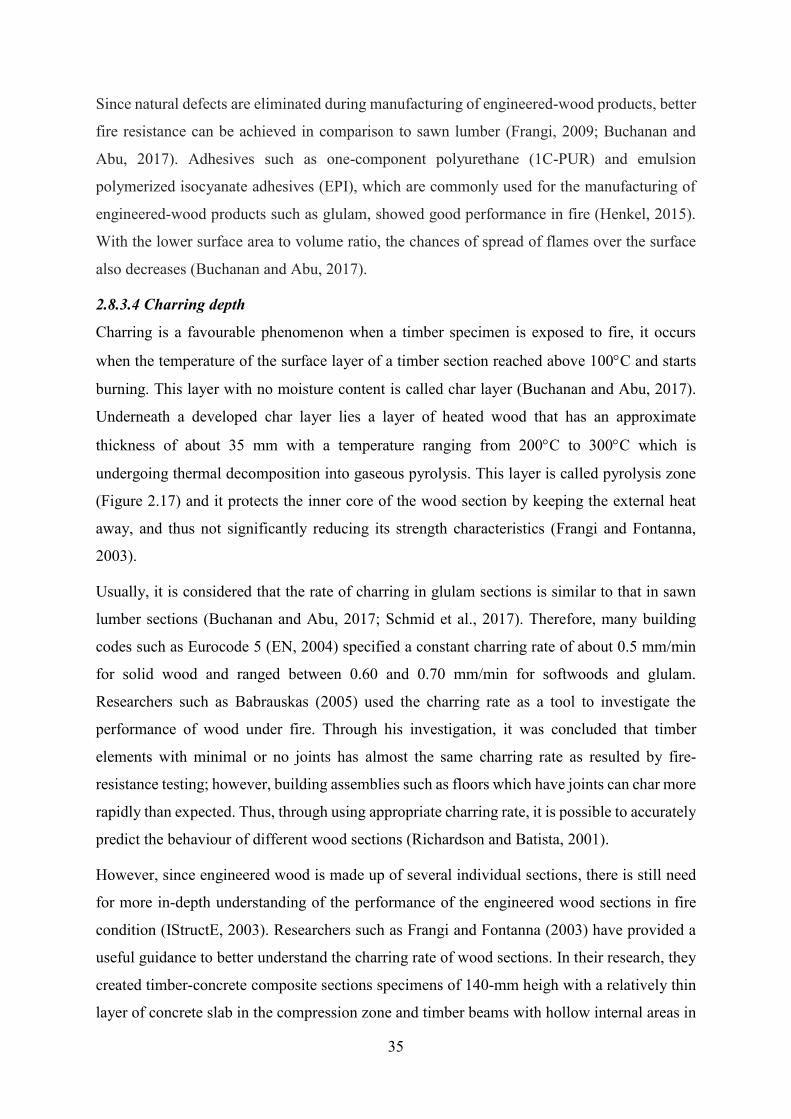
35
Since natural defects are eliminated during manufacturing of engineered-wood products, better
fire resistance can be achieved in comparison to sawn lumber (Frangi, 2009; Buchanan and
Abu, 2017). Adhesives such as one-component polyurethane (1C-PUR) and emulsion
polymerized isocyanate adhesives (EPI), which are commonly used for the manufacturing of
engineered-wood products such as glulam, showed good performance in fire (Henkel, 2015).
With the lower surface area to volume ratio, the chances of spread of flames over the surface
also decreases (Buchanan and Abu, 2017).
2.8.3.4 Charring depth
Charring is a favourable phenomenon when a timber specimen is exposed to fire, it occurs
when the temperature of the surface layer of a timber section reached above 100C and starts
burning. This layer with no moisture content is called char layer (Buchanan and Abu, 2017).
Underneath a developed char layer lies a layer of heated wood that has an approximate
thickness of about 35 mm with a temperature ranging from 200C to 300C which is
undergoing thermal decomposition into gaseous pyrolysis. This layer is called pyrolysis zone
(Figure 2.17) and it protects the inner core of the wood section by keeping the external heat
away, and thus not significantly reducing its strength characteristics (Frangi and Fontanna,
2003).
Usually, it is considered that the rate of charring in glulam sections is similar to that in sawn
lumber sections (Buchanan and Abu, 2017; Schmid et al., 2017). Therefore, many building
codes such as Eurocode 5 (EN, 2004) specified a constant charring rate of about 0.5 mm/min
for solid wood and ranged between 0.60 and 0.70 mm/min for softwoods and glulam.
Researchers such as Babrauskas (2005) used the charring rate as a tool to investigate the
performance of wood under fire. Through his investigation, it was concluded that timber
elements with minimal or no joints has almost the same charring rate as resulted by fire-
resistance testing; however, building assemblies such as floors which have joints can char more
rapidly than expected. Thus, through using appropriate charring rate, it is possible to accurately
predict the behaviour of different wood sections (Richardson and Batista, 2001).
However, since engineered wood is made up of several individual sections, there is still need
for more in-depth understanding of the performance of the engineered wood sections in fire
condition (IStructE, 2003). Researchers such as Frangi and Fontanna (2003) have provided a
useful guidance to better understand the charring rate of wood sections. In their research, they
created timber-concrete composite sections specimens of 140-mm heigh with a relatively thin
layer of concrete slab in the compression zone and timber beams with hollow internal areas in
36
the tension zone. Laboratory experiments for three face fire exposure (Figure 2.18) were
conducted on several such specimens using the guidelines provides in ISO 834-14. According
to the outcomes of their experimental program, it can be concluded that normal approach of
calculation of fire resistance by assuming constant charring rate has been proven correct so far;
however, it can only be used for residual cross sections of 40 to 60 mm thick but, not smaller
than that. Where under three-side fire exposure condition timber beams showed signs of
increased charring rate, when the residual cross section was smaller than 40 to 60 mm.
Figure 2.17. Comparison of different layers of wood after and before fire exposure
(Schaffer, 2007).
Figure 2.18. Charring of glulam beam in three and four-face fire exposure (Buchanan,
2000).
2.8.3.5 Fire retardant treatments
A variety of fire retardants are available in the market for treating timber to reduce its
combustibility, such as diammonium phosphate, guanidine phosphate, guanylurea and
melamine monophosphate (LeVan and Winandy, 2007; Wood Handbook, 2010). The prime
objective of these chemicals is to reduce the rate at which the flames spread over the surface
of a timber element (Buchanan and Abu, 2017). Pressure injection of these chemicals is
37
considerably more effective than painting it over the surface. Pressure impregnation process is
similar to the process employed for applying decay-resistant chemicals. Even though the
pressure impregnation using fire retardants help in improving the fire resistance of timber, but
it may also cause some negative effects such as loss of timber strength and corrosion of metal
fasteners aggravated by the hydroscopic nature of chemicals. Therefore, an alternative to the
use of fire retardants is required which can be seen in the form of FRP material and further
research is in progress to find a cost-effective way to utilize FRP material for commercial
construction purposes properly (Buchanan and Abu, 2017).
Similar techniques of impregnation or painting timber section with fire retardant chemicals can
be used in engineered wood as well but, since engineered wood is bonded with the use of
adhesives, its fire resistance performance can be increased or decreased by using the different
variety of adhesives used to make a bond (Buchanan and Abu, 2017). A reference to such
behaviour of engineered wood can be seen in the research carried out by Frangi et al. (2009) to
determine the performance of cross-laminated timber (CLT) under fire exposure. The main
focus of their research was to compare the behaviour of cross-laminated timber with timber
panels in fire condition. In their study, CLT specimens were fabricated using five different
types of polyurethane and one melamine urea formaldehyde adhesives. According to their
experimental results, it was observed that behaviour of cross-laminated timber is influenced
significantly by the behaviour of adhesives used. For example, test specimens prepared using
temperature-sensitive polyurethane adhesive started falling off of the charred layer after the
layers were completely charred in comparison to specimens prepared with melamine urea
formaldehyde that remained intact for longer duration. However, there is still lack in research
to further understand the behaviour of composite and built-up wooden sections exposed to
elevated temperatures. Thus, further fire experimentation is needed to better understand and
develop more accurate analytical methods to more utilize such section in building construction.
2.9 Summary
Through the review of the literature mentioned above, the author observed some important
areas in which further research is necessary to better understand the behaviour of glulam built-
up box-section beams at ambient and elevated temperatures. The observations are listed as
follows:
1. The numerical methods available in wood engineering design standards and codes, such
as Canadian wood design code (Canadian wood Council, 2015) are mainly to design
38
and determine the behaviour of solid timber or glulam beams. However, there is still
lack of simple numerical equations that can help in the design of built-up glulam beams;
2. Several research studies have been conducted on the development of techniques such
as FRP reinforcement bars and Pre-Stressing systems, which can substantially improve
the flexural bending strength of glulam beams. Still, the development of cost-effective
ways to increase the bending strength of glulam box-section beams while utilizing the
hollow core of these built-up sections;
3. Classic beam theories such as Vlasov’s energy theorem and Timoshenko beam theory,
can provide almost similar results to the experimental outcomes, given the finite
element models created based on these theorems are accurately analysed;
4. The current equations provided in CAN/ULC-S-101-14, ISO 834-85 and ASTM E 119-
18 to determine the fire resistance of solid timber or glulam beams can also be
implemented to estimate the performance of built-up timber sections. However, some
assumptions must be made.
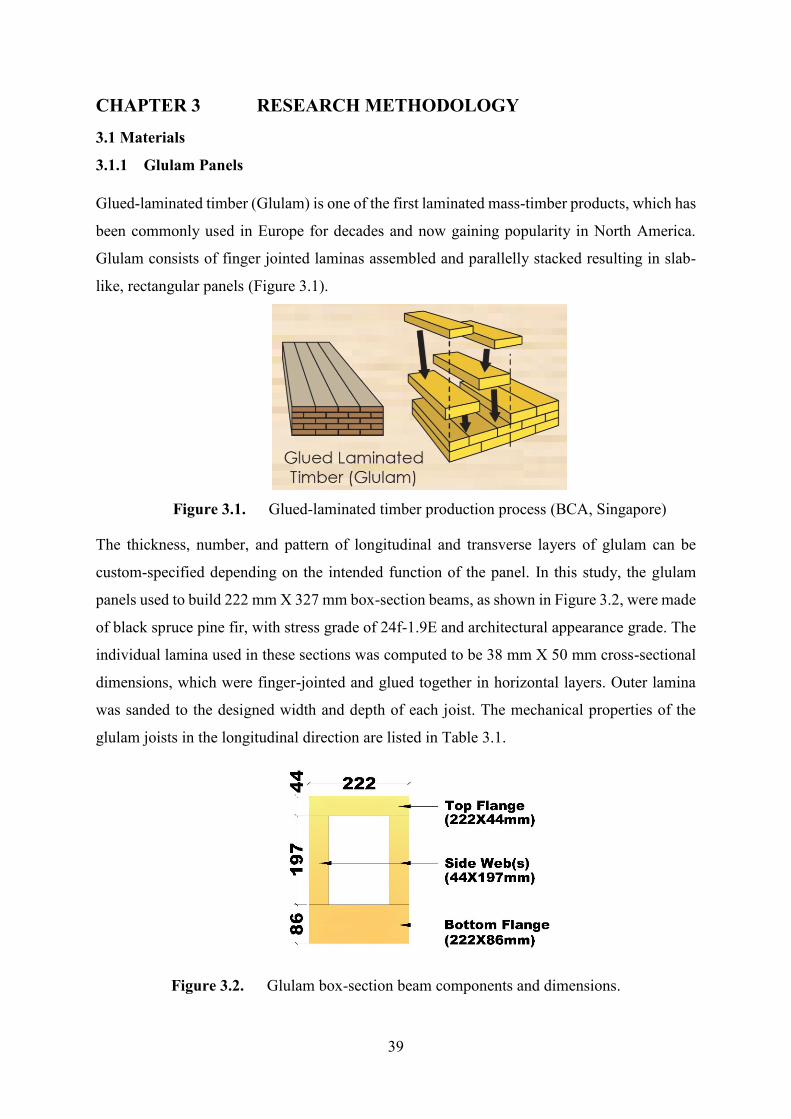
39
CHAPTER 3 RESEARCH METHODOLOGY
3.1 Materials
3.1.1 Glulam Panels
Glued-laminated timber (Glulam) is one of the first laminated mass-timber products, which has
been commonly used in Europe for decades and now gaining popularity in North America.
Glulam consists of finger jointed laminas assembled and parallelly stacked resulting in slab-
like, rectangular panels (Figure 3.1).
Figure 3.1. Glued-laminated timber production process (BCA, Singapore)
The thickness, number, and pattern of longitudinal and transverse layers of glulam can be
custom-specified depending on the intended function of the panel. In this study, the glulam
panels used to build 222 mm X 327 mm box-section beams, as shown in Figure 3.2, were made
of black spruce pine fir, with stress grade of 24f-1.9E and architectural appearance grade. The
individual lamina used in these sections was computed to be 38 mm X 50 mm cross-sectional
dimensions, which were finger-jointed and glued together in horizontal layers. Outer lamina
was sanded to the designed width and depth of each joist. The mechanical properties of the
glulam joists in the longitudinal direction are listed in Table 3.1.
Figure 3.2. Glulam box-section beam components and dimensions.
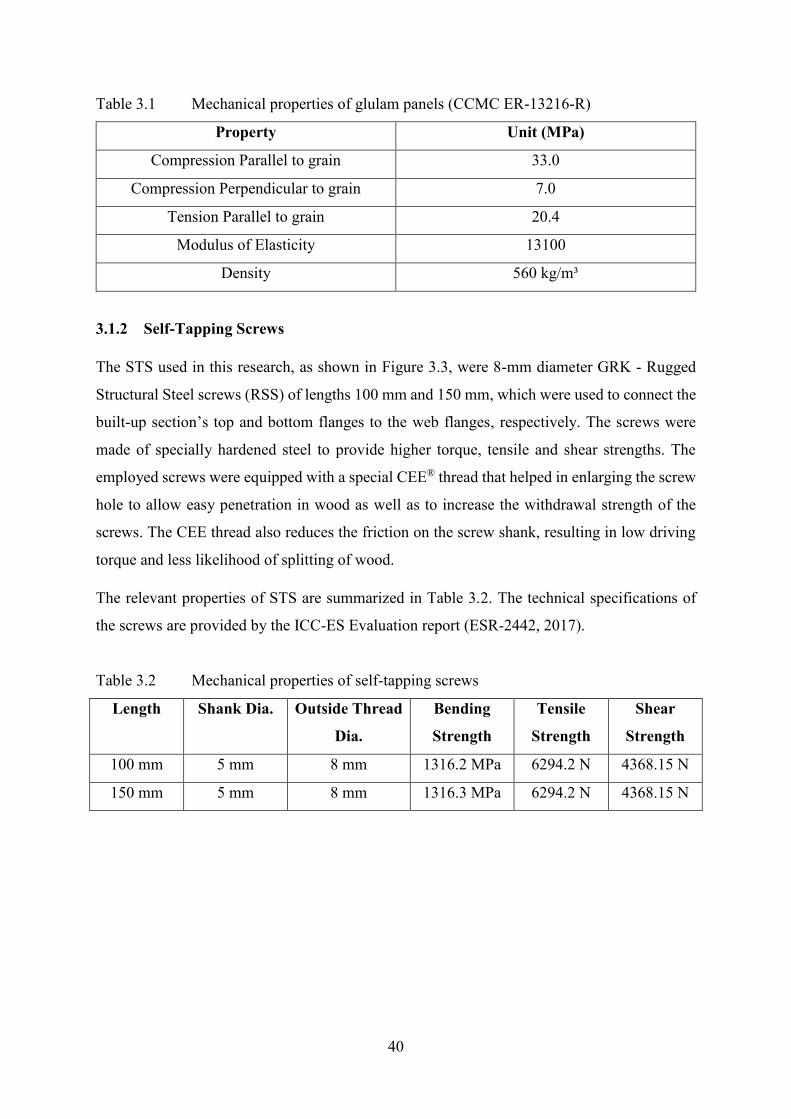
40
Table 3.1 Mechanical properties of glulam panels (CCMC ER-13216-R)
Property Unit (MPa)
Compression Parallel to grain 33.0
Compression Perpendicular to grain 7.0
Tension Parallel to grain 20.4
Modulus of Elasticity 13100
Density 560 kg/m³
3.1.2 Self-Tapping Screws
The STS used in this research, as shown in Figure 3.3, were 8-mm diameter GRK - Rugged
Structural Steel screws (RSS) of lengths 100 mm and 150 mm, which were used to connect the
built-up section’s top and bottom flanges to the web flanges, respectively. The screws were
made of specially hardened steel to provide higher torque, tensile and shear strengths. The
employed screws were equipped with a special CEE® thread that helped in enlarging the screw
hole to allow easy penetration in wood as well as to increase the withdrawal strength of the
screws. The CEE thread also reduces the friction on the screw shank, resulting in low driving
torque and less likelihood of splitting of wood.
The relevant properties of STS are summarized in Table 3.2. The technical specifications of
the screws are provided by the ICC-ES Evaluation report (ESR-2442, 2017).
Table 3.2 Mechanical properties of self-tapping screws
Length Shank Dia. Outside Thread
Dia.
Bending
Strength
Tensile
Strength
Shear
Strength
100 mm 5 mm 8 mm 1316.2 MPa 6294.2 N 4368.15 N
150 mm 5 mm 8 mm 1316.3 MPa 6294.2 N 4368.15 N
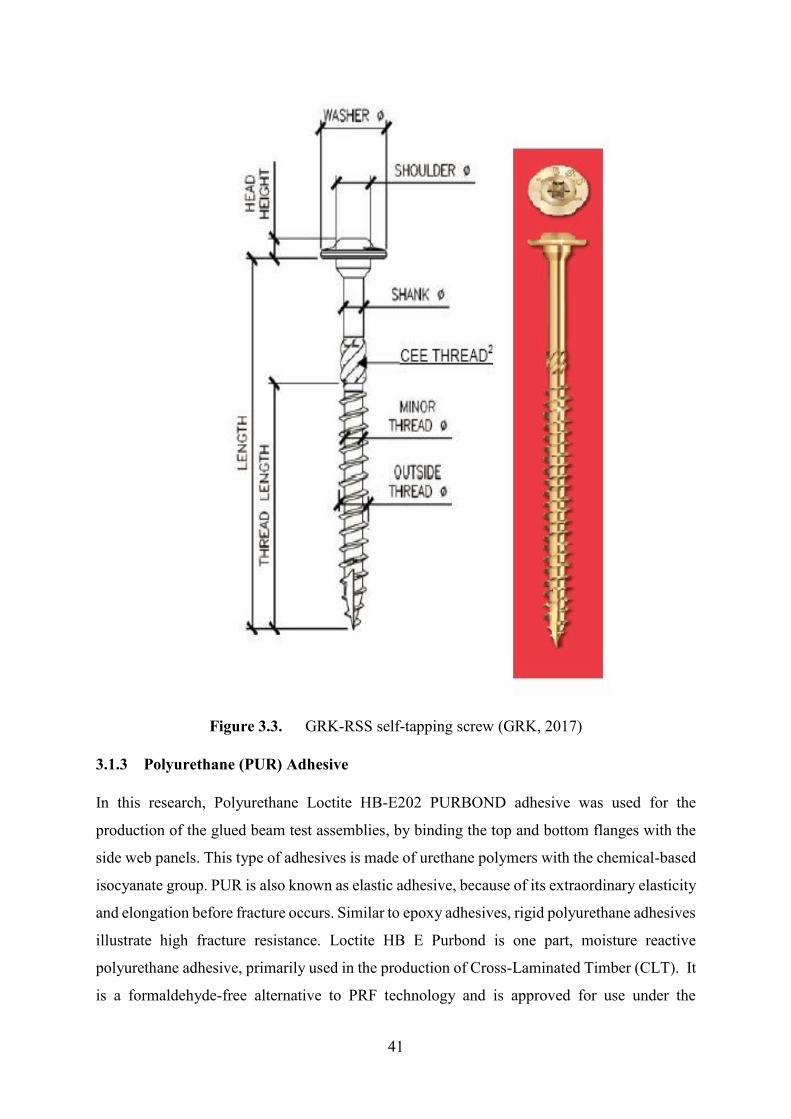
41
Figure 3.3. GRK-RSS self-tapping screw (GRK, 2017)
3.1.3 Polyurethane (PUR) Adhesive
In this research, Polyurethane Loctite HB-E202 PURBOND adhesive was used for the
production of the glued beam test assemblies, by binding the top and bottom flanges with the
side web panels. This type of adhesives is made of urethane polymers with the chemical-based
isocyanate group. PUR is also known as elastic adhesive, because of its extraordinary elasticity
and elongation before fracture occurs. Similar to epoxy adhesives, rigid polyurethane adhesives
illustrate high fracture resistance. Loctite HB E Purbond is one part, moisture reactive
polyurethane adhesive, primarily used in the production of Cross-Laminated Timber (CLT). It
is a formaldehyde-free alternative to PRF technology and is approved for use under the
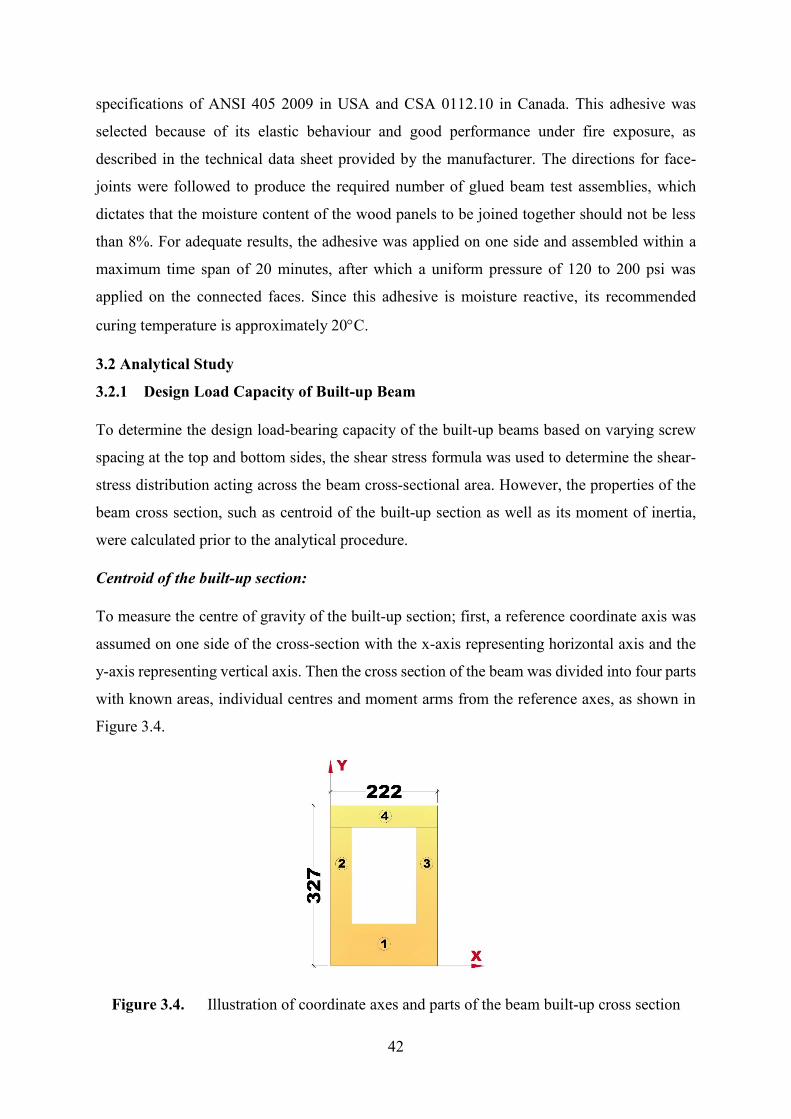
42
specifications of ANSI 405 2009 in USA and CSA 0112.10 in Canada. This adhesive was
selected because of its elastic behaviour and good performance under fire exposure, as
described in the technical data sheet provided by the manufacturer. The directions for face-
joints were followed to produce the required number of glued beam test assemblies, which
dictates that the moisture content of the wood panels to be joined together should not be less
than 8%. For adequate results, the adhesive was applied on one side and assembled within a
maximum time span of 20 minutes, after which a uniform pressure of 120 to 200 psi was
applied on the connected faces. Since this adhesive is moisture reactive, its recommended
curing temperature is approximately 20C.
3.2 Analytical Study
3.2.1 Design Load Capacity of Built-up Beam
To determine the design load-bearing capacity of the built-up beams based on varying screw
spacing at the top and bottom sides, the shear stress formula was used to determine the shear-
stress distribution acting across the beam cross-sectional area. However, the properties of the
beam cross section, such as centroid of the built-up section as well as its moment of inertia,
were calculated prior to the analytical procedure.
Centroid of the built-up section:
To measure the centre of gravity of the built-up section; first, a reference coordinate axis was
assumed on one side of the cross-section with the x-axis representing horizontal axis and the
y-axis representing vertical axis. Then the cross section of the beam was divided into four parts
with known areas, individual centres and moment arms from the reference axes, as shown in
Figure 3.4.
Figure 3.4. Illustration of coordinate axes and parts of the beam built-up cross section
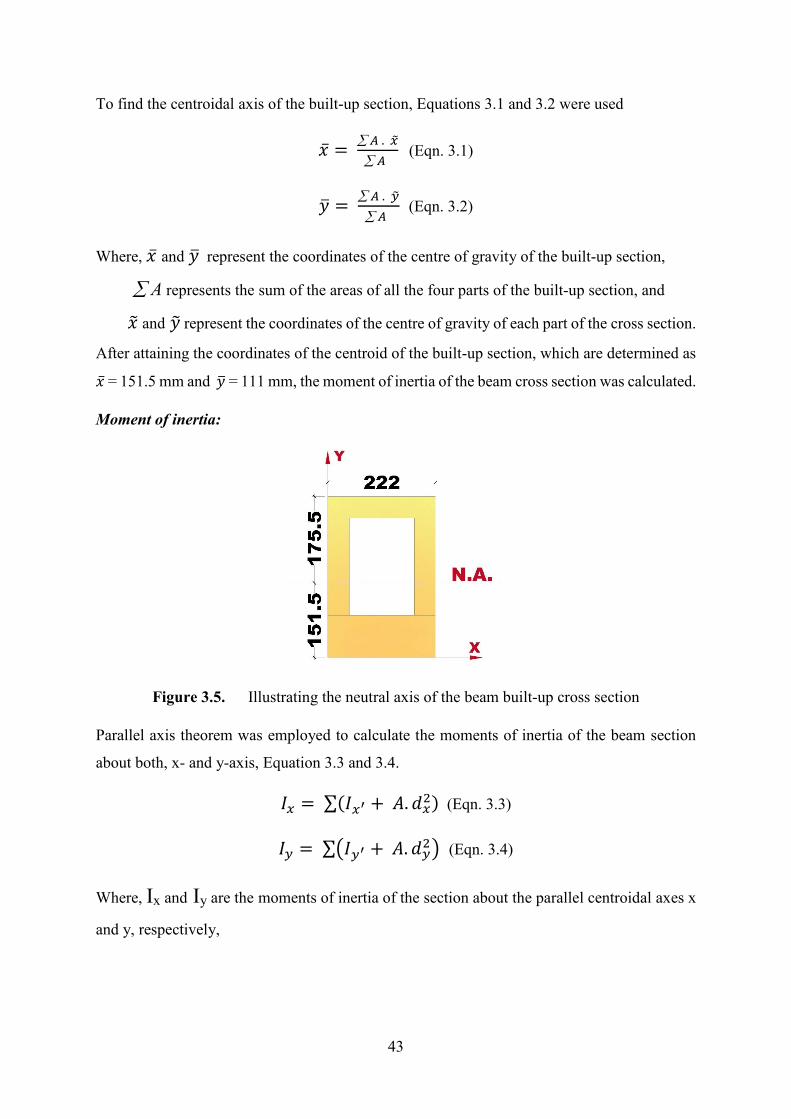
43
To find the centroidal axis of the built-up section, Equations 3.1 and 3.2 were used
�̅� = 𝐴 . �̃�
𝐴 (Eqn. 3.1)
�̅� = 𝐴 . �̃�
𝐴 (Eqn. 3.2)
Where, �̅� and �̅� represent the coordinates of the centre of gravity of the built-up section,
A represents the sum of the areas of all the four parts of the built-up section, and
�̃� and �̃� represent the coordinates of the centre of gravity of each part of the cross section.
After attaining the coordinates of the centroid of the built-up section, which are determined as
�̅� = 151.5 mm and �̅� = 111 mm, the moment of inertia of the beam cross section was calculated.
Moment of inertia:
Figure 3.5. Illustrating the neutral axis of the beam built-up cross section
Parallel axis theorem was employed to calculate the moments of inertia of the beam section
about both, x- and y-axis, Equation 3.3 and 3.4.
𝐼𝑥 = ∑(𝐼𝑥′ + 𝐴. 𝑑𝑥2) (Eqn. 3.3)
𝐼𝑦 = ∑(𝐼𝑦′ + 𝐴. 𝑑𝑦2) (Eqn. 3.4)
Where, Ix and Iy are the moments of inertia of the section about the parallel centroidal axes x
and y, respectively,
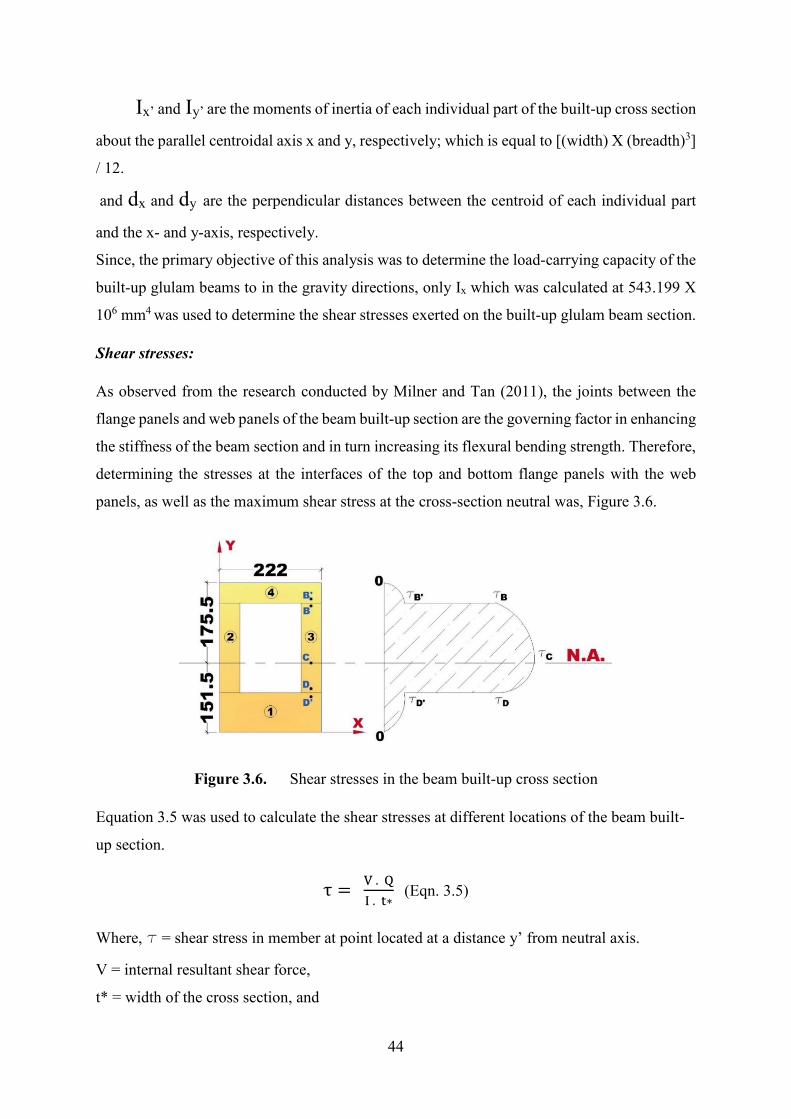
44
Ix’ and Iy’ are the moments of inertia of each individual part of the built-up cross section
about the parallel centroidal axis x and y, respectively; which is equal to [(width) X (breadth)3]
/ 12.
and dx and dy are the perpendicular distances between the centroid of each individual part
and the x- and y-axis, respectively.
Since, the primary objective of this analysis was to determine the load-carrying capacity of the
built-up glulam beams to in the gravity directions, only Ix which was calculated at 543.199 X
106 mm4 was used to determine the shear stresses exerted on the built-up glulam beam section.
Shear stresses:
As observed from the research conducted by Milner and Tan (2011), the joints between the
flange panels and web panels of the beam built-up section are the governing factor in enhancing
the stiffness of the beam section and in turn increasing its flexural bending strength. Therefore,
determining the stresses at the interfaces of the top and bottom flange panels with the web
panels, as well as the maximum shear stress at the cross-section neutral was, Figure 3.6.
Figure 3.6. Shear stresses in the beam built-up cross section
Equation 3.5 was used to calculate the shear stresses at different locations of the beam built-
up section.
τ = V . Q
I . t∗ (Eqn. 3.5)
Where, t = shear stress in member at point located at a distance y’ from neutral axis.
V = internal resultant shear force,
t* = width of the cross section, and
45
𝑄 = 𝑦 ′̅𝐴′, where A’ is the area of the top (or bottom) portion of the member’s cross section,
defined from the section where t is measured and 𝑦 ′̅ is the distance from the section neutral
axis to the centroid of A’.
In result, the values of the shear stresses at different locations of the built-up section in terms
of the applied shear force, V, were calculated as follows;
τB′ = (1.243 X 10⁻⁵ X V) N/mm²
τB = (3.136 X 10⁻⁵ X V) N/mm²
τC = (4.73 X 10⁻⁵ X V) N/mm²
τD = (4.333 X 10⁻⁵ X V) N/mm²
τD′ = (1. 717X 10−5 X V) N/mm².
Shear flow:
After determining the different values of the shear stresses in the built-up beam section, the
values of the shear flow were also calculated using Equation 3.6.
𝑞 =𝑉 . 𝑄
𝐼= (𝜏 . 𝑡 ∗ ) 𝑁/𝑚𝑚 (Eqn. 3.6)
Where, 𝑞𝐵′ = 𝑞𝐵 = (2.760 X 10⁻³ X V) N/mm and 𝑞𝐷′ = 𝑞𝐷 = (3.813 X 10⁻³ X V) N/mm.
The calculated shear flow values indicated that since the bottom flange was determined to be
in proximity of the cross-section neutral axis, the shear stresses were greater in the web panels
in the zone between the bottom flange and the cross-section neutral axis.
Design load-bearing capacity:
Using the calculated shear flow values, the screw spacings at the top and bottom interfaces
were determined using Equation 3.7.
𝑆𝑝𝑎𝑐𝑖𝑛𝑔 𝑜𝑓 𝑆𝑐𝑟𝑒𝑤𝑠 =𝐴𝑙𝑙𝑜𝑤𝑎𝑏𝑙𝑒 𝑠ℎ𝑒𝑎𝑟 𝑠𝑡𝑟𝑒𝑛𝑔𝑡ℎ 𝑜𝑓 𝑠𝑖𝑛𝑔𝑙𝑒 𝑠𝑐𝑟𝑒𝑤
𝑆ℎ𝑒𝑎𝑟 𝑓𝑙𝑜𝑤 𝑖𝑛 𝑡ℎ𝑎𝑡 𝑙𝑒𝑛𝑔𝑡ℎ (Eqn. 3.7)
Considering a loading scenario of two equal concentrated loads symmetrically placed on top
of the beam test assembly to impose a four-point flexural bending behaviour, the shear force
calculated is equal to each point load applied. Thus, providing the results as follows.

46
Table 3.3 Summary of design load capacity of the screwed beam assemblies
Assembly No. Side Screw Spacing
(mm)
Design Load Capacity
(kN)
Pilot Test Top
Bottom
800
800
8.0
5.7
Assembly 1 Top
Bottom
200
200
32.0
23.0
Assembly 2 Top
Bottom
200
100 (200 in the middle
one third length)
32.0
46.0
3.2.2 Ultimate Load Capacity of Hollow Glulam Beam
To get a proper insight in the ultimate load capacity of the hollow glulam beams, calculations
were performed on a scenario in which a cut-off section of 134 mm X 197 mm high, as shown
in Figure 3.7, was removed from a solid glulam beam of similar external cross-sectional
dimensions (222 mm X 327 mm) as the built-up glulam beams experimentally examined in
this research.
Figure 3.7. Hollow glulam beam section
Using the modulus of elasticity of glulam sections (E = 13100 MPa) provided in CCMC
Evaluation Report – 13216-R and the moment of inertia (IX = 543.199 X 10⁶ 𝑚𝑚4) calculated
as described in section 3.2.1,
The maximum deflection experienced by the hollow glulam beam was determined by using
Equation 3.8, From table 2.1 of Canadian wood design manual, 2015.
Max. Deflection, ∆ = Span/240 (Eqn. 3.8)
Considering the beam span equal 3000 mm, the maximum allowable deflection was calculated
at 10 mm.
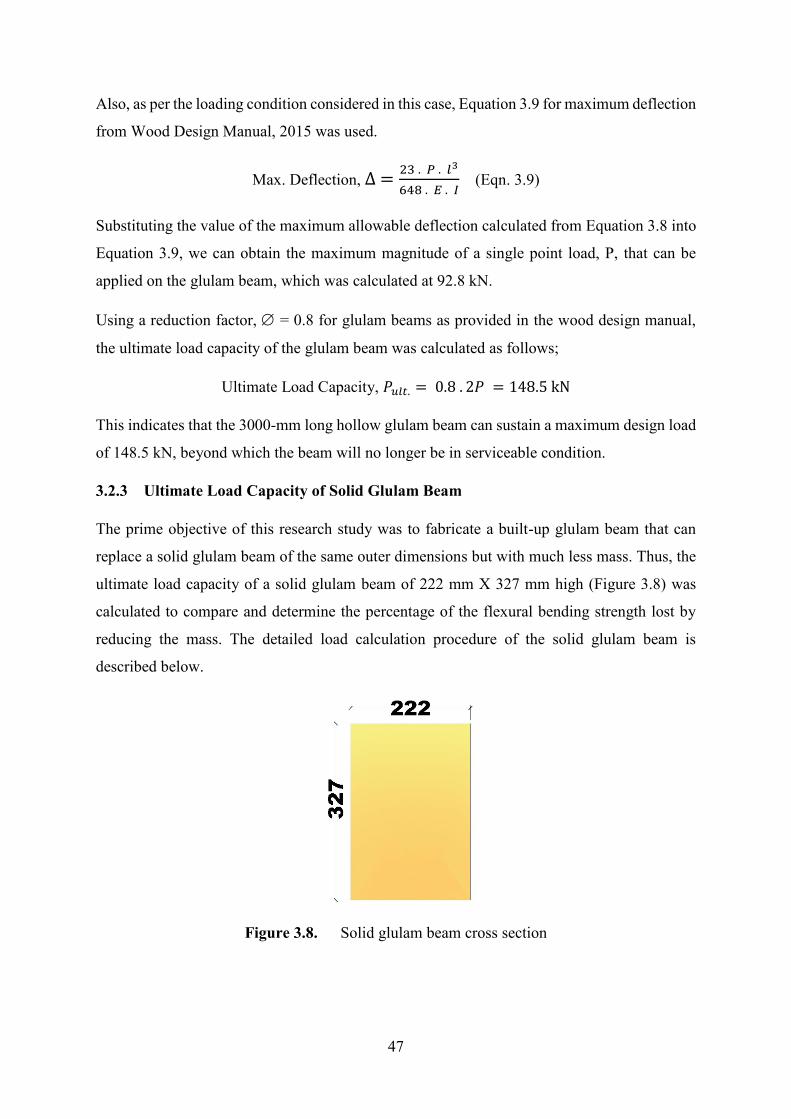
47
Also, as per the loading condition considered in this case, Equation 3.9 for maximum deflection
from Wood Design Manual, 2015 was used.
Max. Deflection, ∆ =23 . 𝑃 . 𝑙3
648 . 𝐸 . 𝐼 (Eqn. 3.9)
Substituting the value of the maximum allowable deflection calculated from Equation 3.8 into
Equation 3.9, we can obtain the maximum magnitude of a single point load, P, that can be
applied on the glulam beam, which was calculated at 92.8 kN.
Using a reduction factor, = 0.8 for glulam beams as provided in the wood design manual,
the ultimate load capacity of the glulam beam was calculated as follows;
Ultimate Load Capacity, 𝑃𝑢𝑙𝑡. = 0.8 . 2𝑃 = 148.5 kN
This indicates that the 3000-mm long hollow glulam beam can sustain a maximum design load
of 148.5 kN, beyond which the beam will no longer be in serviceable condition.
3.2.3 Ultimate Load Capacity of Solid Glulam Beam
The prime objective of this research study was to fabricate a built-up glulam beam that can
replace a solid glulam beam of the same outer dimensions but with much less mass. Thus, the
ultimate load capacity of a solid glulam beam of 222 mm X 327 mm high (Figure 3.8) was
calculated to compare and determine the percentage of the flexural bending strength lost by
reducing the mass. The detailed load calculation procedure of the solid glulam beam is
described below.
Figure 3.8. Solid glulam beam cross section
48
Section Properties:
Modulus of Elasticity, E = 13100 MPa (CCMC-13216-R)
Moment of Inertia, I = bd³/12 = 646.87 X 106 mm4
Moment Resistance:
Using clause 7.5.6.5.1 of Wood design manual (WDM,2015), the moment resistance of the
beam can be calculated as per Equations 3.10 and 3.11;
𝑀𝑟1 = 𝐹𝑏 𝑆 𝐾𝑋 𝐾𝑍𝑏𝑔 (Eqn. 3.10)
𝑀𝑟2 = 𝐹𝑏 𝑆 𝐾𝑋 𝐾𝐿 (Eqn. 3.11)
Where, Section Modulus, S = I/ymax. = 3956.37 X 103 mm3 ;
Reduction Factor, = 0.8;
𝐹𝑏 = 𝑓𝑏 (𝐾𝐷 𝐾𝐻 𝐾𝑆𝑏 𝐾𝑇) = 30.7 MPa
𝐾𝑍𝑏𝑔 = (130
𝑏)
1
10 (
610
𝑑)
1
10 (
9100
𝐿)
1
10 = 1.13
Specific Strength in bending, fb = 30.7 MPa [CCMC – 13216-R]
Following values were taken from Wood design manual, 2015:
- Duration Factor, 𝑲𝑫 = 1.0 (Cl.5.3.2) (Standard Duration)
- System Factor, 𝑲𝑯 = 1.0 (Cl. 7.4.3) (Tension parallel to grain)
- Bending in extreme fibre, 𝑲𝑺𝒃 = 1.0 (T.7.4.2) (Dry Service)
- Treatment Factor, 𝑲𝑻 = 1.0 (Untreated)
- Curvature Factor, 𝑲𝑿 = 1.0 (Straight beam)
- Lateral Stability Factor, 𝑲𝑳 = 1.0 (Cl. 7.5.6.3.1)
- Mr1 = 123.525 kN-m; Mr2 = 109.314 kN-m (Choosing lesser of Mr1 and Mr2)
- Factored Bending Moment Resistance, Mr = Mr2 = 𝑷𝒇 (𝑳
𝟑) 𝑷𝒖𝒍𝒕. = 2. Pf = 218.6 kN
Shear Resistance:
Similarly, as per clause 7.5.7.2 of wood design manual (2015), (Equation 3.12)
Factored shear resistance, 𝑉𝑟 = 𝐹𝑣 (2 𝐴𝑔
3) (Eqn. 3.12)

49
Thus, Fv = 𝑓𝑣 (𝐾𝐷 𝐾𝐻 𝐾𝑆𝑣 𝐾𝑇) = 2.2 MPa,
Specified strength in shear, 𝑓𝑣 = 2.2 MPa [CCMC − 13216 − R],
Gross Cross-sectional Area, 𝐴𝑔 = 𝑏 . 𝑑 = 72594 mm2;
𝐾Sv = 1.0 (T.7.4.2) (Dry Service) [WDM,2015];
Vr = 95.82 kN
As per Equilibrium;
Vr = VF = Pf /2 = 95.82 kN
Ultimate Load, Pult. = 192 kN
Since, it can be seen through calculation that lesser load is required for the beam to reach the
point of ultimate failure due to shear; thus, the ultimate load capacity of the solid glulam beam
should equal 192 kN.
When compared the ultimate load capacities of hollow glulam beam and solid glulam beam, it
was observed that the beam only loses a strength of about 22.6% when the mass of the beam
was reduced by 36%, considering the built-up beam section behaves as one consolidated
section.
3.3 Fabrication Process of Experimental Test Assemblies
3.3.1 Screwed Test Assemblies
Seven full-size built-up glulam box-section beams were fabricated by joining all glulam panels
together using 8-mm diameter self-tapping screws. Detailed drawings of screwed beam
assemblies are attached in Appendix – I. The fabrication process of the screwed test assemblies
is described in detail as follows;
Step – 1: Placement
The first step in the fabrication process was to accurately place the glulam panels as per their
placing scheme, where two panels of size 44 mm X 197 mm were used in each beam assembly
as side or web panels of the box section. These web panels were then aligned with the top and
bottom flange panels of dimensions of 222 mm X 44 mm and 222mm X 86mm, respectively,
to create the desired built-up box-section glulam beam assembly.
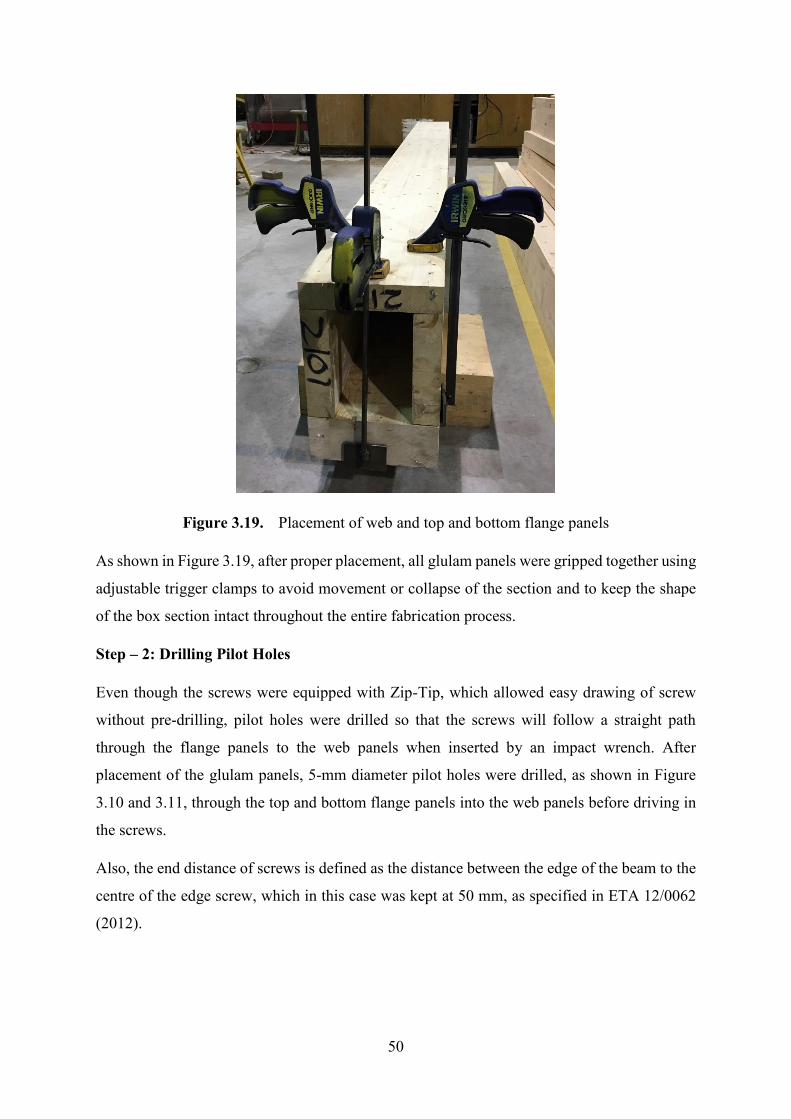
50
Figure 3.19. Placement of web and top and bottom flange panels
As shown in Figure 3.19, after proper placement, all glulam panels were gripped together using
adjustable trigger clamps to avoid movement or collapse of the section and to keep the shape
of the box section intact throughout the entire fabrication process.
Step – 2: Drilling Pilot Holes
Even though the screws were equipped with Zip-Tip, which allowed easy drawing of screw
without pre-drilling, pilot holes were drilled so that the screws will follow a straight path
through the flange panels to the web panels when inserted by an impact wrench. After
placement of the glulam panels, 5-mm diameter pilot holes were drilled, as shown in Figure
3.10 and 3.11, through the top and bottom flange panels into the web panels before driving in
the screws.
Also, the end distance of screws is defined as the distance between the edge of the beam to the
centre of the edge screw, which in this case was kept at 50 mm, as specified in ETA 12/0062
(2012).
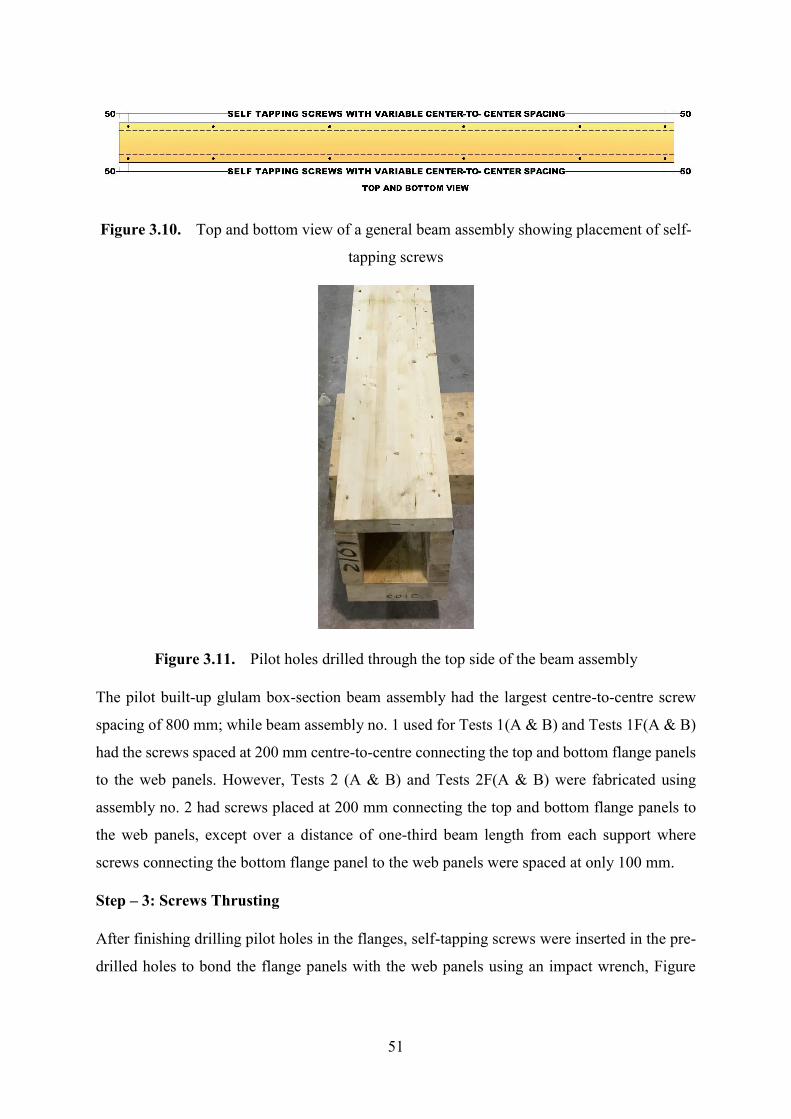
51
Figure 3.10. Top and bottom view of a general beam assembly showing placement of self-
tapping screws
Figure 3.11. Pilot holes drilled through the top side of the beam assembly
The pilot built-up glulam box-section beam assembly had the largest centre-to-centre screw
spacing of 800 mm; while beam assembly no. 1 used for Tests 1(A & B) and Tests 1F(A & B)
had the screws spaced at 200 mm centre-to-centre connecting the top and bottom flange panels
to the web panels. However, Tests 2 (A & B) and Tests 2F(A & B) were fabricated using
assembly no. 2 had screws placed at 200 mm connecting the top and bottom flange panels to
the web panels, except over a distance of one-third beam length from each support where
screws connecting the bottom flange panel to the web panels were spaced at only 100 mm.
Step – 3: Screws Thrusting
After finishing drilling pilot holes in the flanges, self-tapping screws were inserted in the pre-
drilled holes to bond the flange panels with the web panels using an impact wrench, Figure
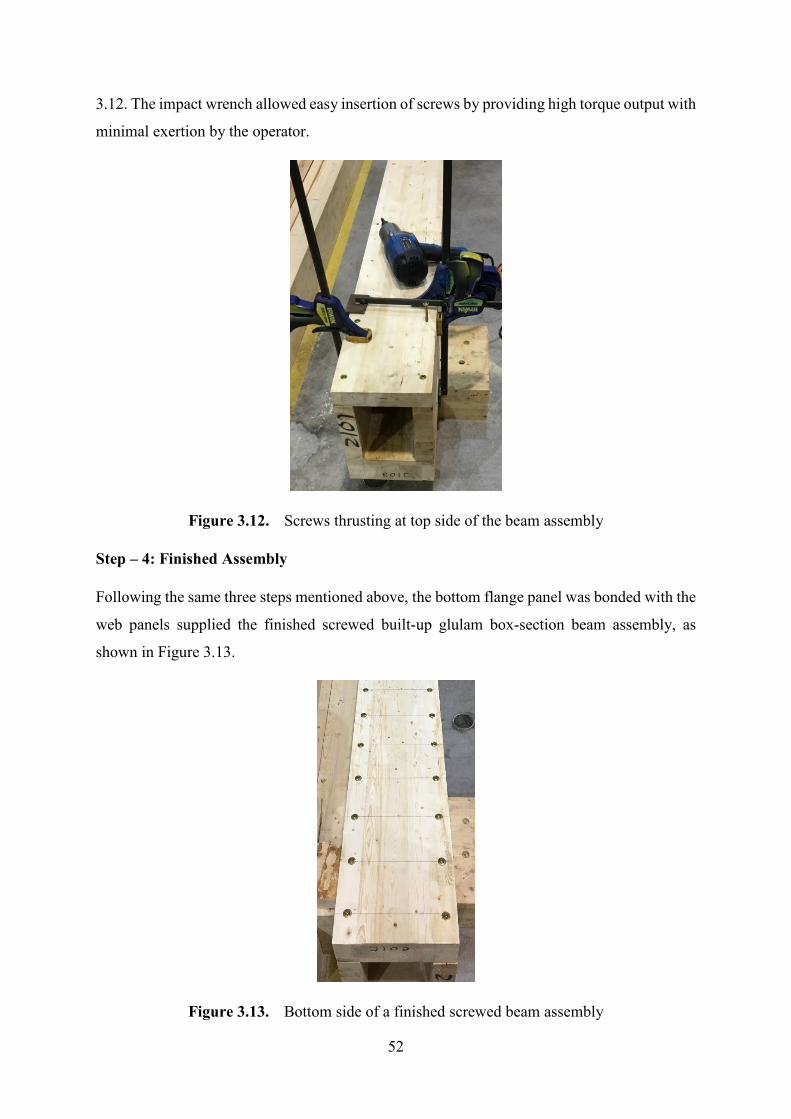
52
3.12. The impact wrench allowed easy insertion of screws by providing high torque output with
minimal exertion by the operator.
Figure 3.12. Screws thrusting at top side of the beam assembly
Step – 4: Finished Assembly
Following the same three steps mentioned above, the bottom flange panel was bonded with the
web panels supplied the finished screwed built-up glulam box-section beam assembly, as
shown in Figure 3.13.
Figure 3.13. Bottom side of a finished screwed beam assembly

53
3.3.2 Glued Test Assemblies
A step-by-step process was used for the fabrication of the four glued built-up beam assemblies,
which is described in the following sections. Since the application and performance of the
adhesive is highly impacted by the temperature and air humidity present in the production area,
all glued beam assemblies were fabricated at a normal room temperature of approximately
20C.
Step – 1: Placement
In order to assemble the glued beam test assemblies, first, the bottom flange panel was
positioned and centred on top of a strong steel beam placed within a large universal testing
machine. The base beam was also equipped with two short steel columns which were
momentarily providing supports to another large loading steel beam, as shown in Figure 3.14,
resulting in formation of temporary hydraulic compression press.
Figure 3.14. A glulam bottom flange panel temporary placed in hydraulic compression
press system
Step – 2: Assembling
After the bottom flange panel was aligned correctly in the center of the universal testing
machine, Loctite HB E202 Purbond adhesive was applied on one edge of the side web panels
which then were placed with their glued edges in contact with the bottom flange panel. The
web panels were then properly aligned with the longitudinal sides of the bottom flange panel.
Afterwards, the top flange panel was temporarily placed in its designated position on top of the
two web panels, as shown in Figure 3.15. Quickly after the four glulam panels were glued
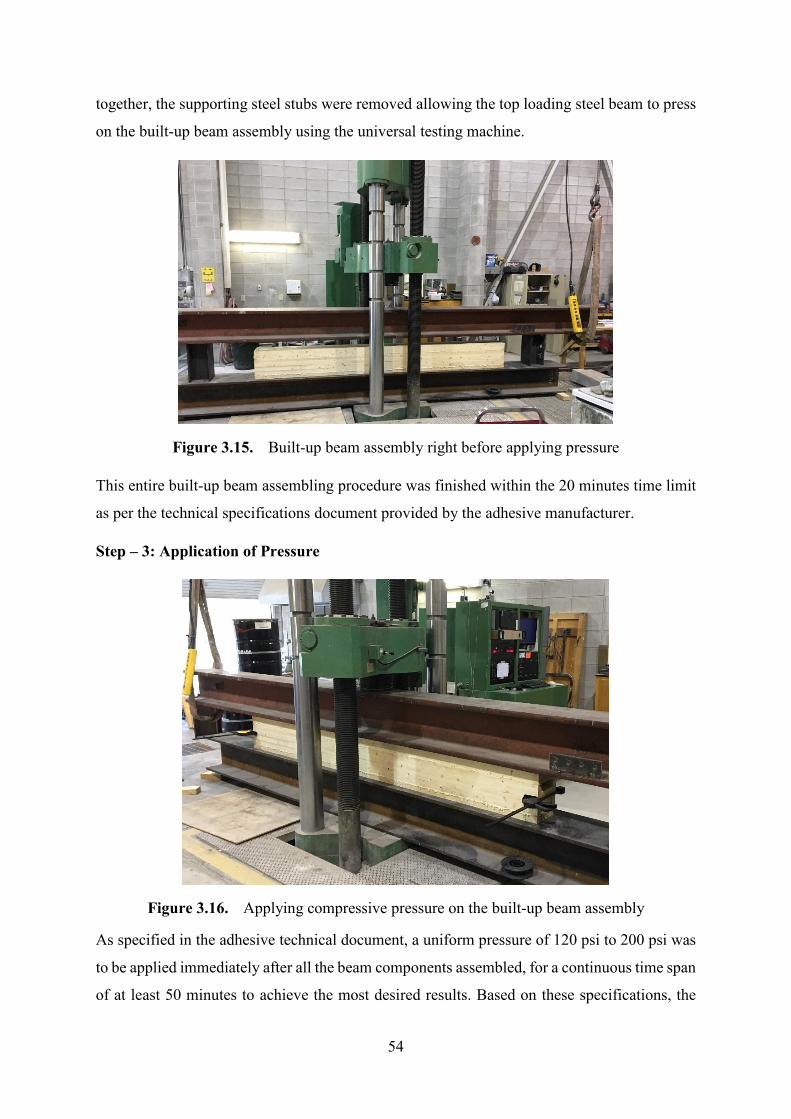
54
together, the supporting steel stubs were removed allowing the top loading steel beam to press
on the built-up beam assembly using the universal testing machine.
Figure 3.15. Built-up beam assembly right before applying pressure
This entire built-up beam assembling procedure was finished within the 20 minutes time limit
as per the technical specifications document provided by the adhesive manufacturer.
Step – 3: Application of Pressure
Figure 3.16. Applying compressive pressure on the built-up beam assembly
As specified in the adhesive technical document, a uniform pressure of 120 psi to 200 psi was
to be applied immediately after all the beam components assembled, for a continuous time span
of at least 50 minutes to achieve the most desired results. Based on these specifications, the
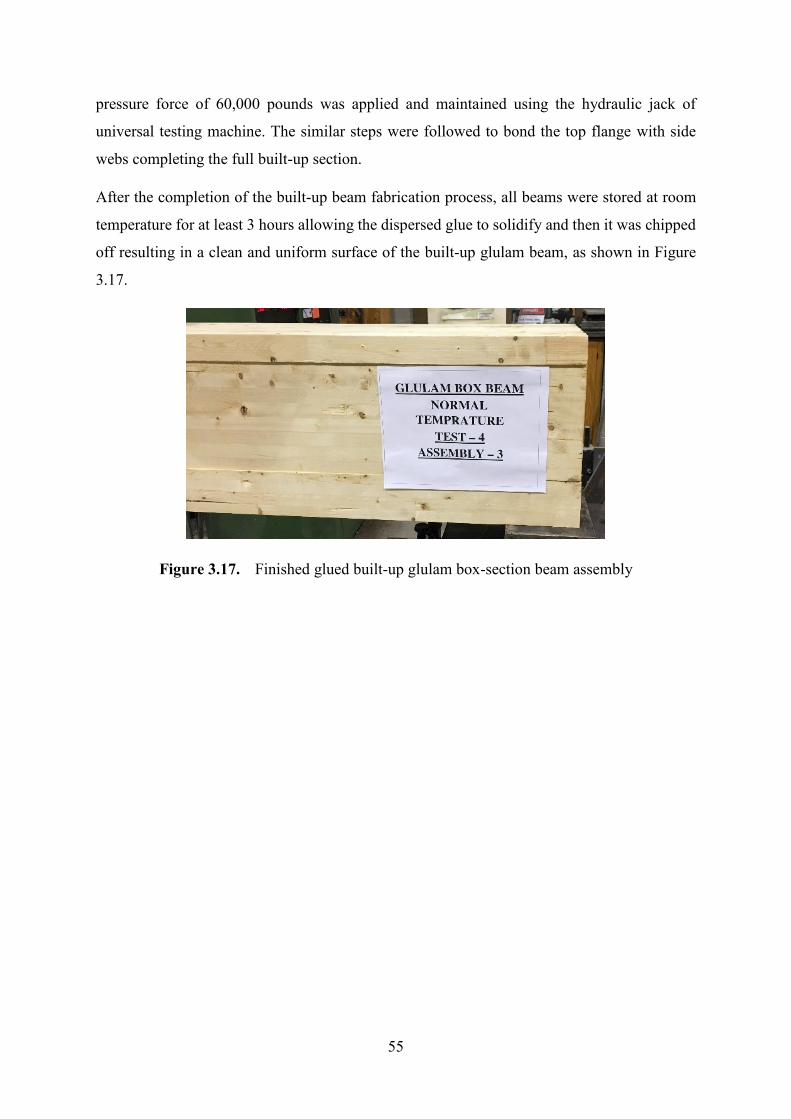
55
pressure force of 60,000 pounds was applied and maintained using the hydraulic jack of
universal testing machine. The similar steps were followed to bond the top flange with side
webs completing the full built-up section.
After the completion of the built-up beam fabrication process, all beams were stored at room
temperature for at least 3 hours allowing the dispersed glue to solidify and then it was chipped
off resulting in a clean and uniform surface of the built-up glulam beam, as shown in Figure
3.17.
Figure 3.17. Finished glued built-up glulam box-section beam assembly
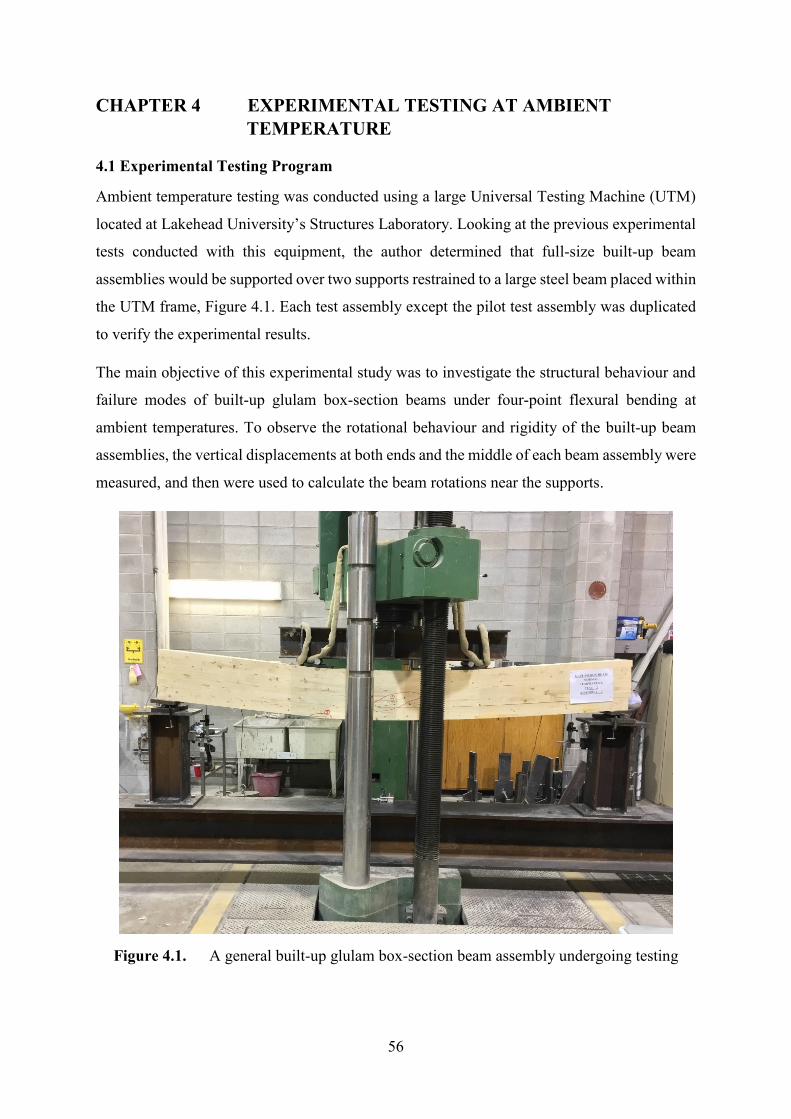
56
CHAPTER 4 EXPERIMENTAL TESTING AT AMBIENT
TEMPERATURE
4.1 Experimental Testing Program
Ambient temperature testing was conducted using a large Universal Testing Machine (UTM)
located at Lakehead University’s Structures Laboratory. Looking at the previous experimental
tests conducted with this equipment, the author determined that full-size built-up beam
assemblies would be supported over two supports restrained to a large steel beam placed within
the UTM frame, Figure 4.1. Each test assembly except the pilot test assembly was duplicated
to verify the experimental results.
The main objective of this experimental study was to investigate the structural behaviour and
failure modes of built-up glulam box-section beams under four-point flexural bending at
ambient temperatures. To observe the rotational behaviour and rigidity of the built-up beam
assemblies, the vertical displacements at both ends and the middle of each beam assembly were
measured, and then were used to calculate the beam rotations near the supports.
Figure 4.1. A general built-up glulam box-section beam assembly undergoing testing
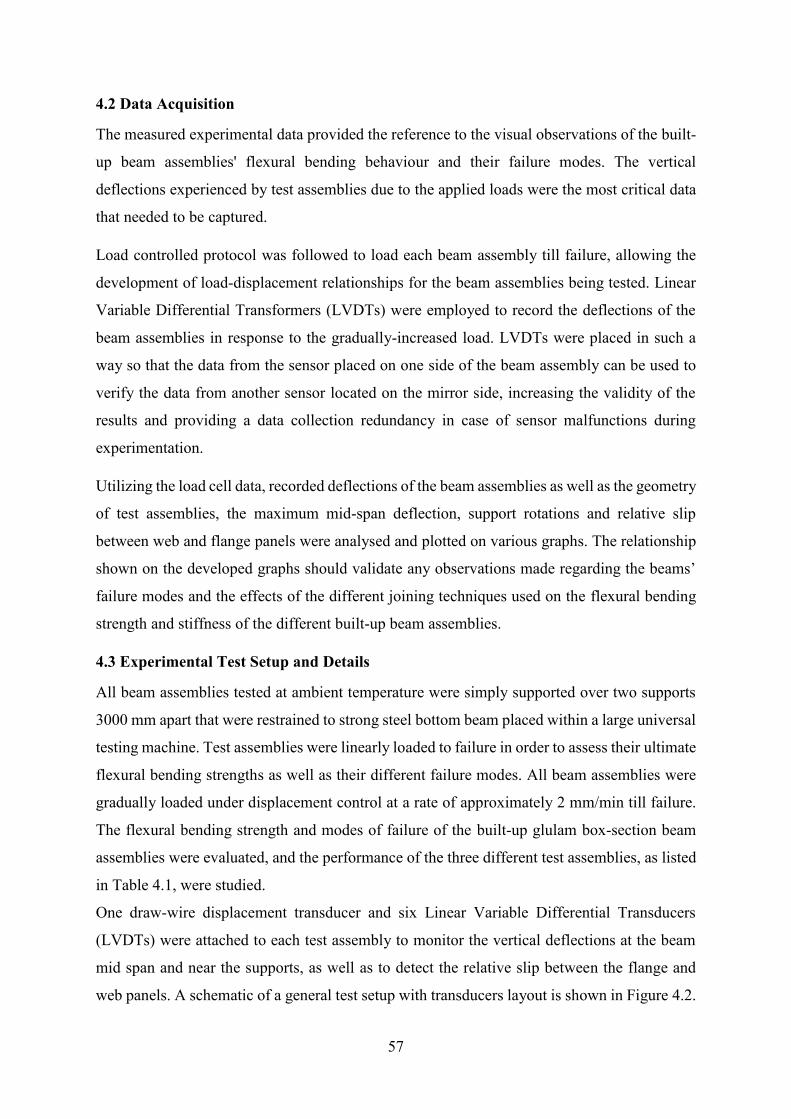
57
4.2 Data Acquisition
The measured experimental data provided the reference to the visual observations of the built-
up beam assemblies' flexural bending behaviour and their failure modes. The vertical
deflections experienced by test assemblies due to the applied loads were the most critical data
that needed to be captured.
Load controlled protocol was followed to load each beam assembly till failure, allowing the
development of load-displacement relationships for the beam assemblies being tested. Linear
Variable Differential Transformers (LVDTs) were employed to record the deflections of the
beam assemblies in response to the gradually-increased load. LVDTs were placed in such a
way so that the data from the sensor placed on one side of the beam assembly can be used to
verify the data from another sensor located on the mirror side, increasing the validity of the
results and providing a data collection redundancy in case of sensor malfunctions during
experimentation.
Utilizing the load cell data, recorded deflections of the beam assemblies as well as the geometry
of test assemblies, the maximum mid-span deflection, support rotations and relative slip
between web and flange panels were analysed and plotted on various graphs. The relationship
shown on the developed graphs should validate any observations made regarding the beams’
failure modes and the effects of the different joining techniques used on the flexural bending
strength and stiffness of the different built-up beam assemblies.
4.3 Experimental Test Setup and Details
All beam assemblies tested at ambient temperature were simply supported over two supports
3000 mm apart that were restrained to strong steel bottom beam placed within a large universal
testing machine. Test assemblies were linearly loaded to failure in order to assess their ultimate
flexural bending strengths as well as their different failure modes. All beam assemblies were
gradually loaded under displacement control at a rate of approximately 2 mm/min till failure.
The flexural bending strength and modes of failure of the built-up glulam box-section beam
assemblies were evaluated, and the performance of the three different test assemblies, as listed
in Table 4.1, were studied.
One draw-wire displacement transducer and six Linear Variable Differential Transducers
(LVDTs) were attached to each test assembly to monitor the vertical deflections at the beam
mid span and near the supports, as well as to detect the relative slip between the flange and
web panels. A schematic of a general test setup with transducers layout is shown in Figure 4.2.
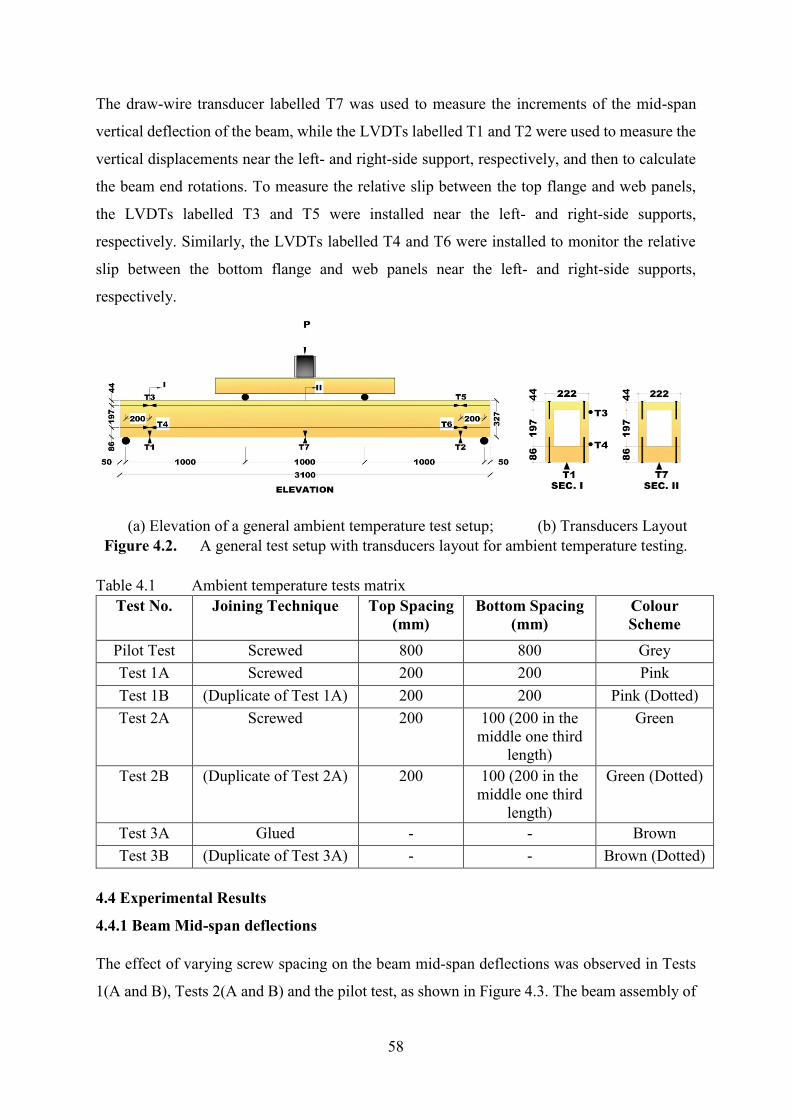
58
The draw-wire transducer labelled T7 was used to measure the increments of the mid-span
vertical deflection of the beam, while the LVDTs labelled T1 and T2 were used to measure the
vertical displacements near the left- and right-side support, respectively, and then to calculate
the beam end rotations. To measure the relative slip between the top flange and web panels,
the LVDTs labelled T3 and T5 were installed near the left- and right-side supports,
respectively. Similarly, the LVDTs labelled T4 and T6 were installed to monitor the relative
slip between the bottom flange and web panels near the left- and right-side supports,
respectively.
(a) Elevation of a general ambient temperature test setup; (b) Transducers Layout
Figure 4.2. A general test setup with transducers layout for ambient temperature testing.
Table 4.1 Ambient temperature tests matrix
Test No. Joining Technique Top Spacing
(mm)
Bottom Spacing
(mm)
Colour
Scheme
Pilot Test Screwed 800 800 Grey
Test 1A Screwed 200 200 Pink
Test 1B (Duplicate of Test 1A) 200 200 Pink (Dotted)
Test 2A Screwed 200 100 (200 in the
middle one third
length)
Green
Test 2B (Duplicate of Test 2A) 200 100 (200 in the
middle one third
length)
Green (Dotted)
Test 3A Glued - - Brown
Test 3B (Duplicate of Test 3A) - - Brown (Dotted)
4.4 Experimental Results
4.4.1 Beam Mid-span deflections
The effect of varying screw spacing on the beam mid-span deflections was observed in Tests
1(A and B), Tests 2(A and B) and the pilot test, as shown in Figure 4.3. The beam assembly of
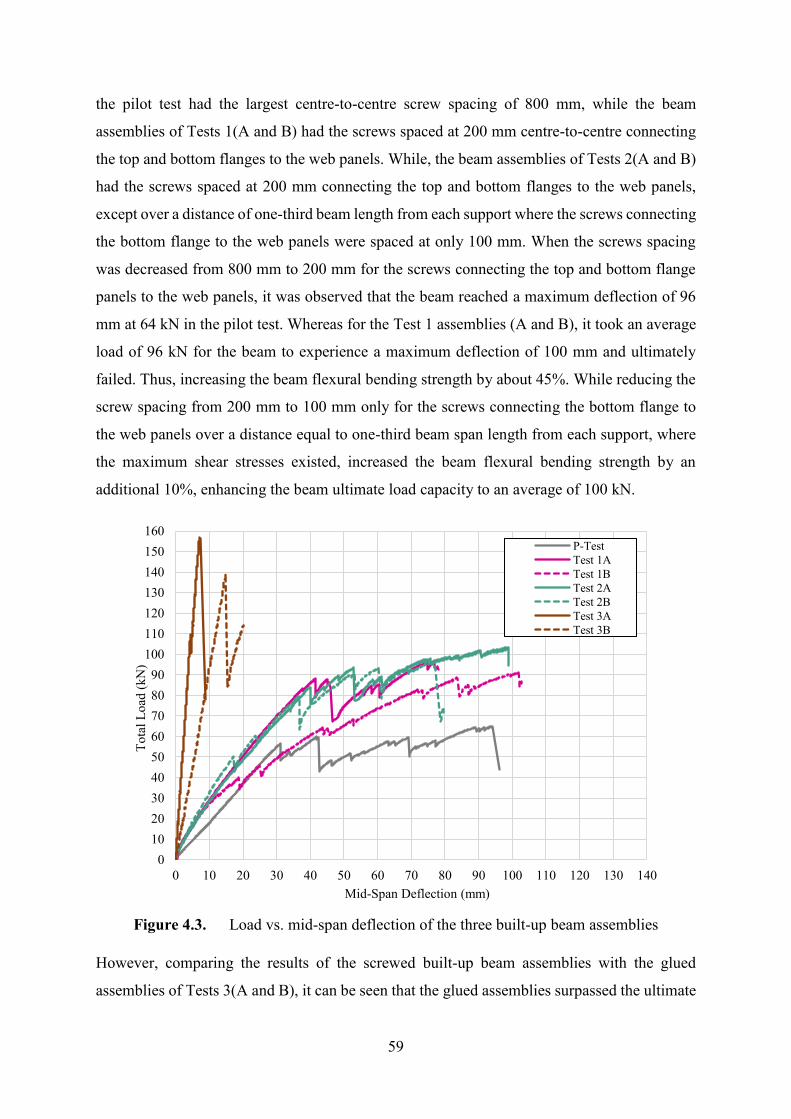
59
the pilot test had the largest centre-to-centre screw spacing of 800 mm, while the beam
assemblies of Tests 1(A and B) had the screws spaced at 200 mm centre-to-centre connecting
the top and bottom flanges to the web panels. While, the beam assemblies of Tests 2(A and B)
had the screws spaced at 200 mm connecting the top and bottom flanges to the web panels,
except over a distance of one-third beam length from each support where the screws connecting
the bottom flange to the web panels were spaced at only 100 mm. When the screws spacing
was decreased from 800 mm to 200 mm for the screws connecting the top and bottom flange
panels to the web panels, it was observed that the beam reached a maximum deflection of 96
mm at 64 kN in the pilot test. Whereas for the Test 1 assemblies (A and B), it took an average
load of 96 kN for the beam to experience a maximum deflection of 100 mm and ultimately
failed. Thus, increasing the beam flexural bending strength by about 45%. While reducing the
screw spacing from 200 mm to 100 mm only for the screws connecting the bottom flange to
the web panels over a distance equal to one-third beam span length from each support, where
the maximum shear stresses existed, increased the beam flexural bending strength by an
additional 10%, enhancing the beam ultimate load capacity to an average of 100 kN.
Figure 4.3. Load vs. mid-span deflection of the three built-up beam assemblies
However, comparing the results of the screwed built-up beam assemblies with the glued
assemblies of Tests 3(A and B), it can be seen that the glued assemblies surpassed the ultimate
0
10
20
30
40
50
60
70
80
90
100
110
120
130
140
150
160
0 10 20 30 40 50 60 70 80 90 100 110 120 130 140
To
tal
Lo
ad (
kN
)
Mid-Span Deflection (mm)
P-Test
Test 1A
Test 1B
Test 2A
Test 2B
Test 3A
Test 3B
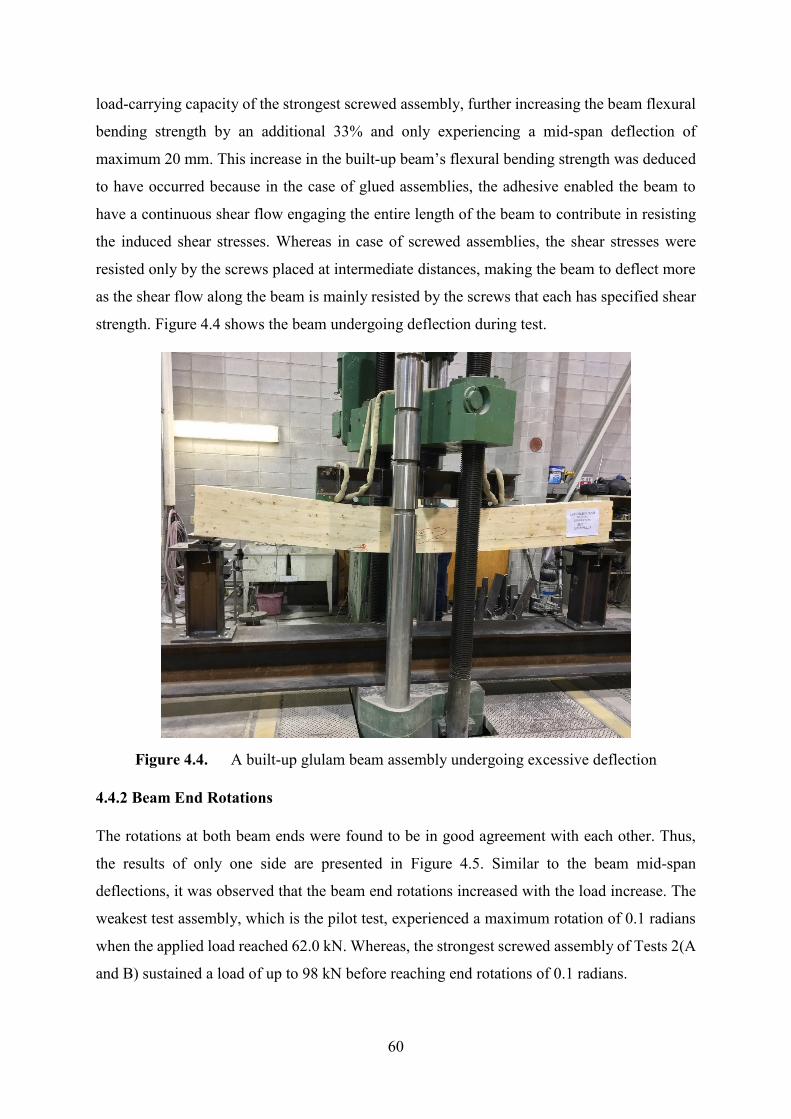
60
load-carrying capacity of the strongest screwed assembly, further increasing the beam flexural
bending strength by an additional 33% and only experiencing a mid-span deflection of
maximum 20 mm. This increase in the built-up beam’s flexural bending strength was deduced
to have occurred because in the case of glued assemblies, the adhesive enabled the beam to
have a continuous shear flow engaging the entire length of the beam to contribute in resisting
the induced shear stresses. Whereas in case of screwed assemblies, the shear stresses were
resisted only by the screws placed at intermediate distances, making the beam to deflect more
as the shear flow along the beam is mainly resisted by the screws that each has specified shear
strength. Figure 4.4 shows the beam undergoing deflection during test.
Figure 4.4. A built-up glulam beam assembly undergoing excessive deflection
4.4.2 Beam End Rotations
The rotations at both beam ends were found to be in good agreement with each other. Thus,
the results of only one side are presented in Figure 4.5. Similar to the beam mid-span
deflections, it was observed that the beam end rotations increased with the load increase. The
weakest test assembly, which is the pilot test, experienced a maximum rotation of 0.1 radians
when the applied load reached 62.0 kN. Whereas, the strongest screwed assembly of Tests 2(A
and B) sustained a load of up to 98 kN before reaching end rotations of 0.1 radians.
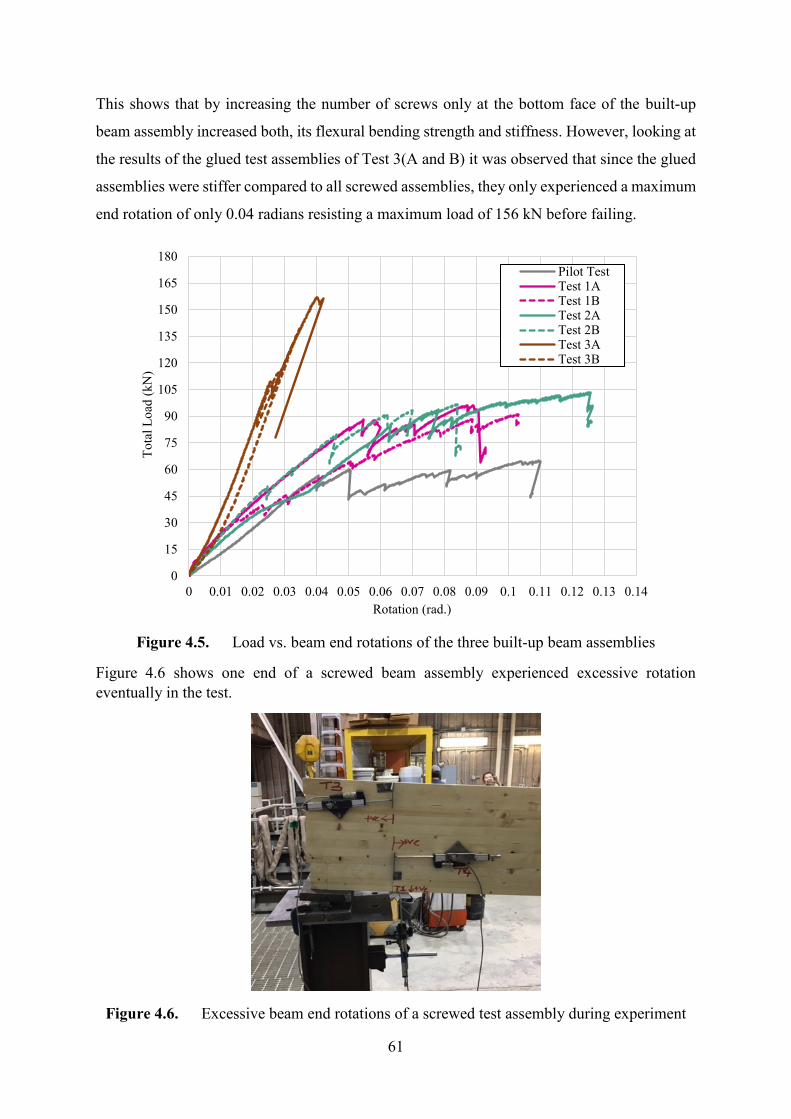
61
This shows that by increasing the number of screws only at the bottom face of the built-up
beam assembly increased both, its flexural bending strength and stiffness. However, looking at
the results of the glued test assemblies of Test 3(A and B) it was observed that since the glued
assemblies were stiffer compared to all screwed assemblies, they only experienced a maximum
end rotation of only 0.04 radians resisting a maximum load of 156 kN before failing.
Figure 4.5. Load vs. beam end rotations of the three built-up beam assemblies
Figure 4.6 shows one end of a screwed beam assembly experienced excessive rotation
eventually in the test.
Figure 4.6. Excessive beam end rotations of a screwed test assembly during experiment
0
15
30
45
60
75
90
105
120
135
150
165
180
0 0.01 0.02 0.03 0.04 0.05 0.06 0.07 0.08 0.09 0.1 0.11 0.12 0.13 0.14
To
tal
Lo
ad (
kN
)
Rotation (rad.)
Pilot TestTest 1ATest 1BTest 2ATest 2BTest 3ATest 3B
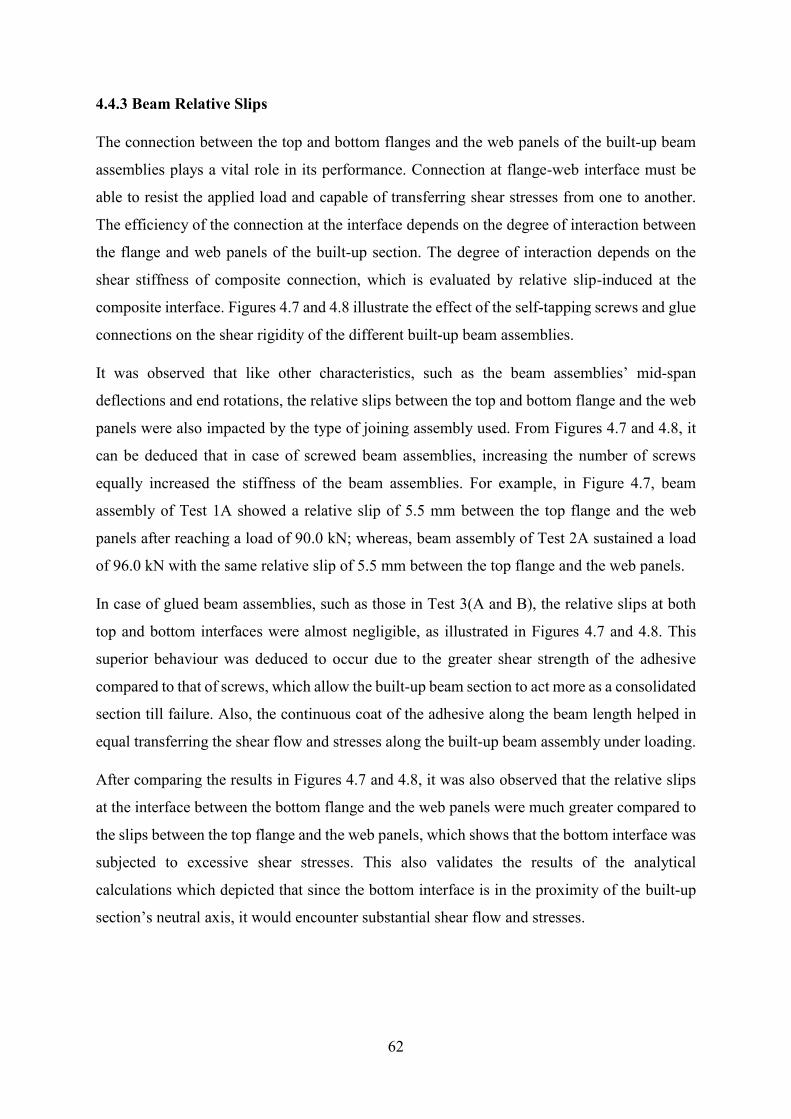
62
4.4.3 Beam Relative Slips
The connection between the top and bottom flanges and the web panels of the built-up beam
assemblies plays a vital role in its performance. Connection at flange-web interface must be
able to resist the applied load and capable of transferring shear stresses from one to another.
The efficiency of the connection at the interface depends on the degree of interaction between
the flange and web panels of the built-up section. The degree of interaction depends on the
shear stiffness of composite connection, which is evaluated by relative slip-induced at the
composite interface. Figures 4.7 and 4.8 illustrate the effect of the self-tapping screws and glue
connections on the shear rigidity of the different built-up beam assemblies.
It was observed that like other characteristics, such as the beam assemblies’ mid-span
deflections and end rotations, the relative slips between the top and bottom flange and the web
panels were also impacted by the type of joining assembly used. From Figures 4.7 and 4.8, it
can be deduced that in case of screwed beam assemblies, increasing the number of screws
equally increased the stiffness of the beam assemblies. For example, in Figure 4.7, beam
assembly of Test 1A showed a relative slip of 5.5 mm between the top flange and the web
panels after reaching a load of 90.0 kN; whereas, beam assembly of Test 2A sustained a load
of 96.0 kN with the same relative slip of 5.5 mm between the top flange and the web panels.
In case of glued beam assemblies, such as those in Test 3(A and B), the relative slips at both
top and bottom interfaces were almost negligible, as illustrated in Figures 4.7 and 4.8. This
superior behaviour was deduced to occur due to the greater shear strength of the adhesive
compared to that of screws, which allow the built-up beam section to act more as a consolidated
section till failure. Also, the continuous coat of the adhesive along the beam length helped in
equal transferring the shear flow and stresses along the built-up beam assembly under loading.
After comparing the results in Figures 4.7 and 4.8, it was also observed that the relative slips
at the interface between the bottom flange and the web panels were much greater compared to
the slips between the top flange and the web panels, which shows that the bottom interface was
subjected to excessive shear stresses. This also validates the results of the analytical
calculations which depicted that since the bottom interface is in the proximity of the built-up
section’s neutral axis, it would encounter substantial shear flow and stresses.
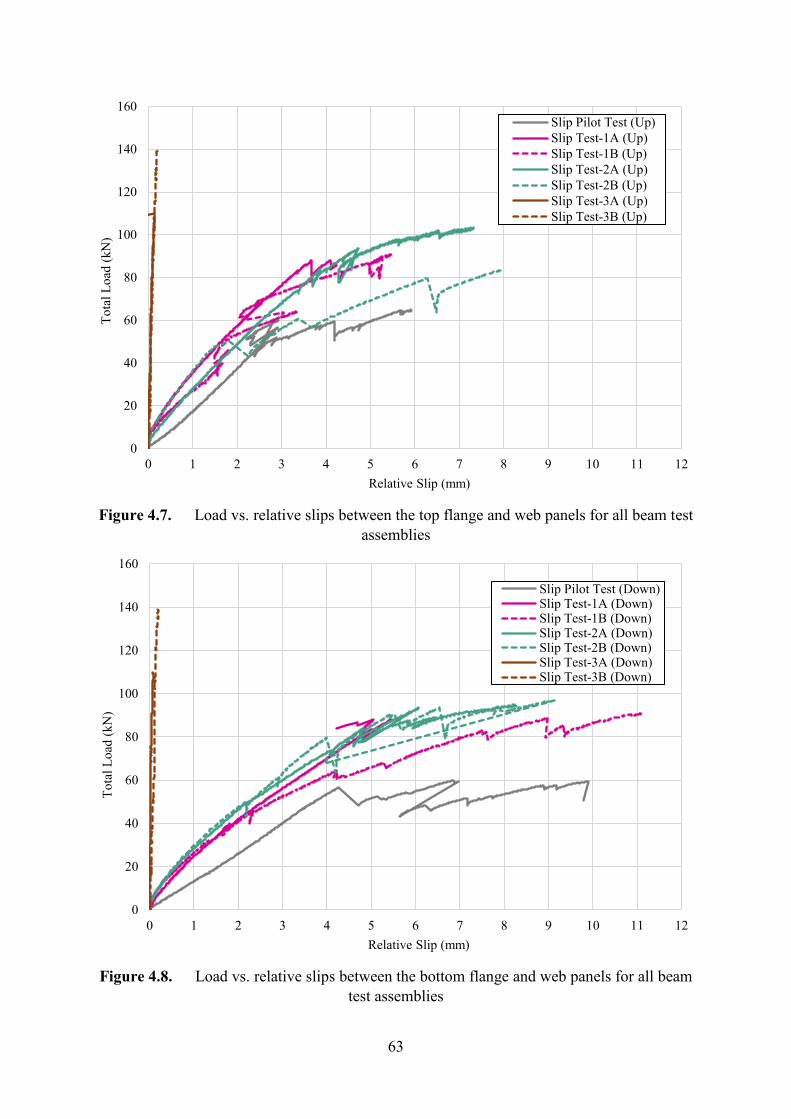
63
Figure 4.7. Load vs. relative slips between the top flange and web panels for all beam test
assemblies
Figure 4.8. Load vs. relative slips between the bottom flange and web panels for all beam
test assemblies
0
20
40
60
80
100
120
140
160
0 1 2 3 4 5 6 7 8 9 10 11 12
To
tal
Lo
ad (
kN
)
Relative Slip (mm)
Slip Pilot Test (Up)
Slip Test-1A (Up)
Slip Test-1B (Up)
Slip Test-2A (Up)
Slip Test-2B (Up)
Slip Test-3A (Up)
Slip Test-3B (Up)
0
20
40
60
80
100
120
140
160
0 1 2 3 4 5 6 7 8 9 10 11 12
To
tal
Lo
ad (
kN
)
Relative Slip (mm)
Slip Pilot Test (Down)Slip Test-1A (Down)Slip Test-1B (Down)Slip Test-2A (Down)Slip Test-2B (Down)Slip Test-3A (Down)Slip Test-3B (Down)
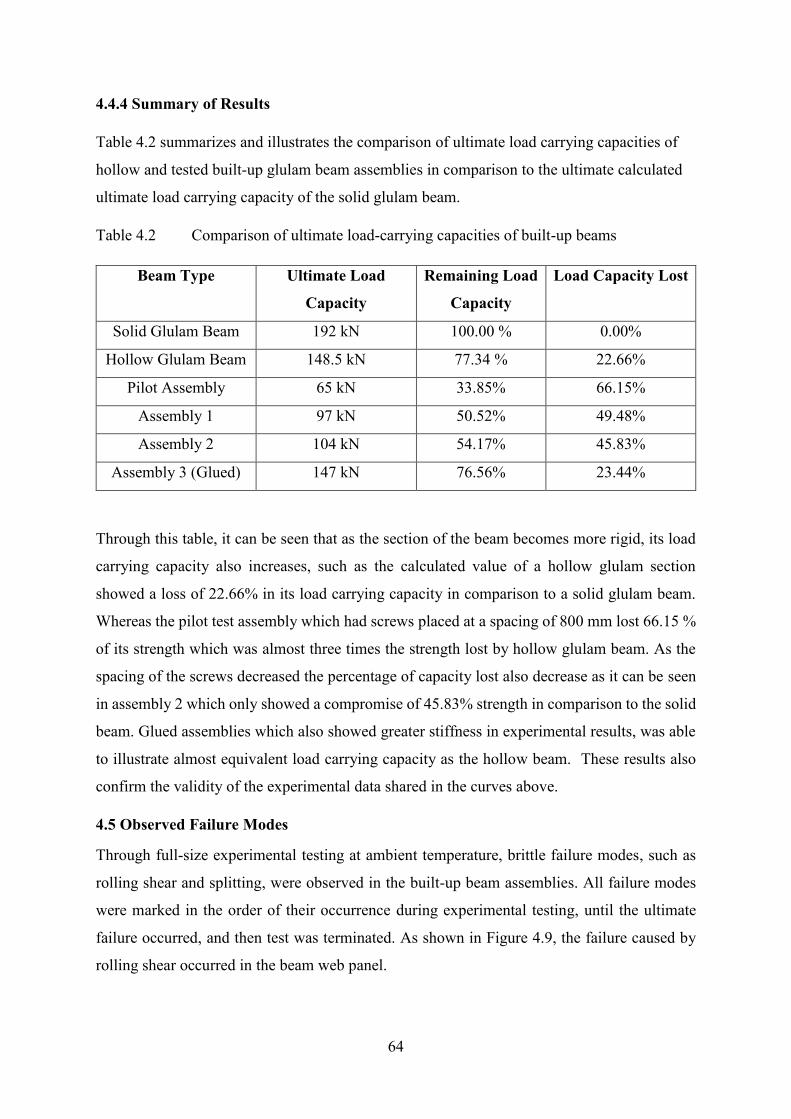
64
4.4.4 Summary of Results
Table 4.2 summarizes and illustrates the comparison of ultimate load carrying capacities of
hollow and tested built-up glulam beam assemblies in comparison to the ultimate calculated
ultimate load carrying capacity of the solid glulam beam.
Table 4.2 Comparison of ultimate load-carrying capacities of built-up beams
Beam Type Ultimate Load
Capacity
Remaining Load
Capacity
Load Capacity Lost
Solid Glulam Beam 192 kN 100.00 % 0.00%
Hollow Glulam Beam 148.5 kN 77.34 % 22.66%
Pilot Assembly 65 kN 33.85% 66.15%
Assembly 1 97 kN 50.52% 49.48%
Assembly 2 104 kN 54.17% 45.83%
Assembly 3 (Glued) 147 kN 76.56% 23.44%
Through this table, it can be seen that as the section of the beam becomes more rigid, its load
carrying capacity also increases, such as the calculated value of a hollow glulam section
showed a loss of 22.66% in its load carrying capacity in comparison to a solid glulam beam.
Whereas the pilot test assembly which had screws placed at a spacing of 800 mm lost 66.15 %
of its strength which was almost three times the strength lost by hollow glulam beam. As the
spacing of the screws decreased the percentage of capacity lost also decrease as it can be seen
in assembly 2 which only showed a compromise of 45.83% strength in comparison to the solid
beam. Glued assemblies which also showed greater stiffness in experimental results, was able
to illustrate almost equivalent load carrying capacity as the hollow beam. These results also
confirm the validity of the experimental data shared in the curves above.
4.5 Observed Failure Modes
Through full-size experimental testing at ambient temperature, brittle failure modes, such as
rolling shear and splitting, were observed in the built-up beam assemblies. All failure modes
were marked in the order of their occurrence during experimental testing, until the ultimate
failure occurred, and then test was terminated. As shown in Figure 4.9, the failure caused by
rolling shear occurred in the beam web panel.
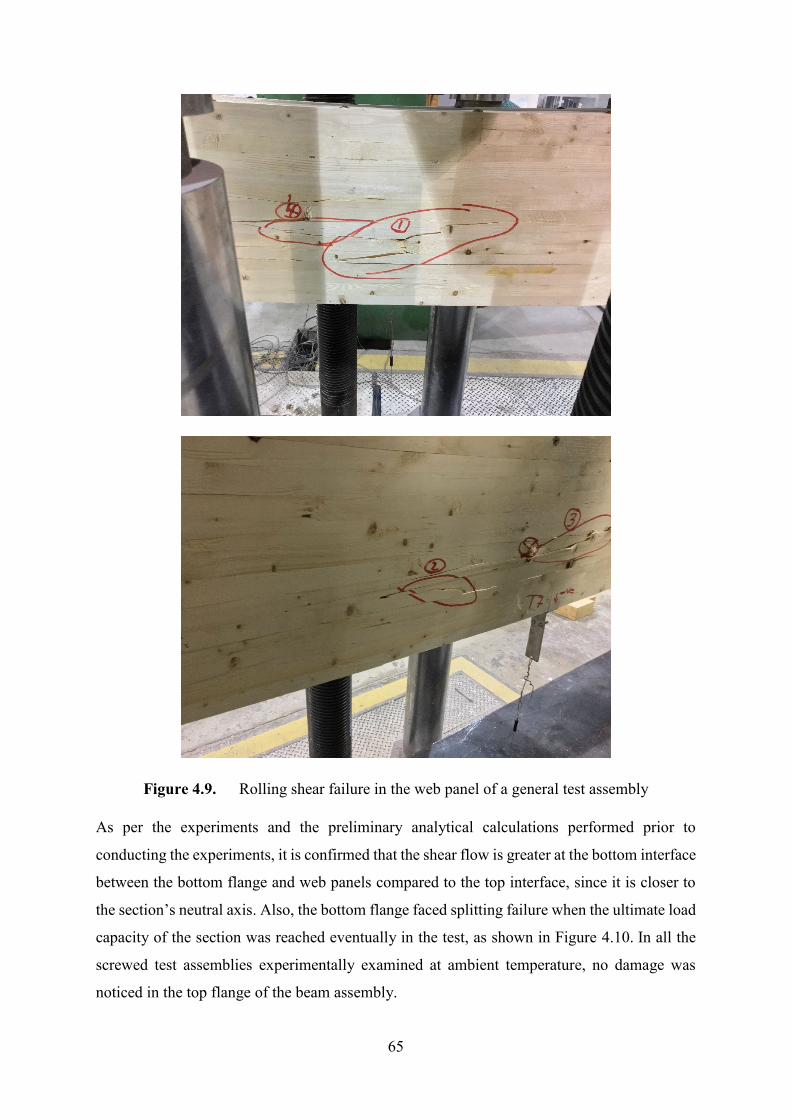
65
Figure 4.9. Rolling shear failure in the web panel of a general test assembly
As per the experiments and the preliminary analytical calculations performed prior to
conducting the experiments, it is confirmed that the shear flow is greater at the bottom interface
between the bottom flange and web panels compared to the top interface, since it is closer to
the section’s neutral axis. Also, the bottom flange faced splitting failure when the ultimate load
capacity of the section was reached eventually in the test, as shown in Figure 4.10. In all the
screwed test assemblies experimentally examined at ambient temperature, no damage was
noticed in the top flange of the beam assembly.
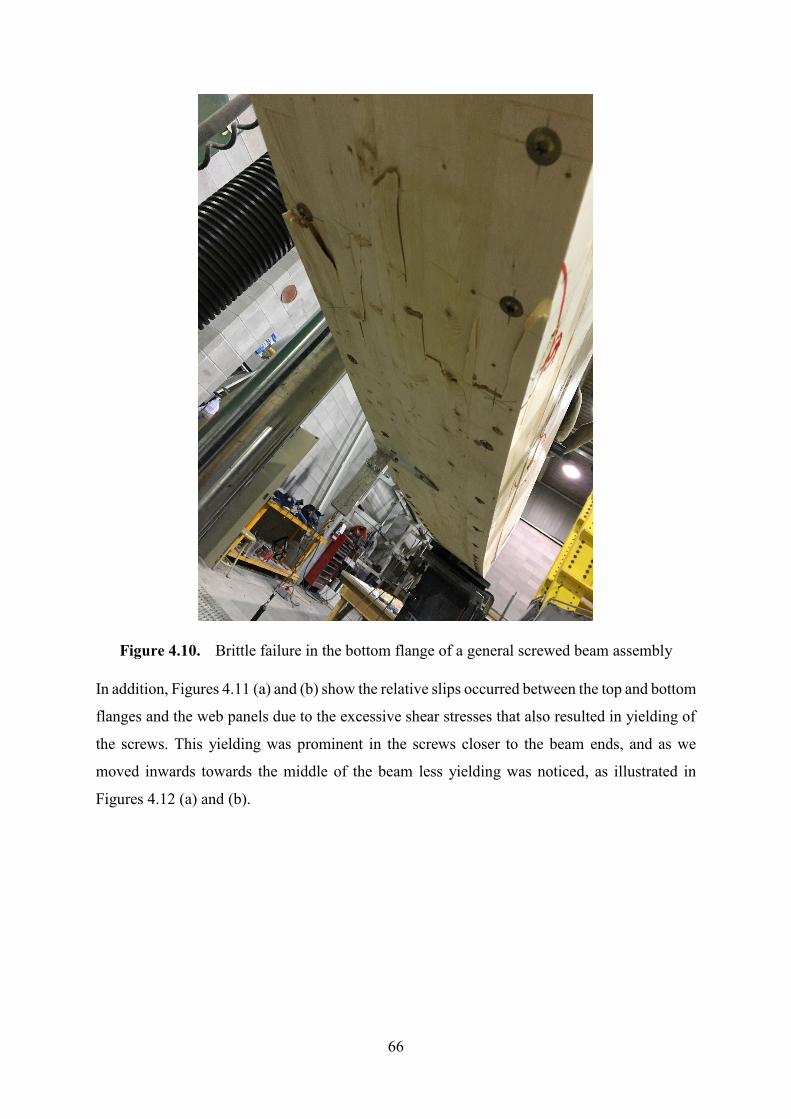
66
Figure 4.10. Brittle failure in the bottom flange of a general screwed beam assembly
In addition, Figures 4.11 (a) and (b) show the relative slips occurred between the top and bottom
flanges and the web panels due to the excessive shear stresses that also resulted in yielding of
the screws. This yielding was prominent in the screws closer to the beam ends, and as we
moved inwards towards the middle of the beam less yielding was noticed, as illustrated in
Figures 4.12 (a) and (b).
67
(a) Front view of the relative slips between the flanges and the web panels
(b) Side view of the relative slips between the flanges and the web panels
Figure 4.11. Illustration of relative slips in a general screwed beam test assembly
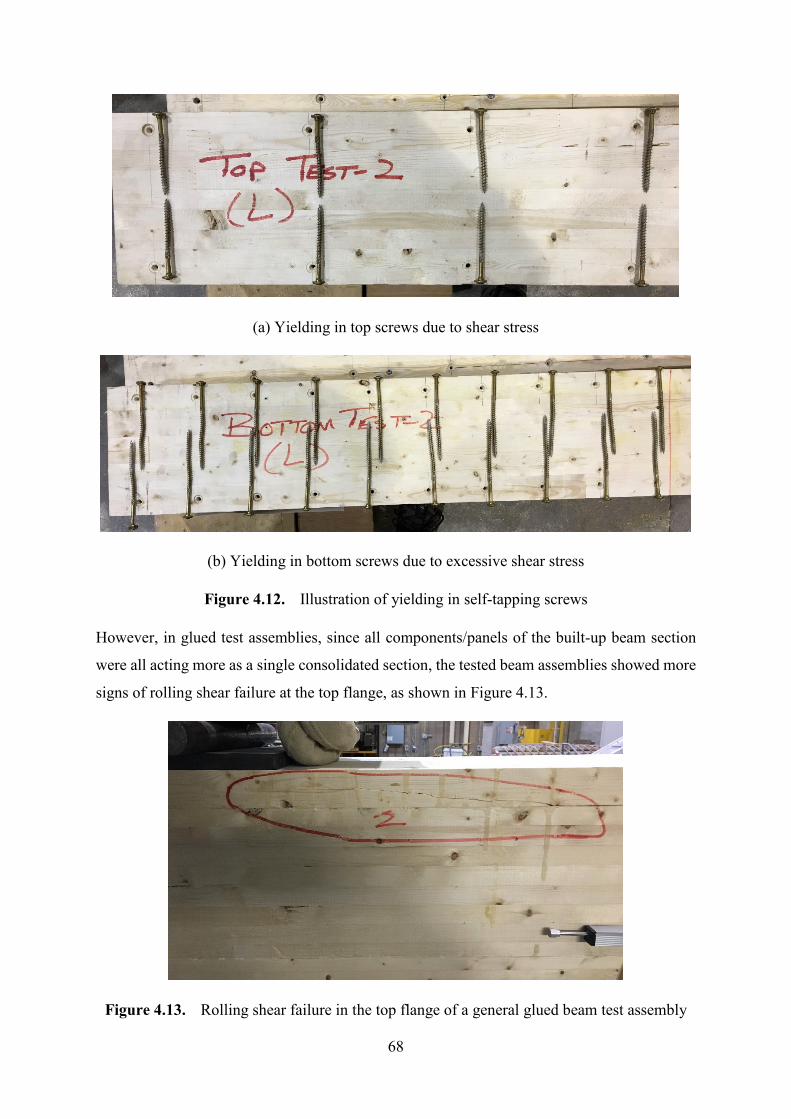
68
(a) Yielding in top screws due to shear stress
(b) Yielding in bottom screws due to excessive shear stress
Figure 4.12. Illustration of yielding in self-tapping screws
However, in glued test assemblies, since all components/panels of the built-up beam section
were all acting more as a single consolidated section, the tested beam assemblies showed more
signs of rolling shear failure at the top flange, as shown in Figure 4.13.
Figure 4.13. Rolling shear failure in the top flange of a general glued beam test assembly
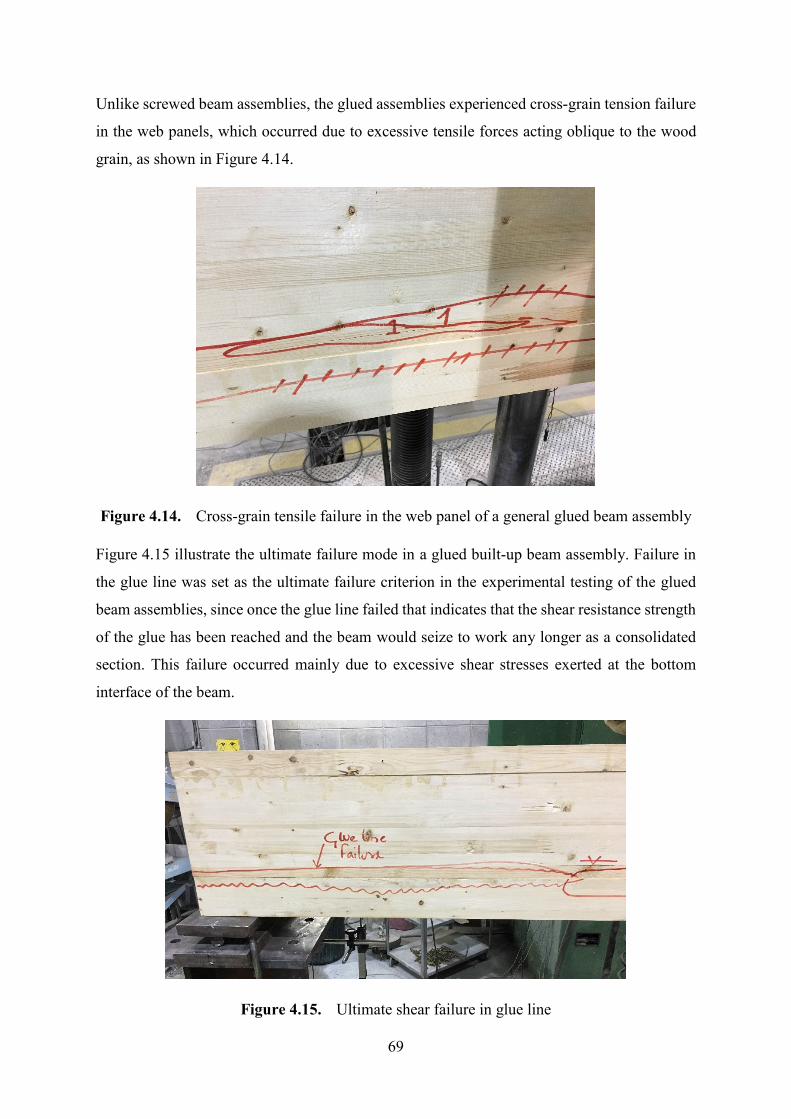
69
Unlike screwed beam assemblies, the glued assemblies experienced cross-grain tension failure
in the web panels, which occurred due to excessive tensile forces acting oblique to the wood
grain, as shown in Figure 4.14.
Figure 4.14. Cross-grain tensile failure in the web panel of a general glued beam assembly
Figure 4.15 illustrate the ultimate failure mode in a glued built-up beam assembly. Failure in
the glue line was set as the ultimate failure criterion in the experimental testing of the glued
beam assemblies, since once the glue line failed that indicates that the shear resistance strength
of the glue has been reached and the beam would seize to work any longer as a consolidated
section. This failure occurred mainly due to excessive shear stresses exerted at the bottom
interface of the beam.
Figure 4.15. Ultimate shear failure in glue line
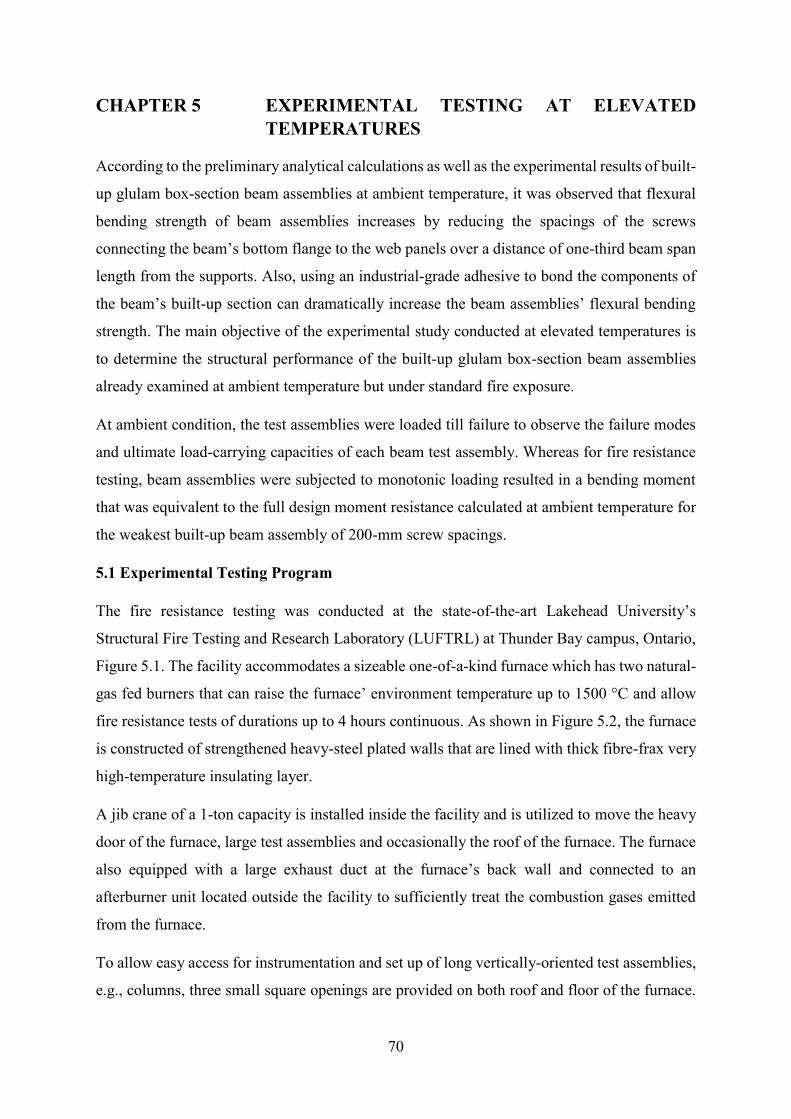
70
CHAPTER 5 EXPERIMENTAL TESTING AT ELEVATED
TEMPERATURES
According to the preliminary analytical calculations as well as the experimental results of built-
up glulam box-section beam assemblies at ambient temperature, it was observed that flexural
bending strength of beam assemblies increases by reducing the spacings of the screws
connecting the beam’s bottom flange to the web panels over a distance of one-third beam span
length from the supports. Also, using an industrial-grade adhesive to bond the components of
the beam’s built-up section can dramatically increase the beam assemblies’ flexural bending
strength. The main objective of the experimental study conducted at elevated temperatures is
to determine the structural performance of the built-up glulam box-section beam assemblies
already examined at ambient temperature but under standard fire exposure.
At ambient condition, the test assemblies were loaded till failure to observe the failure modes
and ultimate load-carrying capacities of each beam test assembly. Whereas for fire resistance
testing, beam assemblies were subjected to monotonic loading resulted in a bending moment
that was equivalent to the full design moment resistance calculated at ambient temperature for
the weakest built-up beam assembly of 200-mm screw spacings.
5.1 Experimental Testing Program
The fire resistance testing was conducted at the state-of-the-art Lakehead University’s
Structural Fire Testing and Research Laboratory (LUFTRL) at Thunder Bay campus, Ontario,
Figure 5.1. The facility accommodates a sizeable one-of-a-kind furnace which has two natural-
gas fed burners that can raise the furnace’ environment temperature up to 1500 °C and allow
fire resistance tests of durations up to 4 hours continuous. As shown in Figure 5.2, the furnace
is constructed of strengthened heavy-steel plated walls that are lined with thick fibre-frax very
high-temperature insulating layer.
A jib crane of a 1-ton capacity is installed inside the facility and is utilized to move the heavy
door of the furnace, large test assemblies and occasionally the roof of the furnace. The furnace
also equipped with a large exhaust duct at the furnace’s back wall and connected to an
afterburner unit located outside the facility to sufficiently treat the combustion gases emitted
from the furnace.
To allow easy access for instrumentation and set up of long vertically-oriented test assemblies,
e.g., columns, three small square openings are provided on both roof and floor of the furnace.
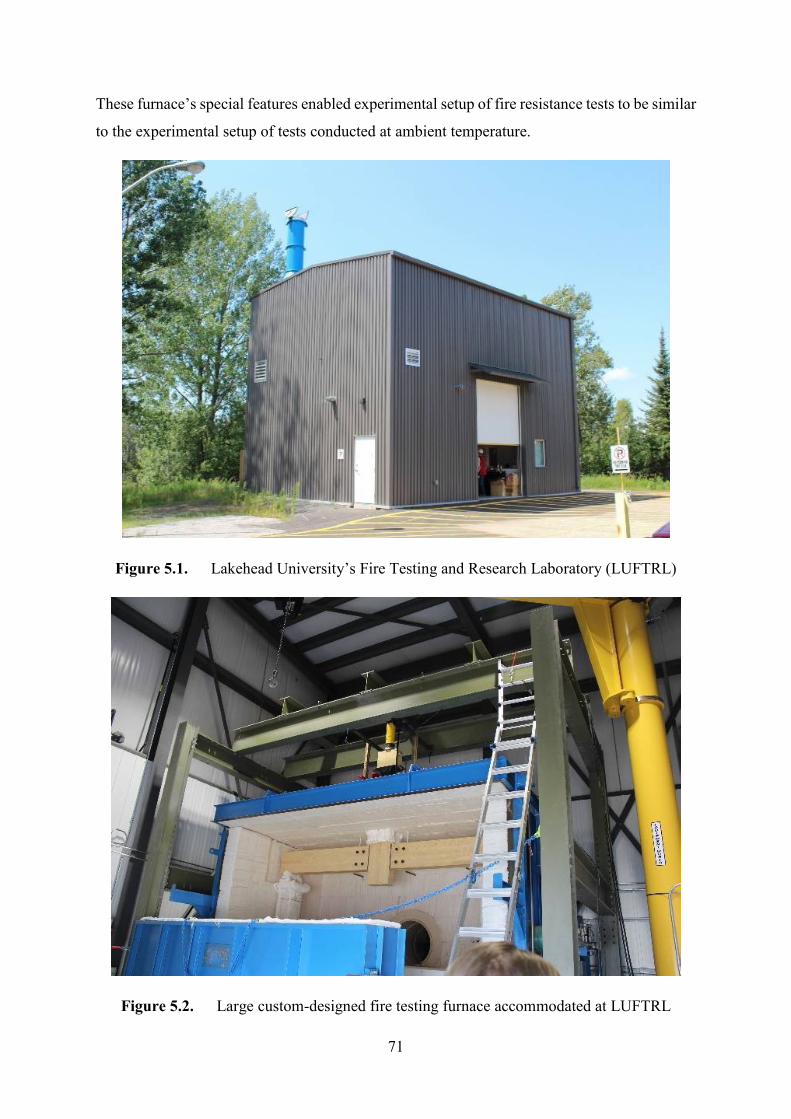
71
These furnace’s special features enabled experimental setup of fire resistance tests to be similar
to the experimental setup of tests conducted at ambient temperature.
Figure 5.1. Lakehead University’s Fire Testing and Research Laboratory (LUFTRL)
Figure 5.2. Large custom-designed fire testing furnace accommodated at LUFTRL
72
5.2 Data Acquisition
In fire resistance testing, each beam assembly was subjected to monotonic loading that is
equivalent to the full design load of the weakest screwed built-up beam assembly of 200-mm
screw spacing, which after analytical calculations and experimental outcomes of ambient
temperature tests was concluded to be Assembly no. 1. Unlike ambient temperature testing, the
beam assemblies exposed to standard fire were tested till their mid-span deflections reached a
maximum value of span/20, i.e. 150 mm in this case, which was set as the failure criterion for
all beam assemblies tested in fire condition. Thus, it was very crucial that both loading and
corresponding deflection data be collected over the time throughout the fire resistance
experiments. Also, as the applied transverse load was kept constant, the built-up beam
assemblies would encounter large deflections due to the degradation of their mechanical
properties due to fire exposure and resulting in decrease of the beam assemblies’ flexural
bending strengths. Therefore, to measure the vertical displacements, ceramic rods were
employed by being connected to displacement transducers placed outside the furnace. Because
of the low thermal elongation of the ceramic rods they stayed intact even when the temperature
inside the furnace reached up to 1000°C. In addition to the mechanical measurements, thermal
measurements were captured using high-temperature insulated K-Type thermocouples that
were logged to a computer using a capable Data Acquisition System.
To stimulate a standard fire condition inside the furnace, the temperature of the furnace
compartment was fully controlled by a built-in computer system. Three metal-shielded
thermocouples installed on the furnace’s back wall were utilized to provide the furnace built-
in computer system with the furnace’s average temperatures throughout the fire resistance
testing, which in turn controls the gas flow to the furnace’s burners and regulate the furnace
compartment temperature to follow the desired pre-programmed standard fire curve. Figure 5.3
shows the Human-Machine Interface (HMI) of the furnace.
73
Figure 5.3. Human-machine Interface (HMI) of LUFTRF furnace’s control panel
5.3 Experimental Test Setup and Procedure
Similar to ambient temperature test setup, all beams were simply supported over two supports,
3000 mm apart, to experimentally examined the built-up beam assemblies subjected to
monotonic loading and exposed to standard fire. The entire beam assembly including the two
steel supports were placed inside the large-size fire testing furnace, Figures 5.4 (a) and 5.5. The
supports were restrained to a sturdy steel beam located underneath the furnace, which is also
part of the loading steel frame that is also supporting the furnace above the floor. To stimulate
three face fire exposure on the built-up beam cross section, the beam assembly’s top flange
was fire insulated using 25.4 mm (1 inch) ceramic fiber blanket, assuming the top side of the
beam assembly would be covered with a slab in a real-life application.
In addition, the beam ends were also insulated to simulate the existence of two columns
blocking the beam ends and prevent the direct passage of heat inside the beam’s hollow section.
A capable hydraulic jack installed and attached to the loading steel frame above the furnace
was utilized to apply the transverse load on a steel load distributing beam which in turn divided
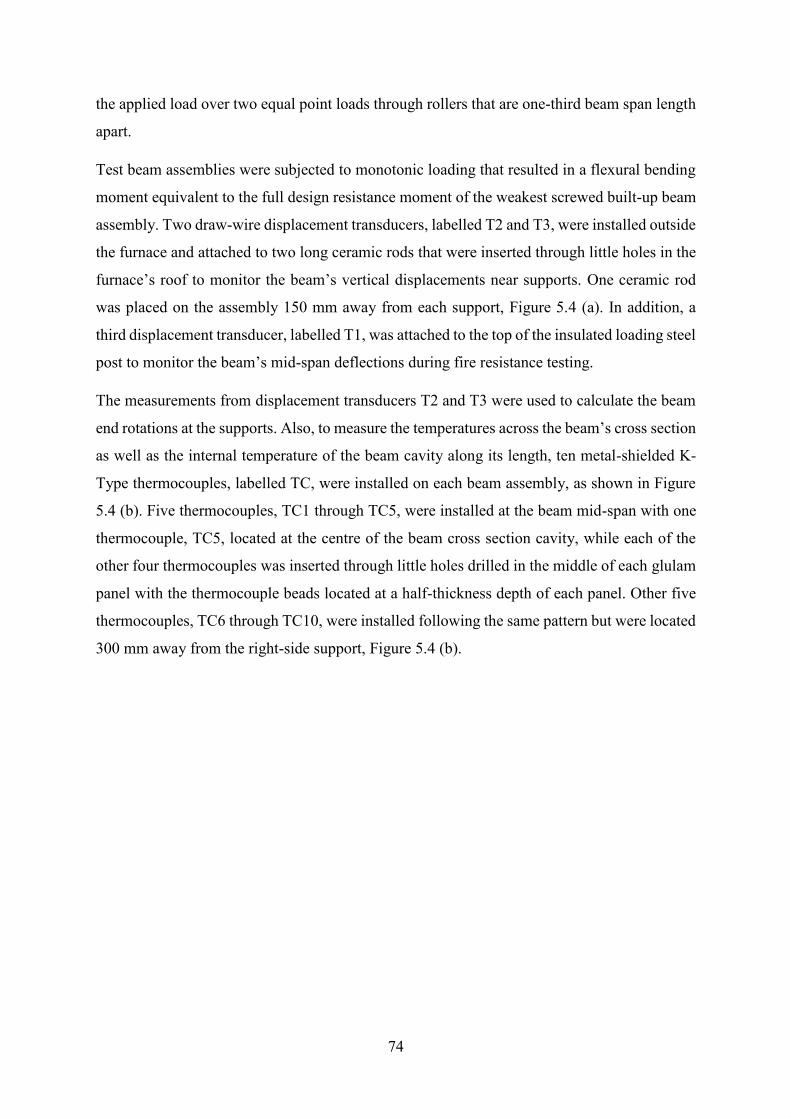
74
the applied load over two equal point loads through rollers that are one-third beam span length
apart.
Test beam assemblies were subjected to monotonic loading that resulted in a flexural bending
moment equivalent to the full design resistance moment of the weakest screwed built-up beam
assembly. Two draw-wire displacement transducers, labelled T2 and T3, were installed outside
the furnace and attached to two long ceramic rods that were inserted through little holes in the
furnace’s roof to monitor the beam’s vertical displacements near supports. One ceramic rod
was placed on the assembly 150 mm away from each support, Figure 5.4 (a). In addition, a
third displacement transducer, labelled T1, was attached to the top of the insulated loading steel
post to monitor the beam’s mid-span deflections during fire resistance testing.
The measurements from displacement transducers T2 and T3 were used to calculate the beam
end rotations at the supports. Also, to measure the temperatures across the beam’s cross section
as well as the internal temperature of the beam cavity along its length, ten metal-shielded K-
Type thermocouples, labelled TC, were installed on each beam assembly, as shown in Figure
5.4 (b). Five thermocouples, TC1 through TC5, were installed at the beam mid-span with one
thermocouple, TC5, located at the centre of the beam cross section cavity, while each of the
other four thermocouples was inserted through little holes drilled in the middle of each glulam
panel with the thermocouple beads located at a half-thickness depth of each panel. Other five
thermocouples, TC6 through TC10, were installed following the same pattern but were located
300 mm away from the right-side support, Figure 5.4 (b).
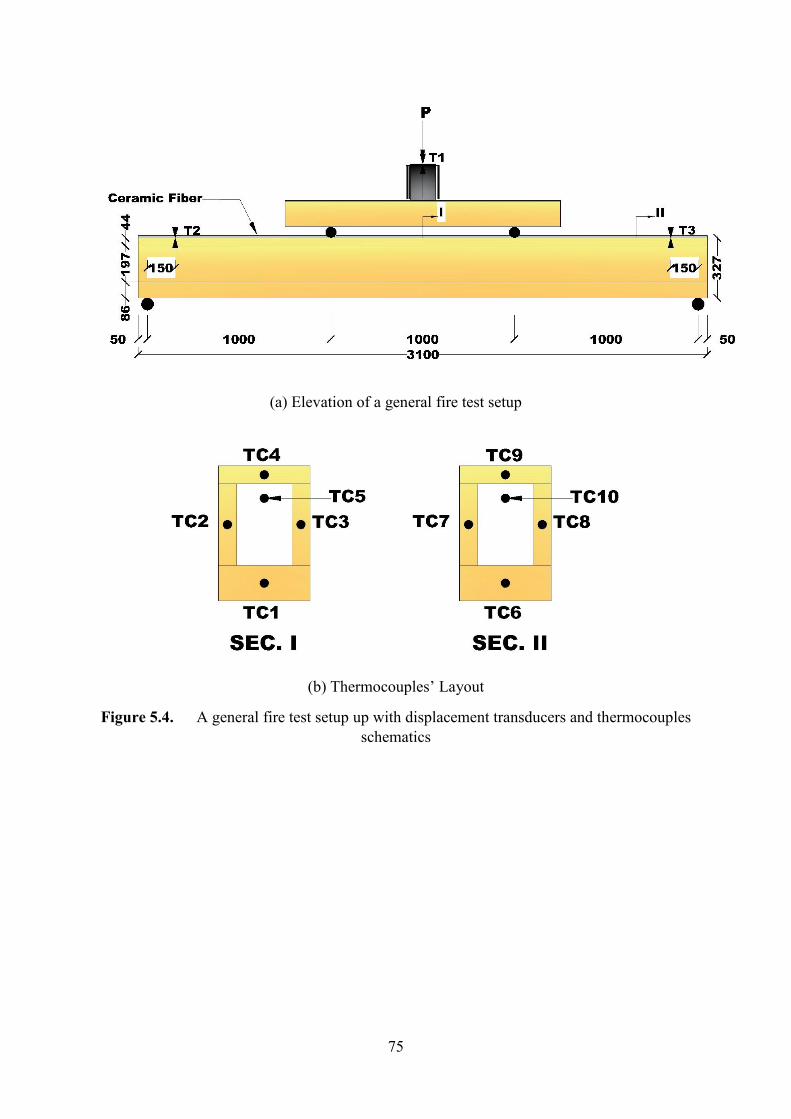
75
(a) Elevation of a general fire test setup
(b) Thermocouples’ Layout
Figure 5.4. A general fire test setup up with displacement transducers and thermocouples
schematics

76
Figure 5.5. A general test setup inside the fire testing furnace
Table 5.1 contains the matrix adopted for fire resistance testing. Two specimens each of the
strongest screwed beam Assembly no. 2 and glued beam assembly were tested in the fire to
compare the behaviour and performance of built-up beams based on the joining technique
used. As illustrated in Table 5.1, the specimens were also characterized with a colour scheme
to maintain the consistency in the presentation of the experimental results.
Table 5.1 Fire resistance tests matrix
Test No. Joining Technique Top
Spacing
(mm)
Bottom Spacing
(mm)
Colour
Scheme
Test 2F(A) Screwed 200 100 (200 in the middle
one third beam length)
Red
Test 2F(B) (Duplicate of Test 2F-
A)
200 100 (200 in the middle
one third beam length)
Red (Dotted)
Test 3F(A) Glued - - Blue
Test 3F(B) (Duplicate of Test 3F-
A)
- - Blue (Dotted)
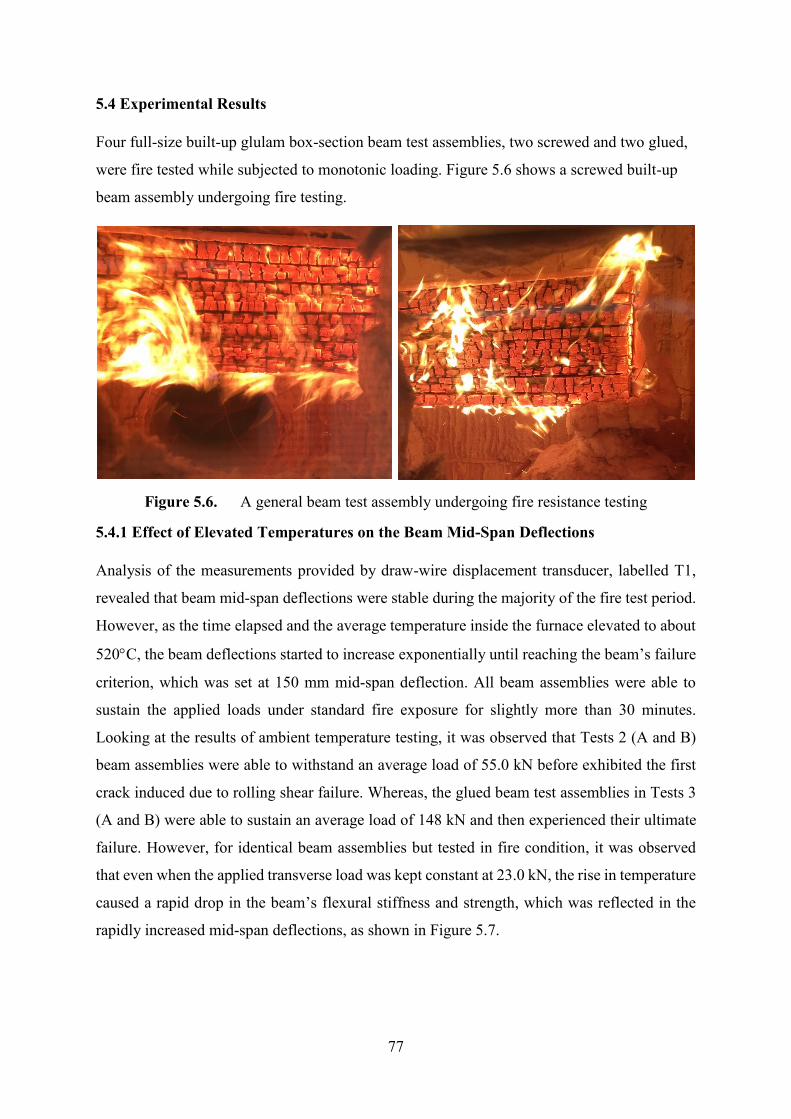
77
5.4 Experimental Results
Four full-size built-up glulam box-section beam test assemblies, two screwed and two glued,
were fire tested while subjected to monotonic loading. Figure 5.6 shows a screwed built-up
beam assembly undergoing fire testing.
Figure 5.6. A general beam test assembly undergoing fire resistance testing
5.4.1 Effect of Elevated Temperatures on the Beam Mid-Span Deflections
Analysis of the measurements provided by draw-wire displacement transducer, labelled T1,
revealed that beam mid-span deflections were stable during the majority of the fire test period.
However, as the time elapsed and the average temperature inside the furnace elevated to about
520C, the beam deflections started to increase exponentially until reaching the beam’s failure
criterion, which was set at 150 mm mid-span deflection. All beam assemblies were able to
sustain the applied loads under standard fire exposure for slightly more than 30 minutes.
Looking at the results of ambient temperature testing, it was observed that Tests 2 (A and B)
beam assemblies were able to withstand an average load of 55.0 kN before exhibited the first
crack induced due to rolling shear failure. Whereas, the glued beam test assemblies in Tests 3
(A and B) were able to sustain an average load of 148 kN and then experienced their ultimate
failure. However, for identical beam assemblies but tested in fire condition, it was observed
that even when the applied transverse load was kept constant at 23.0 kN, the rise in temperature
caused a rapid drop in the beam’s flexural stiffness and strength, which was reflected in the
rapidly increased mid-span deflections, as shown in Figure 5.7.
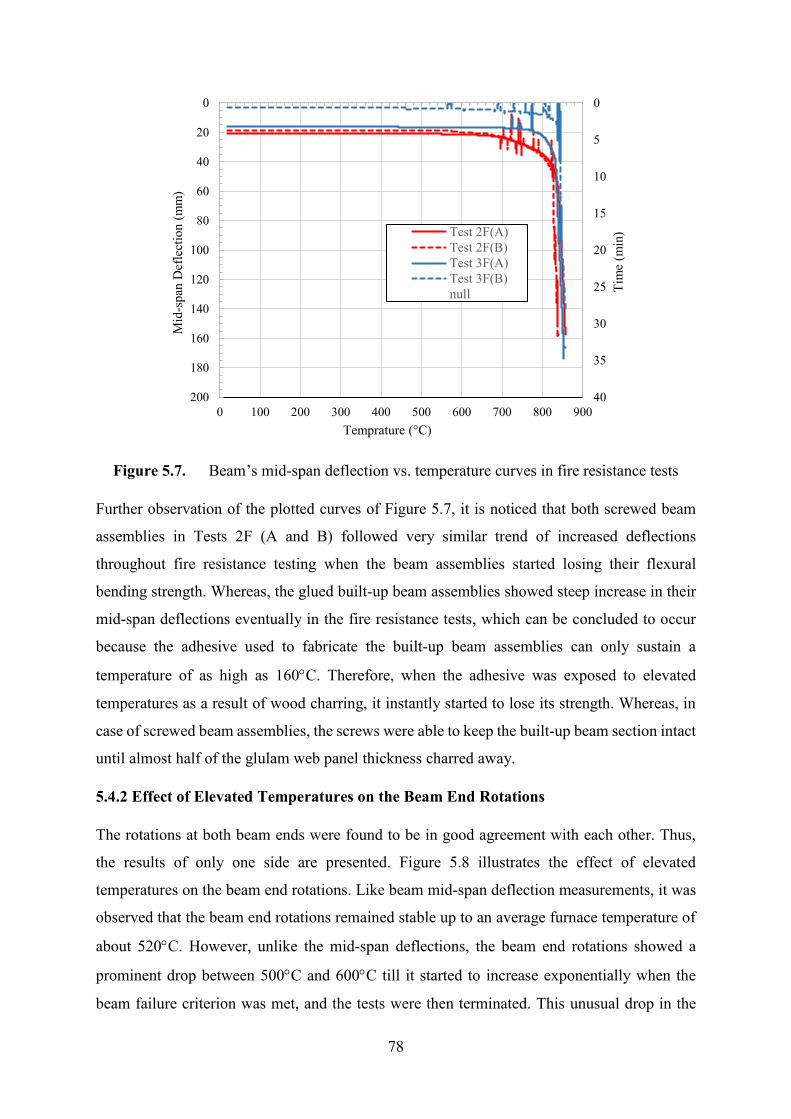
78
Figure 5.7. Beam’s mid-span deflection vs. temperature curves in fire resistance tests
Further observation of the plotted curves of Figure 5.7, it is noticed that both screwed beam
assemblies in Tests 2F (A and B) followed very similar trend of increased deflections
throughout fire resistance testing when the beam assemblies started losing their flexural
bending strength. Whereas, the glued built-up beam assemblies showed steep increase in their
mid-span deflections eventually in the fire resistance tests, which can be concluded to occur
because the adhesive used to fabricate the built-up beam assemblies can only sustain a
temperature of as high as 160C. Therefore, when the adhesive was exposed to elevated
temperatures as a result of wood charring, it instantly started to lose its strength. Whereas, in
case of screwed beam assemblies, the screws were able to keep the built-up beam section intact
until almost half of the glulam web panel thickness charred away.
5.4.2 Effect of Elevated Temperatures on the Beam End Rotations
The rotations at both beam ends were found to be in good agreement with each other. Thus,
the results of only one side are presented. Figure 5.8 illustrates the effect of elevated
temperatures on the beam end rotations. Like beam mid-span deflection measurements, it was
observed that the beam end rotations remained stable up to an average furnace temperature of
about 520C. However, unlike the mid-span deflections, the beam end rotations showed a
prominent drop between 500C and 600C till it started to increase exponentially when the
beam failure criterion was met, and the tests were then terminated. This unusual drop in the
0
5
10
15
20
25
30
35
40
0
20
40
60
80
100
120
140
160
180
200
0 100 200 300 400 500 600 700 800 900
Tim
e (m
in)
Mid
-sp
an D
efle
ctio
n (
mm
)
Temprature (°C)
Test 2F(A)
Test 2F(B)
Test 3F(A)
Test 3F(B)
null
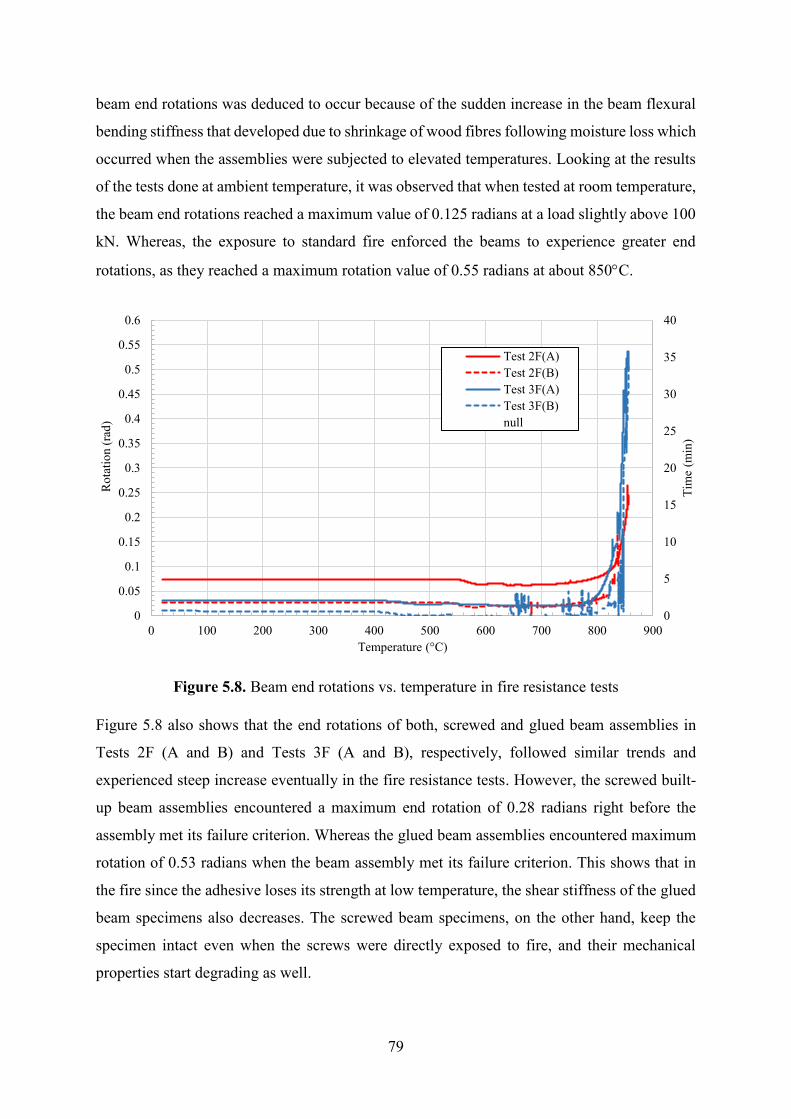
79
beam end rotations was deduced to occur because of the sudden increase in the beam flexural
bending stiffness that developed due to shrinkage of wood fibres following moisture loss which
occurred when the assemblies were subjected to elevated temperatures. Looking at the results
of the tests done at ambient temperature, it was observed that when tested at room temperature,
the beam end rotations reached a maximum value of 0.125 radians at a load slightly above 100
kN. Whereas, the exposure to standard fire enforced the beams to experience greater end
rotations, as they reached a maximum rotation value of 0.55 radians at about 850C.
Figure 5.8. Beam end rotations vs. temperature in fire resistance tests
Figure 5.8 also shows that the end rotations of both, screwed and glued beam assemblies in
Tests 2F (A and B) and Tests 3F (A and B), respectively, followed similar trends and
experienced steep increase eventually in the fire resistance tests. However, the screwed built-
up beam assemblies encountered a maximum end rotation of 0.28 radians right before the
assembly met its failure criterion. Whereas the glued beam assemblies encountered maximum
rotation of 0.53 radians when the beam assembly met its failure criterion. This shows that in
the fire since the adhesive loses its strength at low temperature, the shear stiffness of the glued
beam specimens also decreases. The screwed beam specimens, on the other hand, keep the
specimen intact even when the screws were directly exposed to fire, and their mechanical
properties start degrading as well.
0
5
10
15
20
25
30
35
40
0
0.05
0.1
0.15
0.2
0.25
0.3
0.35
0.4
0.45
0.5
0.55
0.6
0 100 200 300 400 500 600 700 800 900
Tim
e (m
in)
Ro
tati
on
(ra
d)
Temperature (°C)
Test 2F(A)
Test 2F(B)
Test 3F(A)
Test 3F(B)
null
80
5.4.3 Time-Temperature Curves
From Figures 5.9 and 5.10 that illustrate the time-temperature curves of both, the screwed built-
up beam assemblies in Tests 2F (A and B) and the glued built-up beam assemblies in Test 3F
(A and B), respectively, it was observed that the internal temperature of the web panels started
to increase within 3.0 to 4.0 minutes of the fire exposure. However, it took almost 8.0 minutes
for the temperature of the bottom flange to spike up due to its two-fold thickness. This shows
that as the mechanical properties of glulam start to deteriorate the internal temperatures of the
different panels of the beam section increased non-linearly, as shown in Figure 5.11 and 5.12.
However, since the top flange panel of the built-up beam assembly and its hollow ends were
covered with ceramic fibre blankets, the thermocouples embedded inside the beam’s top flange
(TC4 and TC9) and the beam’s hollow core (TC5 and TC10) experienced considerably low
temperatures, where their temperatures reached only up to a maximum of 135C in case of the
screwed beam assemblies and 205C in case of the glued beam assemblies by the end of the
fire test. However, the difference between the screwed and glued built-up beam assemblies’
internal temperatures is mostly due to the formation of small gaps at the beam ends that
occurred when portions of the wood completely charred away, and the glue dissipates. Table
5.2 summarises the fire resistance results.
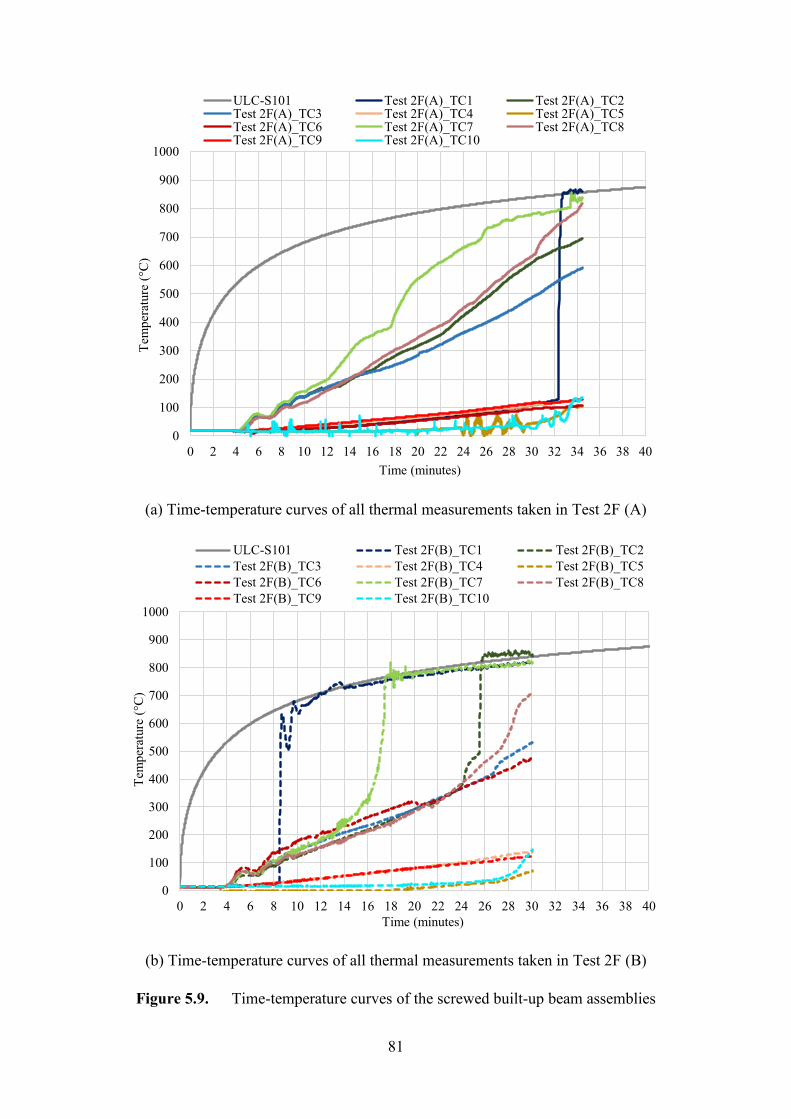
81
(a) Time-temperature curves of all thermal measurements taken in Test 2F (A)
(b) Time-temperature curves of all thermal measurements taken in Test 2F (B)
Figure 5.9. Time-temperature curves of the screwed built-up beam assemblies
0
100
200
300
400
500
600
700
800
900
1000
0 2 4 6 8 10 12 14 16 18 20 22 24 26 28 30 32 34 36 38 40
Tem
per
ature
(°C
)
Time (minutes)
ULC-S101 Test 2F(A)_TC1 Test 2F(A)_TC2Test 2F(A)_TC3 Test 2F(A)_TC4 Test 2F(A)_TC5Test 2F(A)_TC6 Test 2F(A)_TC7 Test 2F(A)_TC8Test 2F(A)_TC9 Test 2F(A)_TC10
0
100
200
300
400
500
600
700
800
900
1000
0 2 4 6 8 10 12 14 16 18 20 22 24 26 28 30 32 34 36 38 40
Tem
per
ature
(°C
)
Time (minutes)
ULC-S101 Test 2F(B)_TC1 Test 2F(B)_TC2
Test 2F(B)_TC3 Test 2F(B)_TC4 Test 2F(B)_TC5
Test 2F(B)_TC6 Test 2F(B)_TC7 Test 2F(B)_TC8
Test 2F(B)_TC9 Test 2F(B)_TC10
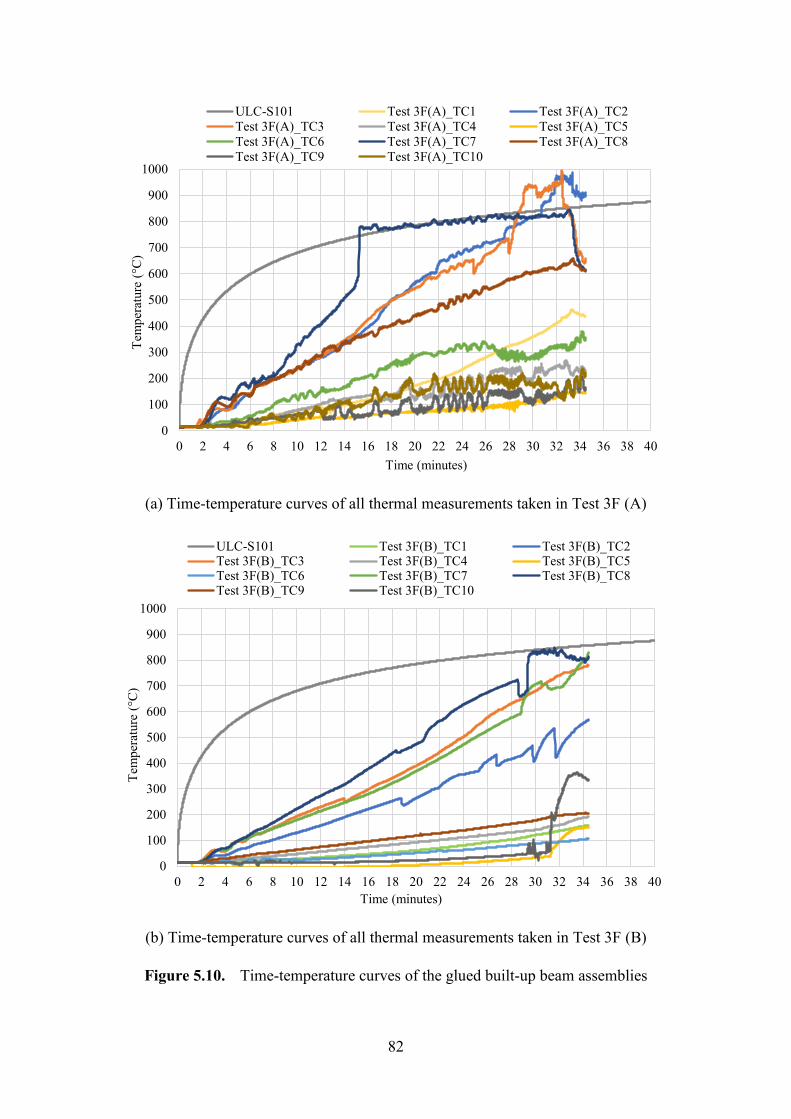
82
(a) Time-temperature curves of all thermal measurements taken in Test 3F (A)
(b) Time-temperature curves of all thermal measurements taken in Test 3F (B)
Figure 5.10. Time-temperature curves of the glued built-up beam assemblies
0
100
200
300
400
500
600
700
800
900
1000
0 2 4 6 8 10 12 14 16 18 20 22 24 26 28 30 32 34 36 38 40
Tem
per
ature
(°C
)
Time (minutes)
ULC-S101 Test 3F(A)_TC1 Test 3F(A)_TC2
Test 3F(A)_TC3 Test 3F(A)_TC4 Test 3F(A)_TC5
Test 3F(A)_TC6 Test 3F(A)_TC7 Test 3F(A)_TC8
Test 3F(A)_TC9 Test 3F(A)_TC10
0
100
200
300
400
500
600
700
800
900
1000
0 2 4 6 8 10 12 14 16 18 20 22 24 26 28 30 32 34 36 38 40
Tem
per
ature
(°C
)
Time (minutes)
ULC-S101 Test 3F(B)_TC1 Test 3F(B)_TC2Test 3F(B)_TC3 Test 3F(B)_TC4 Test 3F(B)_TC5Test 3F(B)_TC6 Test 3F(B)_TC7 Test 3F(B)_TC8Test 3F(B)_TC9 Test 3F(B)_TC10
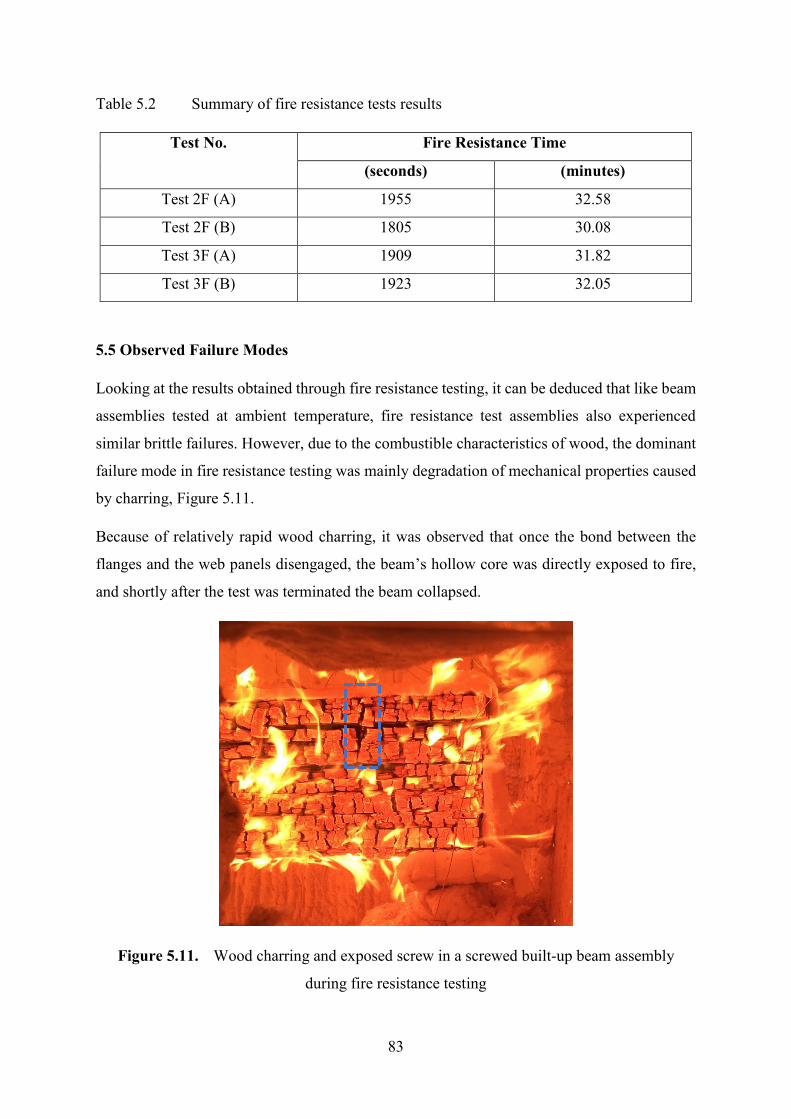
83
Table 5.2 Summary of fire resistance tests results
Test No. Fire Resistance Time
(seconds) (minutes)
Test 2F (A) 1955 32.58
Test 2F (B) 1805 30.08
Test 3F (A) 1909 31.82
Test 3F (B) 1923 32.05
5.5 Observed Failure Modes
Looking at the results obtained through fire resistance testing, it can be deduced that like beam
assemblies tested at ambient temperature, fire resistance test assemblies also experienced
similar brittle failures. However, due to the combustible characteristics of wood, the dominant
failure mode in fire resistance testing was mainly degradation of mechanical properties caused
by charring, Figure 5.11.
Because of relatively rapid wood charring, it was observed that once the bond between the
flanges and the web panels disengaged, the beam’s hollow core was directly exposed to fire,
and shortly after the test was terminated the beam collapsed.
Figure 5.11. Wood charring and exposed screw in a screwed built-up beam assembly
during fire resistance testing
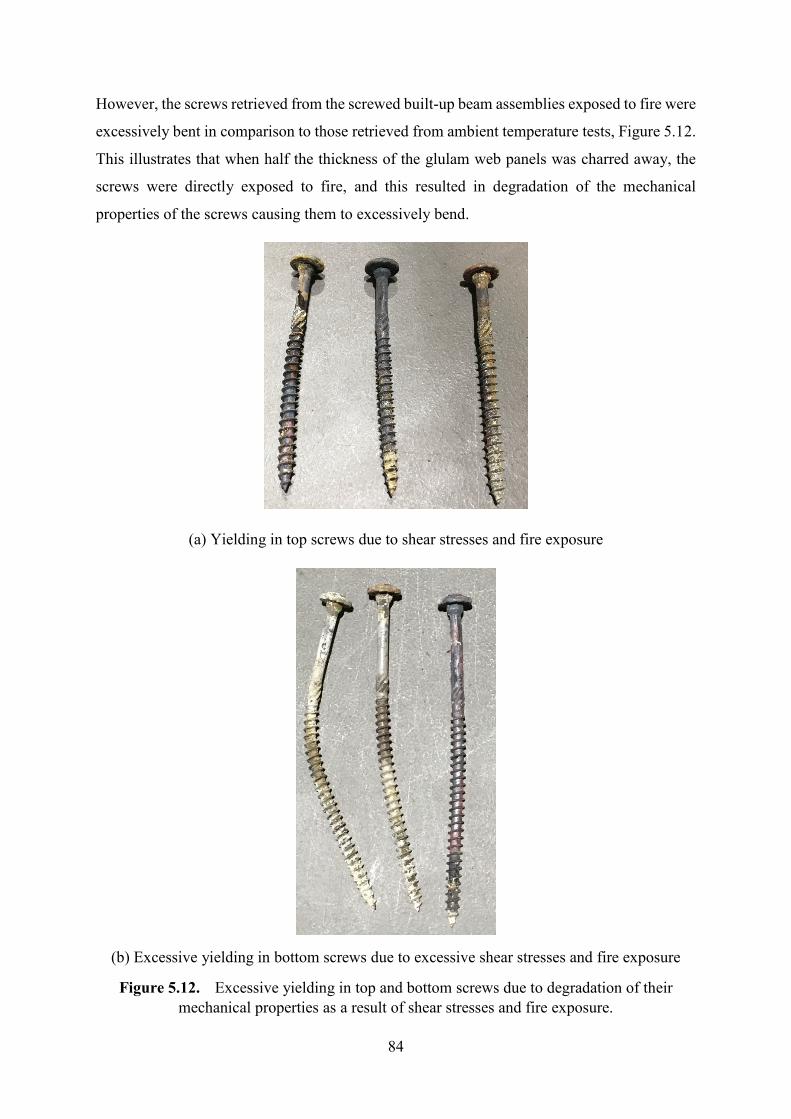
84
However, the screws retrieved from the screwed built-up beam assemblies exposed to fire were
excessively bent in comparison to those retrieved from ambient temperature tests, Figure 5.12.
This illustrates that when half the thickness of the glulam web panels was charred away, the
screws were directly exposed to fire, and this resulted in degradation of the mechanical
properties of the screws causing them to excessively bend.
(a) Yielding in top screws due to shear stresses and fire exposure
(b) Excessive yielding in bottom screws due to excessive shear stresses and fire exposure
Figure 5.12. Excessive yielding in top and bottom screws due to degradation of their
mechanical properties as a result of shear stresses and fire exposure.
85
CHAPTER 6 DISCUSSION OF EXPERIMENTAL RESULTS
6.1 Ambient Temperature Results
The analytical and experimental studies on the flexural bending behaviour of glulam built-up
beams illustrated that the flexural bending strength of such built-up sections is mainly based
on the bond between the flange and web panels of the beam assemblies. It was observed that
by strengthening the connection between the flange and web panels, the stiffness of the built-
up section also increased. The similar observations were made by Hoger et al. (2013) in their
research on the analysis of composite timber beams with box sections. From their experimental
study on four timber composite box beams of 105 mm X 200 mm dimensions that were made
with machine grade pine flanges and using stress grade F8 plywood for webs, they also
observed a non-linear behaviour in the load-deflection relationship corresponding to the failure
of the webs due to excessive loading. The similar behaviour was observed in the mid-span
deflection curves presented in this thesis, which occurred when the monotonic increased loads
resulted in fractures in the glulam web panels.
However, unlike the study carried out by Hoger et al. (2013), the screwed beam specimens
tested for this thesis research showed that even after the web panels encountered row shear
failure, the beam assemblies regained their strength until a brittle failure occurred on the bottom
flange when the ultimate load-carrying capacity of the beam was reached. The renewal of
strength occurred because the web panels were transmitting the shear stresses to the screws
which then transmitted the stresses to the bottom flange, which made the beam built-up section
works monolithically. Also, when the fibres of the bottom glulam flange were extensively
stretched, the flange was unable to bear more loads, and the ultimate brittle failure occurred
resulting in the instantaneous loss in stiffness. This behaviour was also noted in the research
study conducted by Ezeagu et al. (2014).
The thickness of the bottom flange also played an important role in the flexural bending
strength of the built-up beams. Timber being an anisotropic material, its strength differs in the
different axes. As per the research study carried out by Hoffmeyer et al. (2000), glulam beams
showed failure due to tension perpendicular to wood grain before the ultimate compressive
strength value is reached. This is the reason why the bottom flange of the built-up beam tested
in this thesis research project was chosen to be of almost double the thickness of the top flange
of the beam so that the fibres of the bottom flange can sustain more tensile stresses without
cracking.
86
In the case of the glued beam assembly tested in this thesis research project, the monolithic
behaviour of the built-up beam assemblies was caused by the high shear resistance strength of
the PURbond adhesive used. Which is why when the glue line failed, the built-up section’s
four glulam panels started to act as singular entities, and not as a consolidate beam element,
causing dramatic loss of stiffness.
Similar behaviour of glulam beams due to delamination can be seen through the research work
of Ferreira et al. (2017). In their research, they evaluated the effect of delamination of straight
solid glulam on their structural behaviour. The results of their study showed that not only the
length of the delaminated section but also the point where the delamination occurred influenced
the behaviour of the beam under four-point flexural bending. One reason of delamination in
glulam beams can be attributed to higher shear stresses that may be experienced by the beams
under excessive loads (Ferreira et al., 2017), causing the glue line in the glulam beam to fail.
The similar cause was experienced by the glued beam assemblies tested in this thesis research
project, due to the irregular cross section of the beam assemblies, where the bottom flange was
in proximity to the neutral axis inflicting excessive shear flow on the glue line bonding the web
panels with the bottom flange.
6.2 Elevated Temperature Results
The advantage of engineered-wood products such as glulam is that their manufacturing process
allows the fabrication of larger cross sections with long desirable lengths (Smulski, 1997;
Wood Handbook, 2010). Research studies, such as the one conducted by White (2008), showed
that in fire condition, larger cross sections allowed the structural element to withhold the
applied loads for longer time. That is why the bottom flange utilized to fabricate the built-up
section of the beam assemblies tested in this thesis research project was double the thickness
of the other section panels. Since in three-side fire exposure scenario, the bottom part of the
beam assembly was in more direct contact with fire, this resulted in more charring and
degradation of the section in comparison to other components of the beam cross section as it
can be seen through the temperature difference noted across the beam built-up section. Similar
results were reflected in the study performed by Costello et al. (2014), where two types of
beams were experimentally tested; seismic-resistant beams with cross-sectional dimensions of
of 442 mm X 650 mm and gravity beams of cross-sectional dimensions of 315 mm X 800 mm.
A post-tensioning system was also installed inside all beams, and the beams were subjected to
three-side fire exposure, like the condition applied in this thesis research project fire testing.
87
Their results showed that the internal temperature of the seismic-resistant beams was much
lesser than those recorded in the gravity beams. It was also noticed that the beam assemblies
with thicker webs and flanges, such as in the seismic-resistant beams, were able to sustain the
fire for longer duration and hardly any signs of degradation of the top fire-protected flange
were noticed.
In the beam assemblies tested in this thesis research project, the fire resistance of the built-up
beam assemblies was governed mainly by the thickness of the web panels, as their thickness
was only 44 mm compared to double that thickness for the bottom flange. Therefore, the tested
beam assemblies were only able to sustain the applied loads under standard fire exposure for a
duration of a little bit over 30 min, before the residual section became too weak, due to charring,
to sustain the applied loads. This resulted in dramatic increase in the beam mid-span deflections
and end rotations after the temperature inside the furnace reached about 850C.
In addition, it was noticed that the internal temperature of the hollow core of the screwed beam
assemblies reached to a maximum of only 135C by the end of the fire resistance tests; whereas,
this temperature was recorded as 215C for the glued beam assemblies, when the temperature
of the furnace was about 850C in both cases. This thermal behaviour was deduced to occur
because in the case of glued beam assemblies, the industrial glue used had a fire resistance of
slightly above 100C; therefore, with the charring of the web panels, the glue was also being
exposed to fire increasing its viscosity and creation of small pathways for the heat to travel to
the hollow core of the built-up beam assembly causing its internal temperatures to rise.
Whereas, in the screwed beam assemblies, the screws kept the beam built-up section more
intact even though the constant charring resulted in direct exposure of the screws to fire
eventually in the fire resistance tests. Frangi and Fontana (2003) also shared similar results, as
they concluded that in a box cross-section beam, the focus should be given to the joints between
the flange and web panels. Since, if the joint is not tight enough, the fire can access the inner
core of the hollow beam resulting in the web panels being subjected to heat from both sides,
inner and outer sides. This can result in faster decomposition of the web panels, which was also
noticed in the fire resistance tests on the glued built-up beams of this thesis research project.
Accordingly, even though the beam mid-span deflection curves showed that the glued beam
assemblies were able to sustain the applied load under standard fire exposure for a slightly
longer duration than the screwed assemblies; in reality, the web panels in the glued beam
assemblies lost the moisture content faster due to the two-side fire exposure decreasing the

88
stiffness of the glued beam assemblies, which can be seen through the beam end rotation curves
in chapter 5.
89
CHAPTER 7 CONCLUSIONS AND RECOMMENDATIONS FOR
FUTURE WORK
In-depth understanding of the behaviour of built-up glulam box-section beams at ambient and
elevated temperatures needs to be acquired so that a beam assembly with a cross section such
as the one studied in this thesis research project can be utilized in the construction of mid and
high-rise timber buildings. Therefore, the prime objective of this research was to
experimentally investigate the influence of two different joining techniques used to build box-
section glulam beam assemblies on their flexural bending strengths and performance under fire
exposure.
The analysis of the test results presented in Chapters 4 and 5 of this thesis and the comparative
study of the flexural bending behaviour of the different built-up beam assemblies at both,
ambient and elevated temperatures led to a few relevant conclusions and recommendations to
further enhance the flexural bending strength of this type of glulam box-section beams.
7.1 Conclusions
7.1.1 At Ambient Temperature
Looking at the results of the built-up beam assemblies fabricated using different screw spacings
and industrial adhesive that were tested at ambient temperature, a few deductions have been
made and are listed as follows;
1. Reducing the spacing from 200 mm to 100 mm of the screws connecting the bottom
flange panel to the web panels over a one-third beam span length from each support
increased the flexural bending strength of the built-up beam assembly by about 10%.
Whereas, when adhesive was used to join the built-up section’s glulam panels, the beam
assemblies’ flexural bending strength was further increased by about 33%;
2. Screwed test assemblies examined at ambient temperature experienced varying flange-
to-web relative slips that caused various levels of screw yielding. However, using
adhesive increased the flexural bending strength and stiffness of the built-up beam
assemblies causing significant decrease in the relative slips between the flanges and the
web panels;
3. In all beam test assemblies, the web panels experienced higher volume of cracks due to
the greater shear stresses developed in the proximity of the interface between the bottom
flange and the web panels. This failure mode occurred because of the large rolling shear
90
stress in case of the screwed built-up beam assembly, and excessive tensile force in case
of the glued built-up beam assemblies;
4. Only the screwed built-up beam assemblies experienced brittle failure that developed
in the bottom flange when the beam’s ultimate load capacity was attained;
5. Almost no damage occurred to the top flange in the screwed built-up beam assemblies;
however, in the glued built-up beam assemblies, the top flange was subjected to rolling
shear failure.
7.1.2 At Elevated Temperatures
Comparing the observed experimental outcomes of ambient temperature tests with the results
of the fire resistance tests, the following conclusions have been developed;
1. In fire resistance tests, the internal temperature of the bottom flange and the web panels
of the built-up beam sections slightly increased over time due to wood charring.
However, depletion of glue at elevated temperature created pathways for external heat
to travel inside the hollow core of the built-up beam section increasing its temperature
to about 205C in comparison to 135C recorded in the screwed built-up beam
assemblies;
2. The fire exposure rapidly decreased the beam assemblies’ flexural bending strength and
stiffness, and resulted in greater mid-span deflections as well as end rotations;
3. The increments in the beam’s mid-span deflections and end rotations were greater in
case of the glued built-up beam assemblies due to the low fire resistance of the adhesive
used for beam assemblies’ fabrication, causing the bond between the flanges and the
web panels to weaken quick in the fire resistance tests;
4. Excessive shear stresses in addition to fire exposure resulted in greater yielding of
screws in comparison to that occurred in ambient temperature tests. This also indicates
how fire exposure can influence the mechanical characteristics of screws;
5. The built-up glulam box-section beam with the specified cross-sectional dimensions
was able to sustain the applied load under standard fire exposure for slightly over 30
minutes with no fire protection.
7.2 Recommendations for Future Work
Observation of the analytical and experimental outcomes of this research study revealed that
at ambient condition, decreasing the spacing of the screws connecting the bottom flange to the
web panels from 200 mm to 100 mm over one-third beam span length from both supports
91
increased the flexural bending strength and stiffness of the built-up glulam beam assemblies.
However, to achieve a fully-rigid bond between the flanges and the web panels, polyurethane
adhesive is recommended.
Nevertheless, the fire resistance tests showed that the thickness of the glulam panels also plays
a vital role, as the mechanical properties and flexural strength and stiffness of the beam started
to degrade as the wood converted into char. Therefore, it is recommended that to increase the
fire resistance of such built-up glulam box-section beams, screws should be provided with extra
fire insulation, which can be achieved by increasing the thickness of the web panels. In
addition, the extent of this research study should be expanded to investigate the followings:
1. Test more specimens in ambient and elevated temperature conditions to increase the
understanding of beams with this type of cross-section;
2. Developing strengthening technique to internally reinforce the built-up beam assembly
without compromising its entire hollow core;
3. Observe the behaviour of the same built-up beam section when its top flange is
connected to the web panels with adhesive while its bottom flange is joined to the web
panels using self-tapping screws;
4. Conducting a parametric study by developing a finite element model of the built-up
beam assemblies in order to investigate the effect of additional parameters, such as
screw lengths, glulam panel thicknesses, etc. on the flexural bending strength and
stiffness of those built-up beam assemblies.
In summary, the built-up glulam box-section beam assemblies, such as the ones experimentally
examined in this study, would enable designers to utilize lightweight yet strong glulam
structural beams with reasonable fire resistance. This would also open new opportunities in the
field of pre-fabricated construction and promote mid and high-rise timber buildings
construction in Canada.
92
REFERENCES
Abukari, M. H., 2012. The performance of structural screws in canadian glulam. A Ph.D.
dissertation, McGill University Libraries.
Adolf Würth GmbH & Co. KG. 2013. Self-tapping screws for use in timber constructions,
European Technical Approval. ETA-11/0190. Adolf Würth GmbH & Co. KG,
Deutschland.
A Guide to Engineered Wood Products. 2016. Form C800. Apawood.org.
American National Standard Institute. 2010. Standard specification for structural glued
laminated timber of softwood species. AITC 117. APA – The Engineered Wood
Association, U.S.A.
Ashby, M. F., Shercliff, H., and Cebon, D., 2013. Materials: engineering, science, processing
and design. Butterworth-Heinemann.
Babrauskas, V., 2005. Charring rate of wood as a tool for fire investigations. Fire Safety Journal
40, no. 6: 528-554.
Bechtel, F. K., 1997. Fire resistant wood box beam. U.S. Patent 5,625,996.
Bergeron, R., 1997. Fabricated wooden beam with multiple web members. U.S. Patent
5,653,080.
Brzev, S., & Pao, J., 2016. Reinforced concrete design: a practical approach. Pearson
Education Canada.
Buchanan, Andrew H. 1990. Bending strength of lumber. Journal of structural
engineering 116, no. 5: 1213-1229.
Buchanan, A. H. 2000. Fire performance of timber construction. Progress in structural
engineering and materials 2, no. 3: 278-289.
Buchanan, A., Ostman, B., and Frangi, A., 2014. Fire resistance of timber structures.
Gaithersburg: National Institute of Standards and Technology.
Buchanan, A. H., and Abu, A. K., 2017. Structural design for fire safety. John Wiley & Sons.
Canadian Wood Council. 2015. Wood Design Manual. Ottawa, ON, Canada.
Costello, R., Abu, A., Moss, P., and Buchanan, A. 2014 Simplified calculation for fire
performance of post-tensioned timber box beams. Fire Safety Science, 11: 640-651.
CSA Group. 2016. Structural glued-laminated timber. CSA – 0122-16. Canadian Standards
Association, Toronto, Ontario.
D’Ambrisi, A., Focacci, F., and Luciano, R. 2014. Experimental investigation on flexural
behaviour of timber beams repaired with CFRP plates. Composite Structures 108: 720-728.
De Luca, V., and Marano, C. 2012. Prestressed glulam timbers reinforced with steel
bars. Construction and building materials 30: 206-217.
Dietsch, P., and Brandner, R. 2015. Self-tapping screws and threaded rods as reinforcement for
structural timber elements. Construction and Building Materials 97: 78-89.
93
Dong, S. B., Alpdogan, C., and Taciroglu, E. 2010. Much ado about shear correction factors in
Timoshenko beam theory. International Journal of Solids and Structures 47, no. 13: 1651-
1665.
Doshi, C., 1979. On the analysis of the Timoshenko beam theory with and without internal
damping. Master’s Thesis, Department of Mechanical Engineering, Rochester Institute of
Technology, New York, U.S.A.
Drysdale, D. An introduction to fire dynamics. John Wiley & Sons, 2011.
Elghazaly, A. E. A., Gomaa, M. S., Amin, M. A. E., and Ali, E. O. 2014. Structural analysis of
composite laminated box-beams under various types of loading. International Journal of
Engineering Research & Technology (IJERT), 3: 1127-1136.
EN, BS. 1995. 1-1. Eurocode 5: Design of timber structures. General. Common rules and rules
for buildings, BSI.
Ezeagu C.A., Osadebe N.N, Anyata. B.U. 2015. Formulation of Vlasov's energy theorem for
timber box beams. International Journal of Engineering Sciences and Research Technology
4, Issue 8: pp. 89-99.
Ezeagu C.A; Osadebe N.N.; Anyata B.U., 2014. Experimental analysis of warping torsion and
bending in timber box beams. International Journal of Engineering and Applied Sciences,
10: 99-109.
Feasey, R., and Buchanan, A., 2002 Post-flashover fires for structural design. Fire Safety
Journal 37, no. 1: 83-105.
Ferreira, J. G., Cruz, H., and Silva, R., 2017. Failure behaviour and repair of delaminated
glulam beams. Construction and Building Materials 154: 384-398.
Fragiacomo, M., and Davies, M., 2011. Long-term behavior of prestressed LVL members. II:
Analytical approach. Journal of Structural Engineering 137, no. 12: 1562-1572.
Frangi, A., and Fontana, M.., 2003. Charring rates and temperature profiles of wood
sections. Fire and Materials 27, no. 2: 91-102.
Frangi, A., Fontana, M., Hugi, E., and Jübstl, R., 2009. Experimental analysis of cross-
laminated timber panels in fire. Fire Safety Journal 44, no. 8: 1078-1087.
Frihart, C. R., and Hunt, C. G., 2010. Adhesives with wood materials: bond formation and
performance. Wood handbook: wood as an engineering material: chapter 10. Centennial
ed. General technical report FPL; GTR-190. Madison, WI: US Dept. of Agriculture, Forest
Service, Forest Products Laboratory, 2010: p. 10.1-10.24. 190: 10-1.
Gales, J. A., Bisby, L. A., and Stratford, T. 2012. New parameters to describe high-temperature
deformation of prestressing steel determined using digital image correlation. Structural
Engineering International 22, no. 4: 476-486.
Gilun, A., and Meronk, J., 2006. Stress-laminated timber T-beam and box-beam bridges.
Master’s Thesis, Department of Civil and Environmental Engineering. Chalmers
University of Technology, Sweden
Gotou, H., Takita, H., Sasaki, T., Horie, Y., and Watanabe, C., 2014. Shear behavior of on-site
timber stress-laminated box-beam bridges. In Proceeding World Conference on Timber
Engineering WCTE 2014, pp. 10-14.
94
GRK Fasteners, A Division of Illinois Tool Works Inc. 2017. Rugged structural screws. ICC-
ES Evaluation Report. ESR-2442. Bartlett. Illinois.
Gunakala, S. R., Comissiong, D. M. G., Jordan, K., and Sankar, A., 2012. Finite Element
Method for the beam equation using MATLAB. International Journal of Applied Science
and Technology 2, no. 8: 80-88.
Gutknecht, M. P., 2017. Parallel-to-grain withdrawal resistance of structural self-tapping
screws in Canadian timber. PhD dissertation, Queen's University (Canada).
Haque, A., 2017. Introduction to Timoshenko Beam Theory.
Hibbeler, R. C., 2013. Statics and mechanics of materials. Pearson Higher Ed.
Hoffmeyer, P., Damkilde, L., and Pedersen, T. N., 2000. Structural timber and glulam in
compression perpendicular to grain. European Journal of Wood and Wood Products 58, no.
1: 73-80.
Hoger, C., Suntharavadivel, T. G., and Duan, K., 2013. Failure and analysis of composite
timber beams with box section. Proceedings of 8th International Conference on Structural
Integrity and Fracture, Melbourne, Australia.
Hurley, M. J., Gottuk, D. T., Hall Jr, J. R., Harada, K., Kuligowski, E. D., Puchovsky, M., John
M. Watts Jr., J.M., and Wieczorek, C. J., eds., 2015. SFPE handbook of fire protection
engineering. Springer.
Introduction to the fire safety engineering of structures, 2003. Institute of Structural Engineers,
Great Britain.
Issa, C. A., and Kmeid, Z., 2005. Advanced wood engineering: glulam beams. Construction
and Building Materials 19, no. 2: 99-106.
Jain, R., and Lee, L., eds., 2012. Fiber reinforced polymer (FRP) composites for infrastructure
applications: focusing on innovation, technology implementation and sustainability.
Springer Science & Business Media.
Jönsson, J., 2005. Load carrying capacity of curved glulam beams reinforced with self-tapping
screws. Holz als Roh-und Werkstoff 63, no. 5: 342-346.
Karlsson, S., and Wong, M., 2004. Experimental evaluation of the test methods EN 302-1 and
ASTM D905 for wood-adhesive bonds. LTH Lund University Box 118.
Karbhari, V. M., 2014. Rehabilitation of metallic civil infrastructure using fiber-reinforced
polymer (FRP) composites: a materials and systems overview at the adhesive bond level.
In Rehabilitation of Metallic Civil Infrastructure Using Fiber Reinforced Polymer (FRP)
Composites, pp. 3-10.
Kennedy, G. J., Hansen, J. S., and Martins, J. R., 2011. A Timoshenko beam theory with
pressure corrections for layered orthotropic beams. International Journal of Solids and
Structures 48, no. 16-17: 2373-2382.
Labuschagne, A., van Rensburg, N. J., and Van der Merwe, A. J., 2009. Comparison of linear
beam theories. Mathematical and Computer Modelling 49, no. 1-2: 20-30.
LeVan, S. L., and Winandy, J. E., 2007. Effects of fire retardant treatments on wood strength:
a review. Wood and Fiber Science 22, no. 1: 113-131.
95
Lie, T. T., 1977. A method for assessing the fire resistance of laminated timber beams and
columns. Canadian Journal of Civil Engineering 4, no. 2: 161-169.
Logan, D. L., 2000. A first course in the finite element method using Algor. Brooks/Cole
Publishing Co.
McConnell, E., McPolin, D., and Taylor, S., 2014. Post-tensioning of glulam timber with steel
tendons. Construction and Building Materials 73: 426-433.
McConnell, E., McPolin, D., and Taylor, S.., 2014. Post-tensioning glulam timber beams with
basalt FRP tendons. Proceedings of the Institution of Civil Engineers-Construction
Materials 168, no. 5: 232-240.
Milner, H. R., and Tan, H. H. 2001. Modelling deformation in nailed, thin-webbed timber box
beams. Computers & Structures 79, no. 29-30: 2541-2546.
Mosallam, A. S., 2016. Structural evaluation and design procedure for wood beams repaired
and retrofitted with FRP laminates and honeycomb sandwich panels. Composites Part B:
Engineering 87: 196-213.
Newlin, J. A., and Trayer, G. W., 1924. Form factors of beams subjected to transverse loading
only, Nat. Adv. Comm. Aero., Report 181.
Nordic Engineered Wood. 2018. Nordic Lam. CCMCE Evaluation Report. 13216-R. Nordic
Structures Inc., Quebec, Canada.
Östman, B. L., 1985. Wood tensile strength at temperatures and moisture contents simulating
fire conditions. Wood science and technology 19, no. 2: 103-116.
Östman, B., Mikkola, E., Stein, R., Frangi, A., König, J., Dhima, D., Hakkarainen, T., and
Bregulla, J., 2010. Fire safety in timber buildings. Technical guideline for Europe. SP 19.
O’Loinsigh, C., Oudjene, M., Ait-Aider, H., Fanning, P., Pizzi, A., Shotton, E., and Meghlat,
E. M., 2012. Experimental study of timber-to-timber composite beam using welded-
through wood dowels. Construction and Building Materials 36: 245-250.
Persson, E., 2008. Stress and strength analysis of curved glulam beams with box cross-section.
Master’s Thesis, Department of Civil Engineering. Lunds University, Lund, Sweden.
Phan, L. T., McAllister, T. P., Gross, J. L., and Hurley, M. J., 2010. Best practice guidelines
for structural fire resistance design of concrete and steel buildings. NIST technical
note 1681: 199.
Pizzo, B., Lavisci, P., Misani, C., and Triboulot, P., 2003. The compatibility of structural
adhesives with wood. Holz als Roh-und Werkstoff 61, no. 4: 288-290.
Priestley, M. N., Sritharan, S., Conley, J. R., and Pampanin, S., 1999. Preliminary results and
conclusions from the PRESSS five-story precast concrete test building. PCI journal 44, no.
6: 42-67.
Purkiss, J. A., and Li, L. Y., 2013. Fire safety engineering design of structures. CRC Press.
Richardson, L. R., and M. Batista., 2001. Fire resistance of timber decking for heavy timber
construction. Fire and materials 25, no. 1: 21-29.
Righetti, L., Corradi, M., and Borri, A., 2015. Basalt FRP spike repairing of wood
beams. Fibers 3, no. 3: 323-337.
96
Ringena, O., Janzon, R., Pfizenmayer, G., Schulte, M., & Lehnen, R., 2006. Estimating the
hydrolytic durability of cured wood adhesives by measuring formaldehyde liberation and
structural stability. Holz als Roh-und werkstoff 64, no. 4: 321.
Ross, R. J., 2010. Wood handbook: Wood as an engineering material. USDA Forest Service,
Forest Products Laboratory, General Technical Report FPL-GTR-190, 2010: 509 p. 1
v.190.
Salem, O., 2014. Experimental investigation of the bending behaviour of timber-to-timber
composite-section beams, Proceedings of the 13th World Conference on Timber
Engineering (WCTE2014), Quebec, Canada.
Schaffer, E., 2007. State of structural timber fire endurance. Wood and Fiber Science 9, no. 2:
145-170.
Schneeweiß, G., and Felber, S., 2013. Review on the bending strength of wood and influencing
factors. American Journal of Materials Science 3, no. 3: 41-54.
Schober, K. U., Harte, A. M., Kliger, R., Jockwer, R., Xu, Q., and Chen, J. F., 2015. FRP
reinforcement of timber structures. Construction and building materials 97: 106-118.
Sernek, M., Boonstra, M., Pizzi, A., Despres, A., and Gérardin, P., 2008. Bonding performance
of heat treated wood with structural adhesives. Holz als Roh-und Werkstoff 66, no. 3: 173-
180.
SFS intec AG. 2012. SFS self-tapping screws WR, European Technical Approval. ETA-
12/0062. SFS intec AG, Schweiz, Germany.
Shimabukuro, Y., 1989. Wooden synthetic beam. U.S. Patent 4,843,777.
Smulski, S. ed., 1997. Engineered wood products: a guide for specifiers, designers and users.
PFS Research Foundation.
Spellman, P. M., Abu, A. K., Carradine, D. M., Moss, P. J., and Buchanan, A. H., 2012. Design
of post-tensioned timber beams for fire resistance. Proceedings of 7th International
Conference on Structures in Fire, Zurich, Switzerland.
Tang, B., 1997. Fiber reinforced polymer composites applications in USA. In First Korea/USA
Road Workshop Proceedings, Vol. 2, pp. 28-29.
Timoshenko, S., and Goodier, J. N., 1951. Theory of Elasticity, McGraw-Hill book Company.
Timoshenko, S., 1953. History of strength of materials: with a brief account of the history of
theory of elasticity and theory of structures. Courier Corporation.
Trayer, G. W., and Newlin, J.A., 1924. Deflection of beams with special reference to shear
deformations: the influence of the form of a wooden beam on its stiffness and strength-I.
Adv. Comm. Aero., Report 180.
Vlasov, V. Z., 1959. Thin-walled elastic beams. "Translated from Russian." Schechtman,
National Science Foundation, Washington, D, C., by the Israel Program for Scientific
Translations: [available from the Office of Technical Services, U.S. Dept of Commerce,
Washington], Jerusalem,
White, R. H. .2000. Fire performance of hardwood species. Forest Products Laboratory.
97
White, R. H., 2016. Analytical methods for determining fire resistance of timber members.
In SFPE Handbook of Fire Protection Engineering, pp. 1979-2011. Springer, New York,
NY.
Yang, T. H., Wang, S. Y., Lin, C. J., & Tsai, M. J., 2008. Evaluation of the mechanical
properties of Douglas-fir and Japanese cedar lumber and its structural glulam by
nondestructive techniques. Construction and building Materials 22, no. 4: 487-493.
Zaman, A., Gutub, S. A., and Wafa, M.A., 2013. A review on FRP composites applications
and durability concerns in the construction sector. Journal of Reinforced Plastics and
Composites 32, no. 24: 1966-1988.
Zehfuss, J., and Hosser, D., 2007. A parametric natural fire model for the structural fire design
of multi-storey buildings. Fire Safety Journal 42, no. 2: 115-126.
Zoghi, M, ed., 2013. The international handbook of FRP composites in civil engineering. CRC
Press.
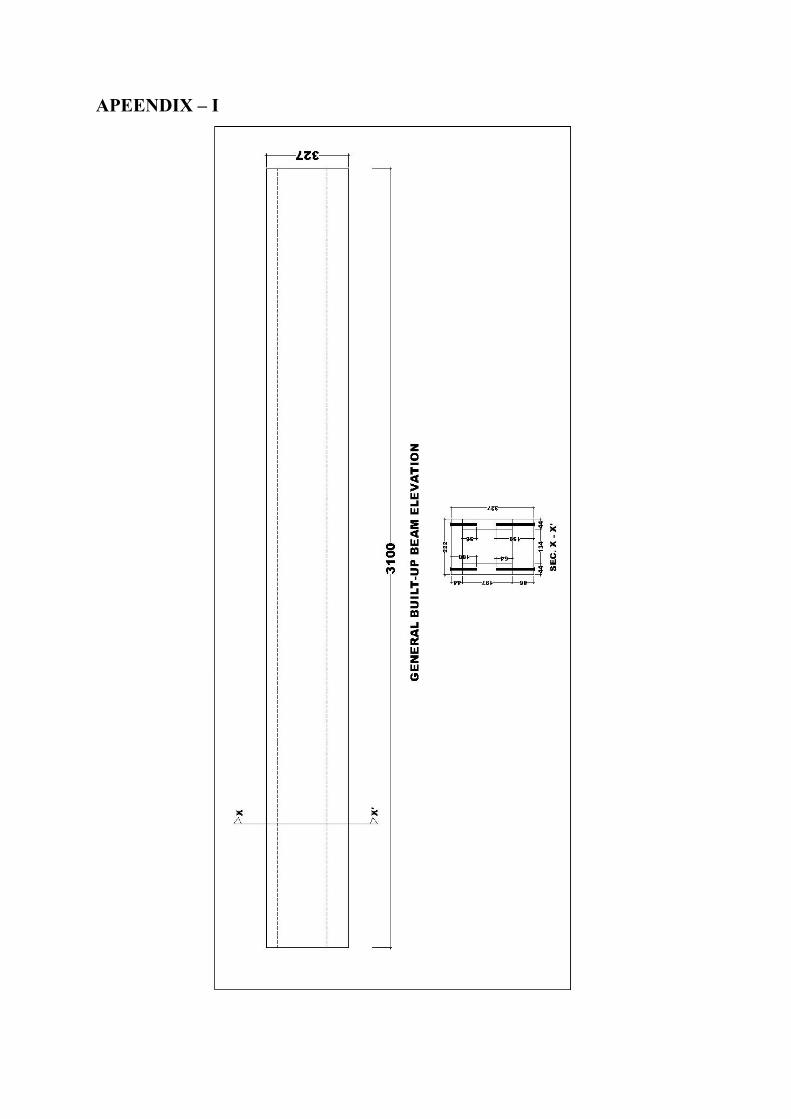
APEENDIX – I