flat-top silver nanocrystals on the two polar faces of …beaucag/research/050913_argonne... ·...
TRANSCRIPT

Flat-top silver nanocrystals on the two polar faces of ZnO: An all angle x-rayscattering investigation
Nathalie Jedrecy,1 Gilles Renaud,2 Rémi Lazzari,3 and Jacques Jupille3
1Laboratoire de Minéralogie-Cristallographie, Universités Pierre et Marie Curie et Denis Diderot, CNRS UMR 7590, 4 Place Jussieu,75252 Paris Cedex 05, France
2CEA-Grenoble, Département de Recherche Fondamentale sur la Matière Condensée, Service de Physique des Matériauxet Microstructures, Nanostructures et Rayonnement Synchrotron, 17 Avenue des Martyrs, 38054 Grenoble, Cedex 9, France
3Groupe de Physique des Solides, CNRS UMR 7588, Universités Paris 6 et 7, Campus Boucicaut, 140 Rue de Lourmel, 75015 Paris,France
�Received 15 December 2005; revised manuscript received 28 February 2005; published 14 July 2005�
The growth of silver at room temperature on the two polar faces of ZnO, �0001� Zn terminated and �0001̄�O terminated, has been investigated in situ by using grazing incidence x-ray diffraction and grazing incidencesmall angle x-ray scattering �GISAXS�. On both surfaces, silver forms nanoclusters with �111� top facets in
hexagon-on-hexagon epitaxy with �101̄�Ag� �100�ZnO. Despite the high lattice mismatch in the latter direction�−11% �, the Ag islands adopt their bulk parameter even at the very beginning of the growth, a key featureassigned to a quasi-perfect coincidence of a 9�9 Ag cell on a 8�8 ZnO cell. The GISAXS patterns giveevidence of triangular and hexagonal cluster shapes on the Zn and O surfaces, respectively, which reflect thetopographies of the two surfaces. Quantitative analysis is performed to deduce the morphological parameters asa function of coverage. To represent highly covered surfaces involving large clusters with complex shapes, aspecific GISAXS treatment in terms of holes in a continuous metal layer is proposed. In the O case, flat-topislands develop mostly laterally until an incompletely filled thick layer is formed. In the Zn case, the islandsgrow both in height and in diameter until the film can be represented by a layer with holes. The derived growthparameters attest that silver spreads significantly better on the O-terminated face than on the Zn termination.
DOI: 10.1103/PhysRevB.72.045430 PACS number�s�: 61.10.Eq, 61.10.Nz, 68.35.Ct, 68.55.Ac
I. INTRODUCTION
The oxides and their interplay with metals are of centralimportance in environmental and earth science as well as intechnological applications.1,2 The latter include catalysts, gassensors, and optical, electronic, or magnetic devices. Sys-tems based on the zinc oxide, which exhibits various physi-cal �direct band gap in the UV region, high exciton bindingenergy� and chemical �mixing of covalent-ionic characters,high solubility of group III impurities and of transition metalions� properties,3 are among those which have considerablepotential in all fields. Applications of particular relevanceconcern noble metals supported on ZnO. Copper on ZnO isemployed on industrial scale for methanol synthesis andwater-gas shift reaction.4 Silver on ZnO is used in low-emissive and antisolar coatings on glasses.5,6 A central con-cern in manufacturing the coatings is the way the silver film,which is expected to behave as a perfect mirror in the infra-red wavelength range, wets its oxide support.
Vapor-deposited metals grow generally on oxide surfacesin the form of three-dimensional �3D� nanometer-sized clus-ters rather than in a monolayer-by-monolayer mode.7,8 A va-riety of parameters are involved in the growth process �theelectronic and crystalline structures of the two materials, therespective surface free energies, the interface energy, kineticfactors�, determining the atomic structure, the shape, and thesize of the metallic clusters. The nanoclusters morphologyand the statistical organization on the substrate determine inturn the physical and reactive properties of the overallsystem.9,10 The peculiarity of noble and late transition metals
on the basal planes of zinc oxide, namely the �0001� Zn-terminated and the �0001̄� O-terminated surfaces, is that theirgrowth proceeds with an enhanced two-dimensional charac-ter. The critical coverage, defined as the fraction of the sur-face covered by the metal at the onset of the formation of thesecond atomic layer, has been estimated to 1 forplatinum11–13 and to 0.55 �Ref. 14� �0.35�15 for copper on O�Zn� face. In the case of copper, flat-top clusters areformed.14,16 A pseudo layer-by-layer growth has been in-ferred, tentatively explained by either purely kineticmechanisms14 or electronic transfer process from metal tosurface states.17
The practical importance of the ZnO-supported Ag films,together with the fundamental questions regarding adhesionof metals on oxide polar surfaces, have prompted us to un-dertake an x-ray study of the growth of silver on the twounreconstructed polar faces of ZnO. The use of x rays en-ables one to follow the metal/oxide growth, averaged overthe whole surface, in situ and in a nondestructive way, from0.2 to 3.4 nm of equivalent thickness. Morphological andstructural features are derived in a combined way from graz-ing incidence x-ray scattering, at small and large emergenceangles, respectively. Grazing incidence x-ray diffraction�GIXD� probes the order at the atomic scale. Grazing inci-dence small-angle x-ray scattering �GISAXS� probes themorphology and the spatial distribution of nanometer-sizedobjects.18–20 The instrument used herein has benefited fromrecent developments to analyze, in situ and quasi in realtime, particles grown on surfaces in UHV environment.21 Itallows an exact knowledge of the metal/oxide interface struc-
PHYSICAL REVIEW B 72, 045430 �2005�
1098-0121/2005/72�4�/045430�14�/$23.00 ©2005 The American Physical Society045430-1

ture both at nanoscopic and mesoscopic scale. This is a pre-requisite if one wants to be able in future to tune chemicaladsorption properties of supported systems �catalysis�, oroptical/magnetic properties of nanocomposite materials.
II. EXPERIMENTS
The geometry of the GISAXS measurements is shown inFig. 1. The incident x-ray beam of wave vector ki makes anangle �i with the surface. The orientation of the principalaxes of the sample with respect to ki is determined by therotation angle � around the surface normal ��=0° for�010�ZnO parallel to the X axis�. Grazing incidence geometrymaximizes the surface signal to noise ratio. The x-ray beamis scattered by the assembly of supported particles along di-rections kf determined by the out-of-plane and in-planeangles, � f and � f, respectively. In the present work, theseangles were ranging between 0° and 5.4° for � f and between−1.9° and 3.5° for � f. Even if it does not describe entirely thescattering process at small angles �see Appendix A�, we willuse in figures the scattering wave vector q=kf−ki given by
qx = k0�cos�� f�cos�� f� − cos��i�� ,
qy = k0�sin�� f�cos�� f�� ,
qz = k0�sin�� f� + sin��i�� , �2.1�
where k0=2� /� with � being the x-ray wavelength. Thesame geometry is used for GIXD except that the scatteringcenters are the atoms and that the two outgoing angles � f ,� fmay vary between 0° and 90°.22
The experiments were performed at the European Syn-chrotron Radiation Facility �ESRF� using the UHV surfacediffraction setup of the CRG BM32 beamline.23 A doublyfocused x-ray beam of 18 keV was used, with a typical 0.4�0.3 mm2 horizontal times vertical size. The angle �i wasfixed at the critical angle of ZnO for total external reflection:�c=0.155°. The GISAXS scattering was measured using acharge coupled device �CCD� detector, at fixed position680 mm downstream the sample center. The active windowof the CCD camera, perpendicular to the in-plane x-ray di-
rection �X axis�, is made of 1242 and 1152 pixels along thein-plane Y axis and the out-of-plane Z axis, respectively, witha pixel size of 56.25 �m. The resolution in reciprocal spaceunits was thus about 0.0075 nm−1. The transmitted andspecularly reflected x-ray beams were hidden by purposelydesigned beam stops and antiscattering slits.24 The � f loweracceptance was ±0.086° �that is qy = ±0.14 nm−1�. A standardscintillator detector, which could be positioned in the direc-tion of any kf, was used for the measurement of GIXD in-tensities.
The ZnO substrates were commercial hydrothermally
grown single crystals with �0001� or �0001̄� orientations. Theclean �1�1� surfaces have been obtained after several cyclesof sputtering with 0.6–1.5 keV Ar+ and annealing at 1000 Kin UHV followed by cooling down under O2 pressure�10−5 mbar�. Silver was evaporated using a resistively heatedKnudsen cell, the substrate being kept at room temperature.The used flux of 0.062 nm/min was calibrated with a quartzmicrobalance. On the basis of this calibration and assuming asimilar sticking coefficient on the microbalance and on theZnO substrates, a deposited amount could be determined forthe Ag/ZnO films. It is expressed in nanometers.
III. EPITAXY AND CRYSTALLINE ANALYSIS
ZnO crystallizes in the wurtzite structure which consistsin the stacking of atomic layers composed either by O anionsor Zn cations, with in-plane hexagonal symmetry. The layersare stacked according to the sequence AaBbAa. . . where A, Brefer to Zn and a, b to O. The Aa and aB interlayer spacingsare equal to 0.199 and 0.061 nm, respectively. The truncationperpendicular to the c axis arises between A and a layers �orbetween B and b�, leading on the one side to a Zn-terminated�0001� surface and on the other side to an O-terminated
�0001̄� surface. The two polar surfaces are stabilized underUHV while preserving a �1�1� bulklike order. The stabili-zation mechanisms are however depending on the chemicalnature of the surface.25 On the Zn-terminated surface, thedipole moment is compensated via a change in stoichiom-etry. The average concentration of Zn atoms is reduced by1/4 in the outermost layer. This change in stoichiometry isnot generated by a random distribution of vacancies but byone bilayer high triangular islands �bA� or one bilayer deeptriangular holes.26 On the contrary, the outermost layer of theO-terminated surface is found to be stoichiometric andflat;16,27 a partial charge transfer from the O surface anionstowards the bulk may be inferred. Silver crystallizes in thefcc structure. Considering the �111� planes of in-plane hex-agonal symmetry, the expected lattice mismatch with
ZnO�0001�-Zn �or �0001̄�-O� is equal to −11% along the
natural �101̄�Ag� �100�ZnO azimuth. A rotation by 30° of thein-plane hexagonal cell of Ag with respect to that of ZnO
leads to a lattice mismatch of +2.75% ��101̄�Ag� �210�Ag azi-muth�.
Scans performed in various regions of the reciprocal
FIG. 1. �Color online� Geometry of the GISAXS measurements,in which the X, Y, Z axes are fixed in the laboratory frame. Thex-ray beam falls on the surface under a grazing angle �i. The ori-entation of the in-plane axes of the sample is determined by thevalue of the rotation angle � around the surface normal ��=0° for�010� �X axis�. The intensity scattered along any direction charac-terized by out-of-plane and in-plane angles, � f and � f respectively,is collected on a CCD camera, fixed at reasonable distance from thesample, perpendicularly to the X axis.
JEDRECY et al. PHYSICAL REVIEW B 72, 045430 �2005�
045430-2
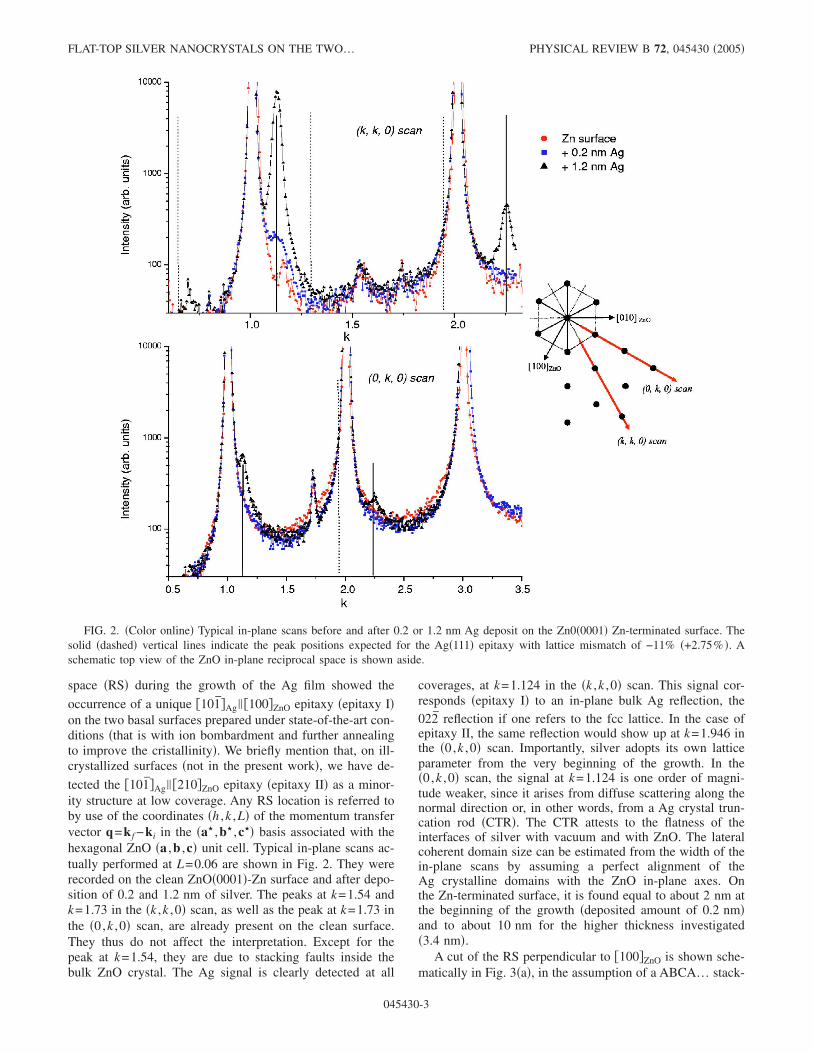
space �RS� during the growth of the Ag film showed the
occurrence of a unique �101̄�Ag� �100�ZnO epitaxy �epitaxy I�on the two basal surfaces prepared under state-of-the-art con-ditions �that is with ion bombardment and further annealingto improve the cristallinity�. We briefly mention that, on ill-crystallized surfaces �not in the present work�, we have de-
tected the �101̄�Ag� �210�ZnO epitaxy �epitaxy II� as a minor-ity structure at low coverage. Any RS location is referred toby use of the coordinates �h ,k ,L� of the momentum transfervector q=k f −ki in the �a� ,b� ,c�� basis associated with thehexagonal ZnO �a ,b ,c� unit cell. Typical in-plane scans ac-tually performed at L=0.06 are shown in Fig. 2. They wererecorded on the clean ZnO�0001�-Zn surface and after depo-sition of 0.2 and 1.2 nm of silver. The peaks at k=1.54 andk=1.73 in the �k ,k ,0� scan, as well as the peak at k=1.73 inthe �0,k ,0� scan, are already present on the clean surface.They thus do not affect the interpretation. Except for thepeak at k=1.54, they are due to stacking faults inside thebulk ZnO crystal. The Ag signal is clearly detected at all
coverages, at k=1.124 in the �k ,k ,0� scan. This signal cor-responds �epitaxy I� to an in-plane bulk Ag reflection, the022̄ reflection if one refers to the fcc lattice. In the case ofepitaxy II, the same reflection would show up at k=1.946 inthe �0,k ,0� scan. Importantly, silver adopts its own latticeparameter from the very beginning of the growth. In the�0,k ,0� scan, the signal at k=1.124 is one order of magni-tude weaker, since it arises from diffuse scattering along thenormal direction or, in other words, from a Ag crystal trun-cation rod �CTR�. The CTR attests to the flatness of theinterfaces of silver with vacuum and with ZnO. The lateralcoherent domain size can be estimated from the width of thein-plane scans by assuming a perfect alignment of theAg crystalline domains with the ZnO in-plane axes. Onthe Zn-terminated surface, it is found equal to about 2 nm atthe beginning of the growth �deposited amount of 0.2 nm�and to about 10 nm for the higher thickness investigated�3.4 nm�.
A cut of the RS perpendicular to �100�ZnO is shown sche-matically in Fig. 3�a�, in the assumption of a ABCA… stack-
FIG. 2. �Color online� Typical in-plane scans before and after 0.2 or 1.2 nm Ag deposit on the Zn0�0001� Zn-terminated surface. Thesolid �dashed� vertical lines indicate the peak positions expected for the Ag�111� epitaxy with lattice mismatch of −11% �+2.75% �. Aschematic top view of the ZnO in-plane reciprocal space is shown aside.
FLAT-TOP SILVER NANOCRYSTALS ON THE TWO… PHYSICAL REVIEW B 72, 045430 �2005�
045430-3

ing for �111� Ag planes. The ZnO and Ag CTRs are dis-played together with bulk-type reflections indicated by fullcircles, whereas forbidden reflections are shown in the formof open circles. Figure 3�b� is the corresponding real spacerepresentation. Some out-of-plane scans, along the Ag CTRof type �h ,k�= �2,0�, are shown in Fig. 3�c�. The presence ofthe peak at L=0.73, once 0.2 nm of silver is deposited, dem-onstrates that, at this early stage of the growth, the islandsalready involve at least three atomic �111� layers �the inter-layer spacing is 0.236 nm�. Note that at L=2.94, Ag contri-bution is mostly hidden by the bulk ZnO reflection at L=3.An extra peak is recorded at L=1.47 which is due to thepresence of silver �111� planes stacked according to a reversesequence ACBA… relative to that chosen in Fig. 3�b�. Suchsequence is also retrieved by a rotation of 60° �or 180°�around the surface normal. The signals from the two stackingrapidly become �1.2 nm coverage� of the same intensity. Dueto the 6 mm ZnO surface symmetry,25 the formation duringthe growth of twin crystallites in similar amounts seemsmore likely than the occurrence of stacking faults.
IV. MORPHOLOGY OF THE AG/ZNO FILM
A. Diffuse x-ray scattering at small angles: Theoreticalbackground
This section is aimed at describing the main ingredientsused in the calculation of the intensity scattered at smallangles by an assembly of particles in a host medium. In thepresent case, particles are Ag islands supported on ZnO sur-faces. They are treated as a perturbation in the propagation ofthe x-ray wave field on top of the substrate. A complemen-tary approach, being more relevant when dealing with anincompletely filled thick layer, is to consider that the scatter-ing entities are holes between islands. The two models willbe used herein. The total scattering cross section28 for anassembly of scatterers n located at rn,� reads
� d�
d��
tot �
n
Fn2 + �n
�m�n
FnF m� eiq�.�rn,�−rm,��, �4.1�
where Fn�ki ,k f� is a kind of Fourier transform of the elec-tronic density of the particle n �island or hole�, through itsaverage shape. In fact, Fn, the so-called form factor, includesmultiple reflection effects by the substrate or by the possiblyconstituted vacuum-layer interface, due to the closeness ofthe out-of-plane angles �i ,� f and of the critical angle �c fortotal external reflection. The detailed formalism for comput-ing Fn within the distorted wave born approximation�DWBA�29 is given in Appendix A. For a homogeneous er-godic system, the spatial average that should be applied toEq. �4.1� due to the finite beam coherence length is replacedby a configuration average over all possible situations, intro-ducing the probability pX for a particle to be of type X �theshape and size are fully determined by the particle type X�and the probability pYGYX�rn,� ,rm,�� to have a particle of typeY at vector rm,�, knowing the particle at vector rn,� is of typeX. The function GYX�rn,� ,rm,�� is the partial pair correlationfunction between X and Y. The intensity is written as:
� d�
d��
tot �
X
pXFX2 + �X
�Y
FXF Y�
� n�m
d2rnd2rmpXpYGYX�rn,�,rm,��eiq�.�rn,�−rm,��,
�4.2�
the integration being done over the whole surface.At this stage, two types of approximation are usually en-
countered. The first one is known as the decoupling-approximation �DA�;28 it assumes that GYX�rn,� ,rm,�� doesnot depend on the particle types but only on the relativedistance between scatterers, i.e., GYX�rn,� ,rm,��=G�rn,�
−rm,��. The intensity may be written as the sum of a diffuseterm and of a coherent term
� d�
d��
tot �
X
pXFX2 − ��X
pXFX�2+ ��
X
pXFX�2S�q�� ,
�4.3�
where
FIG. 3. �Color online� �a� Cross section of the reciprocal spaceperpendicular to �100�ZnO, showing ZnO and Ag crystal truncationrods, in the assumption of a single type of fcc staking for Ag. Fullcircles indicate Bragg positions whereas open ones correspond tofcc forbidden reflections. �b� Cross section of the correspondingAg/ZnO system. Large gray circles are Ag atoms, small solid�open� circles are zinc �oxygen�. �c� Out-of-plane L scans along asecond-order Ag rod, after 0.2 and 1.2 nm deposit.
JEDRECY et al. PHYSICAL REVIEW B 72, 045430 �2005�
045430-4

S�q�� = 1 + n�m
d2rnd2rmG�rn,� − rm,��eiq�.�rn,�−rm,��
�4.4�
is referred to as the total interference function. The secondapproximation, known as the local monodisperse approxima-tion �LMA�,30 assumes that the cross section is the incoher-ent summation of the intensities from domains characterizedby a single type of particle. This reverts to consider Y =Xwith pY =1 in Eq. �4.2�. One obtains
� d�
d��
tot ��
X
pXFX2�S�q�� . �4.5�
The scattered intensity appears as the average of the squareof the form factor of the particles times the function S�q��.
For a disordered distribution of particles with an averageinter-island distance D, the maxima of S�q�� will be locatedat q� values multiple of 2� /D. The more cumulative thedisorder is, the more the maxima of the function S�q�� areattenuated with increasing q�. The intensity on the CCD cam-era generally appears in the form of only two spots �see Fig.1�, the maxima in these spots being at the average distance2� /D from specular position. The shape of the spot givesback the average particle shape through the terms FX. Thespatial extension along horizontal and vertical directions isroughly inversely proportional to the average lateral size 2Rand height H of the particles. The distribution of intensity ofthe form factor may shift significantly the position of theGISAXS maxima.31,32 The DA model, at main variance withthe LMA model, is known to generate additional diffuse scat-tering towards small angles.31
On the basis of the paracrystal theory,33,34 the followingone-dimensional �1D� interference function was systemati-cally used
S�q�� =1 − 2
1 + 2 − 2 cos�q�D�, �4.6�
where =exp�−q�2�2 /2� is the Fourier transform of the prob-
ability distribution p�x� of the first neighbor distance D, cho-sen itself as Gaussian with a half width at half maximumequal to �2 ln 2�. In the paracrystal model, the neighbors ofa given particle are placed sequentially in the vicinity of thenodes of a regular lattice with parameter D. The probabilityfor a particle to be displaced from lattice site increasesgradually with its distance from the central particle.
B. Morphological features as stemming from GISAXS
Some experimental GISAXS patterns recorded during thegrowth of silver on the Zn and on the O surfaces are dis-played in Fig. 4. In each case, the distance between the twointensity lobes decreases continuously with increasing cov-erage. This means that islands coalesce, and this from thevery beginning of the growth. The homothetic shrinkage ofthe intensity observed in the Zn case is indicative of theincrease of both the in-plane diameter and the height of theislands. In the O case, the second-order lobes observed along
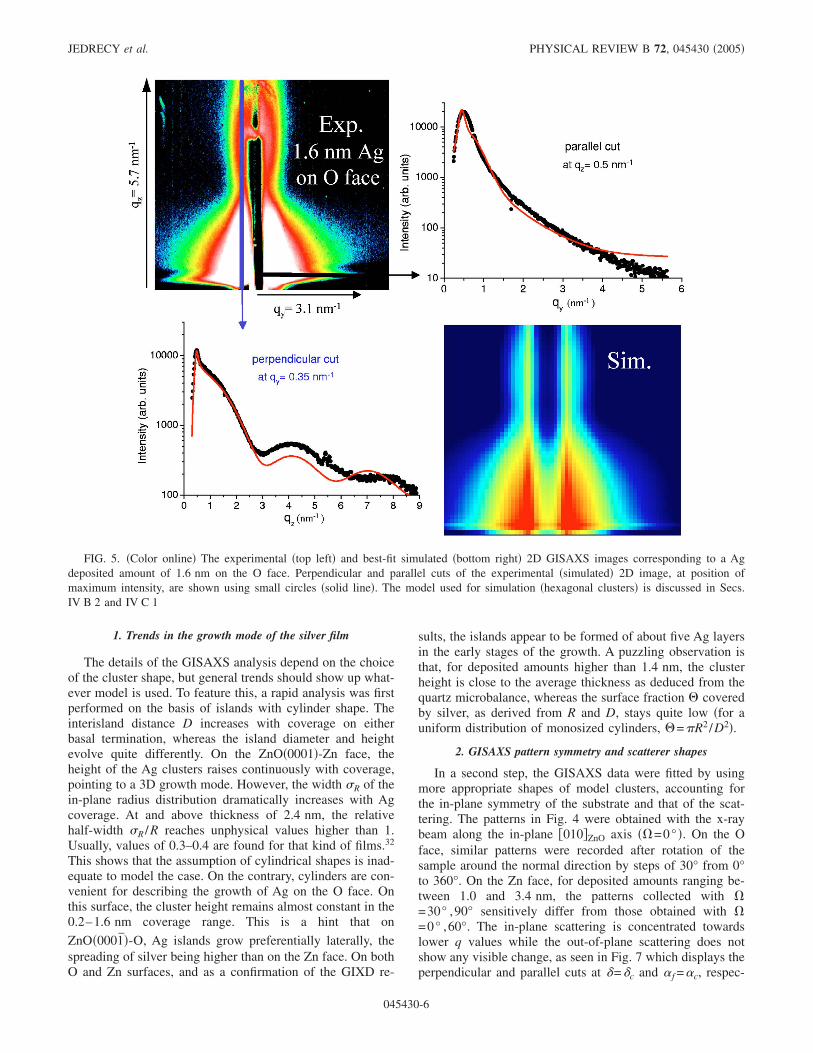
the surface normal direction for Ag thicknesses higher than0.4 nm, suggest the formation of clusters with a highdiameter/height aspect ratio and a well-defined top facet. Thesecond-order lobes correspond indeed to interferences be-tween the waves scattered by the island/support interface andthe waves scattered by the top facets. Because of the epitax-ial relationship, this top facet is of �111� orientation. TheGISAXS analysis is performed using the LMA model on thebasis of intensity cuts of the two-dimensional �2D� pattern,either perpendicular �I�� f� at fixed � f� or parallel �I�� f� atfixed � f� to the surface plane. One generally begins theanalysis with two cuts at the positions of maximum intensity�see Fig. 5�, that is at � f �c and at � f �c, where �c is therelevant angle for qy 2� /D. By use of Eq. �2.1�, one ob-tains the related intensity variations I�qz� �at fixed qy� andI�qy� �at fixed qz�. An overview of such intensity lines for thetwo surfaces is given at different Ag coverages in Fig. 6.Other cuts �at least 4 as a whole� are then considered torefine the models. The data were fitted using the dedicatedprogram ISGISAXS,31,35 based on �2 minimization and withwhich several island shapes may be tested, together withvarious size distributions. In all cluster models investigated,the distribution of the in-plane radius R and of the height Hhas been chosen as Gaussian with a half width at half maxi-mum given by �X
�2 ln 2, where X=R or H. Note the twodistributions were always found uncorrelated from eachother.
FIG. 4. �Color online� In situ GISAXS measurements during Agdeposition on the Zn0�0001� Zn-terminated surface �left column�and on the the Zn0�0001̄� O-terminated one �right column�. Theimages displayed in logarithmic color scales correspond to an an-gular aparture of �−1.9° ,2.3° � for � f and of �−0.4° ,3.4° � for � f.Correspondence in reciprocal space units is shown aside.
FLAT-TOP SILVER NANOCRYSTALS ON THE TWO… PHYSICAL REVIEW B 72, 045430 �2005�
045430-5
1. Trends in the growth mode of the silver film
The details of the GISAXS analysis depend on the choiceof the cluster shape, but general trends should show up what-ever model is used. To feature this, a rapid analysis was firstperformed on the basis of islands with cylinder shape. Theinterisland distance D increases with coverage on eitherbasal termination, whereas the island diameter and heightevolve quite differently. On the ZnO�0001�-Zn face, theheight of the Ag clusters raises continuously with coverage,pointing to a 3D growth mode. However, the width �R of thein-plane radius distribution dramatically increases with Agcoverage. At and above thickness of 2.4 nm, the relativehalf-width �R /R reaches unphysical values higher than 1.Usually, values of 0.3–0.4 are found for that kind of films.32
This shows that the assumption of cylindrical shapes is inad-equate to model the case. On the contrary, cylinders are con-venient for describing the growth of Ag on the O face. Onthis surface, the cluster height remains almost constant in the0.2–1.6 nm coverage range. This is a hint that on
ZnO�0001̄�-O, Ag islands grow preferentially laterally, thespreading of silver being higher than on the Zn face. On bothO and Zn surfaces, and as a confirmation of the GIXD re-
sults, the islands appear to be formed of about five Ag layersin the early stages of the growth. A puzzling observation isthat, for deposited amounts higher than 1.4 nm, the clusterheight is close to the average thickness as deduced from thequartz microbalance, whereas the surface fraction coveredby silver, as derived from R and D, stays quite low �for auniform distribution of monosized cylinders, =�R2 /D2�.
2. GISAXS pattern symmetry and scatterer shapes
In a second step, the GISAXS data were fitted by usingmore appropriate shapes of model clusters, accounting forthe in-plane symmetry of the substrate and that of the scat-tering. The patterns in Fig. 4 were obtained with the x-raybeam along the in-plane �010�ZnO axis ��=0° �. On the Oface, similar patterns were recorded after rotation of thesample around the normal direction by steps of 30° from 0°to 360°. On the Zn face, for deposited amounts ranging be-tween 1.0 and 3.4 nm, the patterns collected with �=30° ,90° sensitively differ from those obtained with �=0° ,60°. The in-plane scattering is concentrated towardslower q values while the out-of-plane scattering does notshow any visible change, as seen in Fig. 7 which displays theperpendicular and parallel cuts at �=�c and � f =�c, respec-
FIG. 5. �Color online� The experimental �top left� and best-fit simulated �bottom right� 2D GISAXS images corresponding to a Agdeposited amount of 1.6 nm on the O face. Perpendicular and parallel cuts of the experimental �simulated� 2D image, at position ofmaximum intensity, are shown using small circles �solid line�. The model used for simulation �hexagonal clusters� is discussed in Secs.IV B 2 and IV C 1
JEDRECY et al. PHYSICAL REVIEW B 72, 045430 �2005�
045430-6
tively, of the images recorded on the 3.4-nm-thick Ag filmusing different sample orientations.
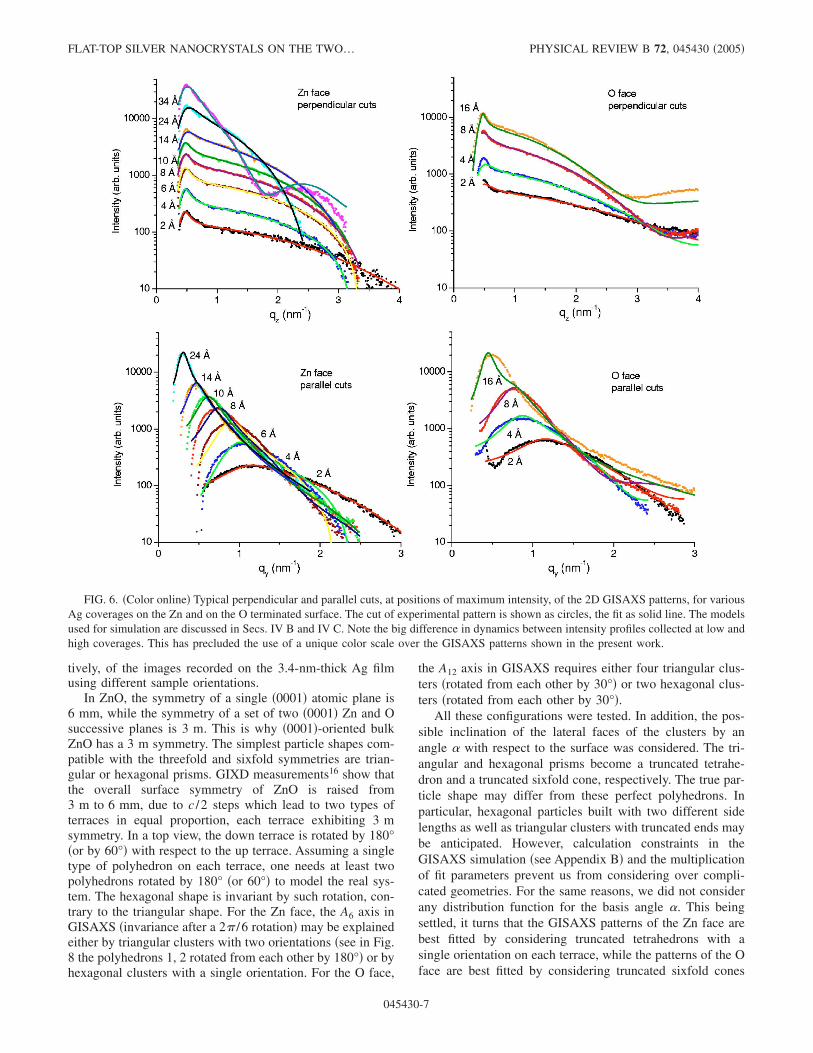
In ZnO, the symmetry of a single �0001� atomic plane is6 mm, while the symmetry of a set of two �0001� Zn and Osuccessive planes is 3 m. This is why �0001�-oriented bulkZnO has a 3 m symmetry. The simplest particle shapes com-patible with the threefold and sixfold symmetries are trian-gular or hexagonal prisms. GIXD measurements16 show thatthe overall surface symmetry of ZnO is raised from3 m to 6 mm, due to c /2 steps which lead to two types ofterraces in equal proportion, each terrace exhibiting 3 msymmetry. In a top view, the down terrace is rotated by 180°�or by 60°� with respect to the up terrace. Assuming a singletype of polyhedron on each terrace, one needs at least twopolyhedrons rotated by 180° �or 60°� to model the real sys-tem. The hexagonal shape is invariant by such rotation, con-trary to the triangular shape. For the Zn face, the A6 axis inGISAXS �invariance after a 2� /6 rotation� may be explainedeither by triangular clusters with two orientations �see in Fig.8 the polyhedrons 1, 2 rotated from each other by 180°� or byhexagonal clusters with a single orientation. For the O face,
the A12 axis in GISAXS requires either four triangular clus-ters �rotated from each other by 30°� or two hexagonal clus-ters �rotated from each other by 30°�.
All these configurations were tested. In addition, the pos-sible inclination of the lateral faces of the clusters by anangle � with respect to the surface was considered. The tri-angular and hexagonal prisms become a truncated tetrahe-dron and a truncated sixfold cone, respectively. The true par-ticle shape may differ from these perfect polyhedrons. Inparticular, hexagonal particles built with two different sidelengths as well as triangular clusters with truncated ends maybe anticipated. However, calculation constraints in theGISAXS simulation �see Appendix B� and the multiplicationof fit parameters prevent us from considering over compli-cated geometries. For the same reasons, we did not considerany distribution function for the basis angle �. This beingsettled, it turns that the GISAXS patterns of the Zn face arebest fitted by considering truncated tetrahedrons with asingle orientation on each terrace, while the patterns of the Oface are best fitted by considering truncated sixfold cones
FIG. 6. �Color online� Typical perpendicular and parallel cuts, at positions of maximum intensity, of the 2D GISAXS patterns, for variousAg coverages on the Zn and on the O terminated surface. The cut of experimental pattern is shown as circles, the fit as solid line. The modelsused for simulation are discussed in Secs. IV B and IV C. Note the big difference in dynamics between intensity profiles collected at low andhigh coverages. This has precluded the use of a unique color scale over the GISAXS patterns shown in the present work.
FLAT-TOP SILVER NANOCRYSTALS ON THE TWO… PHYSICAL REVIEW B 72, 045430 �2005�
045430-7

with two orientations �0 and 30°�. The schematic views inFig. 8 summarize the present findings.
About the Zn face, we outline that hexagonal clusters areclearly inadequate for reproducing the differences in the �=0° and �=30° patterns. The Ag cluster shape is thus re-lated to the specific symmetry of a terrace, as it results fromat least two Zn and O atomic layers. Differently, in the Ocase, the terrace symmetry is overpassed since two types ofclusters develop on each terrace. Consistently, scanning tun-neling microscopy �STM� of the bare surfaces has given evi-dence of triangular ZnO islands and holes on theZnO�0001�-Zn surface, and of big hexagonal holes on the
ZnO�0001̄�-O surface.27 The peculiar terrace topography ofthe Zn surface is likely determining the shape of the silverparticles on that face. The different island geometries ob-served on the Zn-terminated and on the O-terminated sur-faces can be viewed as an indirect consequence of the heal-ing mechanism of the surface polarity.
C. Growth mode of silver on the polar ZnO surfaces
1. The ZnO(0001̄)-O face
For the Ag/ZnO�0001̄�-O films, the results of data analy-sis in terms of hexagonal islands are reported in Table I andin Fig. 9 �see also the simulated GISAXS pattern of Fig. 5�.In addition to the values of �, 2R, �R /R, H, D, � derivedfrom the fits, the values of H /2R, , tc have been incorpo-rated in Table I. It is recalled that is the ZnO surfacefraction covered by silver as calculated from R, D, �, andthat tc is the equivalent thickness calculated from R, H, D,according to tc= �V� /D2 where �V� is the average volume ofa cluster. The H value remains almost constant for Ag depos-ited amounts between 0.2 and 1.6 nm, while the in-planeisland size 2R increases. Such enhanced lateral growth of theislands should lead to a progressive coverage of the surface.However, the average island separation D increases muchfaster than 2R. Hence, as already found with the crude cyl-inder model, decreases continuously. The parametersfound for a deposited amount of 1.6 nm lead to a value of tc
which is by one order of magnitude too small. Also, thecoherent domain size derived from GIXD �6.0 nm� is higherthan 2R �4.64 nm�.
A way to reconcile these apparently conflicting data is toassume the formation by coalescence of �i� large particleswhose GISAXS contribution is mostly hidden by the beamstop and �ii� complex faceted wormlike cluster shapes escap-ing any simple description. As the coverage increases, fol-lowing the well-known Babinet principle in classical optics,the x-ray GISAXS scattering is better modeled by a continu-ous thick layer with holes. A specific treatment was thusundertaken, the difference with island scattering comingfrom the multiple reflection-refraction processes �see Appen-dix A�. X-ray multiple reflection refraction by both thesilver-vacuum interface and the silver-ZnO interface, beforeor/and after the scattering event, are taken into account in theDWBA calculation of the form factor, whereas the simplescheme of supported islands involves the vacuum-ZnO inter-face alone �see Fig. 11 in Appendix A�.
The hole-related morphological parameters �hexagonalshapes were preserved� are given in Table I for Ag deposited
FIG. 7. �Color online� Perpendicular �upper panel� and parallel�lower panel� cuts of the 2D GISAXS images, corresponding to3.4 nm of Ag deposit on the Zn surface, and recorded for differentvalues �given in degrees� of the in-plane angle � between the�010�ZnO axis and the incident x-ray beam. The model is discussedin Secs. IV B 2 and IV C 2. The two maxima �see arrows� observednear qz 0.5 nm−1 result from x-ray reflection at the vacuum/ZnOand Ag/vacuum interfaces.
FIG. 8. �Color online� The geometry of polyhedrons used forsimulation of GISAXS. Each surface �Zn or O� is presented withtwo top terraces, turned from each other by 180° around the surfacenormal. In the Zn case, a single orientation occurs on top of a giventerrace whereas two orientations occur in the O case.
JEDRECY et al. PHYSICAL REVIEW B 72, 045430 �2005�
045430-8
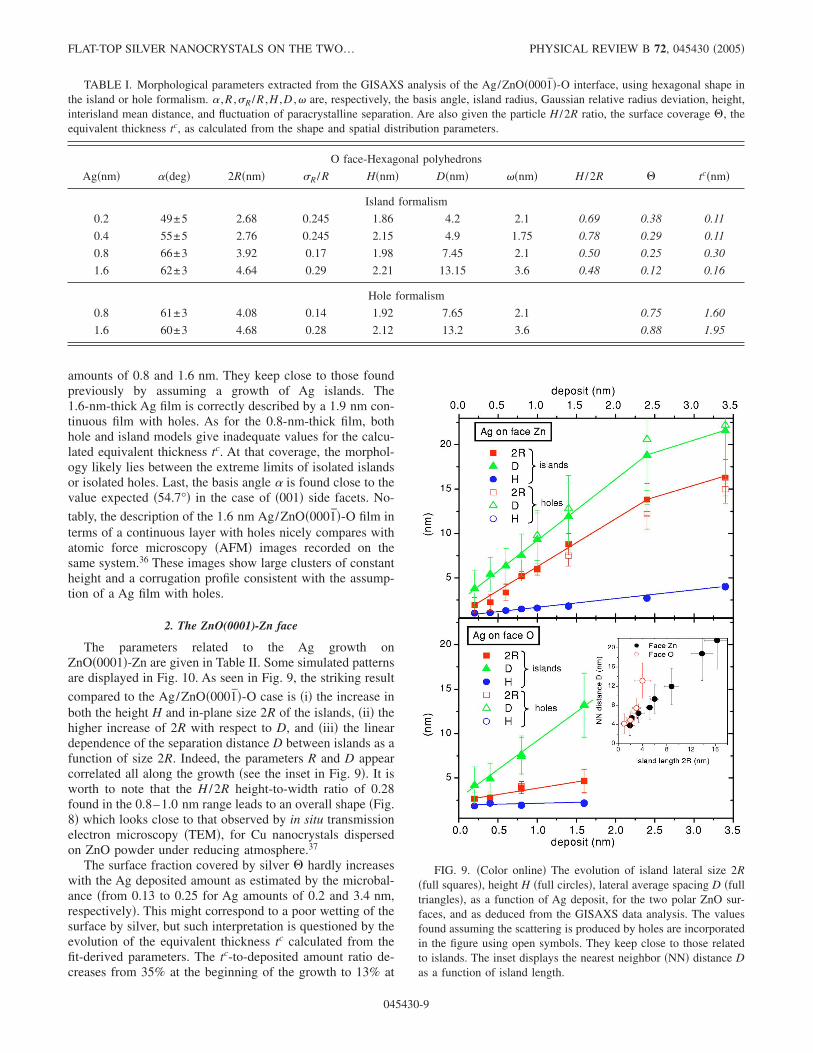
amounts of 0.8 and 1.6 nm. They keep close to those foundpreviously by assuming a growth of Ag islands. The1.6-nm-thick Ag film is correctly described by a 1.9 nm con-tinuous film with holes. As for the 0.8-nm-thick film, bothhole and island models give inadequate values for the calcu-lated equivalent thickness tc. At that coverage, the morphol-ogy likely lies between the extreme limits of isolated islandsor isolated holes. Last, the basis angle � is found close to thevalue expected �54.7°� in the case of �001� side facets. No-
tably, the description of the 1.6 nm Ag/ZnO�0001̄�-O film interms of a continuous layer with holes nicely compares withatomic force microscopy �AFM� images recorded on thesame system.36 These images show large clusters of constantheight and a corrugation profile consistent with the assump-tion of a Ag film with holes.
2. The ZnO(0001)-Zn face
The parameters related to the Ag growth onZnO�0001�-Zn are given in Table II. Some simulated patternsare displayed in Fig. 10. As seen in Fig. 9, the striking result
compared to the Ag/ZnO�0001̄�-O case is �i� the increase inboth the height H and in-plane size 2R of the islands, �ii� thehigher increase of 2R with respect to D, and �iii� the lineardependence of the separation distance D between islands as afunction of size 2R. Indeed, the parameters R and D appearcorrelated all along the growth �see the inset in Fig. 9�. It isworth to note that the H /2R height-to-width ratio of 0.28found in the 0.8–1.0 nm range leads to an overall shape �Fig.8� which looks close to that observed by in situ transmissionelectron microscopy �TEM�, for Cu nanocrystals dispersedon ZnO powder under reducing atmosphere.37
The surface fraction covered by silver hardly increaseswith the Ag deposited amount as estimated by the microbal-ance �from 0.13 to 0.25 for Ag amounts of 0.2 and 3.4 nm,respectively�. This might correspond to a poor wetting of thesurface by silver, but such interpretation is questioned by theevolution of the equivalent thickness tc calculated from thefit-derived parameters. The tc-to-deposited amount ratio de-creases from 35% at the beginning of the growth to 13% at
TABLE I. Morphological parameters extracted from the GISAXS analysis of the Ag/ZnO�0001̄�-O interface, using hexagonal shape inthe island or hole formalism. � ,R ,�R /R ,H ,D ,� are, respectively, the basis angle, island radius, Gaussian relative radius deviation, height,interisland mean distance, and fluctuation of paracrystalline separation. Are also given the particle H /2R ratio, the surface coverage , theequivalent thickness tc, as calculated from the shape and spatial distribution parameters.
O face-Hexagonal polyhedrons
Ag�nm� ��deg� 2R�nm� �R /R H�nm� D�nm� ��nm� H /2R tc�nm�
Island formalism
0.2 49±5 2.68 0.245 1.86 4.2 2.1 0.69 0.38 0.11
0.4 55±5 2.76 0.245 2.15 4.9 1.75 0.78 0.29 0.11
0.8 66±3 3.92 0.17 1.98 7.45 2.1 0.50 0.25 0.30
1.6 62±3 4.64 0.29 2.21 13.15 3.6 0.48 0.12 0.16
Hole formalism
0.8 61±3 4.08 0.14 1.92 7.65 2.1 0.75 1.60
1.6 60±3 4.68 0.28 2.12 13.2 3.6 0.88 1.95
FIG. 9. �Color online� The evolution of island lateral size 2R�full squares�, height H �full circles�, lateral average spacing D �fulltriangles�, as a function of Ag deposit, for the two polar ZnO sur-faces, and as deduced from the GISAXS data analysis. The valuesfound assuming the scattering is produced by holes are incorporatedin the figure using open symbols. They keep close to those relatedto islands. The inset displays the nearest neighbor �NN� distance Das a function of island length.
FLAT-TOP SILVER NANOCRYSTALS ON THE TWO… PHYSICAL REVIEW B 72, 045430 �2005�
045430-9

3.4 nm. A decrease of the sticking coefficient upon increas-ing the surface fraction covered by silver is unlikely for adeposition performed at room temperature. Therefore, it isconsistent to assume that, beyond a given Ag coverage,GISAXS scattering is �at least partly� generated by holesbetween the islands, and to model the system by a continu-ous film with holes, in the same way as for the O-terminatedface.
For the higher Ag deposited amounts, the hole scatteringscheme leads to calculated equivalent thicknesses in agree-ment with the values derived from quartz microbalance mea-surements �see Table II�. For intermediate coverage, thingsare less clear, and it is difficult to specify the moment atwhich hole scattering prevails with respect to island scatter-ing. On the Zn face, because arguments can be found to
favour either island or hole model, it is realistic to assumethat the two entities coexist in close proportion in the Agcoverage range under study. As a matter of fact, the nearestneighbor distance D increases with the island �hole� size 2Raccording to: D=1.3�2R. The proportionality between thetwo parameters, without any disruption in the full coveragerange examined, supports the assumption that correlated is-lands as well as correlated holes coexist on the surface, withthe same average size. The hole height-to-width ratio �about
TABLE II. Same parameters as for Table I but with triangular shape for islands or holes on the ZnO�0001�-Zn face.
Zn face-Triangular polyhedrons
Ag�nm� ��deg� 2R�nm� �R /R H�nm� D�nm� ��nm� H /2R tc�nm�
Island formalism
0.2 69±20 1.92 0.44 1.03 3.8 2.05 0.38 0.13 0.07
0.4 77±15 2.24 0.41 1.12 5.4 1.9 0.48 0.10 0.07
0.6 87±15 3.34 0.28 1.31 6.35 1.95 0.39 0.13 0.16
0.8 84±15 5.20 0.10 1.49 7.55 2.4 0.29 0.21 0.28
1.0 81±15 6.00 0.11 1.60 9.3 3.0 0.27 0.18 0.25
1.4 59±10 8.80 0.14 1.86 11.95 3.8 0.21 0.24 0.28
2.4 52±10 13.80 0.13 2.74 18.8 5.55 0.20 0.24 0.37
3.4 50±10 16.30 0.13 3.97 21.6 6.0 0.24 0.25 0.47
Hole formalism
1.0 84±15 5.94 0.12 1.62 9.8 2.8 0.83 1.38
1.4 75±10 7.50 0.16 1.78 12.8 3.7 0.85 1.56
2.4 63±10 12.18 0.14 2.69 20.6 5.75 0.85 2.42
3.4 60±10 14.98 0.10 4.07 22.2 6.1 0.80 3.63
FIG. 10. �Color online� Experimental �left� and simulated �right�2D GISAXS images corresponding to different Ag deposits on theZn face.
FIG. 11. �Color online� Schematic representation of the fourscattering events involved in the DWBA form factor of an island�Eq. �A11�� or of a hole in a layer �Eq. �A12��. In each situation, theeffective perpendicular wave vector transfer is given as well as theinvolved weighting amplitudes �see text�.
JEDRECY et al. PHYSICAL REVIEW B 72, 045430 �2005�
045430-10
0.25� keeps close to the island H /2R ratio found with the0.8 nm deposit. Nevertheless, the 3.4-nm-thick Ag film cov-ers a significant fraction of the ZnO surface, as evidenced bythe total reflection of x rays at the vacuum/Ag interface.Indeed, two maxima are featured in the intensity scatteredalong the surface normal direction at angles near �c
ZnO and�c
Ag �see Fig. 7� which demonstrate the occurrence of a flatsilver surface in addition to the trivial ZnO surface.
The basis angle � is not determined with accuracy, possi-bly because of actual shapes differing for the perfect tri-angles used in the simulation. It is found to evolve between
the two angles of 70.5° and 54.7° which correspond to �111̄�and �001� side facets, respectively. The two types of facetshave been observed by TEM �Ref. 37� for copper, with ap-parent preferential development for the �001� orientation.
V. DISCUSSION
Despite the significant differences between the
Ag/ZnO�0001�-Zn growth and the Ag/ZnO�0001̄�-O one,the growth proceeds on the two surfaces via oriented Agclusters which coalesce in the early stages and in which nostrain could be detected by x-ray analysis. Contrary to othermetal/oxide systems whose misfit results in strained islands,up to release through a network of interfacial dislocations,8
the Ag/ZnO system, with a lattice mismatch of −11%, leadsto �111� Ag islands in bulklike state. Those islands are azi-muthally oriented and show flat top terraces. A similar be-havior is observed for Cu/basal ZnO planes, whose latticemismatch is of −21%.16 The stabilization of the Ag particlesis understandable if one considers coincidence cells at themetal �111�/ZnO�001� interface. A quasiperfect coincidencemay be found by superimposing a 9�9 Ag cell on an 8�8 ZnO cell. The misfit is then +0.1%. By comparison, themisfit is −1.8% in the case of a 5�5 Cu cell superimposedon a 4�4 ZnO one. It is interesting to notice that the smallerdiameter deduced from GISAXS for the Ag�111� crystallites
on ZnO�0001̄�-O is close to 9 times the silver parameter �seethe 2R values for a thickness of 0.2 nm�.
Concerning the growth mode, the main observations are�i� the formation of flat-top silver clusters on bothO-terminated and Zn-terminated ZnO polar surfaces �as inthe case of Cu/ZnO�14 that allows the modeling of the sys-tem in the high coverage range by a continuous silver filmwith holes instead of isolated clusters and �ii� the betterspreading on the O surface than on the Zn surface. TheAg/ZnO behavior observed herein contrasts with the verypoor wetting by silver of wide band gap oxide surfaces, as itwas characterized by in situ optical reflectivity on MgO�100��Ref. 38� and �-Al2O3�0001�.39 In the case of the
ZnO�0001̄�-O surface, the constant height of the Ag clustersis consistent with an enhanced lateral growth and thus a highmetal/oxide sticking coefficient favoring the increase of theAg/ZnO interface instead of the increase of metal facets. Inthe present work, it is not possible to determine the criticalcoverage14 since the very first observation which has beenmade concerns already seven layers thick clusters. However,this first observation gives an upper limit of 0.38 for this
parameter. In the case of Ag/ZnO�0001�-Zn, a similar rea-soning leads to an upper limit of 0.13 for the critical cover-age. The two values are consistent, both in their magnitudeand in their hierarchy �the O face is better covered than theZn face�, with those determined for copper, 0.5 �Ref. 40� and0.35 �Ref. 15� on the O and Zn faces, respectively. On the Znsurface, a constant height-to-width ratio H /2R about 0.25 isinferred for the triangularly shaped Ag crystallites. This aswell as the parallel increase of the cluster diameter and of theintercluster distance are indicative of diffusion-mediated cap-ture of deposited adatoms, resulting in a strong correlationbetween island size and separation.41,42 The larger the islandis, the larger the island-free region around it. Here again, it isin favor of a sticking coefficient weaker than in the O case.Last, the preferred triangular versus hexagonal shape adoptedby the Ag nanocrystals on ZnO�0001�-Zn, and which may berelated to the specific topography �triangular bumps or holes�of this surface as it results from polarity, enlighten us on theimportance of template morphology.
The origin of the formation of flat-top metal clusters onthe basal planes of ZnO is an important issue, as well as theunderstanding of the difference in behavior between theO-terminated and Zn-terminated faces. Density-functionalcalculations regarding Cu adsorption on the two polar ZnOsurfaces have given evidence of a higher adhesion on the Osurface,17 in agreement with the expected ionic �metallic�character of the bonding between noble metal atoms andoxygen �zinc� ions. Meyer and Marx17 have connected thebinding energy to the way the polarity of the clean surfacesis cancelled. They argue that the binding energy decreases assoon as the bands of the oxide surface are filled by the 4selectrons of copper and suggest that the switching from 2Dislands �islands with a monoatomic thickness� to 3D clusters�as soon as the second layer appears� at the critical coveragecould be driven by thermodynamics, not only by kinetics.14
However, this theoretical treatment was done under the as-sumption of an ideally strained Cu �111� layer, whereascopper16 as well as silver �present work� grow epitaxiallywith their own lattice parameter. Also, the authors have con-sidered a full Cu monolayer and have ignored the particulartopography of the Zn surface as it is driven by polarity can-cellation. Finally, the lack of local registry between silver orcopper metals and zinc oxide, indicates that the short-rangeAg-ZnO bonding is likely not the main component of theinterfacial energy. Because �i� charge transfer from silver tooxide is generally reduced �same as gold� and �ii� the exis-tence of dipole at the surface of the oxide possibly enhancethe metal/oxide image interaction, long range forces �van derWaals and image interactions�43 might also play a role in thespreading of silver on ZnO.
VI. CONCLUSION
The growth of silver at room temperature on the two polar
�0001̄�-O and �0001�-Zn surfaces of ZnO has been studied insitu by GIXD and GISAXS. On both surfaces, silver formsnanoclusters with well-defined top facets, in �111� epitaxy
with �101̄�Ag� �100�ZnO. Importantly, the Ag clusters crys-
FLAT-TOP SILVER NANOCRYSTALS ON THE TWO… PHYSICAL REVIEW B 72, 045430 �2005�
045430-11

tallize with their intrinsic bulk parameter, without any detect-able strain, and this even at the very beginning of the growth.
Significant differences are found concerning the morphol-ogy of the films. GISAXS data demonstrate that triangularislands develop on the Zn face whereas the O face leads tohexagonal shapes. This behavior is connected to the specifictopography of the polar ZnO surfaces. As for the filmgrowth, the present GISAXS analysis has rapidly to dealwith isolated clusters plus coalesced particles with large di-ameter or shape escaping simple description. The Ag films athigh coverage �above 1 nm� were thus modeled by continu-ous layers with holes in it. On the O surface, Ag clustersgrow laterally while their height stays constant, so thatGISAXS is nicely represented by using first the island modelthen the hole model. On the Zn face, a mixture of clustersand holes with similar shapes and in close proportion is in-ferred.
Silver spreads better on the ZnO�0001̄�-O surface than onthe ZnO�0001�-Zn surface, as clearly evidenced by the frac-tions of the surface that are covered by silver for a givendeposited amount as well as by the way Ag clusters grow,i.e., mostly laterally on the O surface and both in height andin diameter on the Zn surface. The good spreading of silveron the basal ZnO planes, in particular on the O-terminatedsurface, likely follows an initial 2D growth up to a signifi-cant critical coverage, a behavior which compares with thatof Cu/ZnO. Such spreading, which can be unambiguouslydemonstrated herein by the small angle scattering GISAXSstudy, contrasts with the growth of silver on alumina or mag-nesium oxide surfaces, which involves isolated clusters withlow aspect ratios.
APPENDIX A: DIFFUSE SCATTERING CROSS SECTIONOF ISLANDS OR HOLES: FORM FACTOR
TREATMENT
The aim of this appendix is to recall the scattering formfactor of an island29 on a surface and derive that of a hole ina layer within the formalism of the distorted wave born ap-proximation. These two morphologies are the two extremelimits encountered during an heteroepitaxial growth. In smallangle scattering, the atomic structure of matter can be safelyignored; only the variation of the mean electronic density hasto be accounted for through the average local index of re-fraction n�r�. As for x-rays n�r�=1−�− i� is very close toone �����10−5�, the polarization effects can be neglectedand the propagation equation for the wave field ��r� is re-duced to a scalar one44
��2 + k02n2�r�� ��r� = 0, �A1�
where k0=2� /� is the vacuum wave vector and � the x-raywavelength. The distorted wave born approximation29,45–53 isa perturbative formalism applied on the Helmoltz equationEq. �A1� in order to get the scattering cross section. Definingby nj the index of refraction of medium j, where the indexesj=0,1 ,2 refer to vacuum, layer �or islands� and substrate,respectively, �n0=1 ,n1=1−�1− i�1 ,n2=1−�2− i�2�, the lo-cal index of refraction is written as
n2�r� = nj2�z� − �n2�r� = nj
2�z� − �ng2�
n
Sn�r� � ��r − r�,n� ,
�A2�
where, in the case of islands on a bare substrate: �ng2=1
−n12 and in the case of holes in a continuous layer of thick-
ness t: �ng2=n1
2−1. Sn�r� is the shape function of the island orthe hole n �one inside, zero outside� located at the r�,n posi-tion and � is the folding product.
The starting point consists in evaluating the so-calledFresnel wave fields for flat interfaces �F�r ,k� �Ref. 53� invacuum in the case of islands
�F�r,k� = �0e−ik�.r��A0+eikz,0z + e−ikz,0z�, where z � 0
�A3�
and inside the layer in the case of holes
�F�r,k� = �0e−ik�.r��A1+eikz,1z + A1
−e−ikz,1z�, where − t � z
� 0. �A4�
k� is the wave vector component parallel to the substratewhile the perpendicular component is given through theSnell–Descartes law: kz=−�k0
2−n2�z�k�2. The amplitudes Aj
±
of the upwards and downwards propagating waves in me-dium j are given by the matching conditions at each interfacethrough the classical Fresnel coefficients of reflection ri,j andtransmission ti,j between media i , j,
ri,j = ri,j�kz,i� =kz,i − kz,j
kz,i + kz,j, ti,j = ti,j�kz,i� =
2kz,i
kz,i + kz,j.
�A5�
For a bare substrate
A0+ = A0
+�kz,0� = r0,1, �A6�
while for a flat layer
A1− = A1
−�kz,1� =t0,1
1 + r0,1r1,2e2ikz,1t , A1+ = A1
+�kz,1�
=t0,1r1,2e2ikz,1t
1 + r0,1r1,2e2ikz,1t . �A7�
Within the theory of collisions in quantum mechanics,54 theT-matrix approach for scattering between the states ki and k fgives the incoherent scattering cross section
� d�
d��
inc=
k04
16�2� �F�r,k f��n2�r��F�r,ki�dr�2
.
�A8�
Only the amplitudes of the Fresnel fields �F�r� in vacuum�Eq. �A3�, z�0� for the island, and inside the layer �Eq.�A4�, −t�z�0� for the hole, respectively, are relevant forthe evaluation of the DWBA particle form factor through Eq.�A8�. The translation invariance along the interface �ex-pressed through the exponential prefactor in Eqs. �A3� and�A4� and the folding product of Eq. �A2�� allows to separatethe particle �island or hole� scattering cross section�d� /d��par and the interference between waves scattered by
JEDRECY et al. PHYSICAL REVIEW B 72, 045430 �2005�
045430-12

different particles. The interference effects between scatter-ers and their average along the particle size distribution pa-rameters were developed in Sec. IV A. The particle crosssection reads
� d�
d��
par=
k04
16�2 �ng22� �F�r,k f�S�r��F�r,ki�dr�2
.
�A9�
The Fresnel wave fields expressions Eqs. �A3� and �A4�show that four different scattering events need to be consid-ered with different scattering wave vector transfers qsc,z= ±ki,z,�01�±kf ,z,�01� that are associated to a scattering from anupwards or downwards to upwards or downwards propagat-ing wave. This is illustrated in Fig. 11. It is thus worth no-ticing that qz=kf ,z,0−ki,z,0 in vacuum is not sufficient to fullydefine the scattering process and that the involved wave vec-tor for holes is the one inside the layer k�i,f�,z,1 and not invacuum k�i,f�,z,0. The particle cross section can be written as
� d�
d��
par=
k04
16�2 �ng22F�q�,ki,z,0,kf ,z,0�2, �A10�
where for an island
F�q�,ki,z,0,kf ,z,0� = F�q�,kf ,z,0 − ki,z,0� + A0+�− kf ,z,0�F�q�,− kf ,z,0
− ki,z,0� + A0+�ki,z,0�F�q�,kf ,z,0 + ki,z,0�
+ A0+�ki,z,0�A0
+�− kf ,z,0�F�q�,− kf ,z,0 + ki,z,0��A11�
and for a hole
F�q�,ki,z,0,kf ,z,0� = A1−�ki,z,1�A1
−�− kf ,z,1�F�q�, + kf ,z,1 − ki,z,1�
+ A1+�ki,z,1�A1
−�− kf ,z,1�F�q�, + kf ,z,1 + ki,z,1�
+ A1−�ki,z,1�A1
+�− kf ,z,1�F�q�,− kf ,z,1 − ki,z,1�
+ A1+�ki,z,1�A1
+�− kf ,z,1�F�q�,− kf ,z,1 + ki,z,1� .
�A12�
The amplitudes Aj± are given for both cases by Eqs. �A6� and
�A7�, respectively. F�q� stands for the actual particle formfactor, i.e., the Fourier transform of its shape
F�q� = S�r�
eiq.rdr . �A13�
For an island, each term is multiplied by the reflection coef-ficient A0
+=r0,1 of the incident or scattered wave on the baresubstrate. In the hole case, the weights �Eq. �A7�� includeeither a transmission term at the vacuum-layer interface
r0,1�k�i,f�,z,1� or a reflection term at the layer-substrate inter-face r1,2�k�i,f�,z,1�, modulated by a Fabry–Pérot interferenceterm 1+r0,1�k�i,f�,z,1�r1,2�k�i,f�,z,1�e2ik�i,f�,z,1t inducing layerthickness interference fringes. As observed experimentallyon some GISAXS patterns, these weighting coefficients pro-duce a double Yoneda peak at � f �c, one linked to thesubstrate, the other one to the overlayer. To conclude, it isclear that these two extreme morphological cases give anoversimplified view of the growth process but lead to trac-table scattering cross section. In particular, a continuous tran-sition from island to hole case is expected with complicatedintermediate morphologies for which the DWBA perturba-tive formalism is expected to breakdown.
APPENDIX B: FORM FACTOR EXPRESSIONS
The Fourier transform of the shape depicted in Fig. 8 canbe calculated analytically
• truncated tetrahedron
Fte�q,R,H,�� =H
�3qx�qx2 − 3qy
2�eiqzR tan���/�3�− �qx
+ �3qy�sinc�q1H�eiq1L + �− qx
+ �3qy�sinc�q2H�e−iq2L + 2qx sinc�q3H�eiq3L� ,
q1 =1
2��3qx − qy
tan���− qz�, q2 =
1
2��3qx + qy
tan���+ qz�, q3
=1
2� 2qy
tan���− qz� ,
L =2 tan���R
�3− H , �B1�
• truncated prism with sixfold symmetry
Fco6�q,R,H� =4�3
3qy2 − qx
20
H
�qy2Rz
2 sinc�qxRz/�3�sinc�qyRz�
+ cos�2qxRz/�3�
− cos�qyRz�cos�qxRz/�3��eiqzzdz ,
Rz = R − z/tan��� ,
H/R � tan��� . �B2�
For holes, a mirror symmetry perpendicular to the z axis hasto be applied before using the previous formulas.
1 H. J. Freund, Surf. Sci. 500, 271 �2002�.2 J. Jupille, Surf. Rev. Lett. 8, 69 �2001�.3 W. Hirschwald, Zinc Oxide: Properties and Behaviour of the
Bulk, the Solid/Vacuum and Solid/Gas Interface, Material Sci-
ence, Vol. 7 �E. Kaldis North Holland, Amsterdam, 1981�.4 R. Zhang, A. Ludviksson, and C. Campbell, Surf. Sci. 289, 1
�1993�.5 E. Valkonen, B. Karlsson, and C. Rissing, Sol. Energy 32, 2121
FLAT-TOP SILVER NANOCRYSTALS ON THE TWO… PHYSICAL REVIEW B 72, 045430 �2005�
045430-13

�1984�.6 http://www-cenerg.ensmp.fr/ease/advanced_glazing.7 C. Henry, Surf. Sci. Rep. 31, 231 �1998�.8 G. Renaud, Surf. Sci. Rep. 32, 1 �1998�.9 M. Valden, X. Lai, and D. W. Goodman, Science 281, 1647
�1998�.10 C. T. Campbell, S. C. Parker, and D. E. Starr, Science 298, 811
�2002�.11 S. Roberts and R. Gorte, J. Chem. Phys. 93, 5337 �1990�.12 W. T. Petrie and J. M. Vohs, J. Chem. Phys. 101, 8098 �1994�.13 P. V. Radulovic, C. S. Feigerle, and S. H. Overbury, J. Phys.
Chem. 104, 3028 �2000�.14 C. T. Campbell, Surf. Sci. Rep. 27, 1 �1997�.15 J. Yoshihara, S. Parker, and C. Campbell, Surf. Sci. 439, 153
�1999�.16 N. Jedrecy, S. Gallini, M. Sauvage-Simkin, and R. Pinchaux,
Phys. Rev. B 64, 085424 �2001�.17 B. Meyer and D. Marx, Phys. Rev. B 69, 235420 �2004�.18 J. R. Levine, J. B. Cohen, Y. W. Chung, and P. Georgopoulos, J.
Appl. Crystallogr. 22, 528 �1989�.19 A. Naudon and D. Thiaudière, J. Appl. Crystallogr. 30, 822
�1997�.20 T. Metzger, I. Kegel, R. Paniago, and J. Peisl, J. Phys. D 32,
A202 �1999�.21 G. Renaud, R. Lazzari, C. Revenant, A. Barbier, M. Noblet, O.
Ulrich, F. Leroy, J. Jupille, Y. Borenstzein, C. R. Henry, J-P.Deville, F. Scheurer, J. Mane-Mane, and O. Fruchart, Science300, 1416 �2003�.
22 N. Jedrecy, J. Appl. Crystallogr. 33, 1365 �2000�.23 R. Baudoing-Savois, M. De Santis, M. Saint-Lager, P. Dolle, O.
Geaymond, P. Taunier, P. Jeantet, J. Roux, G. Renaud, and A.Barbier, Nucl. Instrum. Methods Phys. Res. B 149, 213 �1999�.
24 G. Renaud, M. Ducruet, O. Ulrich, and R. Lazzari, Nucl. Instrum.Methods Phys. Res. B 222, 667 �2004�.
25 N. Jedrecy, M. Sauvage-Simkin, and R. Pinchaux, Appl. Surf.Sci. 162–163, 69 �2000�.
26 O. Dulub, U. Dielbold, and G. Kresse, Phys. Rev. Lett. 90,016102 �2003�.
27 O. Dulub, L. Boatner, and U. Diebold, Surf. Sci. 519, 201 �2001�.28 A. Guinier and G. Fournet, Small-Angle Scattering of X-Rays
�Wiley, New York, 1955�.29 M. Rauscher, R. Paniago, H. Metzger, Z. Kovats, J. Domke, H.
D. Pfannes, J. Schulze, and I. Eisele, J. Appl. Phys. 86, 6763
�1999�.30 J. S. Pedersen, J. Appl. Crystallogr. 27, 595 �1994�.31 R. Lazzari, J. Appl. Crystallogr. 35, 406 �2002�.32 C. Revenant, F. Leroy, R. Lazzari, G. Renaud, and C. R. Henry,
Phys. Rev. B 69, 035411 �2004�.33 R. Hosemann and S. N. Bagchi, Direct Analysis of Diffraction by
Matter �North-Holland, Amsterdam, 1962�.34 R. Millane and J. Eads, Acta Crystallogr., Sect. A: Found.
Crystallogr. A56, 497 �2000�.35 R. Lazzari, ISGISAXS can be downloaded with an user guide from:
http://www.esrf.fr/computing/scientific/joint_projects/IsGISAXS/isgisaxs.htm �2002�.
36 R. Lazzari and J. Jupille, Surf. Sci. 482–485, 823 �2001�.37 P. Hansen, J. Wagner, S. Helveg, J. Rostrup-Nielsen, B. Clausen,
and Topsøe, Science 295, 2053 �2002�.38 R. Lazzari, J. Jupille, and Y. Borensztein, Appl. Surf. Sci. 142,
451 �1999�.39 R. Lazzari and J. Jupille, Phys. Rev. B 71, 045409 �2005�.40 K. H. Ernst, A. Ludviksson, R. Zhang, J. Yoshihara, and C. T.
Campbell, Phys. Rev. B 47, 13782 �1993�.41 M. C. Bartelt, A. K. Schmid, J. W. Evans, and R. Q. Hwang,
Phys. Rev. Lett. 81, 1901 �1998�.42 M. C. Bartelt, C. R. Stoldt, C. J. Jenks, P. A. Thiel, and J. W.
Evans, Phys. Rev. B 59, 3125 �1999�.43 F. Didier and J. Jupille, J. Appl. Phys. 58, 253 �1996�.44 S. Dietrich and A. Haase, Phys. Rep. 260, 1 �1995�.45 G. H. Vineyard, Phys. Rev. B 26, 4146 �1982�.46 S. K. Sinha, E. B. Sirota, S. Garoff, and H. B. Stanley, Phys. Rev.
B 38, 2297 �1988�.47 V. Holý, J. Kubena, I. Ohlídal, K. Lischka, and W. Plotz, Phys.
Rev. B 47, 15896 �1993�.48 V. Holý and T. Baumbach, Phys. Rev. B 49, 10668 �1994�.49 M. Rauscher, T. Salditt, and H. Spohn, Phys. Rev. B 52, 16855
�1995�.50 D. K. G. deBoer, Phys. Rev. B 49, 5817 �1994�.51 D. K. G. deBoer, Phys. Rev. B 51, 5297 �1995�.52 D. K. G. deBoer, Phys. Rev. B 53, 6048 �1996�.53 J. Daillant and A. Gibaud, X-Ray and Neutron Reflectivity: Prin-
ciple and Applications, Lectures notes in physics �Springer, NewYork, 1999�.
54 A. Messiah, Quamtum Mechanics �Dunod, Paris, 1964�, Vols.1–2.
JEDRECY et al. PHYSICAL REVIEW B 72, 045430 �2005�
045430-14