flagship report - water and sanitation program impacts of inadequate sanitation in bangladesh...
TRANSCRIPT

Flagship Report
Economic Impacts of Inadequate Sanitation in Bangladesh
2
Economic Impacts of Inadequate Sanitation in Bangladesh
Bangladesh Impact Study
WSP reports are published to communicate the results of WSP’s work to the development community. Some sources cited may be informal documents that are not readily available. The findings, interpretations, and conclusions expressed herein are entirely those of the author and should not be attributed to the World Bank or its affiliated organizations, or to members of the Board of Executive Directors of the World Bank or the governments they represent. The World Bank does not guarantee the accuracy of the data included in this work. The material in this publication is copyrighted. Requests for permission to reproduce portions of it should be sent to [email protected]. WSP encourages the dissemination of its work and will normally grant permission promptly. For more information, please visit www.wsp.org.
Editor: Marc P. DeFrancis
Created by: Write Media
© 2012 Water and Sanitation Program
Acknowledgements
The Sanitation Impact Study was first conducted in several East Asian countries by the World Bank’s Water and Sanitation Program (WSP), East Asia and Pacific office. From the East Asia experience, WSP developed a comprehensive methodology that is now being applied in many countries. Using this methodology, WSP carried out the study in 2010 in Bangladesh.
The study was conducted by Dr Abul Barkat, Professor, Economics Department, University of Dhaka, Dhaka, Bangladesh, over a year with two major peer-review processes. The team was led by Rokeya Ahmed (Water and Sanitation Specialist) and supported by Mark Ellery (Water and Sanitation Specialist) and Vandana Mehra (Communication Specialist) as the Task Team Leader. We are grateful to Dr Guy Hutton for his role in leading the development of the concept and developing the methodology for the Economics of Sanitation Initiative. He also made substantial contributions to this report and guided the team during the final stages to incorporate the peer reviewers’ comments in the final draft.
Key aspects of the study’s methodology and some of its preliminary results were presented at a workshop in April 2010, where valuable comments that greatly enhanced the quality of this report were received. In particular, the authors are thankful to Monzur Hossain, Secretary of the Local Government Division (MLGRDC); Zuena Aziz, Joint Secretary, MLGRDC; and Khaja Miah, Deputy Secretary, MLGRDC; and Hans Spruijt, head of the WES Section of UNICEF.
We are indebted to the external and internal peer reviewers of this document. Our thanks to Dr Iftekhar Hossain (DFID), Dr Md. Khairul Islam (WaterAid), Dr Tania Dmytraczenko (World Bank), and Karar Zunaid Ahsan (World Bank). Special thanks are also extended to Dr Anupam Tyagi, Dr Somnath Sen, Ravikumar Joseph, and Dr Selim Raihan for their comprehensive review of the first draft and suggestions for improvement.
Finally, we would like to express our appreciation to Tahseen Sayed, Operations Adviser, The World Bank, Bangladesh, and Christopher Juan Costain, Regional Team Leader, Water Sanitation Program in South Asia, for their overall guidance and support to this project.

3
Economic Impacts of Inadequate Sanitation in Bangladesh
www.wsp.org
Contents
Contents
List of Abbreviations...........................................................................................................................................................6
Preface...................................................................................................................................................................................7
Country Profile of Bangladesh..........................................................................................................................................8
Executive Summary.............................................................................................................................................................9
1. Introduction....................................................................................................................................................................15
Background.....................................................................................................................................................................15
Sanitation and Quality of Life........................................................................................................................................17
Overview of the Current Status of Sanitation...............................................................................................................18
Rationale of the Study...................................................................................................................................................20
2. Methodology..................................................................................................................................................................22
Introduction....................................................................................................................................................................22
Scope of the Study........................................................................................................................................................22
Main Sources of Data....................................................................................................................................................23
Estimation of Costs........................................................................................................................................................24
Health-Related Costs....................................................................................................................................................25
User Preference, Time Loss, and Welfare Cost...........................................................................................................40
Sensitivity Analysis........................................................................................................................................................43
Gains from Sanitation and Hygiene..............................................................................................................................44
Limitations of the Study.................................................................................................................................................45
3. Economic Impact Results............................................................................................................................................46
Overview of Results.......................................................................................................................................................46
Health Impacts...............................................................................................................................................................51
Domestic Water Impacts...............................................................................................................................................59
Access Time Impacts....................................................................................................................................................65
Sensitivity Analysis........................................................................................................................................................69
Potential Gains from Sanitation and Hygiene Interventions.......................................................................................70
4. Conclusion and Lessons Learned...............................................................................................................................71
Summary of Impacts......................................................................................................................................................71
Key Lessons Learned....................................................................................................................................................72
Annex A: Algorithms............................................................................................................................................................74
References.........................................................................................................................................................................77
List of Figures
Figure 1.1 Disease Transmission Path Through the F-Diagram.................................................................................15
Figure 1.2 Primary and Final Impact of Improved Sanitation Options.......................................................................16
Figure 1.3 Improved Sanitation Coverage Statistics for South Asian Countries, 1990 and 2004...........................19
Figure 3.1 Economic Impacts of Inadequate Sanitation, by Category......................................................................46
Figure 3.2 Summary of Economic Impacts of Inadequate Sanitation.......................................................................47
Figure 3.3 Economic Impacts of Inadequate Sanitation as Percent of GDP............................................................48
Figure 3.4 Health, Water-Related, and Access Time Impacts as Percent of Total Economic Impacts..................48
Figure 3.5 Per-Capita Economic Impacts of Inadequate Sanitation.........................................................................49

4
Economic Impacts of Inadequate Sanitation in Bangladesh
Bangladesh Impact Study
Figure 3.6 Per-Capita Financial Impacts of Inadequate Sanitation...........................................................................................50
Figure 3.7 Cases of Diarrhea and ALRI Resulting from Inadequate Sanitation........................................................................51
Figure 3.8 Deaths Attributed to Inadequate Sanitation as Percent of All-Cause Deaths........................................................52
Figure 3.9 Distribution of Health Economic Impacts of Inadequate Sanitation in Bangladesh in 2007..................................54
Figure 3.10 Distribution of Economic Impacts of Inadequate Sanitation by Diseases..............................................................54
Figure 3.11 Percent Distribution of Economic Impacts of Premature Mortality from Inadequate Sanitation..........................55
Figure 3.12 Distribution of Economic Impacts of Premature Mortality, by Age Category.........................................................55
Figure 3.13 Distribution of Economic Impacts of Inadequate Sanitation Via Premature Death Among Children Under Five.............................................................................................................................56
Figure 3.14 Economic Impacts of Morbidity as Percent of Health Impacts of Inadequate Sanitation, by Disease.................57
Figure 3.15 Percent Distribution of Economic Impacts of Morbidity Due to Inadequate Sanitation Among Treatment Cost and Productivity................................................................................................................................57
Figure 3.16 Percent Distribution of Morbidity Costs of Inadequate Sanitation..........................................................................58
Figure 3.17 Percent Distribution of Drinking Water Sources.......................................................................................................60
Figure 3.18 Domestic Water-Related Economic Impacts of Inadequate Sanitation, by Residence.........................................61
Figure 3.19 Percent of Households Using Various Drinking Water Treatment Methods...........................................................62
Figure 3.20 Percent Distribution of Annual Economic Impacts of Various Water Treatment Methods, by Location (Rural, Urban, and National).......................................................................................................................................63
Figure 3.21 Percent Distribution of Annual Economic Impacts Among Rural and Urban Locations, by Water-Treatment Method.............................................................................................................................................63
Figure 3.22 Percent Distribution of Cost of Piped Water Due To Inadequate Sanitation Among Rural and Urban Households.......................................................................................................................................................64
Figure 3.23 Percent Distribution of Economic Cost of Hauled Water Among Rural and Urban Households..........................64
Figure 3.24 Percent of Population Defecating in Open Places or Using Shared Toilets............................................................65
Figure 3.25 Access Time Lost Due to Inadequate Sanitation......................................................................................................67
Figure 3.26 Economic Cost of Access Time Lost Due to Inadequate Sanitation.......................................................................67
Figure 3.27 Lower Bound of Economic Cost of inadequate Sanitation In Schools and Workplaces.......................................68
Figure 3.28 Low, Base, and High Estimates for Total Economic Impacts of Inadequate Sanitation........................................69
Figure 3.29 Low, Base, and High Estimates for Health, Water, and Access Time Economic Impacts of Inadequate Sanitation.................................................................................................................................................69
List of Tables
Table 1.1 Joint Monitoring Program (JMP) Definition of Improved and Unimproved Sanitation and Water Supply.............17
Table 1.2 Improved Sanitation Coverage Statistics for Bangladesh, Asia, Africa, and Latin America (by Region) (in Percentage of Population), 1990 and 2004......................................................................................18
Table 1.3 The Sanitation Situation in Bangladesh in 2006: Percent of Population with Access to Each Type of Sanitation, by Rural and Urban Residence............................................................................................................19
Table 1.4 Personal Hygiene Practices in Bangladesh, 2006: Percent of Population, by Rural and Urban Residence........20
Table 2.1 Aspects of Sanitation Included and Excluded in the Present Sanitation Impact Study........................................22
Table 2.2 Financial Costs and Nonmonetary Costs of Poor Sanitation..................................................................................25
Table 2.3 Diseases Attributable to Poor Sanitation Included in this Study.............................................................................25
Table 2.4 Disease-Specific Deaths by Age Group....................................................................................................................26
Table 2.5 Current and Counterfactual Rates of Underweight Prevalence...............................................................................27
Table 2.6 Relative Risk of Mortality by Degree of Underweight for Children Under Age Five...............................................27
Table 2.7 Attributable Fraction for Malnutrition, Selected Diseases........................................................................................28
Table 2.8 Total Annual Deaths Due to Inadequate Sanitation, by Disease and Age Group...................................................29
Table 2.9 Total Death Rates Among Children Under Age Five.................................................................................................29
Table 2.10 Economic Cost of a Premature Death Using the HCA and VOSL Approaches......................................................31
Table 2.11 Population Age Distribution, 2008..............................................................................................................................31

5
Economic Impacts of Inadequate Sanitation in Bangladesh
www.wsp.org
Table 2.12 Annual Diarrheal Disease Cases, by Age Group.......................................................................................................32
Table 2.13 Percentage of Persons Treated for Helminthes During the Year (percent).............................................................32
Table 2.14 Relative Risk of Illness by Degree of Underweight...................................................................................................33
Table 2.15 ALRI Prevalence Rate (Percent) for Children Under Five.........................................................................................33
Table 2.16 Attributable Fraction for Malnutrition, ALRI, and Malaria.........................................................................................33
Table 2.17 Annual ALRI and Malaria Cases Attributable to Poor Sanitation, Children Under Five.........................................34
Table 2.18 Percentage of Diarrheal Cases Treated, by Place of Treatment, Children Under Five..........................................34
Table 2.19 Percentage of ALRI Cases Treated, by Place of Treatment, Children Under Five..................................................34
Table 2.20 Household Water Treatment, by Method (Percent of Households).........................................................................36
Table 2.21 Percentage Distribution of Households Using Fuel for Cooking, by Fuel Type......................................................36
Table 2.22 Financial and Nonmonetary Costs of Treating Drinking Water................................................................................38
Table 2.23 Annual Cost of Water Treatment (Boiling and Bleach) per Household...................................................................38
Table 2.24 Percent and Number of Households Using Piped Drinking and Non-Drinking Water...........................................39
Table 2.25 Annual Consumption of Piped Water.........................................................................................................................39
Table 2.26 Fetching Drinking Water: Number of Households and Average Time Spent..........................................................39
Table 2.27 Percent of Population with No Toilet Facility, by Age Group...................................................................................40
Table 2.28 Percent of Population Defecating in Open Places, by Age Group...........................................................................41
Table 2.29 Percent of Population Using Shared Latrines, by Age Group...................................................................................41
Table 2.30 PopulatIon Defecating In Open and Using Shared Latrines, by Age Group............................................................41
Table 2.31 Number and Percent of Girls Ages 10 to 19 in Schools Without Separate Toilets................................................42
Table 2.32 Women Absent from Work Due to Poor Sanitation at the Workplace.....................................................................43
Table 2.33 Ranges of Parameter Values Used in Sensitivity Analysis.......................................................................................43
Table 2.34 Diarrhea Incidence Reduction from Types of Sanitation and Hygiene Intervention...............................................44
Table 2.35 Benefits from Sanitation and Hygiene Interventions, by Intervention Type............................................................44
Table 3.1 Economic and Financial Impacts of Inadequate Sanitation.....................................................................................47
Table 3.2 Per-Capita Economic and Financial Impacts of Inadequate Sanitation..................................................................49
Table 3.3 Potential Economic Gains from Sanitation and Hygiene Interventions...................................................................50
Table 3.4 Annual Cases of Diarrhea and ALRI Attributable to Sanitation.................................................................................52
Table 3.5 Percent of Deaths Attributable to Inadequate Sanitation and Hygiene, by Disease and Age Group...................53
Table 3.6 Deaths, Cases, and Time Lost from Inadequate Sanitation.....................................................................................53
Table 3.7 Health-Related Economic Impacts of Inadequate SanItation from Various Diseases............................................56
Table 3.8 Age Distribution of Treatment Costs of Sanitation-Related Diseases (Tk. Million).................................................58
Table 3.9 Health-Related Productivity and Welfare Costs of Inadequate Sanitation, by Disease and Age Group (Tk. Million)...................................................................................................................................................................59
Table 3.10 Sources of Household Drinking Water (in Percent of Households).........................................................................60
Table 3.11 Domestic Water-Related Economic Impacts of Inadequate Sanitation, by Location and Type of Impacts.........61
Table 3.12 Economic Impacts from Treatment of Household Water Due to Inadequate Sanitation (Tk. Million)...................62
Table 3.13 Percent Distribution of Household Access to Various Types of Toilet, Urban vs. Rural........................................66
Table 3.14 Number of Persons and Percent of Population Defecating in the Open and Using Shared Toilets, Urban vs. Rural............................................................................................................................................................66
Table 3.15 Economic Cost of Extra Time Spent in Accessing Open Defecation Sites and Shared Toilets, Urban vs. Rural............................................................................................................................................................68
Table 3.16 Lower Bound of Economic Cost of Inadequate Sanitation in Schools and Workplaces, Urban vs. Rural...........69
Table 3.17 Potential Gains from Sanitation and Hygiene Interventions....................................................................................70

6
Economic Impacts of Inadequate Sanitation in Bangladesh
Bangladesh Impact Study
List of Abbreviations
ALRI acute lower respiratory infections
BDHS Bangladesh Demographic and Health Survey
DGHS Directorate General of Health Services
ESI Economics of Sanitation Initiative (World Bank)
GDP gross domestic product
HCA Human Capital Approach
ICDDR,B International Centre for Diarrheal Disease Research, Bangladesh
JMP Joint Monitoring Program
LPG liquefied petroleum gas
MDG Millennium Development Goals
MICS Multiple Indicator Cluster Survey
OECD Organisation for Economic Co-operation and Development
Tk. Taka (currency of Bangladesh)
UALS unemployment-adjusted labor share
UNICEF United Nations Children’s Fund
VOSL Value of Statistical Life
WHO World Health Organization
WSP Water and Sanitation Program

7
Economic Impacts of Inadequate Sanitation in Bangladesh
www.wsp.org
Preface
Access to sanitation facilities is a fundamental human right that acts as a safeguard to health and dignity. When sanitation systems fail or are inadequate, the impacts on the health of the community, the health of others, and the environment can be extremely serious. Good sanitation is vital for good health and for wealth creation as well. The economic benefits of improved sanitation include savings in health costs, higher worker productivity, better school attendance and quality of education, and reduced water treatment costs.
Contamination of water sources by improper sanitation is a form of man-made pollution, one that is of serious concern. One out of three people in the world does not have access to good sanitation, and one out of six people in the world does not have access to clean and safe water. Most of these people live in Africa, Asia, and South America. Providing adequate sanitation facilities for everyone is a major challenge for developing countries. In Asia in particular, people without access make up 62 percent of the population, and
the biggest killers of young children are diarrheal disease and acute lower respiratory infections (ALRI) via diarrhea-induced malnutrition.
To gather strong evidence on the impact of poor sanitation on both human beings and the environment, the World Bank’s Water and Sanitation Program (WSP) has developed a global research program, the Economics of Sanitation Initiative (ESI). This study estimates the economic impact of inadequate sanitation in Bangladesh as part of that larger research program.
There is no denying the fact that improving sanitation should be a very high priority for the economic development of Bangladesh. This study provides evidence and information on the links between poor sanitation and economic development in this country. It also provides conservative estimates of the economic effects inadequate sanitation has on health, water, and people’s time (due to access to latrines).

8
Economic Impacts of Inadequate Sanitation in Bangladesh
Bangladesh Impact Study
Indicator 2007
Infant mortality rate (per thousand) 52
Under-five mortality rate (per thousand) 65
Percent of children under age five with diarrhea treated with ORT 81.2
Percent of children under age five with diarrhea treated with increased fluid intake 48.1
Percent of children under age five with symptoms of ALRI seeking care from a trained provider 37.1
Nutritional status of children (percent of children under age five considered malnourished
according to:)
Height-for-age (stunting)
Severe 16.1
Moderate or severe 43.2
Weight-for-height (wasting)
Severe 2.9
Moderate or severe 17.4
Weight-for-age (underweight)
Severe 11.8
Moderate or severe 41.0
Proportion of total population using an improved sanitation facility 39
COUNTRy PROfILE Of BANgLAdESh

9
Economic Impacts of Inadequate Sanitation in Bangladesh
www.wsp.org
Executive Summary
Over the last two decades, Bangladesh has emerged as the leader in experimenting with and implementing innovative approaches to rural sanitation in Asia. At the First South Asian Conference on Sanitation (SACOSAN) in 2003, the Government of Bangladesh announced its target of ‘Sanitation for All by 2010.’ This commitment was reflected in the first National Strategy for Accelerated Poverty Reduction (Planning Commission, 2005). Since 2003, the percentage of people defecating in the open has declined dramatically. More than 88 percent of the population now has access to latrines, although these are mainly low-cost pit latrines. According to the Joint Monitoring Program of the World Health Organization (WHO) and UNICEF, Bangladesh’s sanitation coverage rose from 20 percent in 1990 to 39 percent in 2004
and then to 53 percent as of 2008. In recognition of the challenges, the Government of Bangladesh has revised its ambitious target of ‘Sanitation for All’ from completion by 2010 to completion by 2013, a goal that would still be well ahead of the MDG target.
This study estimates the nonmonetary, financial, and economic costs of poor sanitation in the areas of health, drinking water, and domestic water, as well as user preference and welfare. Financial costs refers to the direct financial expense paid in monetary terms by someone, such as changes in household and government spending and real income losses for households. Nonmonetary costs consist of both longer-term financial impacts (such as less educated children, fewer children, and loss of working
249.19295.48
14.5131.78
Health Water Access time
Totaleconomic
cost
5.316.3
0.310.68
Health Water Access time
Totaleconomic
cost
ECONOMIC IMPACT OF INADEQUATE SANITATION
ECONOMIC IMPACT OF INADEQUATE SANITATION (AS PERCENT OF GDP)
(in billion Taka)

10
Economic Impacts of Inadequate Sanitation in Bangladesh
Bangladesh Impact Study
people due to premature death or relevant morbidity), and nonfinancial implications, such as the value of loss of life, time-use of adults and children, and intangible impacts.
• Thisreportestimatesthatinadequatesanitationhassubstantial economic impacts in Bangladesh. The estimated annual economic impact of inadequate sanitation is Tk. 295.48 billion ($4.23 billion1) which is equivalent to 6.3 percent of the GDP.2
• Losses related to health are the single largestcontributor to the economic impact due to inadequate sanitation and hygiene. These health-related losses are equal to Tk. 249,186 million, which is 84 percent of the total economic impact
and equivalent to 5.3 percent of the country’s GDP in 2007.3
• Thewater-relatedimpactofinadequatesanitation,resulting from the costs of accessing cleaner water, is Tk. 14,510 million, which is 5 percent of the total economic impact and equivalent to 0.3 percent of GDP in 2007.4
• Welfareandtimelosses,whichstemfromnothavingproper access to toilet facilities, are Tk. 31,779 million, which is 11 percent of the total economic impact and equivalent to 0.7 percent of GDP.5
• Financial losses, resulting fromhealth aswell aswater-related financial losses, are estimated to be Tk. 34,554 million ($494 million) in 2007.6 This
1 Throughout this report, all dollar figures are in US dollars, measured by a conversion of 1 US$ = Bd. Taka 70.2 In 2009 prices, it is Tk. 339.802 billion ($4.85 billion), which is 5.53 percent of GDP in 2009.3 In 2009 prices, it is Tk. 286,563.9 million, which is 4.66 percent of GDP in 2009.4 In 2009 prices, it is Tk. 16,686.5 million, which is 0.27 percent of GDP in 2009.5 In 2009 prices, it is Tk. 36,568.85 million, which is 0.59 percent of GDP in 2009.6 In 2009 prices, it is Tk. 39,737.1 million, which is equivalent to $567.6 million.
PER-CAPITA ECONOMIC IMPACT
DISTRIBUTION OF MORBIDITY COSTS BY DISEASE
Diarrhea, 88%Intestinal worms, 3%
Malaria, 0.001%
ALRI, 9%
102 223
2,072
Health Water Access time Total impact
1,747
(in Tk.)

11
Economic Impacts of Inadequate Sanitation in Bangladesh
www.wsp.org
represents 12 percent of total economic impacts and is equivalent to 0.7 percent of the GDP.7
• Totalper-capitaeconomicimpactsduetoinadequatesanitation and hygiene are Tk. 2,072 ($29.60). Of this amount, Tk. 1,747 ($25) per capita is the loss related to health, Tk. 102 ($1.50) is related to water, and Tk. 223 ($3.20) is related to access time.8
• Financial loss per capita due to inadequate sanitation and hygiene is Tk. 242 ($3.50), of which Tk. 213 ($3.00) per capita is the loss related to health and Tk. 29 ($0.40) per capita is related to water.9
• Of the total health-related economic impacts, 13 percent (Tk. 31,941 million)10 can be attributed
to productivity losses from poor sanitation and hygiene. The costs of treatment represent 9 percent (Tk. 22,144 million) and the costs of premature deaths 78 percent (Tk. 195,101 million) of the total health impacts.11 Deaths, treatment, and productivity losses caused by diarrhea have the largest impacts in each of these categories of health impacts.
Reviewing the different kinds of economic losses according to the disease vector through which they occur, the impacts of inadequate sanitation can be further broken down this way:
• Productivity losses make up 18 percent (Tk. 29,030 million) of diarrheal impacts, 33 percent
7 It is 0.65 percent of GDP in 2009. 8 In 2009 prices, the economic cost due to inadequate sanitation and hygiene is Tk. 2,382 ($34.04), the loss related to health is Tk. 2,009.05 ($28.7), the loss related to water is Tk. 117.3 ($1.68), and the loss related to access time is Tk. 256.45 ($3.66).9 In 2009 prices, per capita financial impacts related to health amount to Tk. 278.3 ($3.98) and those related to water amount to Tk. 33.35 ($0.48).10 In 2009 prices, Tk. 36,732.15 million.11 In 2009 prices, the cost of treatment is Tk. 25,465.6 million and impact due to premature deaths is Tk. 224,366.15 million.
Diarrhea Helminthes ALRI Measles Malaria Other causesPremature death 70% 26% 85% 100% 99.9% 100%Treatment 12% 41% 8% 0.04%Productivity 18% 33% 6% 0.05%
0%
20%
40%
60%
80%
100%
DISTRIBUTION OF HEALTH-RELATED ECONOMIC IMPACTS
ECONOMIC IMPACT OF INADEQUATE SANITATION, BY DISEASE
Productivity loss, 13%
Treatment costs, 9% Premature death, 78%

12
Economic Impacts of Inadequate Sanitation in Bangladesh
Bangladesh Impact Study
(Tk. 714 million) of helminthes (intestinal worms) impacts, 6 percent (Tk. 2,197 million) of ALRI impacts, and 0.05 percent (Tk. 0.24 million) of malaria impacts.12
• Economic losses due to premature deaths make up 70 percent (Tk. 110,489 million) of diarrheal impacts, 26 percent (Tk. 549 million) of helminthes impacts, 85 percent (Tk. 29,762 million) of ALRI impacts, 100 percent (Tk. 9,773) of measles impacts, 99.9 percent (Tk. 470 million) of malaria impacts, and 100 percent (44,058) of impacts through other causes.13
• Economic losses due to morbidity constitute a good share of the health impacts within each disease category: 0.1 percent of losses from malaria, 15 percent of those from ALRI, 74 percent of those from helminthes, and 30 percent of those from diarrheal impacts result from morbidity.
Of the total morbidity cost due to inadequate sanitation, diarrhea accounts for 88 percent, ALRI for 9 percent, and helminthes for 3 percent. Therefore, diarrhea is the single most
responsible cause for the high cost of morbidity due to poor sanitation in Bangladesh.
• The impact on total domestic water costs due to inadequate sanitation is equal to Tk. 14.51 billion.14
Of this amount, the total economic cost15 of treating household water is Tk. 9.84 billion, 68 percent of the total.16 The costs incurred in accessing piped water (including relocating) add up to Tk. 1.13 billion (8 percent), and the cost of hauling cleaner water from outside the household premises is Tk. 3.54 billion (24 percent).17 The financial cost of household water treatment is Tk. 3.04 billion (73 percent), and the financial cost of piped water attributable to sanitation is Tk. 1.13 billion (27 percent).18
• Theestimatedtotalcostsduetoloss of time by persons lacking adequate facilities is equal to Tk. 31.78 billion.19 An extra 5,119 million hours were spent accessing open defecation sites and shared toilets in 2007. The economic cost of this lost access time is estimated to be Tk. 30.11 billion.20 Of this total, 3.47 billion hours and Tk. 17.36 billion (57 percent)
12 In 2009 prices, productivity losses are Tk. 33,384.5 million of diarrheal impacts, Tk. 821.1 million of helminthes impacts, Tk. 2,526.55 million of ALRI impacts, and Tk. 0.276 million of malaria impacts.13 In 2009 prices, among premature deaths, diarrheal impacts cost Tk. 127,062.35 million, helminthes impacts cost Tk. 631.35 million, ALRI impacts cost Tk. 34.23 million, measles impacts cost Tk. 11,238.95 million, malaria impacts cost Tk. 540.5 million, other causes impacts cost Tk. 540.5 million.14 In 2009 prices, it is Tk. 16.685 billion.15 Note: The study estimated both economic costs and financial costs, which are not the same thing. Economic cost equals financial cost plus nonmonetary cost. Financial costs are the direct expenses paid in financial terms. Nonmonetary costs include time spent for collecting fuel wood, storing boiled water, and so on, as explained elsewhere in this report. In the above example of the cost of household treatment of water, Tk. 9.84 billion is the economic (total) cost and Tk. 3.04 billion is the financial cost. 16 In 2009 prices, it is Tk. 10.902 billion.17 In 2009 prices, the cost of piped water is Tk. 1.3 billion and of hauling water is Tk. 4.07 billion.18 In 2009 prices, the cost of household water treatment is Tk. 3.5 billion and of piped water used for sanitation is Tk. 1.3 billion.19 In 2009 prices, it is Tk. 36.547 billion.20 In 2009 prices, it is Tk. 34.65 billion.
ECONOMIC IMPACT OF MORBIDITY BY DISEASE
30%
74%
15%
0.1%
22%
0%
20%
40%
60%
80%
Diarrhea Intestinal worms ALRI Malaria Total

13
Economic Impacts of Inadequate Sanitation in Bangladesh
www.wsp.org
in costs are due to extra time used in accessing open defecation sites, and 1,647 million hours and Tk. 12.75 billion (43 percent) in costs are due to the extra time used to reach shared toilets.21 The economic costs of inadequate sanitation in schools due to the loss of time is estimated to be Tk. 853.37 million for girls and Tk. 813.96 million for working women, totaling Tk.1.67 billion.22
• Sensitivity analysis has been conducted usingdifferent input values for low, base, and high estimates of inadequate sanitation in Bangladesh in 2007. It appears that the low-case estimate for economic impacts is Tk. 176,510 million (equivalent to 3.7 percent of GDP), the high-case estimate is Tk. 813,006 million (equivalent to 17.2 percent of GDP), and the base-case estimate is Tk. 295,476 million (equivalent to 6.3 percent of GDP).23
• Thestudyestimatesthatimproved hygiene behavior could have resulted in gains of Tk. 143,913 million (equivalent to 3.0 percent of GDP), or Tk. 1,009 per person.24 Improved sanitation could have led to gains of Tk. 111,519 million (equivalent to 2.4 percent of GDP), or Tk. 782 per capita.25 Interventions that increased access to safe, quality water could have led
to gains worth Tk. 110,559 million (equivalent to 2.3 percent of GDP), or Tk. 775 per person.26
• Much of the water contamination occurs dueto improper containment and disposal of fecal matter. Interventions that aim at safe confinement and disposal of fecal matter after appropriate sewage treatment would have generated gains of Tk. 93,116 million (equivalent to 2 percent of GDP), or Tk. 653 per person.27
RECOMMENDATIONSBased on the research findings, seven major recommendations are proposed, as follows:
Increased investment in water and sanitation is neededIt is important to ensure that sanitary latrines are within easy access of every household, including urban households, by promoting multiple technology options. These range from pit latrines to water-borne sewerage, with special focus on helping households move from very basic latrines to sustainable options. The increased investment should also aim to install public latrines in schools, bus stations, and important public places and community latrines in densely
176,510
295,476
813,006
3.7%6.3%
17.2%
100,000
300,000
500,000
700,000
900,000
0.0%
4.0%
8.0%
12.0%
16.0%
20.0%
Low Base High
As
perc
ent o
f GD
P
Tk million % of GDP
21 In 2009 prices, costs due to extra time used in accessing open defecation sites is Tk. 19.964 billion and accessing shared toilets is Tk. 14.66 billion.22 In 2009 prices, cost of inadequate sanitation is Tk. 981.3755 million for girls and Tk. 936.054 million for working women, totalling Tk. 1.92 billion.23 In 2009 prices, low-case estimate is Tk. 202,986.5 million (3.30 percent of 2009 GDP), high-case estimate is Tk. 813,006 million (13.22 percent of 2009 GDP), and base-case estimate is Tk. 339,797.4 million (5.52 percent of 2009 GDP).24 In 2009 prices, gains is Tk. 143,913 million (2.34 percent of 2009 GDP), or Tk. 1.16 per person.25 In 2009 prices, gains is Tk. 128,246.85 million (2.08 percent of 2009 GDP), or Tk. 899.2 per person.26 In 2009 prices, gains is Tk. 127,188.85 million (2.07 percent of 2009 GDP), or Tk. 891.25 per person.27 In 2009 prices, gains is Tk. 107,083.4 million (1.74 percent of 2009 GDP), or Tk. 750.95 per person.
LOW-, BASE-, AND HIGH-CASE ESTIMATES OF TOTAL ECONOMIC IMPACT
(in million Tk.)

14
Economic Impacts of Inadequate Sanitation in Bangladesh
Bangladesh Impact Study
populated poor communities without sufficient space for individual household latrines. Also very important is ensuring proper storage, management, and use of surface water and preventing its contamination.
A communication campaign is needed Bangladesh’s progress in sanitation has been largely due to social action, mobilized by a communications campaign. While there has been an admirable use of a wide variety of communication materials, standardization and uniformity have been missing, and the materials have often been used in an ad hoc fashion without a systematic and reinforcing media plan. Therefore, in order to improve sanitation further, a more dynamic communications strategy, including a comprehensive media plan, is needed to mobilize communities.
Hygiene education strategies are needed There is a need to develop effective and replicable hygiene education outreach strategies to promote behavior change. In primary schools, children should be educated about safe water, sanitation, and personal hygiene. There is a need to give primary stakeholders the knowledge and the means to make informed choices about hygiene practices and water and sanitation facilities. There is a need to give primary stakeholders options for safe disposal of excreta. It is also important to ensure that a functioning institutional framework is in place to support these needs. Moreover, the issue of total sanitation coverage also demands a conception of sanitation that goes beyond excreta disposal to include the environmental sanitation issues associated with the hygienic management of solid waste, wastewater, and storm water.
Local government needs to be more proactive It is absolutely necessary to build the capacity of local governments and communities to deal more effectively with problems relating to water supply and sanitation. The structure of the local government should be strengthened by establishing and/or proactivating water and sanitation committees. This can empower people to take sustained action at a local level with regard to water and sanitation-related problems.
Health interventions should be more relevant to local needsHealth-related losses, specifically mortality and morbidity due to diarrheal disease, are the single largest contributors to the financial and economic impact of inadequate sanitation. Therefore, to mitigate the ill effects of inadequate sanitation relevant vigorous health interventions are needed. They should address equity, with special emphasis on the rural poor, particularly the children; marginalized people living in hard-to-reach areas like haor (wetlands), char (sand and silt islands), and urban slums; indigenous people; and people living in areas prone to monga (seasonal famine). Health interventions should be implemented at grassroots-level health facilities, such as the Thana health complex, community clinics, satellite clinics, and family welfare centers.
Complementary strategies should be developed Complementary strategies should be developed for rural sanitation, hygiene, and water. This can be done by informing and supporting the choices of individuals using a mixture of mass media and interpersonal communication; by developing sanitary engineering and safe water engineering solutions based on an understanding of good practices in hydrogeology and geochemistry; and by bringing management practices into a more supportive institutional framework at both national and local levels.
Progress toward MDGs needs to be monitored more closely There is a need to monitor the progress toward achieving the MDG water and sanitation targets more closely. Monitoring should report to the country the following: levels of access to safe water and adequate sanitation; how much governments are allocating to water and sanitation; what external support they are receiving; their capacity to meet the challenge of achieving the targets; and highlights to warn when and where progress is lagging behind.

15
Economic Impacts of Inadequate Sanitation in Bangladesh
www.wsp.org
BACKGROUNDAccess to safe drinking water and sanitation is considered to be a fundamental human right that acts as a safeguard of health and human dignity (OHCHR, United Nations, 2007). Good sanitation and hygiene practices can make major differences in people’s health, education and socioeconomic development. Scientific studies indicate that diarrhea cases decline by roughly 36 percent when households have basic sanitation (Fewtrell et al., 2005). The same review of studies showed that handwashing with soap can reduce the incidence of diarrhea and have impacts on pneumonia, respiratory disease, trachoma, scabies, and skin and eye infections. Empirical studies have found that this practice can also reduce the incidence of diarrhea by 44 percent (Fewtrell et al., 2005).
The progress of two Millennium Development Goals (MDGs) will be accelerated by promoting adequate sanitation, hygiene, and access to safe drinking water:
• Goal4:Reducetheunder-fivemortalityratebytwo-thirds between 1990 and 2015, and
• Goal7:Theproportionofthepopulationwithoutsustainable access to safe drinking water and basic sanitation halved by 2015 (United Nations, 2005).
Sanitation is vital for good health and leads to a rise in life expectancy. It is a broad concept, one that includes safe management of human excreta, waste water, storm water, solid waste, industrial and agricultural wastes, household refuse, and animal excreta. Sanitation also includes sanitary living conditions, including access to safe drinking water and appropriate hygiene practices in households, at schools, and at workplaces. Due to the lack of data on many of these aspects of sanitation, this study has focused on only human excreta-related impacts of poor sanitation and hygiene.
A range of diseases occur and spread because of poor sanitation and hygiene practices. In Bangladesh, fecal-oral
Introduction1.
fIgURE 1.1 DISEASE TRANSMISSION PATH THROUGH THE F-DIAGRAM
Fluids
Feces
Fields
Flies
Fingers
FoodFresh/
new host

16
Economic Impacts of Inadequate Sanitation in Bangladesh
Bangladesh Impact Study
transmission routes are one of the main causes of water-borne diseases. Many people have only a poor understanding of the necessity of avoiding contact with human excreta and, therefore, the requirement for safe disposal. Children and women endure many hazardous situations due to poor sanitation. In Bangladesh, ALRI/pneumonia is the main cause of death and illness of children, which is indirectly related to poor sanitation via malnutrition.
Diarrhea is the second leading cause of morbidity and the fourth leading cause of mortality among children in the country (Local Government Division, MLGRDC, 2008). Bacteria, viruses, and parasites are the most common environmental hazards linked to poor sanitation, and they cause diarrhea. Children’s ability to digest and absorb food is obstructed when infections caused by poor sanitation result in malnutrition. Malnourished children are more likely to get sick and die as a result.
Figure 1.1 shows the F-diagram, describing the disease transmission pathways due to poor sanitation.
Poor sanitation, in sum, causes diseases and leads to medical and other health-related costs. Lack of latrines in household causes a further problem for women and girls, making them vulnerable to harassment and assault, particularly at night. Many girls and working women drop out of school and quit their workplaces due to inadequate sanitation facilities (Barkat et al., 2009: 86-92). Access to adequate sanitation and proper hygiene practice can increase life expectancy by reducing mortality and morbidity, saving health care costs, increasing worker productivity, increasing school attendance, reducing water treatment costs, and more besides.
A logical framework of economic benefits is shown in Figure 1.2 (Hutton et al., 2008).
fIgURE 1.2 PRIMARY AND FINAL IMPACT OF IMPROVED SANITATION OPTIONS
Improvement
Closer latrine access and more latrines per capita
Improved latrine system
Improved hygiene practices
Improved isolation, conveyance, and treatment
of human excreta
Reuse of human excreta
Primary impact
Less use of public latrines
Less open defecation
Less latrine access time
Intangible user benefits
Improved health status due to less exposure to pathogens
Improved quality of ground and surface water
More fertilizer available
More fuel available (cooking, lighting)
Improved quality of land and external living area
Economic impact
Saved entry fee costs
Improved aesthetics
School participation
Better living standards
House price rises
Health Related Quality of Life improvement
Labor productivity
Saved health care costs
Value of saved lives
Saved water treatment
Domestic uses of water
Cottage industry income
Tourist revenue
Foreign direct investment
Fish production
Agricultural production
Improved aesthetics
Education production
Fuel cost savings

17
Economic Impacts of Inadequate Sanitation in Bangladesh
www.wsp.org
SANITATION AND QUALITY OF LIFEOver the last decade, Bangladesh has emerged as a global reference point in experimenting and implementing innovative approaches to rural sanitation. Between October 2003 and June 2008, the percentage of people defecating in the open has dramatically fallen from 77 percent to 12 percent. More than 88 percent of the population now has access to facilities, mainly through low-cost pit latrines. A new approach to improving sanitation coverage in rural areas, the community-led total sanitation concept, was first piloted in Bangladesh and is credited for having contributed significantly to this increase in sanitation coverage since 2000.
While there has been a significant movement in Bangladesh away from open defecation toward fixed-point defecation, the quality of coverage is the emerging area of concern. According to the Joint Monitoring Program (JMP) for water supply and sanitation implemented by WHO and
UNICEF, only 39 percent of the population has improved sanitation coverage, although this is up from 20 percent in 1990. In Bangladesh, 75 percent of the population lives in rural areas, and many communities in hard-to-reach regions do not have adequate access to sanitation. In such a densely populated country, where a large proportion of the land regularly floods, sanitation is a continuing challenge. Despite improvements, large numbers of people remain at risk from the lack of safe excreta disposal.
Improving rural sanitation is therefore a complicated challenge, one that involves action on several fronts. Individuals need to be aware of how their own behavior may damage the environment and what they need to do to protect their own and the public’s health. Encouraging people to defecate in a fixed place and away from water sources is the first step. This requires education aimed at young people as well as information campaigns targeted at all age groups.
TABLE 1.1 JOINT MONITORING PROGRAM (JMP) DEFINITION OF IMPROVED AND UNIMPROVED SANITATION AND WATER SUPPLY
Indicators Improved Unimproved
Sanitation Flush pour-flush to:
Piped sewer system•
Septic tank•
Pit latrine•
Ventilated improved pit latrine
Pit latrine with slab
Composite toilet
Flush pour-flush to elsewhere
Pit latrine without slab or open pit
Bucket
Hanging toilet or latrine
No facilities or bush or field
Water supply Piped water into dwelling, plot, or yard
Public tap/standpipe
Tube well/borehole
Protected dug well
Protected spring
Rainwater collection
Unprotected dug well
Unprotected spring
Cart with small tank/drum
Tanker truck
Bottled water
Surface water (river, dam, lake, pond, stream, canal, irrigation channels)
Source: WHO and UNICEF, 2006.

18
Economic Impacts of Inadequate Sanitation in Bangladesh
Bangladesh Impact Study
Hygiene promoters also encourage families to invest in quality latrines (that isolate excreta from the human environment) by explaining that money can be saved on diarrhea medication and by enabling working adults to have fewer sick days. They further emphasize the social benefits of improved sanitation, including greater privacy and fewer offensive odors. Since sanitation is a public matter, communities need to be empowered to decide what they need and to act on those decisions. At the same time, local government needs to have the capacity to plan and implement building and engineering projects that will develop solutions to public health problems, such as the control of pollution and the safe disposal of excreta.
OVERVIEW OF THE CURRENT STATUS OF SANITATIONThe global population continues to grow, and natural resources such as freshwater and nutrients are becoming more and more limited. As a result, ensuring adequate sanitation and hygiene practices for all has become an especially important goal. WHO and UNICEF’s Joint Monitoring Program (JMP) has defined improved and unimproved sanitation and water supply to measure the MDG indicators, as spelled out in Table 1.1.
The Joint Monitoring Program has treated the year 1990 as a base year for comparing the overall sanitation situation within and across countries. According to the program’s sanitation coverage data for 1990, 49 percent of the world’s population then had access to improved sanitation; by 2004 this had increased to 59 percent. Undoubtedly this progress is not enough to reach the MDG by 2015. Table 1.2 shows the official sanitation coverage data of developing regions for base year 1990 and the most recent coverage data (2004).
According to the Joint Monitoring Program, in 2004 only 38 percent of people in South Asia had access to improved sanitation and the remaining 62 percent did not. During the 1990-2004 period, therefore, only an 18 percentage-point increase in sanitation coverage was achieved. Among the South Asian countries, by 2004 Sri Lanka (91 percent) and Bhutan (70 percent) had shown much success in achieving sanitation coverage, and more than 50 percent of the population in the Maldives and Pakistan had access to improved sanitation. Sanitation coverage in the rest of the countries in South Asia remains very poor, as more than 60 percent of the population in those countries remains without access to improved sanitation (Figure 1.3).
Rural (percent) Urban (percent) Total (percent)
1990 2004 1990 2004 1990 2004
South asia 8 27 54 63 20 38
East Asia 7 28 64 69 24 45
West Asia 55 59 97 96 81 84
Southeast Asia 40 56 70 81 49 67
Oceania 46 43 80 81 54 53
Latin America & Caribbean 36 49 81 86 68 77
North Africa 47 62 84 91 65 77
Sub-Saharan Africa 24 28 52 53 32 37
CIS 63 67 92 92 82 83
Bangladesh 12 35 55 51 20 39
Source: http://www.wssinfo.org.
TABLE 1.2 IMPROVED SANITATION COVERAGE STATISTICS FOR BANGLADESH, ASIA, AFRICA, AND
LATIN AMERICA (BY REGION) (IN PERCENTAGE OF POPULATION), 1990 AND 2004

19
Economic Impacts of Inadequate Sanitation in Bangladesh
www.wsp.org
Detailed and updated conditions of Bangladesh in the year 2006 are shown in Table 1.3.
320 14 11
37
69
2034 39
70
33
59
35
59
91
38
0
20
40
60
80
100
Figure 1.3: Improved sanitation coverage statistics for South Asian countries, 1990 and 2004
1990 2004
In addition to improved sanitation, proper hygiene practice is also important, since a significant relationship has been found between improper hygiene practice and disease transmission. A study by Luby et al. (2009) indicated that in Karachi, Pakistan, households that received free soap
and handwashing promotion for nine months reported 53 percent less diarrhea than households in the control group. Table 1.4 shows the reported hygiene practice in Bangladesh in 2006. As reported, 50.4 percent of rural people and almost 80 percent of urban people washed their hands with water and soap after defecation; according to the same survey, 1.3 percent of children under age five used a latrine and 21.1 percent flushed children’s feces into a
TABLE 1.3 THE SANITATION SITUATION IN BANGLADESH IN 2006: PERCENT OF POPULATION WITH ACCESS TO EACH TYPE OF
SANITATION, BY RURAL AND URBAN RESIDENCE
Bangladesh Rural Urban National
Improved sanitation
Flush to piped sewer system 0.2 9.4 2.9
Flush to septic tank 7.2 28.3 13.2
Flush to pit (latrine) 5.8 6.6 6
Pit latrine with slab 18.7 13.4 17.1
Subtotal 31.9 57.7 39.2
Unimproved sanitation
Pit latrine without slab/open pit 38.6 22.4 33.9
Hanging toilet/hanging latrine 19.7 14.5 18.2
No facility or bush or field 9.2 2.6 7.5
Other 0.6 2.8 1.2
Subtotal 68.1 42.3 60.8
Source: Bureau of Statistics, 2007.
Note: The definition of improved sanitation used by the 2006 Multiple Indicator Cluster Survey (MICS) is different from that used by the Joint Monitoring Program (WHO and UNICEF, 2006).
Afg
hani
stan
Ban
glad
esh
Bhu
tan
Ind
ia
Mal
div
es
Nep
al
Pak
ista
n
Sri
Lank
a
Sou
th A
sia
3
20 14 11
37
69
20
3439
70
33
59
35
59
91
38
0
20
40
60
80
100
1990 2004
fIgURE 1.3 IMPROVED SANITATION COVERAGE STATISTICS FOR SOUTH ASIAN COUNTRIES, 1990 AND 2004
Source: http://www.wssinfo.org/ Note: The data for Bhutan and Maldives for the year 1990 are not available.

20
Economic Impacts of Inadequate Sanitation in Bangladesh
Bangladesh Impact Study
latrine. Almost 42 percent of rural people and 20.4 percent of urban people left children’s feces in the open.
Here, it is worth noting that the reality of handwashing practice in Bangladesh is far worse than the reported one. There exists a huge gap between what is reported and what is observed. A baseline survey of hygiene practice conducted by ICDDR’B shows the difference between respondents’ reported behavior and observed behavior. The primary objective of the baseline survey was to promote handwashing with soap or ash at key times—before preparing food, before eating or feeding a child, after defecating, and after cleaning an infant who has defecated. In 100 randomly selected communities in 34 districts of Bangladesh, field workers observed the proportion of persons who washed their hands, and two months later returned to the same communities and interviewed residents about their handwashing behavior. Among the 20,546 key times
Indicators Rural Urban National
handwashing after defecation
Only water 6.2 3.0 5.5
Water and soil 25.9 10.3 21.3
Water and ash 17.4 7.1 14.4
Water and soap 50.4 79.5 58.8
Others 0.1 0.1 0.1
Total 100 100 100
Disposal of child’s feces
Child used toilet/latrine 0.8 2.9 1.3
Put/rinsed into toilet or latrine 14.1 41 21.1
Put/rinsed into drain or ditch 22.5 21.5 22.1
Thrown into garbage (solid waste) 12.3 8.4 11.2
Left in open 41.8 20.4 36.2
Others 8.6 5.9 8
Total 100 100 100 Source: Bureau of Statistics, 2007.
TABLE 1.4 PERSONAL HYGIENE PRACTICES IN BANGLADESH, 2006: PERCENT OF POPULATION, BY RURAL AND
URBAN RESIDENCE
observed, study subjects washed their hands 11,800 times (55 percent of the time), though in only 350 episodes (1.7 percent) did they wash both hands with soap or ash (ICDDR’B, 2008).
RATIONALE OF THE STUDY Bangladesh has made inadequate progress toward the sanitation-related MDG target. The country’s financial commitment and political priority for sanitation also has shown inadequate progress (WaterAid, 2008). Therefore, to mitigate the adverse effects of poor sanitation and hygiene practices, intervention is necessary. The aim of this study is to provide concrete evidence of the impact poor sanitation has on the population and the environment and, consequently, on the economy. This study provides estimates of the current and long-term effects of poor sanitation, which cover not only the negative impacts of poor sanitation but also the potential gains that different

21
Economic Impacts of Inadequate Sanitation in Bangladesh
www.wsp.org
sanitation interventions could achieve. Policy makers and water and sanitation advocacy organizations are the target audience of this study.
The World Bank’s Water and Sanitation Program (WSP) has developed a research program to understand the economic costs and benefits of sanitation, under the Economics of Sanitation Initiative (ESI). This study consists of two phases: first, a sanitation impact study is conducted, and this is followed by a sanitation options study. The first study is a situation analysis, assessing the national economic and financial impacts of inadequate sanitation and the potential gains from improving sanitation. Its primary aim is to mobilize the different players inside and outside the sanitation sub-sector to act to change the situation. The second study will examine the costs and benefits of specific sanitation technologies and programs in a number of rural
and urban field settings, to enable decision makers— government, donors, NGOs, and households—to choose efficient sanitation solutions that maximize the return on investment.
The ESI program started in the WSP East Asia and Pacific region in 2007 and studied five countries: Cambodia, Vietnam, Lao PDR, Indonesia, and the Philippines. Phase 1 studies were published in 2008 along with a synthesis report. Phase 2 studies from these countries as well as the Yunnan Province of China were published in 2010. During 2009, the ESI was extended to the WSP South Asia Region. This portion of the ESI impact study is currently active in India, Bangladesh, and Pakistan. The ESI study in Bangladesh is being conducted in two phases, like the preceding studies. This report is the culmination of Phase 1. The options study will be conducted in Phase 2.

22
Economic Impacts of Inadequate Sanitation in Bangladesh
Bangladesh Impact Study
INTRODUCTIONPoor progress in the sanitation sector has serious economic implications. Lack of improved sanitation causes diseases, which in addition to illness and death result in economic loss, lost work time, and a loss of dignity. The aim of this study is to identify the economic impacts to be evaluated and describe the methodology for expressing these impacts in monetary value. Both monetary (financial) and nonmonetary costs have been accounted for in order to paint a complete picture of the economic losses due to poor sanitation.
This study distinguishes between financial costs and nonfinancial costs. Financial costs include treatment costs for disease episodes, fuel consumption costs for boiling drinking water, and tariffs for piped water, among other costs that are most easily expressed in financial units. Other, nonfinancial costs can be measured when they involve a resource use—such as the time spent taking care of patients, fetching water, or using unimproved latrines—but these can nevertheless also be expressed in financial units using shadow prices, that is, prices that approximate the economic losses by taking values from observed markets.
The impacts evaluated in this study include health impacts, water-related impacts, sanitation access time, and time loss from school and work. The potential gains in each of these impact areas are also estimated based on projected improvements in sanitation. Health impact includes the mortality and morbidity burden of diseases, water impact covers the cost of accessing and treating drinking water and water for other domestic uses, sanitation access time includes the extra time needed when adequate private facilities are not nearby, and time loss from school and workplace, especially for females, includes time lost due to absence when sanitation in schools and workplaces is poor or unavailable.
SCOPE OF THE STUDYScope of sanitationThis study has included only the impacts of poor sanitation and hygiene related to human excreta. Due to lack of data, this study has excluded impacts due to the release of other solid waste and animal excreta into the environment. Aspects of sanitation included in the present study are listed in Table 2.1
Methodology2.
Included Excluded
Release/disposal of human excreta into environment
Hygiene practices associated with sanitation
Solid waste
Animal excreta
Drainage and general flood control measures
Industrial effluents, toxic waste, and medical waste
Air pollution unrelated to human excreta
Vector control
Broader food safety
Broader environmental sanitation
TABLE 2.1 ASPECTS OF SANITATION INCLUDED AND ExCLUDED IN THE PRESENT SANITATION IMPACT STUDY

23
Economic Impacts of Inadequate Sanitation in Bangladesh
www.wsp.org
Scope of impacts under consideration This impact study estimates the costs of poor sanitation in the areas of health, drinking water, domestic water, and user preference and welfare. Due to lack of data, the study excludes the impact of poor sanitation on fishing and fishery production, agricultural use of water, surrounding environment, tourism, foreign investment, and economic growth.
MAIN SOURCES OF DATA This study treats 2007 as a valuation year to estimate the economic and financial impacts of poor sanitation. When data or ratios were not available for the year 2007, preceding or succeding year data or ratios were applied to get estimates for 2007. When data at the national or subnational levels were lacking, the study used data from countries at similar levels of economic development, making reasonable assumptions and considering expert opinion to arrive at 2007 estimates. Note that this means that throughout this report, the latest survey numbers, costs, and estimations derive from or refer to the year 2007.
The major data sources, explained further below, were:
• BangladeshDemographicandHealthSurvey2007(BDHS, 2007), produced by the Ministry of Health and Family Welfare’s National Institute of Population Research and Training (NIPORT), with Mitra and Associates, and Macro International
• Health Bulletin data (2007), Ministry of Health and Family Welfare
• WorldHealthOrganization’sGlobal Burden of Disease data (2004)
• Household Income & Expenditure Survey data (2005)
• SampleVitalRegistrationSystemdata(2007)• Multiple Indicator Cluster Survey (MICS)
data (2006)
• Population Census data (2001) (extrapolatedpopulation data for 2007 by Bangladesh Bureau of Statistics)
• LaborForceSurvey(2005-06)• Statistical Year Book (2007)
Census Data from Bangladesh’s Population Census 2001 have been used for projected population totals, growth rates, age and sex population counts, and proportions to arrive at estimates for 2007.
Statistical Year Book 2007 Statistical Year Book 2007 is an annual publication of the Bangladesh Bureau of Statistics that provides statistical data and information on all sectors of the national economy. Population and household information from the publication are used in this report.
Report on Labor Force Survey 2005-06The Bangladesh Bureau of Statistics also publishes the Report on Labor Force Survey at intervals of four to five years. It includes data on the size and composition of the labor force by gender, major occupation by industry, employment status by gender, youth labor force, child labor, and so on. This study uses the labor force and unemployment-related data from the 2005-06 labor force survey report.
2007 Demographic and Health SurveyThe Bangladesh Demographic and Health Survey (BDHS) is part of a worldwide Demographic and Health Surveys program, which is designed to collect data on fertility, family planning, and maternal and child health including mortality, morbidity and nutrition. This study uses information from the BDHS survey, specifically from its ‘Child Health’ and ‘Nutrition of Children and Women’ modules, for data on diarrheal prevalence, the prevalence and treatment of ARLI, and the nutrition status of children. Most of the relevant morbidity statistics have been obtained from BDHS. Information regarding the use and treatment of drinking water and nondrinking water and on the use of cooking fuel by households has been obtained from BDHS. Residence- and age-specific data on open defecation and use of shared latrines have also been obtained from BDHS.
Health Bulletin (2008) Health Bulletin 2008 provides statistical information on different health programs, hospital services, academic and public health institutions, and the health workforce mainly under the Directorate General of Health Services of the Ministry of Health and Family Welfare. Age-specific morbidity statistics for some diseases (e.g, helminthes) have been collected from this bulletin.

24
Economic Impacts of Inadequate Sanitation in Bangladesh
Bangladesh Impact Study
Report of the Household Income and Expenditure Survey 2005The Household Income and Expenditure Survey conducted by the Bangladesh Bureau of Statistics is the main data source for estimating household income, expenditure, consumption, and the poverty status of the country. This study uses data from the survey, including data on medical expenditure.
Multiple Indicator Cluster Survey (MICS), 2006 MICS is an international household survey initiated by UNICEF. The Bangladesh MICS survey results are published in a document titled, ‘Progotir Pathey’ (Road to Progress). MICS provides valuable information on the situation of children and women in Bangladesh. Data on improved water sources, household water treatment, and time required to reach water sources have been collected from the MICS survey report.
Government of Bangladesh (various ministries) Information on economic variables has been collected from publications of the Ministry of Health and Family Welfare, Ministry of Water Resources, and Ministry of Education.
International data sources This study has also used international data sources to arrive at estimations. Relevant data have been obtained from these organizations, databases, and documents: World Health Statistics; WHO’s Global Burden of Disease; WHOSIS (the WHO database); World Development Indicators; UN–Water; UNICEF–Water, Sanitation, and Hygiene; WaterAid–Bangladesh; and the International Centre for Diarrheal Disease Research–Bangladesh (ICDDR, B).
Other sources This study has made maximum use of all available relevant data sources. It reviewed international, regional and local studies, reports, and other relevant materials to make final estimations. Among other relevant research studies, the most important ones include:
• Advancing Sustainable Environmental Health (ASEH): Impact Study, by Abul Barkat, G. Mahiyuddin, A. Poddar, R. Ara, M. Rahman, M. Badiuzzaman, S. Khan, and A. Osman (2009)
• Baseline Survey: Urban Component of SHEWA-B
(GOB-UNICEF) Project, by Abul Barkat, G. Mahiyuddin, M. Majid, M. B. Rahman, A. Osman, M. Hoque, S. Khan, and M. Rahman (2010), and
• ‘ProvisioningofArsenic-FreeWaterinBangladesh:A Human Rights Challenge’ by Abul Barkat and A. Hussam (2008).
ESTIMATION OF COSTS As stated earlier, this study attempts to estimate the nonmonetary, financial, and economic costs of poor sanitation in the areas of health, drinking water and domestic water, and user preference and welfare. Table 2.3 illustrates examples of these two types of costs as they affect health, water, and user preference. The two types of cost are distinguished from one another as follows.
Financial costs Financial costs refer to direct financial expenses paid in financial terms by someone, such as changes in household or government spending and real income losses for households.
Nonmonetary costs Nonmonetary costs consist of both longer-term financial impacts, such as having fewer or less educated children and losing working people due to premature death or relevant morbidity, and nonfinancial impacts. Nonfinancial impacts include intangible costs such as:
• thevalueoflossoflife• timeusebyadultsandchildren• patienttimelostduetoillness• time spent accompanying patients to seek
health care• timespentcaringforillpersons• time spent collecting fuel to treatwater, storing
treated water, and fetching safe water• timespentusingunimprovedlatrines,and• daysabsentfromschoolandwork.
In most cases, financial values have been assigned to such nonmonetary impacts. In these cases this study tries to describe the nonmonetary impacts using available evidence. In some cases, due to lack of proper evidence and data, it was not possible to assign financial values to certain nonmonetary impacts; for example, it was not possible to do so for loss of dignity and lack of comfort due to open defecation.

25
Economic Impacts of Inadequate Sanitation in Bangladesh
www.wsp.org
HEALTH-RELATED COSTS
Premature deaths Poor sanitation and hygiene practices lead to a range of disease conditions that have both direct and indirect economic effects. Some diseases are directly related to poor water and sanitation and some are indirectly related. Diarrhea, schistosomiasis, trachoma, and typhoid are directly related to water and sanitition. Diarrhea causes malnutrition, and malnutrition leads to other diseases like ALRI, malaria, measles, and jaundice. These diseases, as depicted in Figure 1.1, can be transmitted following direct
pathways (infected surface of a latrine, water or other fluids, person-to-person, flies, soil) as well as intermediary pathways (such as food).
This study estimates death from diarrheal disease and from helminthes infection as direct effects due to poor sanitation for all age groups (Table 2.4). The indirect health impacts of poor sanitation—especially diarrhea-induced malnutrition among children under age five—has been estimated for ALRI, malaria, measles, and other diseases. Due to lack of adequate data, only these diseases are considered as impact of poor sanitation in this study.
Impact categories Sub-impacts financial costs Nonmonetary costs
Health Premature death Present value of future income -
Treatment cost Doctor’s fee, medicine, transport,
and diagnostic test cost
Time spent for accompanying patient to
seek health care
Productivity cost - l Patient time loss because of illness
lTime spent taking care of ill person
Water Treatment cost Fuel consumption cost Time for collecting fuel and storing treated
water
Piped water cost Tariff for piped water -
Fetching cost - Time for fetching safe water
User preference Cost for using unimproved latrine - Time for using unimproved latrine
Loss of days absent from school - Cost for absent days from school
Loss of days absent from work - Cost for absent days from work
TABLE 2.2 FINANCIAL COSTS AND NONMONETARY COSTS OF POOR SANITATION
TABLE 2.3 DISEASES ATTRIBUTABLE TO POOR SANITATION INCLUDED IN THIS STUDY
diseases included Attributable by poor sanitation Age group accounted for
Diarrhea Partially attributed All ages
Helminthes Fully attributed All ages
ALRI Partially attributed via malnutrition Children below age 5
Malaria Partially attributed via malnutrition Children below age 5
Measles Partially attributed via malnutrition Children below age 5

26
Economic Impacts of Inadequate Sanitation in Bangladesh
Bangladesh Impact Study
Cause-specific deaths by age group for 2007 have been estimated using regional and country data from the World Health Organization’s 2004 Global Burden of Disease study (WHO, 2008). Proportions used in that study have been applied to age-specific populations in Bangladesh in 2007.
Death from diarrheal diseases and helminthes are directly related to poor sanitation and poor hygiene practice. Poor sanitation accounts for 88 percent of diarrheal deaths and 100 percent of deaths from helminthes (Haller, Hutton, and Bartram, 2007). Indirect deaths related to poor sanitation also result from the malnutrition induced by diarrhea and helminthes, which are the major causes of malnutrition. This is because people with diarrheal disease or helminthes infection are unable to fully absorb nutrients from the food they consume. Malnourished people face a higher risk of infectious disease and are less capable of recovering from it. The Economics of Sanitation Initiative study therefore
regards deaths from ALRI, malaria, measles, and other causes among children under age five due to malnutrition induced by diarrhea as indirectly caused by poor sanitation.
Underweight, stunting, and wasting are the three most commonly used indicators to measure malnutrition (and indirectly, poor sanitation) among children. This study uses the underweight approach to measure the risk of mortality due to poor sanitation. Underweight is measured as weight-for-age compared to an international reference population and indicates a deficit in body weight compared to the expected weight for the same age. For measuring underweight according to the weight-for-age-Z score (WAZ), the following formula has been used:
WAZ =
The results of the WAZ score are classified as follows:
disease type Ages 0-4 Ages
5-14
Ages 15+ Total
Diarrheal disease 49,007 137 6,153 55,297
ALRI 34,874 8,275 65,921 109,070
Helminthes 49 259 20 328
Skin diseases 47 24 704 775
Measles 14,166 1,166 0 15,332
Malaria 516 447 808 1,771
Malnutrition 1,131 1,969 1,066 4,166
Premature births and low birth weight (LBW) 40,576 0 0 40,576
Other perinatal conditions 57,903 0 0 57,903
Other causes 48,926 30,221 757,295 836,442
Total 247,195 42,498 831,967 1,121,660
TABLE 2.4 DISEASE-SPECIFIC DEATHS BY AGE GROUP
WAZ score degree of underweight
WA < -3SD Severe underweight
WA -2 to -3SD Moderate underweight
WA -1 to -2 SD Mild underweight
WA > -1 SD Non-underweight
observed weight - median weight of reference population for a given age standard deviation of reference population
Data source: Author’s estimations using 2004 age-specific death rates from WHO (2008) applied to age-specific populations of Bangladesh for 2007.
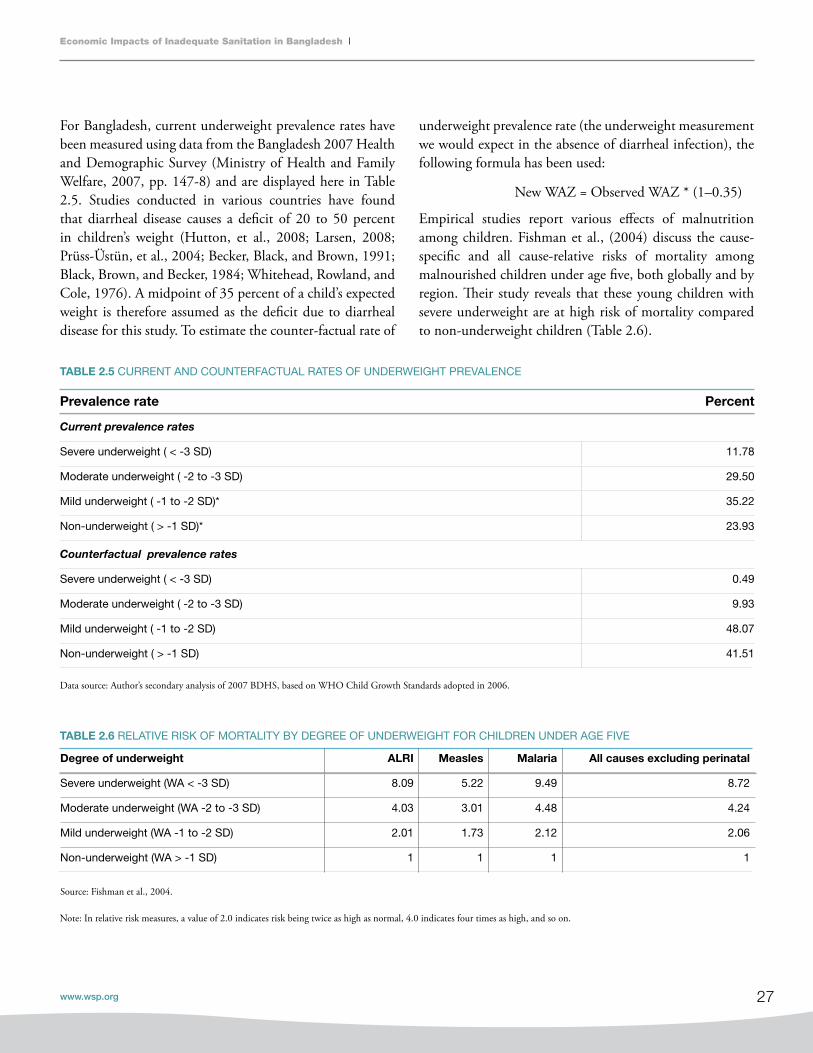
27
Economic Impacts of Inadequate Sanitation in Bangladesh
www.wsp.org
For Bangladesh, current underweight prevalence rates have been measured using data from the Bangladesh 2007 Health and Demographic Survey (Ministry of Health and Family Welfare, 2007, pp. 147-8) and are displayed here in Table 2.5. Studies conducted in various countries have found that diarrheal disease causes a deficit of 20 to 50 percent in children’s weight (Hutton, et al., 2008; Larsen, 2008; Prüss-Üstün, et al., 2004; Becker, Black, and Brown, 1991; Black, Brown, and Becker, 1984; Whitehead, Rowland, and Cole, 1976). A midpoint of 35 percent of a child’s expected weight is therefore assumed as the deficit due to diarrheal disease for this study. To estimate the counter-factual rate of
underweight prevalence rate (the underweight measurement we would expect in the absence of diarrheal infection), the following formula has been used:
New WAZ = Observed WAZ * (1–0.35)
Empirical studies report various effects of malnutrition among children. Fishman et al., (2004) discuss the cause-specific and all cause-relative risks of mortality among malnourished children under age five, both globally and by region. Their study reveals that these young children with severe underweight are at high risk of mortality compared to non-underweight children (Table 2.6).
TABLE 2.5 CURRENT AND COUNTERFACTUAL RATES OF UNDERWEIGHT PREVALENCE
TABLE 2.6 RELATIVE RISK OF MORTALITY BY DEGREE OF UNDERWEIGHT FOR CHILDREN UNDER AGE FIVE
Prevalence rate Percent
Current prevalence rates
Severe underweight ( < -3 SD) 11.78
Moderate underweight ( -2 to -3 SD) 29.50
Mild underweight ( -1 to -2 SD)* 35.22
Non-underweight ( > -1 SD)* 23.93
Counterfactual prevalence rates
Severe underweight ( < -3 SD) 0.49
Moderate underweight ( -2 to -3 SD) 9.93
Mild underweight ( -1 to -2 SD) 48.07
Non-underweight ( > -1 SD) 41.51
degree of underweight ALRI Measles Malaria All causes excluding perinatal
Severe underweight (WA < -3 SD) 8.09 5.22 9.49 8.72
Moderate underweight (WA -2 to -3 SD) 4.03 3.01 4.48 4.24
Mild underweight (WA -1 to -2 SD) 2.01 1.73 2.12 2.06
Non-underweight (WA > -1 SD) 1 1 1 1
Source: Fishman et al., 2004.
Note: In relative risk measures, a value of 2.0 indicates risk being twice as high as normal, 4.0 indicates four times as high, and so on.
Data source: Author’s secondary analysis of 2007 BDHS, based on WHO Child Growth Standards adopted in 2006.

28
Economic Impacts of Inadequate Sanitation in Bangladesh
Bangladesh Impact Study
To estimate the indirect death, the attributable fraction was calculated for cause-specific deaths and other causes due to malnutrition induced by diarrhea. Current and counter- factual prevalence rates and relative risk of mortality are used to estimate the attributable fraction (AF). The formula is as follows:
where,
RRi is relative risk of mortality or morbidity for each of the weight-for-age categories,
Pi is the current underweight prevalence rate in each of the weight-for-age categories, and
Pic is the counter-factual underweight prevalence
rate in each of the weight-for-age categories.
Using this formula, the attributable fraction for ALRI, malaria, measles, and other causes has been estimated. Other causes were calculated by excluding diarrhea, malaria, measles, and all perinatal causes (including prematurity and low birth weight) from all causes of death (Table 2.7).
As 88 percent of deaths from diarrheal diseases are attributable to poor sanitation, so 88 percent of deaths from ALRI, malaria, measles, and other causes due to malnutrition are also attributed to poor sanitation.
Total mortality causes by diarrhea-induced malnutrition due to poor sanitation has been calculated using the following formula:
where,
SAF is the fraction attributable to sanitation (88%),
AFj is the fraction attributable to malnutrition for the particular disease,
Djo is the total number of annual cases
for the particular disease, and
D is the total mortality (indirect) due to poor sanitation.
Table 2.8 shows the results of these calculations. Note that indirect deaths via malnutrition have been estimated only for children under age five due to lack of available information for the other age groups.
In 2007, 202,140 children under age five died in Bangladesh, and by these estimates almost 32 percent of this mortality was attributable to poor sanitation. Slightly more than half of this latter
ALRI Measles Malaria Other
Attributable fraction 36.12% 20.20% 38.53% 37.28%
Source: Author’s estimates.
TABLE 2.7 ATTRIBUTABLE FRACTION FOR MALNUTRITION, SELECTED DISEASES

29
Economic Impacts of Inadequate Sanitation in Bangladesh
www.wsp.org
number (17.5 percent of all under-five deaths) is directly attributable to poor sanitation, and slightly less than half (14.4 percent) was due to malnutrition caused in turn by poor sanitation (Table 2.9).
Estimating the cost of premature deathIt is difficult to attach an economic value to any premature death. However, it is important for policy makers to know the economic value of the reduced probability of premature deaths. Before implementing any sanitation- and hygiene-related program, one should measure cost-effectiveness. By placing an economic value on death, the effectiveness of reducing the probability of premature death can be
measured for a given program. To accomplish this, many economic techniques have been developed and used in different situations.
This study uses two economic approaches for valuation of premature death to explain the losses due to poor sanitation. They are the Value of a Statistical Life (VOSL) approach and the Human Capital Approach (HCA), and each measures loss of life from a different angle. VOSL measures the change in probability of death using people’s perception or willingness-to-pay for the reduction in the possibilities of risk of death. HCA calculates the potential productivity losses due to premature death.
TABLE 2.8 TOTAL ANNUAL DEATHS DUE TO INADEQUATE SANITATION, BY DISEASE AND AGE GROUP
TABLE 2.9 TOTAL DEATH RATES AMONG CHILDREN UNDER AGE FIVE
Cause of death Children under age 5 Children ages 5-14 Persons ages 15+ All persons
Diarrhea (direct) 43,126 121 5,415 48,661
ALRI 12,597 12,597
Measles 4,137 4,137
Malaria 199 199
Other causes* 18,647 18,647
Helminthes (direct) 49 259 20 328
Total mortality 78,755 380 5,435 84,569
Mortality directly attributable to poor sanitation 43,175 380 5,435 48,989
Mortality attributable to poor sanitation
via malnutrition
35,580 35,580
Source: Author’s estimates.
*Excluding diarrhea, malaria, ALRI, measles, intestinal helminthes, and all perinatal causes.
Total mortality, children under age 5 247,195
Attributable to malnutrition (from poor sanitation) 14.4%
Directly attributable to poor sanitation (diarrhea + helminthes) 17.5%
Total attributable to poor sanitation (diarrhea + helminthes + malnutrition) 31.9%
Source: Author’s estimates.

30
Economic Impacts of Inadequate Sanitation in Bangladesh
Bangladesh Impact Study
The Value of Statistical Life approach. VOSL estimates the average willingness-to-pay for reducing the risk of death for a population. The following formula has been used in this study to calculate VOSL:
Previous studies from other countries have calculated VOSL and several reviews summarize the findings. A VOSL study by Bellavance, Dionne, and Lebeau (2009) found that after 1996, the lowest VOSL figure among OECD countries was $2.35 million, which is considered the lowest estimate for calculating VOSL. From the same meta-analysis based on VOSL studies, the co-authors calculated a median VOSL value of $6.59 million, which is used as the high-VOSL case. A meta-analysis of VOSL studies by Viscusi and Aldy (2003) calculates the median VOSL to be $3.7 million, a value that is used by regulatory agencies in the United States. This last value is used as the base-case for VOSL estimation. To transfer the VOSL values to Bangladesh, the present study uses a range of income elasticities from 0.6 to 0.8 to 1, the same range that is used in the companion World Bank report, Economic Impacts of Inadequate Sanitation in India (World Bank, 2011).
VOSL_B = (VOSL_ OECD * (GDP_B/ GDP_OECD) ^ IE_VOSL)) * ER
Where,
VOSL_B = VOSL in Bangladesh
VOSL_ OECD = VOSL in OECD
GDP_B = GDP per capita in Bangladesh
GDP_OECD = GDP per capita in OECD
IE_VOSL = Income elasticity of VOSL
ER = Exchange rate Tk./$
The Human Capital Approach. HCA captures the present value of expected future income lost due to premature death, accounting for the economic loss in productive years. This study accounts for the present value of future income using the unemployment-adjusted labor share of gross domestic product (GDP) per worker for the year 2007. To calculate this, the labor share is adjusted by the unemployment rate at the rural and urban level. The resulting adjusted labor share of GDP per worker is Tk. 59,422.28 The corresponding values for workers in rural and urban areas are Tk. 46,186 and Tk. 104,079, respectively, amounts that are used to estimate the present value of future income.29 To estimate the present value, the following information is used:
• GDPpercapitarealannualgrowthrate=2%• Annualdiscountrate=3%• Workinglifestartage=15years• Workinglifeendage=65years• Amidpointof2yearsintheagecategory0-4years
is used for the present-value estimation• A midpoint of 35 years i s used for the
present-value estimation for the population over age 5
• Growth and discount rates are the same as forchildren under age 5
• Unemploymentrate=4.3%The present value of future income for the two age groups is calculated as follows:
• Forchildrenunderage5:Tk.2,362,674• Forpersonsoverage5:Tk.1,553,02030
Under the HCA approach, this study uses the unemployment-adjusted labor share of GDP per worker as the base-case for estimating value of premature death. Table 2.10 shows the estimates using both the HCA and VOSL approaches, and Table 2.12 provides the results of sensitivity analysis.
28 In 2009 prices, the UALS of GDP per worker is Tk. 68,335.3.29 In 2009 prices, corresponding values for rural and urban areas are Tk. 46,186 and Tk. 104,079.30 In 2009 prices, <5 years = Tk. 2,717,075.1; >5 years = Tk. 1,785,973.
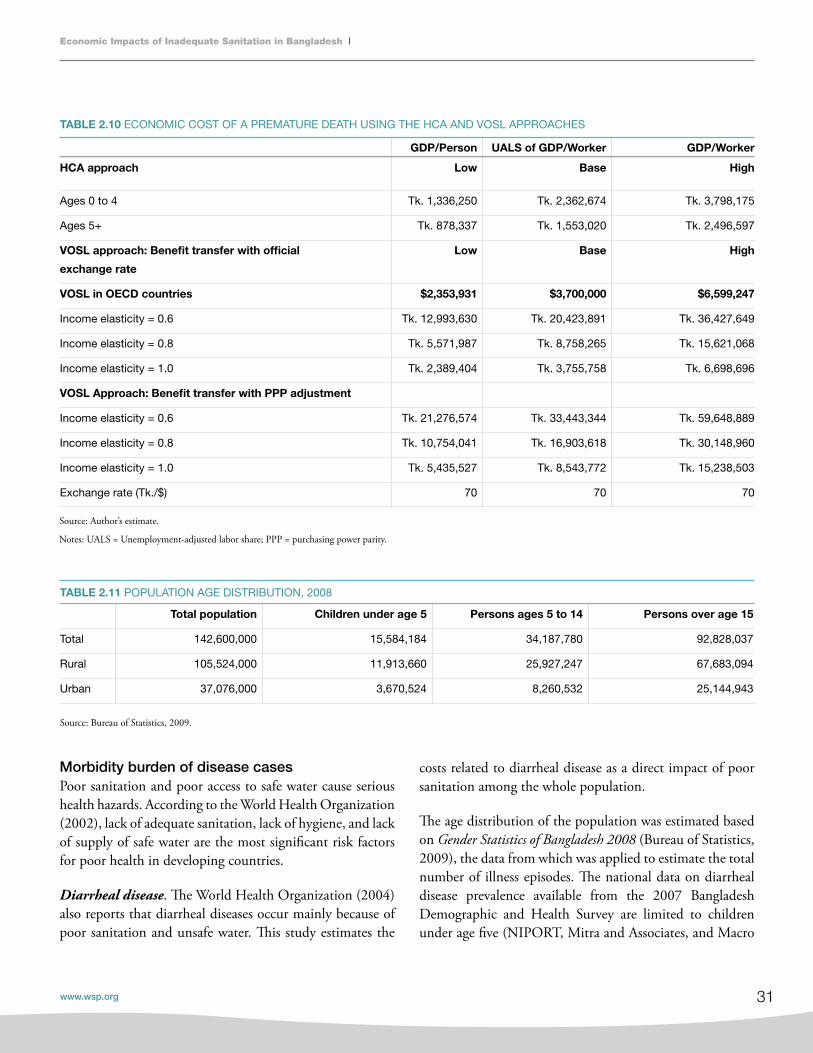
31
Economic Impacts of Inadequate Sanitation in Bangladesh
www.wsp.org
Morbidity burden of disease casesPoor sanitation and poor access to safe water cause serious health hazards. According to the World Health Organization (2002), lack of adequate sanitation, lack of hygiene, and lack of supply of safe water are the most significant risk factors for poor health in developing countries.
Diarrheal disease. The World Health Organization (2004) also reports that diarrheal diseases occur mainly because of poor sanitation and unsafe water. This study estimates the
TABLE 2.10 ECONOMIC COST OF A PREMATURE DEATH USING THE HCA AND VOSL APPROACHES
TABLE 2.11 POPULATION AGE DISTRIBUTION, 2008
gdP/Person UALS of gdP/Worker gdP/Worker
hCA approach Low Base high
Ages 0 to 4 Tk. 1,336,250 Tk. 2,362,674 Tk. 3,798,175
Ages 5+ Tk. 878,337 Tk. 1,553,020 Tk. 2,496,597
VOSL approach: Benefit transfer with official
exchange rate
Low Base high
VOSL in OECd countries $2,353,931 $3,700,000 $6,599,247
Income elasticity = 0.6 Tk. 12,993,630 Tk. 20,423,891 Tk. 36,427,649
Income elasticity = 0.8 Tk. 5,571,987 Tk. 8,758,265 Tk. 15,621,068
Income elasticity = 1.0 Tk. 2,389,404 Tk. 3,755,758 Tk. 6,698,696
VOSL Approach: Benefit transfer with PPP adjustment
Income elasticity = 0.6 Tk. 21,276,574 Tk. 33,443,344 Tk. 59,648,889
Income elasticity = 0.8 Tk. 10,754,041 Tk. 16,903,618 Tk. 30,148,960
Income elasticity = 1.0 Tk. 5,435,527 Tk. 8,543,772 Tk. 15,238,503
Exchange rate (Tk./$) 70 70 70
Source: Author’s estimate.
Notes: UALS = Unemployment-adjusted labor share; PPP = purchasing power parity.
Total population Children under age 5 Persons ages 5 to 14 Persons over age 15
Total 142,600,000 15,584,184 34,187,780 92,828,037
Rural 105,524,000 11,913,660 25,927,247 67,683,094
Urban 37,076,000 3,670,524 8,260,532 25,144,943
Source: Bureau of Statistics, 2009.
costs related to diarrheal disease as a direct impact of poor sanitation among the whole population.
The age distribution of the population was estimated based on Gender Statistics of Bangladesh 2008 (Bureau of Statistics, 2009), the data from which was applied to estimate the total number of illness episodes. The national data on diarrheal disease prevalence available from the 2007 Bangladesh Demographic and Health Survey are limited to children under age five (NIPORT, Mitra and Associates, and Macro
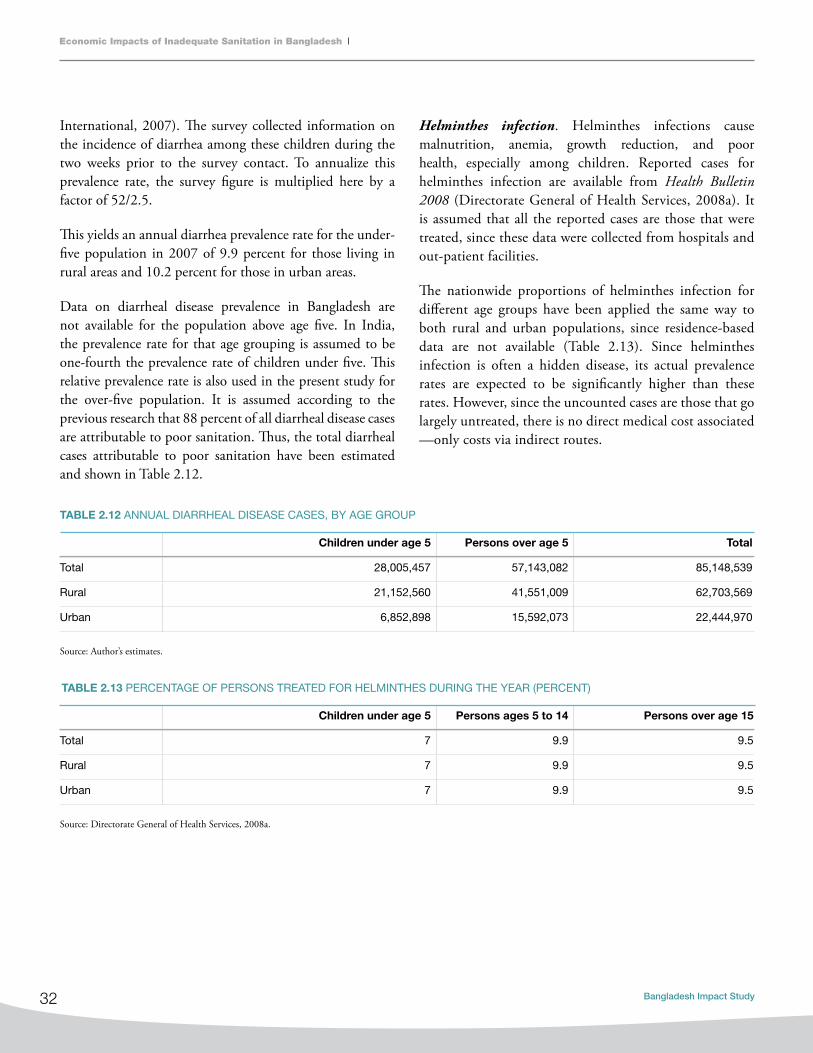
32
Economic Impacts of Inadequate Sanitation in Bangladesh
Bangladesh Impact Study
International, 2007). The survey collected information on the incidence of diarrhea among these children during the two weeks prior to the survey contact. To annualize this prevalence rate, the survey figure is multiplied here by a factor of 52/2.5.
This yields an annual diarrhea prevalence rate for the under-five population in 2007 of 9.9 percent for those living in rural areas and 10.2 percent for those in urban areas.
Data on diarrheal disease prevalence in Bangladesh are not available for the population above age five. In India, the prevalence rate for that age grouping is assumed to be one-fourth the prevalence rate of children under five. This relative prevalence rate is also used in the present study for the over-five population. It is assumed according to the previous research that 88 percent of all diarrheal disease cases are attributable to poor sanitation. Thus, the total diarrheal cases attributable to poor sanitation have been estimated and shown in Table 2.12.
Helminthes infection. Helminthes infections cause malnutrition, anemia, growth reduction, and poor health, especially among children. Reported cases for helminthes infection are available from Health Bulletin 2008 (Directorate General of Health Services, 2008a). It is assumed that all the reported cases are those that were treated, since these data were collected from hospitals and out-patient facilities.
The nationwide proportions of helminthes infection for different age groups have been applied the same way to both rural and urban populations, since residence-based data are not available (Table 2.13). Since helminthes infection is often a hidden disease, its actual prevalence rates are expected to be significantly higher than these rates. However, since the uncounted cases are those that go largely untreated, there is no direct medical cost associated —only costs via indirect routes.
Children under age 5 Persons over age 5 Total
Total 28,005,457 57,143,082 85,148,539
Rural 21,152,560 41,551,009 62,703,569
Urban 6,852,898 15,592,073 22,444,970
Source: Author’s estimates.
Children under age 5 Persons ages 5 to 14 Persons over age 15
Total 7 9.9 9.5
Rural 7 9.9 9.5
Urban 7 9.9 9.5
Source: Directorate General of Health Services, 2008a.
TABLE 2.12 ANNUAL DIARRHEAL DISEASE CASES, BY AGE GROUP
TABLE 2.13 PERCENTAGE OF PERSONS TREATED FOR HELMINTHES DURING THE YEAR (PERCENT)
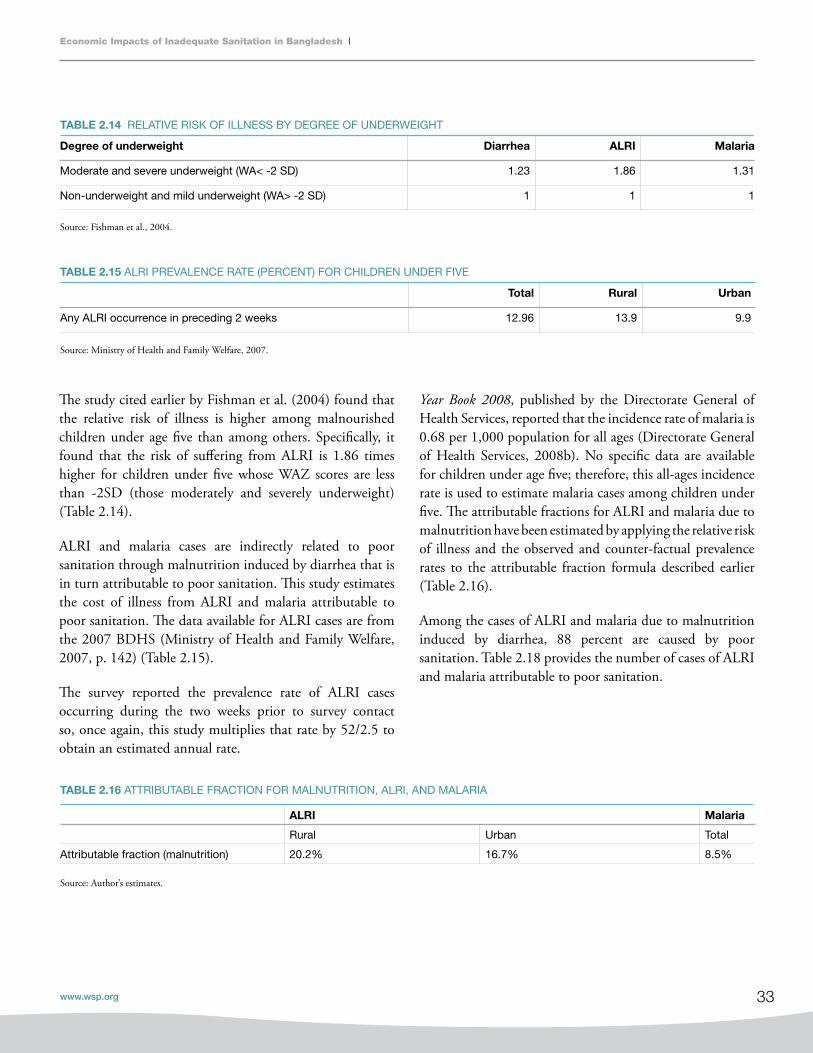
33
Economic Impacts of Inadequate Sanitation in Bangladesh
www.wsp.org
The study cited earlier by Fishman et al. (2004) found that the relative risk of illness is higher among malnourished children under age five than among others. Specifically, it found that the risk of suffering from ALRI is 1.86 times higher for children under five whose WAZ scores are less than -2SD (those moderately and severely underweight) (Table 2.14).
ALRI and malaria cases are indirectly related to poor sanitation through malnutrition induced by diarrhea that is in turn attributable to poor sanitation. This study estimates the cost of illness from ALRI and malaria attributable to poor sanitation. The data available for ALRI cases are from the 2007 BDHS (Ministry of Health and Family Welfare, 2007, p. 142) (Table 2.15).
The survey reported the prevalence rate of ALRI cases occurring during the two weeks prior to survey contact so, once again, this study multiplies that rate by 52/2.5 to obtain an estimated annual rate.
degree of underweight diarrhea ALRI Malaria
Moderate and severe underweight (WA< -2 SD) 1.23 1.86 1.31
Non-underweight and mild underweight (WA> -2 SD) 1 1 1
Total Rural Urban
Any ALRI occurrence in preceding 2 weeks 12.96 13.9 9.9
Year Book 2008, published by the Directorate General of Health Services, reported that the incidence rate of malaria is 0.68 per 1,000 population for all ages (Directorate General of Health Services, 2008b). No specific data are available for children under age five; therefore, this all-ages incidence rate is used to estimate malaria cases among children under five. The attributable fractions for ALRI and malaria due to malnutrition have been estimated by applying the relative risk of illness and the observed and counter-factual prevalence rates to the attributable fraction formula described earlier (Table 2.16).
Among the cases of ALRI and malaria due to malnutrition induced by diarrhea, 88 percent are caused by poor sanitation. Table 2.18 provides the number of cases of ALRI and malaria attributable to poor sanitation.
ALRI Malaria
Rural Urban Total
Attributable fraction (malnutrition) 20.2% 16.7% 8.5%
Source: Author’s estimates.
TABLE 2.14 RELATIVE RISK OF ILLNESS BY DEGREE OF UNDERWEIGHT
TABLE 2.16 ATTRIBUTABLE FRACTION FOR MALNUTRITION, ALRI, AND MALARIA
TABLE 2.15 ALRI PREVALENCE RATE (PERCENT) FOR CHILDREN UNDER FIVE
Source: Fishman et al., 2004.
Source: Ministry of Health and Family Welfare, 2007.

34
Economic Impacts of Inadequate Sanitation in Bangladesh
Bangladesh Impact Study
Estimation of cost of illness episode
TREaTmEnT coSTThis study estimates the treatment cost due to illness from diarrhea, ALRI, malaria, and helminthes infection. Since the data needed to distinguish among illness episodes of differing severity are lacking, it is assumed here that all the illness cases are—on average—moderate cases. This estimation includes the cost of treatment at medical facilities, at pharmacies, and by traditional health care. However, not all relevant data related to cost estimation are available, so expert opinions and assumptions are also used to estimate the total cost of treatment.
ALRI MALARIA
Total 7,227,421 721
Rural 6,118,265
Urban 1,109,156
The cost of treating diarrhea is estimated for the whole population. Data on the percentages of treated cases and type of treatment data are only available for children under age five from the 2007 BDHS (NIPORT, Mitra and Associates, and Macro International, 2007). This estimate assumes that the treatment ratio for both the above-five and the below-five populations is 75 percent. The proportion of treatment types (whether treated at a medical facility, a pharmacy, or by traditional health care) for treated diarrheal cases is also assumed to be the same for the above-five and below-five populations, and is shown in Table 2.18. The proportion of treatment types for ALRI is shown in Table 2.20.
Percent of
cases treated
Percent of cases treated
at medical facility
Percent of cases
treated at pharmacy
Percent of cases treated at traditional health
care (recommended homemade fluid)
Rural 90.7 17.7 75.5 22.8
Urban 90.0 27.4 80.6 8.8
Source: Ministry of Health and Family Welfare, 2007.
Note: Due to multiple responses, the sum total of 3 right-most columns do not add up to the percent shown in the left column.
TABLE 2.17 ANNUAL ALRI AND MALARIA CASES ATTRIBUTABLE TO POOR SANITATION, CHILDREN UNDER FIVE
TABLE 2.18 PERCENTAGE OF DIARRHEAL CASES TREATED, BY PLACE OF TREATMENT, CHILDREN UNDER FIVE
TABLE 2.19 PERCENTAGE OF ALRI CASES TREATED, BY PLACE OF TREATMENT, CHILDREN UNDER FIVE
Percent of
cases treated
Percent of cases treated
at medical facility
Percent of cases
treated at pharmacy
Percent of cases treated at
traditional health care
Total 79.97 30.30 26.54 21.55
Rural 79.70 26.70 27.60 24.10
Urban 81.40 49.20 21.00 8.20
Source: Ministry of Health and Family Welfare, 2007.
Note: Due to multiple responses, the sum total of 3 right-most columns do not add up to the percent shown in the left column.
Source: Author’s estimates.

35
Economic Impacts of Inadequate Sanitation in Bangladesh
www.wsp.org
Illnesses from ALRI and malaria are indirectly related to poor sanitation, as discussed previously. Treatment costs for these diseases are only estimated for children under age five. Treatment-related information on ALRI is gathered from the 2007 BDHS (Table 2.20). The same treatment proportion is used for malaria treatment, since no data are available. For helminthes infections, it is assumed that all reported cases get treatment; this study includes the treatment cost for the whole population.
Based on relevant expert opinion, this study conservatively assumes that the average duration of illness episodes of diarrhea, ALRI, and malaria is six days. In the case of helminthes infection, the productivity lost by the patient is assumed to be one hour per day over one week.
This study includes doctor’s fees, transport costs, diagnostic test costs, and medicine costs to estimate the overall treatment cost of each illness. Since the cost is estimated for moderate cases only, no hospitalization costs are included. This approach therefore underestimates the true costs of illness episodes related to poor sanitation.
The 2005 Household Income and Expenditure Survey identified Tk.115 as the average doctor’s fee and Tk. 79 for transport costs at the national level. This study assumes that these figures are the same for all diseases. Average medicine and diagnostic test costs have been estimated to be Tk. 365 for diarrhea, Tk. 1,613 for ALRI, and Tk. 499 for malaria, according to the prescriptions provided for moderate cases by health experts. Only the cost of medicine is included for those who have been treated at a pharmacy. Tk. 30 per day is assumed for treatment by traditional health care.
For helminthes infection, treatment cost is estimated at Tk. 435, which includes medicine, diagnostic test, doctor’s fee, and transport cost. A lot of people are treated through mass campaigns, and this study assumes that the unit cost of a mass campaign treatment is Tk. 23. At the national level the treatment rate is 7 percent, and this study conservatively assumes that 50 percent of all high-intensity infections (those with a high propensity to cause death if untreated) are treated at the medical facilities. According to the World Health Organization’s Global Burden of Disease study (2004 update), the worldwide high-intensity
infection prevalence rate is 1.62 percent (World Health Organization, 2008). This information yields an average cost of Tk. 65.74 per case for treatment at a medical facility or in a mass treatment campaign.
WElFaRE anD PRoDucTiviTy loSSES Working people lose income while they are ill, since they are generally unable to work at those times and laborers and factory workers in the country’s private sector do not receive sick-leave benefits. Illness also reduces their productivity when they return to normal activities after an illness. Children also lose their time and miss their school due to illness. This study captures all this time and productivity lost by patients. Since patients also need to be taken care of during their illness, this study also accounts for the cost of caregivers’ time. It is assumed that adults spend one hour per treated case to seek medical treatment and spend two hours per day during illness episodes to provide support and home health care to patients. Helminthes infection causes malnutrition and anemia, which also cause people to lose their productivity, so this loss is also estimated. It is assumed that all treated infectious persons lose one hour per day over a week due to worm infection.
To estimate the value of this lost time, this study estimates the value of a worker’s full working day using the unemployment-adjusted labor share of GDP per worker. Since not all the lost time will have the value of the going wage rates, 30 percent of the value of the unemployment-adjusted labor share of GDP per worker is used in the study, which is a conservative estimate. Children’s (under age 15) time is valued at 50 percent of the adult rate. Assuming 250 working days per year and an eight-hour working day, the value per hour for an adult is Tk. 8.9 at the national level, Tk. 6.9 in rural areas, and Tk. 15.6 in urban areas. For children, the values are half of the adult values.
Water-Related Costs Associated with Poor Sanitation and HygieneHuman excreta pollute water. Polluted water causes disease, foul odor, oxygen depletion, turbidity, eutrophication, and asphyxiation, which lead households to treat water or seek alternative water sources, and it therefore has economic implications.

36
Economic Impacts of Inadequate Sanitation in Bangladesh
Bangladesh Impact Study
Many households in Bangladesh do not have access to safe drinking water at their premises. Many people therefore have to treat water for safe drinking water and many sometimes have to fetch both drinking and non-drinking water, whose quality may not always be safe. These activities have financial and nonmonetary costs. This study estimates both kinds of cost. The following aspects are included in this estimation:
n Cost of household treatment of drinking water:• Boiling(financial+nonmonetarycost)• Bleach/chlorine(financial+nonmonetarycost)• Strainedthroughcloth(nonmonetarycost)• Filter(financial+nonmonetarycost)
nCost of piped drinking and non-drinking domestic water production(financial+nonmonetarycost),and
n Cost of fetching cleaner water (financial + non- monetary cost).
Household treatment of drinking water and related costsInformation on the different treatment methods used by households is available from the 2007 BDHS (NIPORT, Mitra and Associates, and Macro International, 2007) (also see Table 2.20). Financial and nonmonetary costs are estimated for each treatment method separately for rural and urban households, and these estimates are then added to arrive at a national estimate.
Both financial and nonmonetary costs are involved in treating drinking water by boiling. The financial cost is the fuel cost for boiling, and the nonmonetary cost includes the cost of collecting fuel and storing boiled water. National data on the use of cooking fuel by households is available from the 2007 BDHS (NIPORT, Mitra and Associates, and Macro International, 2007) (Table 2.21). This study assumes that the fuel a household uses for cooking is also used for boiling drinking water.
Treatment
by boiling
Treatment by
bleach/chlorine
Treatment by
cloth straining
Treatment
by filter
Rural households 0.6 0.1 0.7 1.7
Urban households 17.5 0.5 6.9 3.1
TABLE 2.20 HOUSEHOLD WATER TREATMENT, BY METHOD (PERCENT OF HOUSEHOLDS)
TABLE 2.21 PERCENTAGE DISTRIBUTION OF HOUSEHOLDS USING FUEL FOR COOKING, BY FUEL TYPE
Type of fuel Rural Urban Total
LPG/natural gas/biogas 0.5 37.9 8.6
Wood 43.8 44.3 43.9
Agricultural crop/straw/shrubs/grass 46.2 13.2 39.0
Animal dung 9.4 3.6 8.1
Other 0.2 1.0 0.3
Source: Ministry of Health and Family Welfare, 2007.
Source: Ministry of Health and Family Welfare, 2007.

37
Economic Impacts of Inadequate Sanitation in Bangladesh
www.wsp.org
Household costs for treating drinking water, by treatment typeThe country report from the International Benchmarking Network for Water and Sanitation Utilities31 finds that total water consumption per person per day was 95.7 liters in 2007. A study from Bangladesh finds that 2.92 liters of drinking water is needed for each person per day (Milton et al., 2006, pp. 431-6). These numbers are applied to the fuel costs (explained next) to arrive at annual costs of household water treatment.
Boiling water with liquefied petroleum gas. The monthly fuel cost of boiling water has been estimated for this study. For liquefied petroleum gas (LPG), each household has to spend Tk. 350 for a single burner.32 A household with five members needs five to six hours for cooking per day, which yields a monthly estimate of total cooking hours per household. Dividing the monthly rent by the total hours, cost per hour is estimated. A boiling time of 15 minutes is assumed for treating one liter of water, and per-hour boiling cost of 1 liter water using LPG is estimated (Table 2.22). Note that the government’s subsidy for gas is not considered for this calculation.
The calculation steps are as follows:
(1) Natural gas tariff (monthly) for a single burner = Tk. 350
(2) Total cooking time per day for one household (5-6 members) = 6 hours (assuming)
(3) Boiling time per liter of water = 15 minutes
(4) Therefore, fuel cost for boiling per liter, fuel cost (Financial) = 350*0.25/(6*30) = Tk. 0.4833
Boiling water with wood fuel. Three kilograms of wood are needed per day for cooking for one household of five
members. The cost per kilogram of wood is assumed to be Tk. 2, and the boiling time for one liter of drinking water using wood is assumed to be 20 minutes (an extra five minutes is needed as compared with LPG). These numbers yield the figures of fuel cost of boiling per liter of water using wood (Table 2.22).
The calculation assumptions and steps are given below:
(1) Cost of 1 kilogram of wood = Tk. 2
(2) Total cooking time per day for one household (5-6 members) = 6 hours (assuming)
(3) 3 kilograms of wood are needed for one household per day
(4) 2 hours of cooking requires 1 kilogram of wood = Tk. 2
(5) Boiling time per liter of water = 20 minutes
(6) Therefore, the fuel cost for boiling one liter of water (financial) = 2*0.33/2 = Tk. 0.3334
Information on handling costs is not available, so this study assumes that the handling costs are the same as those in India, which are available. Also, it is assumed that the boiling cost using LPG is the same as that for using biogas, natural gas, and other fuels; and the boiling cost using wood, estimated above, is also applied to the use of straw, shrubs, grass, crop waste, and dung cakes as fuel.
Treating water by bleaching, straining, or filtering. The cost of bleach/chlorine tablets (e.g., the Halo tab) is Tk. 1.5 for each tablet, which is used to treat 10 liters of water, and the handling cost is assumed to be Tk. 1.5.35 For straining through cloth, the annual cost per household is assumed to be Tk. 547.5.36 For using filters, the cost is estimated by
31 www.ib-net.org.32 InformationfromPetrobangla,theBangladeshOil,Gas&MineralCorporation;seewww.petrobangla.org.bd.33 In 2009 prices, it is Tk. 0.55. 34 In 2009 prices, it is Tk. 0.37.35 In 2009 prices, it is Tk. 1.73.36 In 2009 prices, it is Tk. 6,003.68.

38
Economic Impacts of Inadequate Sanitation in Bangladesh
Bangladesh Impact Study
dividing the price of a filter by the number of guaranteed years of use, which yields Tk. 500 as the annual cost per household, and37 the (nonmonetary) handling cost is assumed to be Tk. 547.5 per filter per year.38
All the above boiling cost estimates for various fuels are summed up in Tables 2.22 (fuel costs by unit) and 2.23 (annualized costs).
Piped water Information on household use of piped drinking and non-drinking water is available from the 2007 BDHS
(Ministry of Health and Family Welfare, 2007, p. 75) (Tables 2.25 and 2.26). Per-capita water consumption, as reported by the International Benchmarking Network for Water and Sanitation Utilities,39 is 95.7 liters per day, including 2.92 liters for drinking water per person per day (the remaining 92.8 liters of water per day is used for other purposes).
According to the same source, the operational cost was $0.093 per cubic meter/1,000 liters in 2007. This study assumes that the fraction of piped water production cost attributable to sanitation is 50 percent.
Types of treatment financial (Tk.) Nonmonetary (Tk.)
Boiling: Cost of boiling per liter per hour
LPG
Wood
0.48
0.33
0.26
1.04
Bleaching: Cost of bleach/chlorine tablet, per 10 liters 1.5 1.5
Straining: Annual per household cost of straining through cloth 547.5
Filtering: Annual cost of filter 500.00 547.5
Source: Author’s estimates and assumptions.
Number of
households
Boiling: Average
purchased fuel cost
per household (annual,
financial) (Tk.)
Boiling: Average indirect
cost per household,
including collected fuel
(annual, economic) (Tk.)
Per household cost of
boiling (annual) (Tk.)
Per household cost of
bleach/chlorine
(Annual) (Tk.)
TABLE 2.22 FINANCIAL AND NONMONETARY COSTS OF TREATING DRINKING WATER
TABLE 2.23 ANNUAL COST OF WATER TREATMENT (BOILING AND BLEACH) PER HOUSEHOLD
Rural 22,451,915 17 6,836 6,853 1,503
Urban 7,724,167 1,987 3,781 5,768 1,535
Source: Author’s estimates.
37 In 2009 prices, it is Tk. 575.38 In 2009 prices, it is Tk. 661.825.39 www.ib-net.org.

39
Economic Impacts of Inadequate Sanitation in Bangladesh
www.wsp.org
Fetching waterMany households have to fetch safe drinking water from outside their premises, so their household members have to spend extra time on this task. This study captures this time loss. Households that do not have any water access on their premises are assumed to fetch drinking water from outside.
TABLE 2.24 PERCENT AND NUMBER OF HOUSEHOLDS USING PIPED DRINKING AND NON-DRINKING WATER
Percent of
households with
piped drinking water
Percent of
households with
piped non-drinking
water*
Number of
households with
piped drinking
water
Number of
households
with piped non-
drinking water
Population
with piped
drinking
water
Population
with piped
non-drinking
water
Total 7.06% 6.0% 2,131,149 2,076,360 10,227,272 9,962,036
Rural 0.1% 0.2% 22,452 44,904 105,524 211,048
Urban 27.3% 26.3% 2,108,698 2,031,456 10,121,748 9,750,988
Source: Ministry of Health and Family Welfare, 2007; *Author’s secondary analysis of BDHS 2007.
drinking water: Piped water
production (m3/’000 liters)
Non-drinking domestic water: Piped water
production (m3/’000 liters)
Total piped water production
(m3/’000 liters)
Total 10,900,226 337,361,361 348,261,587
Rural 112,467 7,147,077 7,259,545
Urban 10,787,759 330,214,283 341,002,042
Source: Author’s estimates.
TABLE 2.25 ANNUAL CONSUMPTION OF PIPED WATER
TABLE 2.26 FETCHING DRINKING WATER: NUMBER OF HOUSEHOLDS AND AVERAGE TIME SPENT
The relevant information is available from the Multiple Indicator Cluster Survey 2006 (Bureau of Statistics, 2007, p. 61).Valuation of this extra time spent fetching is estimated in this study using a method similar to that described earlier. (Table 2.26).
Percent of all households that
fetch drinking water
Number of households that fetch
drinking water
Average drinking water
fetching time (minutes)
Rural 34.9% 7,835,718 12.5
Urban 23.4% 1,807,455 17.1
Source: Bureau of Statistics, 2007.

40
Economic Impacts of Inadequate Sanitation in Bangladesh
Bangladesh Impact Study
USER PREFERENCE, TIME LOSS, AND WELFARE COSTImproved sanitation facilities have implications for access time and convenience related to the use of toilets, and this in turn has a number of welfare effects. Improved sanitation systems lead to time savings, increases in school attendance rates, and increases in the women’s rate of labor force participation. This study estimates the economic impact of user preference for the sanitation option. User preference has been documented in a number of research papers, including studies on comfort, acceptability, privacy, convenience, security, conflict, status, and prestige. These aspects are covered by this study to measure the economic impact of intangible user preference.
Open defecation, shared toilets, and related costsA large number of households in Bangladesh have no private latrine or comfortable latrine, and a large number have no toilet at all. Using shared latrines or defecating in open places causes discomfort, inconvenience, time loss, and health hazards, especially for girls and women. The absence of toilet facilities lengthens access time, which is time that could be used for other productive activities. This study estimates this welfare loss by accounting for the cost of time spent on travelling to reach open defecation sites and the waiting time required when shared toilets are insufficient.
A toilet access cost for households has been calculated separately for different age groups and for different residence areas. It is estimated from the 2007 BDHS that 1.7 percent of the population in urban areas and 9.1 percent in rural areas have no toilet facilities or defecate in open places for other reasons (Table 2.27).
In reality, the actual figure might be higher than those survey data indicate. Different empirical studies have examined the reasons behind the higher percentage of open defecation in Bangladesh. For children and sometimes for adults too, open defecation is a common traditional practice even among households that might have improved or unimproved toilet facilities. Therefore, this study accounts for access time used for open defecation including people who defecate in open places despite having some sort of toilet facility. Age-group and residence-specific data on open defecation are not available from any single source; therefore, data have been gathered from multiple sources to yield a national figure for open defecation.
A study by Barkat et al. (2009, pp. 36-37) suggests that 53.5 percent of under-five children in rural areas defecate in open places. This study applies that percentage of under-five children to the 5-to-14 age group, since no data for the older age group are available. For the age 15+ ruralpopulation, BDHS data are used, since no other reliable information has been found for this age group, so this must be a conservative estimate. It was reported at the Third South Asian Conference on Sanitation (Local Government Division, MLGRDC, 2008) that in Bangladesh almost 12 percent of households do not use any type of improved or unimproved toilet. By applying the estimated rural figures (24.7 percent) for this study and the age-specific distribution of the urban population (using reported proportions from the BDHS), the proportion of the urban population defecating in open places, by age-group, is estimated. The resulting percentages of the population defecating in open places are represented in Table 2.28. Information on use of shared latrines (also based on 2007 BDHS data) is represented in Table 2.30.
Rural Urban Total
Children under age 5 9.9 2.0 8.3
Persons ages 5 to 14 10.0 2.0 8.4
Persons over age 15 8.6 1.6 7.0
Total 9.1 1.7 7.5
Source: Author’s secondary analysis of the 2007 BDHS.
TABLE 2.27 PERCENT OF POPULATION WITH NO TOILET FACILITY, BY AGE GROUP

41
Economic Impacts of Inadequate Sanitation in Bangladesh
www.wsp.org
Rural Urban***
Children under 5 53.5* 9.7
Persons ages 5 to 14 53.5** 8.8
Persons over age 15 8.6*** 8.8
Total 24.7 8.9****
Source: *Barkat et al., 2009; ***Author’s secondary analysis of the 2007 BDHS.
**Assuming the same percentage of age group < 5.
**** Local Government Division, MLGRDC, 2008.
TABLE 2.28 PERCENT OF POPULATION DEFECATING IN OPEN PLACES, BY AGE GROUP
TABLE 2.30 POPULATION DEFECATING IN OPEN AND USING SHARED LATRINES, BY AGE GROUP
TABLE 2.29 PERCENT OF POPULATION USING SHARED LATRINES, BY AGE GROUP
Rural Urban
Children under 5 42.5 52.3
Persons ages 5 to 14 35.5 44.5
Persons over age 15 35.6 40.5
Source: Author’s secondary analysis of the 2007 BDHS.
Children under
age 5
Persons
ages 5 to 14
Persons over
age 15
Children under
age 5
Persons
ages 5 to 14
Persons
over age 15
Total 6,729,849 14,598,004 8,033,501 6,982,989 12,880,110 34,278,883
Rural 6,373,808 13,871,077 5,820,746 5,063,305 9,204,173 24,095,181
Urban 356,041 726,927 2,212,755 1,919,684 3,675,937 10,183,702
Source: Author’s estimates.
Using shared latrinesUsing open defecation
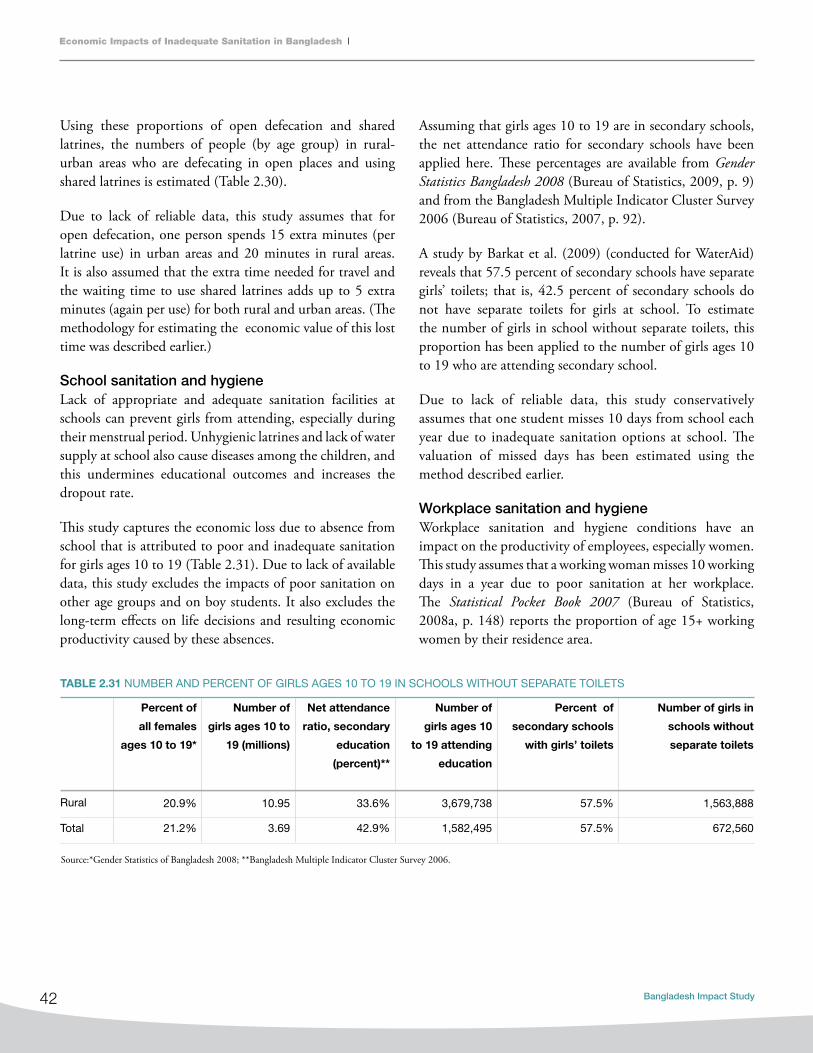
42
Economic Impacts of Inadequate Sanitation in Bangladesh
Bangladesh Impact Study
Using these proportions of open defecation and shared latrines, the numbers of people (by age group) in rural-urban areas who are defecating in open places and using shared latrines is estimated (Table 2.30).
Due to lack of reliable data, this study assumes that for open defecation, one person spends 15 extra minutes (per latrine use) in urban areas and 20 minutes in rural areas. It is also assumed that the extra time needed for travel and the waiting time to use shared latrines adds up to 5 extra minutes (again per use) for both rural and urban areas. (The methodology for estimating the economic value of this lost time was described earlier.)
School sanitation and hygieneLack of appropriate and adequate sanitation facilities at schools can prevent girls from attending, especially during their menstrual period. Unhygienic latrines and lack of water supply at school also cause diseases among the children, and this undermines educational outcomes and increases the dropout rate.
This study captures the economic loss due to absence from school that is attributed to poor and inadequate sanitation for girls ages 10 to 19 (Table 2.31). Due to lack of available data, this study excludes the impacts of poor sanitation on other age groups and on boy students. It also excludes the long-term effects on life decisions and resulting economic productivity caused by these absences.
Assuming that girls ages 10 to 19 are in secondary schools, the net attendance ratio for secondary schools have been applied here. These percentages are available from Gender Statistics Bangladesh 2008 (Bureau of Statistics, 2009, p. 9) and from the Bangladesh Multiple Indicator Cluster Survey 2006 (Bureau of Statistics, 2007, p. 92).
A study by Barkat et al. (2009) (conducted for WaterAid) reveals that 57.5 percent of secondary schools have separate girls’ toilets; that is, 42.5 percent of secondary schools do not have separate toilets for girls at school. To estimate the number of girls in school without separate toilets, this proportion has been applied to the number of girls ages 10 to 19 who are attending secondary school.
Due to lack of reliable data, this study conservatively assumes that one student misses 10 days from school each year due to inadequate sanitation options at school. The valuation of missed days has been estimated using the method described earlier.
Workplace sanitation and hygieneWorkplace sanitation and hygiene conditions have an impact on the productivity of employees, especially women. This study assumes that a working woman misses 10 working days in a year due to poor sanitation at her workplace. The Statistical Pocket Book 2007 (Bureau of Statistics, 2008a,p.148)reportstheproportionofage15+workingwomen by their residence area.
Percent of
all females
ages 10 to 19*
Number of
girls ages 10 to
19 (millions)
Net attendance
ratio, secondary
education
(percent)**
Number of
girls ages 10
to 19 attending
education
Percent of
secondary schools
with girls’ toilets
Number of girls in
schools without
separate toilets
Rural 20.9% 10.95 33.6% 3,679,738 57.5% 1,563,888
Total 21.2% 3.69 42.9% 1,582,495 57.5% 672,560
Source:*Gender Statistics of Bangladesh 2008; **Bangladesh Multiple Indicator Cluster Survey 2006.
TABLE 2.31 NUMBER AND PERCENT OF GIRLS AGES 10 TO 19 IN SCHOOLS WITHOUT SEPARATE TOILETS
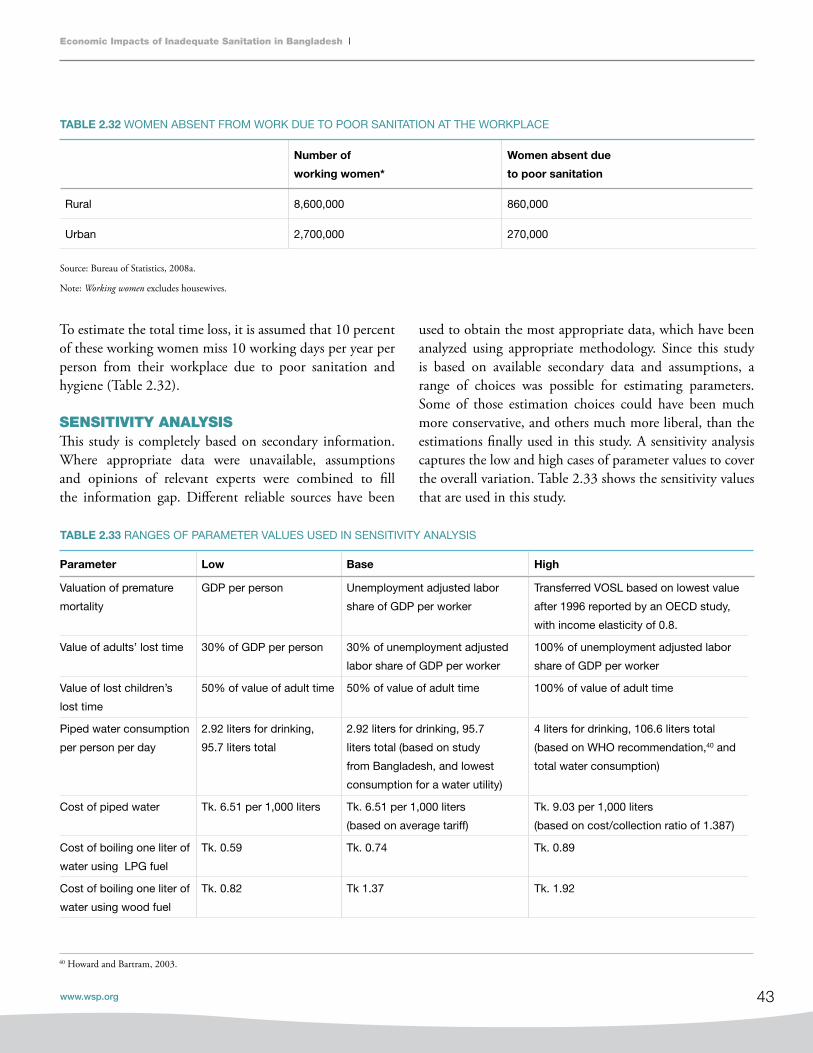
43
Economic Impacts of Inadequate Sanitation in Bangladesh
www.wsp.org
Parameter Low Base high
Valuation of premature
mortality
GDP per person Unemployment adjusted labor
share of GDP per worker
Transferred VOSL based on lowest value
after 1996 reported by an OECD study,
with income elasticity of 0.8.
Value of adults’ lost time 30% of GDP per person 30% of unemployment adjusted
labor share of GDP per worker
100% of unemployment adjusted labor
share of GDP per worker
Value of lost children’s
lost time
50% of value of adult time 50% of value of adult time 100% of value of adult time
Piped water consumption
per person per day
2.92 liters for drinking,
95.7 liters total
2.92 liters for drinking, 95.7
liters total (based on study
from Bangladesh, and lowest
consumption for a water utility)
4 liters for drinking, 106.6 liters total
(based on WHO recommendation,40 and
total water consumption)
Cost of piped water Tk. 6.51 per 1,000 liters Tk. 6.51 per 1,000 liters
(based on average tariff)
Tk. 9.03 per 1,000 liters
(based on cost/collection ratio of 1.387)
Cost of boiling one liter of
water using LPG fuel
Tk. 0.59 Tk. 0.74 Tk. 0.89
Cost of boiling one liter of
water using wood fuel
Tk. 0.82 Tk 1.37 Tk. 1.92
To estimate the total time loss, it is assumed that 10 percent of these working women miss 10 working days per year per person from their workplace due to poor sanitation and hygiene (Table 2.32).
SENSITIVITY ANALYSISThis study is completely based on secondary information. Where appropriate data were unavailable, assumptions and opinions of relevant experts were combined to fill the information gap. Different reliable sources have been
Number of
working women*
Women absent due
to poor sanitation
Rural 8,600,000 860,000
Urban 2,700,000 270,000
Source: Bureau of Statistics, 2008a.
Note: Working women excludes housewives.
TABLE 2.32 WOMEN ABSENT FROM WORK DUE TO POOR SANITATION AT THE WORKPLACE
used to obtain the most appropriate data, which have been analyzed using appropriate methodology. Since this study is based on available secondary data and assumptions, a range of choices was possible for estimating parameters. Some of those estimation choices could have been much more conservative, and others much more liberal, than the estimations finally used in this study. A sensitivity analysis captures the low and high cases of parameter values to cover the overall variation. Table 2.33 shows the sensitivity values that are used in this study.
TABLE 2.33 RANGES OF PARAMETER VALUES USED IN SENSITIVITY ANALYSIS
40 Howard and Bartram, 2003.
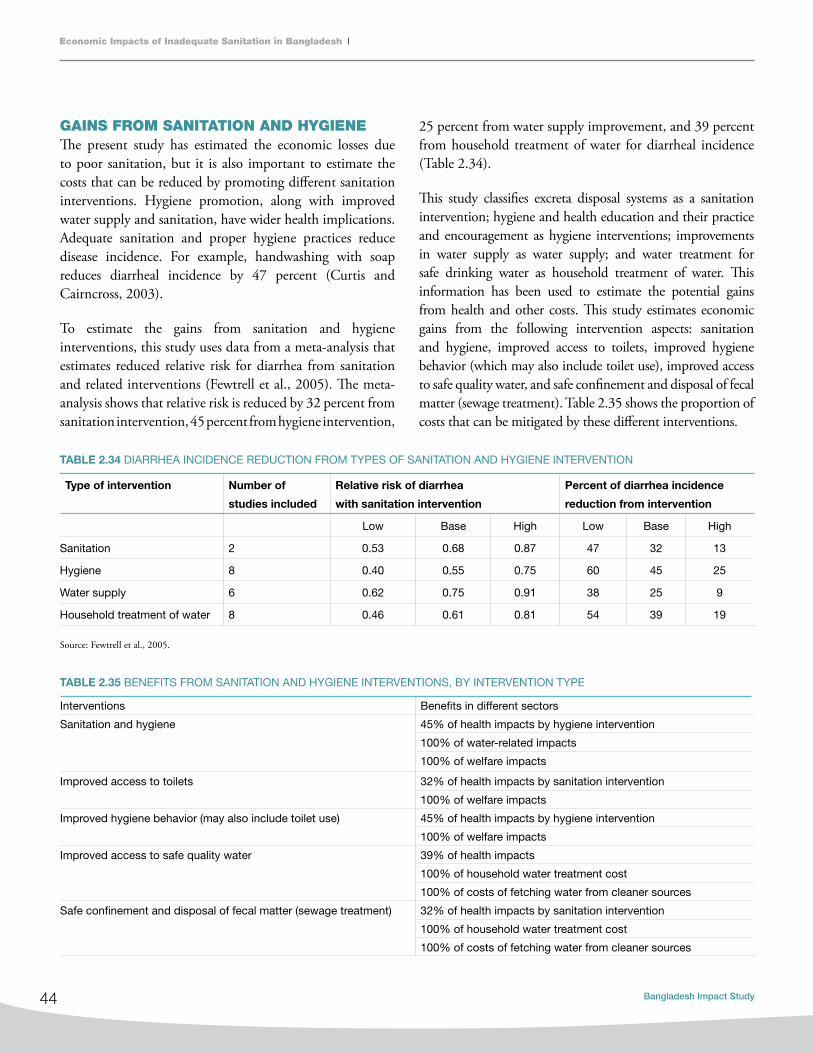
44
Economic Impacts of Inadequate Sanitation in Bangladesh
Bangladesh Impact Study
GAINS FROM SANITATION AND HYGIENEThe present study has estimated the economic losses due to poor sanitation, but it is also important to estimate the costs that can be reduced by promoting different sanitation interventions. Hygiene promotion, along with improved water supply and sanitation, have wider health implications. Adequate sanitation and proper hygiene practices reduce disease incidence. For example, handwashing with soap reduces diarrheal incidence by 47 percent (Curtis and Cairncross, 2003).
To estimate the gains from sanitation and hygiene interventions, this study uses data from a meta-analysis that estimates reduced relative risk for diarrhea from sanitation and related interventions (Fewtrell et al., 2005). The meta-analysis shows that relative risk is reduced by 32 percent from sanitation intervention, 45 percent from hygiene intervention,
25 percent from water supply improvement, and 39 percent from household treatment of water for diarrheal incidence (Table 2.34).
This study classifies excreta disposal systems as a sanitation intervention; hygiene and health education and their practice and encouragement as hygiene interventions; improvements in water supply as water supply; and water treatment for safe drinking water as household treatment of water. This information has been used to estimate the potential gains from health and other costs. This study estimates economic gains from the following intervention aspects: sanitation and hygiene, improved access to toilets, improved hygiene behavior (which may also include toilet use), improved access to safe quality water, and safe confinement and disposal of fecal matter (sewage treatment). Table 2.35 shows the proportion of costs that can be mitigated by these different interventions.
Type of intervention Number of
studies included
Relative risk of diarrhea
with sanitation intervention
Percent of diarrhea incidence
reduction from intervention
Low Base High Low Base High
Sanitation 2 0.53 0.68 0.87 47 32 13
Hygiene 8 0.40 0.55 0.75 60 45 25
Water supply 6 0.62 0.75 0.91 38 25 9
Household treatment of water 8 0.46 0.61 0.81 54 39 19
Source: Fewtrell et al., 2005.
TABLE 2.34 DIARRHEA INCIDENCE REDUCTION FROM TYPES OF SANITATION AND HYGIENE INTERVENTION
TABLE 2.35 BENEFITS FROM SANITATION AND HYGIENE INTERVENTIONS, BY INTERVENTION TYPE
Interventions Benefits in different sectors
Sanitation and hygiene 45% of health impacts by hygiene intervention
100% of water-related impacts
100% of welfare impacts
Improved access to toilets 32% of health impacts by sanitation intervention
100% of welfare impacts
Improved hygiene behavior (may also include toilet use) 45% of health impacts by hygiene intervention
100% of welfare impacts
Improved access to safe quality water 39% of health impacts
100% of household water treatment cost
100% of costs of fetching water from cleaner sources
Safe confinement and disposal of fecal matter (sewage treatment) 32% of health impacts by sanitation intervention
100% of household water treatment cost
100% of costs of fetching water from cleaner sources

45
Economic Impacts of Inadequate Sanitation in Bangladesh
www.wsp.org
LIMITATIONS OF THE STUDYAlthough it is not a limitation, the author of this report acknowledges that despite the availability of data for year 2009, this study is based on data for the year 2007, a choice made so that the findings can be comparable with those reported on in other ESI country reports. The year 2007 was chosen as a reference year by consensus, which is a key methodological issue.
Inadequate sanitation has huge impacts on different sectors, including health, water, environment, fish production, and tourism. In this particular study, only three sectors have been considered for measuring the ill effects of poor sanitation. Obviously, therefore, the estimated costs are underestimations. The actual cost count for poor sanitation would be much higher if the impacts on every sector were considered. The cost count due to poor sanitation would be higher still if all nonmonetary costs could be monetized (e.g., loss of dignity and lack of comfort due to open defecation). Other costs would inevitably be higher too if the relevant
subsidies were costed, since the Government of Bangladesh provides subsidies to several sectors, including gas, water, and public health facilities. When estimating the costs of disease treatment, drinking water treatment, and use of piped water, such subsidy elements were not considered.
As stated earlier, this study is based on secondary data, making use of a good number of published national reports and other authentic sources. Furthermore, different assumptions have been adopted to fill the information gaps, made by the author based on his experience and expertise. For example: to calculate the morbidity burden of diarrhea, the prevalence rate for the population above age five was assumed to be one-fourth the rate of the below-five population; to measure the cost of treating drinking water, total cooking time per day for one household was assumed to be six hours; and extra time spent for open defecation and using shared latrines was assumed in calculating the impact of intangible user preference. In a few cases, experts’ (such as doctors’) opinions have been sought.
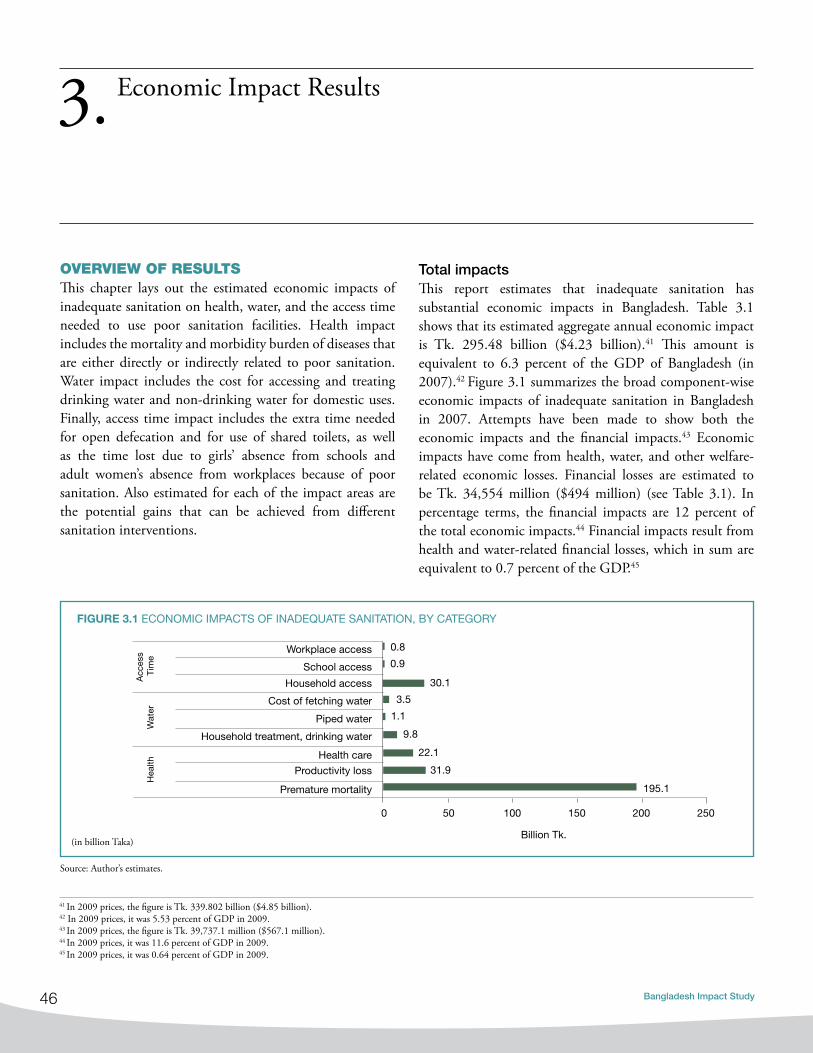
46
Economic Impacts of Inadequate Sanitation in Bangladesh
Bangladesh Impact Study
OVERVIEW OF RESULTSThis chapter lays out the estimated economic impacts of inadequate sanitation on health, water, and the access time needed to use poor sanitation facilities. Health impact includes the mortality and morbidity burden of diseases that are either directly or indirectly related to poor sanitation. Water impact includes the cost for accessing and treating drinking water and non-drinking water for domestic uses. Finally, access time impact includes the extra time needed for open defecation and for use of shared toilets, as well as the time lost due to girls’ absence from schools and adult women’s absence from workplaces because of poor sanitation. Also estimated for each of the impact areas are the potential gains that can be achieved from different sanitation interventions.
Economic Impact Results3.
Total impacts This report estimates that inadequate sanitation has substantial economic impacts in Bangladesh. Table 3.1 shows that its estimated aggregate annual economic impact is Tk. 295.48 billion ($4.23 billion).41 This amount is equivalent to 6.3 percent of the GDP of Bangladesh (in 2007).42 Figure 3.1 summarizes the broad component-wise economic impacts of inadequate sanitation in Bangladesh in 2007. Attempts have been made to show both the economic impacts and the financial impacts.43 Economic impacts have come from health, water, and other welfare-related economic losses. Financial losses are estimated to be Tk. 34,554 million ($494 million) (see Table 3.1). In percentage terms, the financial impacts are 12 percent of the total economic impacts.44 Financial impacts result from health and water-related financial losses, which in sum are equivalent to 0.7 percent of the GDP.45
41 In 2009 prices, the figure is Tk. 339.802 billion ($4.85 billion).42 In 2009 prices, it was 5.53 percent of GDP in 2009.43 In 2009 prices, the figure is Tk. 39,737.1 million ($567.1 million).44 In 2009 prices, it was 11.6 percent of GDP in 2009.45 In 2009 prices, it was 0.64 percent of GDP in 2009.
Source: Author’s estimates.
195.1
31.9
22.1
9.8
1.1
3.5
30.1
0.9
0.8
0 50 100 150 200 250
Premature mortality
Productivity loss
Health care
Household treatment, drinking water
Piped water
Cost of fetching water
Household access
School access
Workplace access
Acc
ess
Tim
eW
ater
Hea
lth
Billion Tk.
fIgURE 3.1 ECONOMIC IMPACTS OF INADEQUATE SANITATION, BY CATEGORY
(in billion Taka)

47
Economic Impacts of Inadequate Sanitation in Bangladesh
www.wsp.org
Using the available data, we calculate the economic impact of inadequate sanitation on health, water, and other welfare where health-related economic impacts of inadequate sanitation result from losses due to premature mortality, productivity loss, and health care. This is equal to Tk. 249,186 million, which is 84 percent of the total economic impact or equivalent to 5.3 percent of GDP in 2007 (see Figures 3.2, 3.3, 3.4 and Table 3.1).46
Source: Author’s estimates
fIgURE 3.2 SUMMARY OF ECONOMIC IMPACTS OF INADEQUATE SANITATION
Impact type
Economic impacts (in millions) financial impacts (in millions)
Tk. US$ Percent of
total
Tk. US$ Percent of
total
health 249,186 3,560 84% 30,375 434 88%
Premature mortality 195,101 2,787 66% - - -
Productivity loss 31,941 456 11% 8,232 118 24%
Health care 22,144 316 7% 22,144 316 64%
Water 14,510 207 5% 4,179 60 12%
Household treatment, drinking water 9,841 141 3% 3,045 43 9%
Piped water 1,134 16 0.4% 1,134 16 3%
Cost of fetching water 3,535 51 1% - - -
Other welfare 31,779 454 11% - - -
Household access 30,112 430 10% - - -
School access 853 12 0.3% - - -
Workplace access 814 12 0.3% - - -
Total impact 295,476 4,221 100% 34,554 494 100%
Percent of gdP 6.3 0.7
TABLE 3.1 ECONOMIC AND FINANCIAL IMPACTS OF INADEQUATE SANITATION
Water-related economic impacts of inadequate sanitation resulting from the costs of accessing cleaner water are Tk.14,510 million or 5 percent of the total economic impact, equivalent to 0.3 percent of GDP in 2007.47 Welfare and time losses from not having proper access to accessible toilet facilities are Tk. 31,779 million or 11 percent of the total economic impact, equivalent to 0.7 percent of GDP.48
249,186
14,510 31,779
0
100000
200000
300000
Health Water Other welfare
Source: Author’s estimates.
46 In 2009 prices, it is Tk. 286,563.9 million, which is equivalent to 4.66 percent of GDP in 2009. 47 In 2009 prices, it is Tk. 16,686.5 million, which is 0.27 percent of GDP in 2009.48 In 2009 prices, it is Tk. 36,545 million, which is 0.59 percent of GDP in 2009.
(in million Tk.)

48
Economic Impacts of Inadequate Sanitation in Bangladesh
Bangladesh Impact Study
Per-capita impacts Although per-capita impacts are low, a densely populated country like Bangladesh with a gigantic population (142 million) faces vast national impacts from inadequate sanitation. The huge population size is a major factor as far as any disorder in the country is concerned, since the total liveable area is too small for most people to survive in an efficient way. Table 3.2 and Figure 3.5 show that the total per-capita economic impact due to inadequate sanitation and hygiene is Tk. 2,072 ($29.6), of which Tk. 1,747 ($25)
fIgURE 3.3 ECONOMIC IMPACTS OF INADEQUATE SANITATION AS PERCENT OF GDP
fIgURE 3.4 HEALTH, WATER-RELATED, AND ACCESS TIME IMPACTS AS PERCENT OF TOTAL ECONOMIC IMPACTS
5.3%
0.3% 0.7%
0.0%
2.0%
4.0%
6.0%
Health Water Access time
Per
cent
of G
DP
Series1
Water 5%
Access time 11%
Health 84%
per capita is the loss related to health, Tk.102 ($1.5) the loss related to water, and Tk. 223 ($3.2) the loss related to access time.49 Again, the total financial impact due to inadequate sanitation and hygiene is Tk. 242 ($3.5) per capita, of which Tk. 213 ($3.0) related to health and Tk. 29 ($0.4) is related to water.50 Regarding economic impacts, 84 percent (Tk. 1,747) is related to health, 5 percent (Tk. 102) to water, and the remaining 11 percent (Tk. 223) to access time (Figure 3.5).
49 In 2009 prices, the total per-capita economic impact is Tk. 2,383 ($28.7), of which Tk. 2009 ($28.7) is the loss related to health, Tk.117 ($1.67) is related to water, and Tk. 256 ($3.66) is related to access time.50 In 2009 prices, Tk. 278.3 ($3.98), of which Tk. 244.95 ($3.5) per capita is the loss related to health and Tk. 33.35 ($0.47) is related to water.
Source: Author’s estimates.
Source: Author’s estimates.

49
Economic Impacts of Inadequate Sanitation in Bangladesh
www.wsp.org
Figure 3.6 shows that the per-capita financial impact of inadequate sanitation in Bangladesh in 2007 is equal to a loss of Tk. 242 ($3.5).51 Of this amount, health-related losses are 88 percent at Tk. 213 ($3.0) and water-related losses are 12 percent at Tk. 29 ($0.4).52 There are no data on the financial impacts on access time.
Gains from sanitation and hygiene interventionsTable 3.3 shows the estimated economic gains that can be achieved by implementing sanitation and hygiene interventions in Bangladesh, where interventions include improving access to and use of sanitary toilets, improved hygiene behavior, safe disposal of human excreta, and
fIgURE 3.5 PER-CAPITA ECONOMIC IMPACTS OF INADEQUATE SANITATION
Water 5%
Access time 11%
Health 84%
Source: Author’s estimates.
TABLE 3.2 PER-CAPITA ECONOMIC AND FINANCIAL IMPACTS OF INADEQUATE SANITATION
Impact Type Economic impacts financial impacts
Tk. US$ Tk. US$
Health 1,747 25 213 3
Water 102 1.5 29 0.4
Access time 223 3.2 - -
Total impact 2,072 29.6 242 3.5
Source: Author’s estimates.
improved access to good quality water. These economic gains can be achieved by avoiding losses from morbidity and mortality, eliminating domestic water-related costs that result from inadequate sanitation, reducing time accessing shared toilets and open defecation sites, and reducing absentee time at schools and workplaces. Improving a country’s overall sanitation system or facilities is in fact a complex challenge, one that involves action on several fronts. Individuals need to be aware of how their behavior may damage the environment and what they need to do to protect their own and public health. This requires education aimed at young people as well as information campaigns targeted to all age groups.
51 In 2009 prices, it is Tk. 278.3 ($3.97).52 In 2009 prices, health-related losses are Tk. 344.95 ($3.5) and water-related losses are Tk. 33.35 ($0.48).

50
Economic Impacts of Inadequate Sanitation in Bangladesh
Bangladesh Impact Study
Estimates presented in Table 3.3 show that Tk. 158.42 billion ($2.263 billion) of economic gains can be achieved from sanitation and hygiene interventions involving access to improved toilet facilities, hygiene education and hand-washing with soap, improved domestic water quality, improved water supply, improved food handling,
Interventions Million Tk. Million US$ Percent of
GDP
Percent of
economic
impacts
Per-capita
gains (Tk.)
Per-capita
gains (US$)
Gains for sanitation +
hygiene interventions
Sanitation and hygiene
combined158,423 2,263 3.4% 54% 1,111 15.9
Sanitation alone 111,519 1,593 2.4% 38% 782 11.2
Improved hygiene
behavior143,913 2,056 3.0% 49% 1,009 14.4
Water free from
bacteriological
contamination
Improved access to
safe water110,559 1,579 2.3% 37% 775 11.1
Safe confinement
and disposal of fecal
matter (sewage
treatment)
93,116 1,330 2.0% 32% 653 9.3
fIgURE 3.6 PER-CAPITA FINANCIAL IMPACTS OF INADEQUATE SANITATION
Health 88%Water 12%
and safe confinement and disposal of fecal matter (sewage treatment).53 These gains come from the three areas—health, water, and access time—that this study considers. It is equivalent to 3.4 percent of GDP, or Tk. 1,111 ($15.9) per capita in 2007.54
TABLE 3.3 POTENTIAL ECONOMIC GAINS FROM SANITATION AND HYGIENE INTERVENTIONS
53 In 2009 prices, it is Tk. 182.186 billion ($2.603 billion).54 In 2009 prices, the gain is 2.96 percent of GDP in 2009 or Tk. 1,278 ($18.25) per capita in 2009.
Source: Author’s estimates.
Source: Author’s estimates.

51
Economic Impacts of Inadequate Sanitation in Bangladesh
www.wsp.org
Access to improved toilets with hygiene education could result in gains of Tk.111.52 billion ($1.6 billion), equivalent to 2.4 percent of GDP;55 improved hygiene behavior, including improved water supply and toilet use, could result in gains of Tk. 143.91 billion ($2.0 billion), equivalent to 3.0 percent of GDP.56 Improved access to good quality water free from bacteriological contamination is estimated to result in gains of Tk. 110.56 billion ($1.58 billion), equivalent to 2.3 percent of GDP.57 Safe confinement and disposal of sewage is expected to generate a gain of Tk. 93.12 billion ($1.33 billion), equivalent to 2.0 percent of GDP.58
HEALTH IMPACTSIn this section, estimates are presented of the direct and indirect health impacts that are caused by inadequate sanitation in Bangladesh in 2007. Direct health impacts from diarrheal diseases, helminthes infection, and trachoma are estimated for all age groups. Indirect health impacts are estimated for deaths and diseases resulting from diarrhea- induced malnutrition only in children under age five. Indirect impacts are estimated for deaths from ALRI, malaria, measles, and all-cause mortality, and for disease cases from ALRI and malaria. (The methods used to estimate these health impacts are detailed in Chapter 2.)
Death and disease impactsWe know that inadequate sanitation has impacts on a variety of sectors, but among all of them the health sector is
the most pronounced. A large burden of diseases and deaths stems directly or indirectly from inadequate sanitation. The estimates presented in Figure 3.7 show that annual cases of diarrhea in children under age five in Bangladesh numbered 28 million in 2007 and that annual cases of diarrhea among all age groups numbered 85 million. Rural areas reported 73.6 percent of all diarrhea cases, and children under age five represented 75.5 percent of all. Urban areas reported 26.4 percent of all cases and 24.5 percent of cases in children under age five (Table 3.4). This shows that the chance of being a victim of diarrhea is much higher in rural areas than in urban areas. This is particularly true for children under age five where the rural population is concerned, since 74.4 percent of the total population in rural areas and 77.4 percent of children under five in those areas suffer from diarrhea.
Cases of ALRI diseases number 7 million annually among children under age five. The burden of ALRI attributable to inadequate sanitation via malnutrition is estimated only for children in that age group. This burden is mostly borne by the rural population, which accounts for 84.7 percent of the ALRI cases attributable to inadequate sanitation. An unexpected finding is that only 15.2 percent of diarrhea cases and 23.5 percent of ALRI cases in children are treated at a medical facility. With better treatment, these children’s suffering from illness, the severity of their illness, and resulting mortality would all be reduced, even though the underlying cause of these diseases can be addressed by improving sanitation and hygiene.
55 In 2009 prices,Tk. 128.247 billion ($1.8 billion) and 2.086 percent of GDP in 2009.56 In 2009 prices, it is Tk. 165.5 billion ($2.36 billion) and 2.74 percent of GDP in 2009.57 In 2009 prices, it is Tk. 127.143 billion ($1.816 billion) and 2.06 percent of GDP in 2009.58 In 2009 prices, it is Tk. 107.083 billion ($1.53 billion) and 1.74 percent of GDP in 2009.
85
28
7
0
20
40
60
80
100
Diarrhea, all Diarrhea, below 5 ALRI
million cases
fIgURE 3.7 CASES OF DIARRHEA AND ALRI RESULTING FROM INADEQUATE SANITATION
Source: Bangladesh Demographic and Health Survey 2007, and author’s estimates.

52
Economic Impacts of Inadequate Sanitation in Bangladesh
Bangladesh Impact Study
Considering the whole population, it has been found that almost 8 percent of deaths from all causes in Bangladesh result from causes related to inadequate sanitation and hygiene. Table 3.5 and Figure 3.8 show that deaths from diarrhea alone account for 4.3 percent of all deaths, while ALRI accounts for 1.1 percent. Deaths of children under age five attributed to inadequate sanitation make up almost 32 percent of all deaths, and those under-five deaths attributed to diarrhea account for almost 18 percent of all deaths. Diarrhea causes more than half (55 percent) of all sanitation and hygiene-related deaths in children under five.
ALRI cases: Children under age five
diarrhea cases: Children under age five
diarrhea cases:
All ages
Share of
population
Share of population
under age 5
Millions Percent
Millions
Percent Millions Percent Percent Percent
Rural 6.1 84.7%
21.1
75.5% 62.7 73.6% 74.4% 77.4%
Urban 1.1 15.2%
6.8
24.5% 22.4 26.4% 25.6% 22.6%
Total 7.2 100%
28.0
100% 85.1 100% 100% 100%
Another important cause of mortality among children under age five is ALRI resulting from malnutrition. Among these children, ALRI is recognized as causing 5.1 percent of all deaths and 15.9 percent of deaths from inadequate sanitation and hygiene. Eliminating deaths caused by inadequate sanitation and hygiene-linked diseases would greatly elevate Bangladesh’s life expectancy at birth, because most of these deaths are in children and children make up a large share of the country’s relatively young population.
TABLE 3.4 ANNUAL CASES OF DIARRHEA AND ALRI ATTRIBUTABLE TO SANITATION
fIgURE 3.8 DEATHS ATTRIBUTED TO INADEQUATE SANITATION AS PERCENT OF ALL-CAUSE DEATHS
Other causes
ALRI
ALRI
Diarrhea
Diarrhea
All sanitation deaths
All sanitation deaths
Other causes
All
pop
ulat
ion
Bel
ow 5
yea
rs
2%
1%
4%
8%
8%
5%
17%
32%
Source: Death rates from WHO-GRD: author’s estimates.
Source: BDHS 2007; and author’s estimates.

53
Economic Impacts of Inadequate Sanitation in Bangladesh
www.wsp.org
Table 3.6 presents the number of deaths, time lost, and cases due to inadequate sanitation and hygiene in Bangladesh in 2007. The scenario is alarming. The total number of deaths due to inadequate sanitation is 84,569, among which diarrhea is estimated to have caused 48,661 deaths. More than 43,126 (89 percent) occur in children under age five, and more than 5,415 (11 percent) occur in people over age 15.
As explored earlier, sanitation-related diseases cause extensive loss of time not only for adults but for children as well. This affects children’s attendance at school and at play grounds.
Children under age 5:
Sanitation-attributable
deaths as percent of
all deaths
Total population:
Sanitation attributable
deaths as percent of
all deaths
Children under age
five: distribution of
deaths attributable
to poor sanitation
Total population:
distribution of deaths
attributable to
poor sanitation
Diarrhea (direct) 17.4 4.3 54.8 57.5
ALRI 5.1 1.1 15.9 14.9
Measles 1.7 0.4 5.3 4.9
Malaria 0.08 0.02 0.25 0.24
Other causes 7.5 1.7 23.7 22.1
Helminthes (direct) 0.02 0.03 0.06 0.4
Total mortality 31.9 7.5 100 100
Source: WHO-GBD death rate, and author’s estimates.
The effects of this absence are both short term and long term. Short-term, children suffering from various direct and indirect diseases due to inadequate sanitation finally become unhealthy. In the long term, unhealthy children are forced into a disadvantaged position in the job market when they grow into adults. In the aggregate, almost 714 million days of normal activities are estimated to have been lost due to these diseases in Bangladesh in 2007; a large majority of them resulted from diarrhea and diarrhea-induced illnesses, which account for over 91 percent of the lost time. ALRI and helminthes infection constitute other major causes of time lost from normal activities.
DiseaseCases treated at medical
facilities (millions)Total cases (millions) Time lost
(million days)deaths
(persons)diarrhea 12.97 85.15 646.63 48,661
Children under age 5 5.086 28.01 213.21 43,126
Children ages 5 to 147.89 57.14 433.42
121
Population ages 15+ 5,415
helminthes infection 13.29 19.30 11.63 328
Children under age 5 1.09 2.08 0.95 49
Children ages 5 to 14 3.38 4.86 2.96 259
Population ages 15+ 8.82 12.36 7.72 20
ALRI 1.7 7.23 54.93 12,597
Measles - - - 4,137
Malaria 0.00028 0.00072 0.0054 199Other causes - - - 18,647
Total 27.96 111.68 713.19 84,569
Source: Ministry of Health and Family Welfare, 2007; Directorate General of Health Services, 2008a; and author’s estimates.
TABLE 3.5 PERCENT OF DEATHS ATTRIBUTABLE TO INADEQUATE SANITATION AND HYGIENE, BY DISEASE AND AGE GROUP
Table 3.6 Deaths, cases, anD time lost from inaDequate sanitation

54
Economic Impacts of Inadequate Sanitation in Bangladesh
Bangladesh Impact Study
The economic impact of premature mortality Premature deaths due to inadequate sanitation have serious effects on economic costs. Of the total health-related economic impact, 13 percent (Tk. 31,941 million) is due to productivity losses from poor sanitation and hygiene.59
The costs of treatment account for 9 percent (Tk. 22,144 million) and premature deaths account for 78 percent (Tk. 195,101 million). Deaths, treatment costs, and productivity losses from diarrhea have the largest impacts in each of these categories of health impacts.60
Diarrhea Helminthes ALRI Measles MalariaOther causes
Premature Death 70% 26% 85% 100% 99.9% 100%
Treatment 12% 41% 8% 0.04%
Productivity 18% 33% 6% 0.05%
0%
20%
40%
60%
80%
100%
Figure 3.10 Distribution of economic impacts of inadequate sanitation by diseases
Figure 3.10 shows that premature death dominates health losses from inadequate sanitation. Productivity losses make up 18 percent (Tk. 29,030 million) of diarrheal impacts, 33 percent (Tk. 714 million) of helminthes impacts, 6 percent (Tk. 2,197 million) of ALRI impacts, and 0.5 percent (Tk. 0.24 million) of malaria impacts.61 Premature deaths account for 70 percent (Tk. 110,489 million) of diarrheal impacts, 26 percent (Tk. 549 million) of helminthes impacts, 85 percent (Tk. 29,762 million) of ALRI impacts, 100 percent (9,773) of measles impacts, 99.9 percent (Tk. 470 million)
fIgURE 3.9 DISTRIBUTION OF HEALTH ECONOMIC IMPACTS OF INADEQUATE SANITATION IN BANGLADESH IN 2007
fIgURE 3.10 DISTRIBUTION OF ECONOMIC IMPACTS OF INADEQUATE SANITATION BY DISEASES
Diarrhea Helminthes ALRI Measles Malaria Other causes
70% 26% 85% 100% 99.9% 100%Treatment 12% 41% 8% 0.04%Productivity 18% 33% 6% 0.05%
0%
20%
40%
60%
80%
100%
Premature death
59 In 2009 prices, it is Tk. 36,732.15 million.60 In 2009 prices, cost of treatment is Tk. 25,465.6 million and losses due to premature death is Tk. 224,366.15 million.61 In 2009 prices, productivity losses are Tk. 33,384.5 million from diarrheal impacts; Tk. 821.1 million from helminthes impacts; Tk.2,526.55 million from ALRI impacts; and Tk. 0.276 million from malaria impacts.
Source: Author’s estimates.
Productivity loss, Tk. 31,941 million, 13%
Treatment costs, Tk. 22,144 million, 9% Premature death, Tk. 195,101 million, 78%
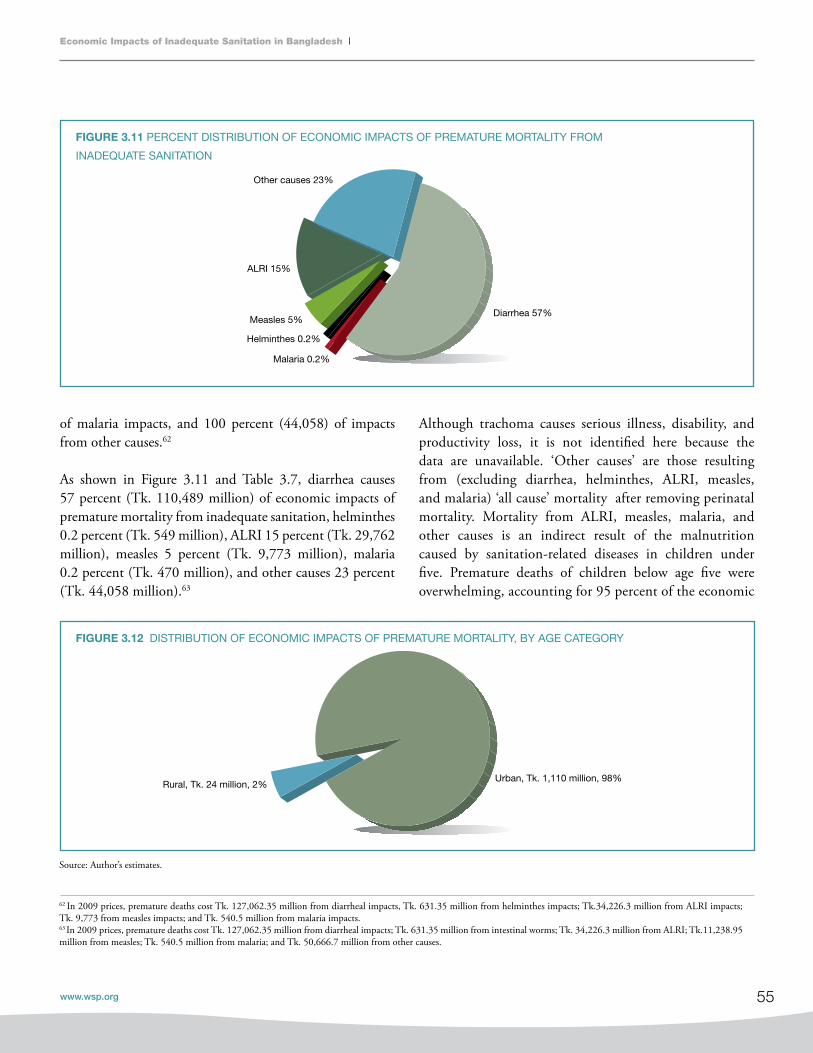
55
Economic Impacts of Inadequate Sanitation in Bangladesh
www.wsp.org
of malaria impacts, and 100 percent (44,058) of impacts from other causes.62
As shown in Figure 3.11 and Table 3.7, diarrhea causes 57 percent (Tk. 110,489 million) of economic impacts of premature mortality from inadequate sanitation, helminthes 0.2 percent (Tk. 549 million), ALRI 15 percent (Tk. 29,762 million), measles 5 percent (Tk. 9,773 million), malaria 0.2 percent (Tk. 470 million), and other causes 23 percent (Tk. 44,058 million).63
fIgURE 3.11 PERCENT DISTRIBUTION OF ECONOMIC IMPACTS OF PREMATURE MORTALITY FROM
INADEQUATE SANITATION
fIgURE 3.12 DISTRIBUTION OF ECONOMIC IMPACTS OF PREMATURE MORTALITY, BY AGE CATEGORY
Diarrhea 57%
Helminthes 0.2%
ALRI 15%
Measles 5%
Malaria 0.2%
Other causes 23%
Although trachoma causes serious illness, disability, and productivity loss, it is not identified here because the data are unavailable. ‘Other causes’ are those resulting from (excluding diarrhea, helminthes, ALRI, measles, and malaria) ‘all cause’ mortality after removing perinatal mortality. Mortality from ALRI, measles, malaria, and other causes is an indirect result of the malnutrition caused by sanitation-related diseases in children under five. Premature deaths of children below age five were overwhelming, accounting for 95 percent of the economic
62 In 2009 prices, premature deaths cost Tk. 127,062.35 million from diarrheal impacts, Tk. 631.35 million from helminthes impacts; Tk.34,226.3 million from ALRI impacts; Tk. 9,773 from measles impacts; and Tk. 540.5 million from malaria impacts.63 In 2009 prices, premature deaths cost Tk. 127,062.35 million from diarrheal impacts; Tk. 631.35 million from intestinal worms; Tk. 34,226.3 million from ALRI; Tk.11,238.95 million from measles; Tk. 540.5 million from malaria; and Tk. 50,666.7 million from other causes.
Rural, Tk. 24 million, 2% Urban, Tk. 1,110 million, 98%
Source: Author’s estimates.

56
Economic Impacts of Inadequate Sanitation in Bangladesh
Bangladesh Impact Study
impacts of premature death in Bangladesh in 2007 (see Figure 3.12). Diarrhea causes 55 percent of the economic impacts from premature deaths in children under five, while
fIgURE 3.13 DISTRIBUTION OF ECONOMIC IMPACTS OF INADEQUATE SANITATION VIA PREMATURE DEATH AMONG
CHILDREN UNDER FIVE
Diarrhea, Tk. 101,893 million, 55% Malaria, Tk. 470 million, 0.3%
Helminthes, Tk. 116 million, 0.1%
Measles, Tk. 9,773 million, 5%
ALRI, Tk. 29,762 million, 16%
Other causes, Tk. 44,058 million, 24%
Tk. (millions)
Premature death Treatment Productivity Total impacts
Diarrhea (direct) 110,489 18,334 29,030 157,852
Helminthes (direct) 549 874 714 2,137
ALRI 29,762 2,936 2,197 34,895
Measles 9,773 - - 9,773
Malaria 470 0.17 0.24 470
Other causes 44,058 - - 44,058
Total 195,101 22,144 31,941 249,186
ALRI causes 16 percent, helminthes 0.1 percent, measles 5 percent, malaria 0.3 percent, and other causes 24 percent (see Figure 3.13).
TABLE 3.7 HEALTH RELATED ECONOMIC IMPACTS OF INADEQUATE SANITATION FROM VARIOUS DISEASES
Source: Author’s estimates.

57
Economic Impacts of Inadequate Sanitation in Bangladesh
www.wsp.org
The economic impact of morbidityMorbidity impacts constitute a good share of the health impacts within each disease category: 0.1 percent of malaria, 15 percent of ALRI, 74 percent of helminthes, and 30 percent of diarrheal impacts result from morbidity (Figure 3.14). It can be seen from Figure 3.15 that the average treatment cost is 41 percent and average productivity loss is 59 percent of the total morbidity-related economic impact. The treatment costs for morbidity induced by malaria makes up 41 percent
of that disease’s total impact; for helminthes treatment costs make up 55 percent, for ALRI 57 percent, and for diarrhea 39 percent of total morbidity impacts. Productivity losses make up 61 percent of total morbidity impacts for diarrhea, 45 percent of those for helminthes, 43 percent of those for ALRI, and 59 percent of those for malaria. As a result, it can be seen that in the case of diarrhea due to inadequate sanitation, the productivity loss is higher than the treatment costs.
fIgURE 3.14 ECONOMIC IMPACTS OF MORBIDITY AS PERCENT OF HEALTH IMPACTS OF
INADEQUATE SANITATION, BY DISEASE
fIgURE 3.15 PERCENT DISTRIBUTION OF ECONOMIC IMPACTS OF MORBIDITY DUE TO INADEQUATE SANITATION AMONG
TREATMENT COST AND PRODUCTIVITY
30%
Diarrhea Intestinalworms
ALRI Malaria Total
74%
15%
0.1%
22%
Diarrhea
Treatment Productivity
Intestinal worms ALRI Malaria Total
39% 55% 57% 41% 41%
61% 45% 43% 59% 59%
Source: Author’s estimates.
Source: Author’s estimates.

58
Economic Impacts of Inadequate Sanitation in Bangladesh
Bangladesh Impact Study
As Figure 3.16 shows, it also appears that among total morbidity costs due to inadequate sanitation, diarrhea accounts for 88 percent, ALRI for 9 percent, and helminthes for 3 percent. Therefore, diarrhea is the single cause most responsible for the cost of poor sanitation-mediated morbidity.
Treatment cost of morbidity The distribution of treatment costs of sanitation-related diseases in Bangladesh by age group is shown in Table 3.8. It appears that the total cost could be as high as Tk. 22,144 million, of which 83 percent is due to diarrhea.64 Diarrheal
cases for children below age five account for 33 percent of the total cost, whereas diarrheal cases for all people above age 5 account for 51 percent.
Productivity and welfare losses from morbidityThe health-related productivity and welfare costs of inadequate sanitation, as shown in Table 3.9, could be as high as Tk. 31,941 million, of which 91 percent is due to diarrhea.65 Diarrheal cases for children below age five account for 29 percent of the total cost, whereas diarrheal cases for people above age five account for 62 percent.
fIgURE 3.16 PERCENT DISTRIBUTION OF MORBIDITY COSTS OF INADEQUATE SANITATION
Diarrhea, 88.17%Intestinal worms, 2.96%
Malaria, 0.001%
ALRI, 8.88%
Source: Author’s estimates.
64 In 2009 prices, it is Tk. 25,465.6 million. 65 In 2009 prices, it is Tk. 36,732 million.
TABLE 3.8 AGE DISTRIBUTION OF TREATMENT COSTS OF SANITATION-RELATED DISEASES (TK. MILLION)
Under age 5 Over age 5 Total
Diarrhea 7,230 11,104 18,334
Helminthes 72 802 874
ALRI 2,936 - 2,936
Malaria 0.17 - 0.17
Total 10,238 11,906 22,144
Source: Author’s estimates.

59
Economic Impacts of Inadequate Sanitation in Bangladesh
www.wsp.org
DOMESTIC WATER IMPACTS
Water pollutionBangladesh’s water crisis affects both rural and urban areas, and the crisis is related to both water scarcity and water quality. While Bangladesh has made much progress in supplying safe water to its people, gross disparities in coverage still exist across the country. For the past two decades, the water from over a million tube wells has been slowly poisoning Bangladeshi villagers with naturally occurring arsenic. Over 18 million people are drinking this poisoned water daily. Since Bangladesh won independence in 1971, western donors have funded the construction of thousands of wells, especially in rural areas. In the early 1990s, however, many were found to be contaminated with naturally occurring arsenic. Nobody knows exactly how many people have died, but as many as 50 million may have been affected by arsenic poisoning (Harding, 2002). The arsenicosis situation in Bangladesh is no less than alarming. It is officially recognized by the Government of Bangladesh that 50 percent of the population of 150 million people are currently at risk of arsenic poisoning from ground water
used for drinking (Planning Commission, 2008, pp. 62, 85). Barkat and Hussam (2008) have shown that out of the 30 million households in Bangladesh, 50 percent are at risk of arsenicosis, and the poor (comprising 40 percent of the population) are 11 times more likely than the rich to get this illness. These authors therefore argue that ‘arsenicosis is a disease of poverty’.
Drinking and domestic water In Bangladesh, there are various sources of household drinking water, including piped water, public taps, tube wells, protected and unprotected dug wells, rain water, surface water, and bottled water (see Table 3.10 and Figure 3.17). The tube well is the most prominent source of household drinking water, with 90 percent of people in the country depending on it for that purpose daily. The rate of use of tube wells is comparatively high in rural areas, where 95.5 percent of people use it; in urban areas 70.5 percent of people use this source for their household drinking water. As mentioned earlier, 26.2 percent of people in urban areas use piped water that is run into their dwelling, yard, or plot.
TABLE 3.9 HEALTH-RELATED PRODUCTIVITY AND WELFARE COSTS OF INADEQUATE SANITATION,
BY DISEASE AND AGE GROUP (TK. MILLION)
disease Under age 5 Over age 5 Total
Diarrhea 9,356 19,673 29,029
Intestinal worms 34 680 714
ALRI 2,197 - 2,197
Malaria 0.24 - 0.24
Total 11,588 20,353 31,941
Source: Author’s estimate
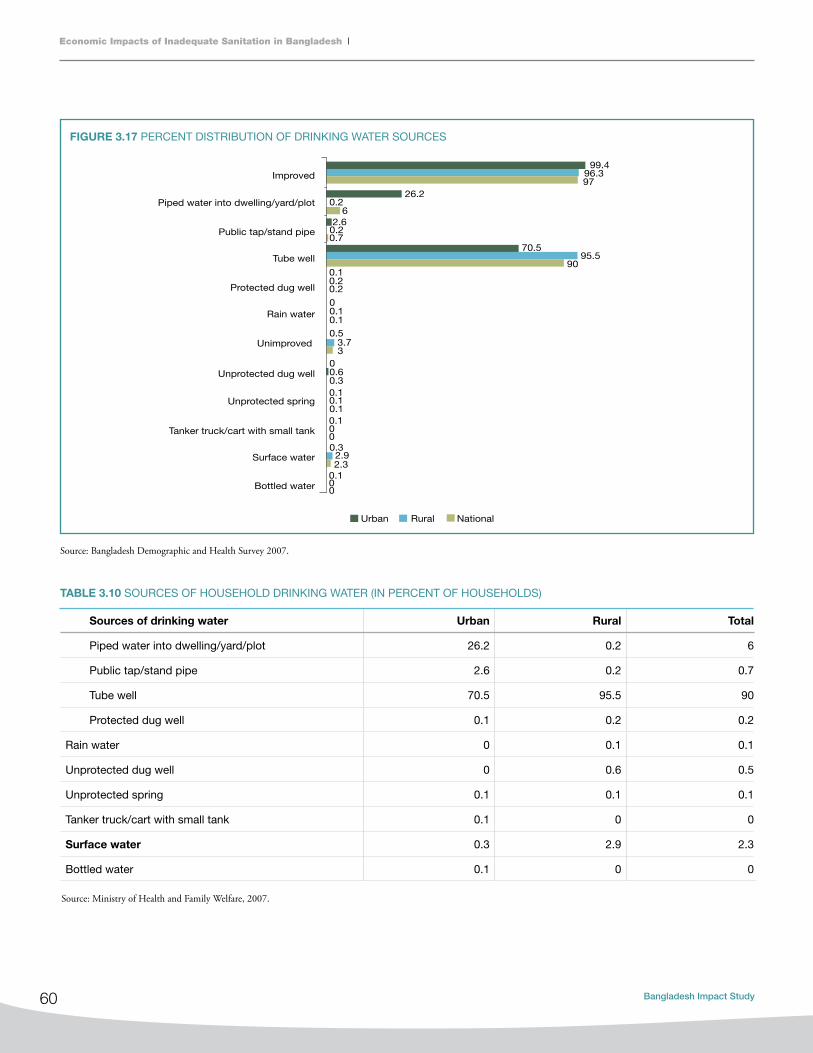
60
Economic Impacts of Inadequate Sanitation in Bangladesh
Bangladesh Impact Study
fIgURE 3.17 PERCENT DISTRIBUTION OF DRINKING WATER SOURCES
Urban Rural National
Improved99.4
96.397
26.2
60.2
2.60.20.7
0.10.20.2
00.10.10.5
0.60
00
00
0.32.92.3
0.30.10.10.1
0.1
0.1
3.73
70.595.5
90
Piped water into dwelling/yard/plot
Public tap/stand pipe
Tube well
Protected dug well
Rain water
Unimproved
Unprotected spring
Unprotected dug well
Tanker truck/cart with small tank
Surface water
Bottled water
Sources of drinking water Urban Rural Total
Piped water into dwelling/yard/plot 26.2 0.2 6
Public tap/stand pipe 2.6 0.2 0.7
Tube well 70.5 95.5 90
Protected dug well 0.1 0.2 0.2
Rain water 0 0.1 0.1
Unprotected dug well 0 0.6 0.5
Unprotected spring 0.1 0.1 0.1
Tanker truck/cart with small tank 0.1 0 0
Surface water 0.3 2.9 2.3
Bottled water 0.1 0 0
TABLE 3.10 SOURCES OF HOUSEHOLD DRINKING WATER (IN PERCENT OF HOUSEHOLDS)
Source: Bangladesh Demographic and Health Survey 2007.
Source: Ministry of Health and Family Welfare, 2007.

61
Economic Impacts of Inadequate Sanitation in Bangladesh
www.wsp.org
Figure 3.18 and Table 3.11 show that the aggregate cost of household water treatment is Tk. 9,841 million, which is 68 percent of the total economic cost related to domestic water.66 The cost due to piped water is Tk. 1,134 million (8 percent), and the cost of hauling cleaner water from outside the household is Tk. 3,535 million (24 percent).67
The financial cost of household water treatment is Tk. 3,045 million (73 percent), piped water attributable to sanitation is Tk. 1,134 million (27 percent).68 The data on bottled
HH treatment Piped water Hauled water
8,398
1,44324
1,1102,065
1,471
Rural Urban
fIgURE 3.18 DOMESTIC WATER-RELATED ECONOMIC IMPACTS OF INADEQUATE SANITATION, BY RESIDENCE
water in Bangladesh are not sufficiently reliable to permit estimating economic and financial impacts.
Of the total costs of Tk. 9,841 million for domestic water treatment, rural residents bear Tk. 1, 443 million (15 percent) and urban residents Tk. 8,398 million (85 percent).69 Again, the financial costs of household treatment of drinking water make up 72 percent of total national impacts, 68 percent in urban areas, and 5 percent in rural areas.
Economic (total) financial (direct cost)
Cost
(Tk. millions)
Percent of
national impacts
in sub-category
Percent of
total national
impacts
Cost
(Tk. millions)
Percent of
national impacts
in sub-category
Percent of
total national
impacts
household treatment (national) 9,841 100% 68% 3,045 100% 73%
Rural 1,443 15% 10% 210 7% 5%
Urban 8,398 85% 58% 2,835 93% 68%
Piped water (national) 1,134 100% 8% 1,134 100% 27%
Rural 24 2% 0% 24 2% 1%
Urban 1,110 98% 8% 1,110 98% 27%
hauled water (national) 3,535 100% 24% 0 100% 0%
Rural 2,065 58% 14% 0 0% 0%
Urban 1,471 42% 10% 0 0% 0%
Total (national) 1,4510 100% 100% 4,179 100% 100%
Total rural 3,531 24% 24% 234 6% 6%
Total urban 10,979 76% 76% 3,945 94% 94%
TABLE 3.11 DOMESTIC WATER-RELATED ECONOMIC IMPACTS OF INADEQUATE SANITATION, BY LOCATION AND TYPE OF IMPACTS
66 In 2009 prices, the cost is Tk. 11,317.15 million.67 In 2009 prices, the cost of piped water is Tk. 1,304.1 million and cost of hauling cleaner water is Tk. 40,625.25 million.68 In 2009 prices, the financial cost of household water treatment is Tk. 3,502 million and the cost of piped water used for sanitation is Tk. 1,304.1 million.69 In 2009 prices, the total cost of HH water treatment is Tk. 11,317.15 million; share of rural area is Tk. 11,317.15 million, and share of urban area is Tk. 9,657.7 million.
Source: Author’s estimates.
Source: Author’s estimates.

62
Economic Impacts of Inadequate Sanitation in Bangladesh
Bangladesh Impact Study
Household treatment of drinking waterThe cost to households of treating drinking water arises from the use of various drinking water treatment methods, which primarily include boiling, use of bleach/chlorine, straining through cloth, and filtering with ceramic/sand filters. Figure 3.19 indicates that 17.5 percent of households in urban areas treat drinking water by boiling it, while a very insignificant share of households (0.6 percent) in rural areas practice this method. Although the total share of households using other methods is not as high as that for the boiling method, the percentages of urban households using different methods are higher than those for the rural households.
According to Table 3.12, the urban residents of Bangladesh incur a majority of the national household cost of water treatment by boiling (Tk. 7,796 million, 89.41 percent), a majority of the cost of using bleach/chlorine (Tk. 59 million, 63.73 percent), and a majority of the cost of straining through cloth (Tk. 292 million, 77.23 percent).70
Of the total costs of Tk. 9,841.13 million for domestic water treatment, rural residents bear Tk. 1,442.79 million (14.66 percent) and urban residents Tk. 8,398.33 million (85.34 percent).71
Reviewing the treatment costs by method, the costs of boiling account for 88.61 percent (Tk. 8,720 million) of household water treatment costs nationally, including 63.98 percent (Tk. 523 million) of rural costs and 92.64 percent (Tk. 7,796 million) of urban costs (Figure 3.20).72 The cost of ceramic, sand, and other filtering methods makes up 6.61 percent (Tk. 651 million) of national costs, including 27.71 percent (Tk. 400 million) of rural and 2.99 percent (Tk. 251 million) of urban costs.73 The cost of straining water through cloth make up 3.84 percent (Tk. 378 million) of national water treatment costs, including 5.96 percent (Tk. 86 million) of rural costs and 3.47 percent (Tk. 292 million) of urban costs.74 A summary of the share of the water treatment cost is presented in Figure 3.21.
fIgURE 3.19 PERCENT OF HOUSEHOLDS USING VARIOUS DRINKING
WATER TREATMENT METHODS
Urban Rural
Straining through cloth
Ceramic, sand, and filters
Bleach/chlorine
BoilingElectronicpurified
0 0
3.101.70
0.70 0.50 0.10
17.50
0.60
6.90
Boiling Bleach/chlorine Straining through cloth Ceramic, sand, other filter Electronic purifier Total
Total 8,720 93 378 651 0 9,842
Rural 923 34 86 400 0 1,443
Urban 7,796 59 292 251 0 8,398
TABLE 3.12 ECONOMIC IMPACTS FROM TREATMENT OF HOUSEHOLD WATER DUE TO INADEQUATE SANITATION (TK. MILLIONS)
70 In 2009 prices, it is Tk. 8,965 million for boiling, Tk. 67.85 million for chlorine, Tk. 335.8 million for cloth-filtration.71 In 2009 prices, total cost is Tk. 11,318.3 million for household water treatment; for rural residents it is Tk. 1,659.45 million and for urban residents Tk. 9,675.9 million.72 In 2009 prices, total cost of boiling water at the national level is Tk. 10,028 million; rural area cost is Tk. 611.8 million and urban area cost is Tk. 8,965 million.73 In 2009 prices, total cost of ceramic and sand filtration is Tk. 748.5 million at the national level; rural area cost is Tk. 460 million and urban area cost is Tk. 288.5 million.74 In 2009 prices, cost of cloth-filtration in rural areas is Tk. 98.3 million; in urban areas it is Tk. 335.8 million.
Source: Bangladesh Demographic and Health Survey 2007.
Source: Author’s estimates.

63
Economic Impacts of Inadequate Sanitation in Bangladesh
www.wsp.org
fIgURE 3.21 PERCENT DISTRIBUTION OF ANNUAL ECONOMIC IMPACTS AMONG RURAL AND URBAN LOCATIONS, BY
WATER-TREATMENT METHOD
88.61% 92.84%
63.98%
0%
20%
40%
60%
80%
100%
Bangladesh Urban Rural
Electronic purified Ceramic, sand, and filter Straining through cloth Bleach/clorine Boiling
Source: Author’s estimates.
Source: Author’s estimates.
85.34%
93.10%
0%
38.55%
77.23%
63.73%
89.41%
14.66%
6.90%
0%
61.45%
22.77%
36.27%
10.59%
0% 20% 40% 60% 80% 100%
Economic cost
Monetary impact
Cost of electronic purifier
Cost of filter
Cost of straining through cloth
Cost of bleach/clorine
Cost of boiling
Rural Urban
fIgURE 3.20 PERCENT DISTRIBUTION OF ANNUAL ECONOMIC IMPACTS OF VARIOUS WATER TREATMENT METHODS, BY
LOCATION (RURAL, URBAN, AND NATIONAL)

64
Economic Impacts of Inadequate Sanitation in Bangladesh
Bangladesh Impact Study
Piped waterWe know that urban people depend mostly on piped water, and the statistics support this claim. Since more people in urban areas are using piped, the cost of piped water due to inadequate sanitation in Bangladesh must be higher for urban households. The share of urban households in the total cost of piped water due to inadequate sanitation is 98 percent (Tk. 1,110 million), while on the other hand rural households bear only a 2 percent share (Tk. 24 million) (Figure 3.22).75
Hauled water The economic cost of hauled water is higher for rural households than for urban households. Of the total economic cost of hauled water in Bangladesh, rural households account for 58 percent, amounting toTk. 2,064.59 million. The remaining 42 percent is borne by urban households (Figure 3.23).76
fIgURE 3.22 PERCENT DISTRIBUTION OF COST OF PIPED WATER DUE TO INADEQUATE SANITATION AMONG RURAL AND
URBAN HOUSEHOLDS
fIgURE 3.23 PERCENT DISTRIBUTION OF ECONOMIC COST OF HAULED WATER AMONG RURAL AND URBAN HOUSEHOLDS
Rural, Tk. 24 million, 2% Urban, Tk. 1,110 million, 98%
Source: Author’s estimates.
Source: Author’s estimates.
Rural, Tk. 2,064.59 million, 58% Urban, Tk. 1,470.71 million, 42%
75 In 2009 prices, urban area bears Tk. 1,276.5 million and rural area bears Tk. 24 million. 76 In 2009 prices, rural area bears Tk. 2,374.28 million and urban area bears Tk 1,691.3 million.
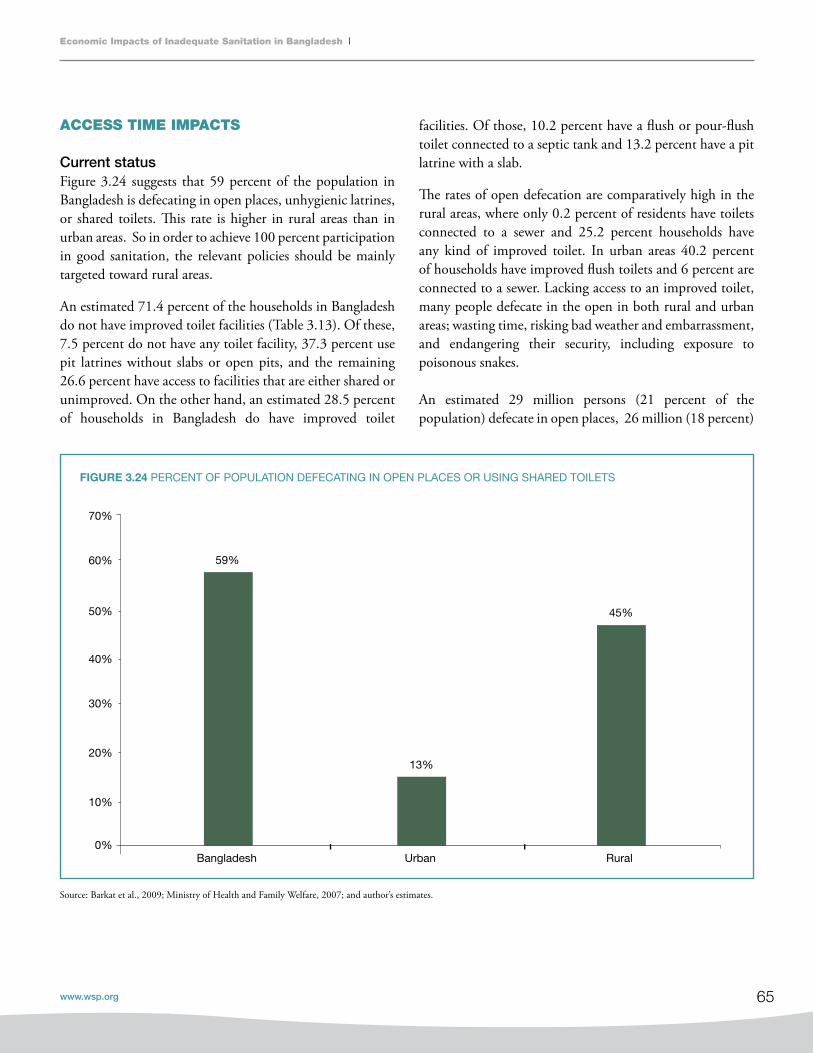
65
Economic Impacts of Inadequate Sanitation in Bangladesh
www.wsp.org
ACCESS TIME IMPACTS
Current statusFigure 3.24 suggests that 59 percent of the population in Bangladesh is defecating in open places, unhygienic latrines, or shared toilets. This rate is higher in rural areas than in urban areas. So in order to achieve 100 percent participation in good sanitation, the relevant policies should be mainly targeted toward rural areas.
An estimated 71.4 percent of the households in Bangladesh do not have improved toilet facilities (Table 3.13). Of these, 7.5 percent do not have any toilet facility, 37.3 percent use pit latrines without slabs or open pits, and the remaining 26.6 percent have access to facilities that are either shared or unimproved. On the other hand, an estimated 28.5 percent of households in Bangladesh do have improved toilet
fIgURE 3.24 PERCENT OF POPULATION DEFECATING IN OPEN PLACES OR USING SHARED TOILETS
Source: Barkat et al., 2009; Ministry of Health and Family Welfare, 2007; and author’s estimates.
facilities. Of those, 10.2 percent have a flush or pour-flush toilet connected to a septic tank and 13.2 percent have a pit latrine with a slab.
The rates of open defecation are comparatively high in the rural areas, where only 0.2 percent of residents have toilets connected to a sewer and 25.2 percent households have any kind of improved toilet. In urban areas 40.2 percent of households have improved flush toilets and 6 percent are connected to a sewer. Lacking access to an improved toilet, many people defecate in the open in both rural and urban areas; wasting time, risking bad weather and embarrassment, and endangering their security, including exposure to poisonous snakes.
An estimated 29 million persons (21 percent of the population) defecate in open places, 26 million (18 percent)
59%
13%
45%
0%
10%
20%
30%
40%
50%
60%
70%
Bangladesh Urban Rural

66
Economic Impacts of Inadequate Sanitation in Bangladesh
Bangladesh Impact Study
Sources of drinking water improved, not shared Urban
40.2
Rural
25.2
National
28.5
Flush/pour-flush to piped sewer system 6 0.2 1.5
Flush/pour-flush to septic tank 21.7 6.9 10.2
Flush/pour-flush to pit latrine 4.3 3.5 3.7
Pit latrine with slab 8.2 14.6 13.2
Unimproved facility 59.8 74.8 71.4
Any facility shared with other households 19.9 11.5 13.4
Flush/pour-flush but not connected to sewer/septic
tank/pit latrine13.5 0.6 3.5
Pit latrine without slab/open pit 19.5 42.3 37.3
Bucket 0.1 0.1 0.1
Hanging toilet/hanging latrine 5.1 11.1 9.8
No facility/bush/field 1.7 9.1 7.5
Source: Ministry of Health and Family Welfare, 2007; and author’s estimates.
TABLE 3.13 PERCENT DISTRIBUTION OF HOUSEHOLD ACCESS TO VARIOUS TYPES OF TOILET, URBAN VS. RURAL
TABLE 3.14 NUMBER OF PERSONS AND PERCENT OF POPULATION DEFECATING IN THE OPEN AND
USING SHARED TOILETS, URBAN VS. RURAL
of them rural residents and 3 million (2 percent) of them urban residents. People using shared toilets number 54 million nationally (38 percent of the total population); 38 million (27 percent) of them rural residents and 16 million
(11 percent) urban residents. Therefore, 83 million people (59 percent) either defecate in the open or use shared toilets, 64 million (45 percent) of them rural residents and 19 million (13 percent) of them urban residents (Table 3.14).
Source: Barkat et al., 2009; BDHS 2007; and author’s estimates.
Population Persons defecating in the open Persons using shared toilets
Million Percent of population Million Percent of population
Total 29 21% 54 38%
Rural 26 18% 38 27%
Urban 3 2% 16 11%

67
Economic Impacts of Inadequate Sanitation in Bangladesh
www.wsp.org
A welfare loss can be incurred due to lack of good toilet facilities. Insufficient access to good toilets can result in loss of time, comfort, convenience, security, dignity, and status, and it can also lead to conflicts within the community. These losses are felt more heavily by women and girls. We have therefore estimated losses from inadequate sanitation in schools and in workplaces, though these estimates are made only for losses by girls aged 11 to 17 in schools without girls’ toilets and for working women due to absence from work during menstrual periods.
Access time for accessing toiletsThis research estimates that an extra 5,119 million hours are spent accessing open defecation sites and shared toilets. The economic cost of this lost access time is estimated to be Tk. 30,112 million.77 Of that total, 3,472 million hours and Tk. 17,365 million (57 percent) in costs are due to the extra time used in accessing open defecation sites, and 1,647 million hours and Tk. 12,747 million (43 percent) in costs are due to the extra time used in accessing shared toilets (Figures 3.25 and 3.26).78
fIgURE 3.25 ACCESS TIME LOST DUE TO INADEQUATE SANITATION
fIgURE 3.26 ECONOMIC COST OF ACCESS TIME LOST DUE TO INADEQUATE SANITATION
Source: Author’s estimates.
Source: Author’s estimates.
77 In 2009 prices, it is Tk. 34,628.8 million. 78 In 2009 prices, extra time used in accessing open defecation and shared toilets cost is Tk. 19,969.75 million and Tk. 14,659.05 million, respectively.
1,167
301 480
3,171
-
1,000
2,000
3,000
4,000
Open defecation Shared toilet
Mill
ion
hour
Rural Urban
3,9236,164
13,4426,583
0
4,000
8,000
12,000
16,000
20,000
Open defecation Shared toilet
Mill
ion
Tk.
Rural Urban

68
Economic Impacts of Inadequate Sanitation in Bangladesh
Bangladesh Impact Study
Rural residents bear a substantial 77 percent (Tk. 13,442 million) of the time costs of accessing open defecation sites, and urban residents bear the remaining 23 percent (Tk. 3,923 million).79 In the case of shared toilets, urban residents bear 48 percent (Tk. 6,164 million) and rural residents bear the remaining 52 percent (Tk. 6,583 million) of the time cost (Table 3.15).80
79 In 2009 prices, rural area bears Tk. 4,511.45 million and urban area bears Tk. 15,458.3 million.80 In 2009 prices, urban area’s share is Tk. 7,088.6 million and rural area’s share is Tk. 7,570.45 million.81 In 2009 prices, the figures are Tk. 981.38 million for school girls and Tk. 936.05 million for working women, totaling Tk.1,917.43 million.82 In 2009 prices, rural area bears Tk. 1,046.7 million and urban area bears Tk. 870.77 million.
Open defecation Shared toilets Total cost of access time
Tk. million Percent Tk. million Percent Tk. million Percent
Total 17,366 100% 12,746 100% 30,112 100%
Rural 13,442 77% 6,583 52% 20,025 67%
Urban 3,923 23% 6,164 48% 10,087 33%
School and workplace sanitation-related impactsThe economic cost of inadequate sanitation in schools and workplaces, due to the loss of student and worker time, is estimated to be Tk. 853.37 million for girls and Tk. 813.96 million for working women, totaling Tk. 1,667.33 million.81 For rural girls and women the cost adds up to Tk. 910.14 million (54.59 percent), and for urban girls and women it adds up to Tk. 757.19 million (45.41 percent) (Figure 3.27 and Table 3.16).82
TABLE 3.15 ECONOMIC COST OF ExTRA TIME SPENT IN ACCESSING OPEN DEFECATION SITES AND
SHARED TOILETS, URBAN VS. RURAL
fIgURE 3.27 LOWER BOUND OF ECONOMIC COST OF INADEQUATE SANITATION IN SCHOOLS AND WORKPLACES
420337
433477
0
100
200
300
400
500
600
700
800
900
Girls’ absence at school Women’s absence at workplace
Mill
ion
Tk.
Rural Urban
Source: Author’s estimates.
Source: Author’s estimates.
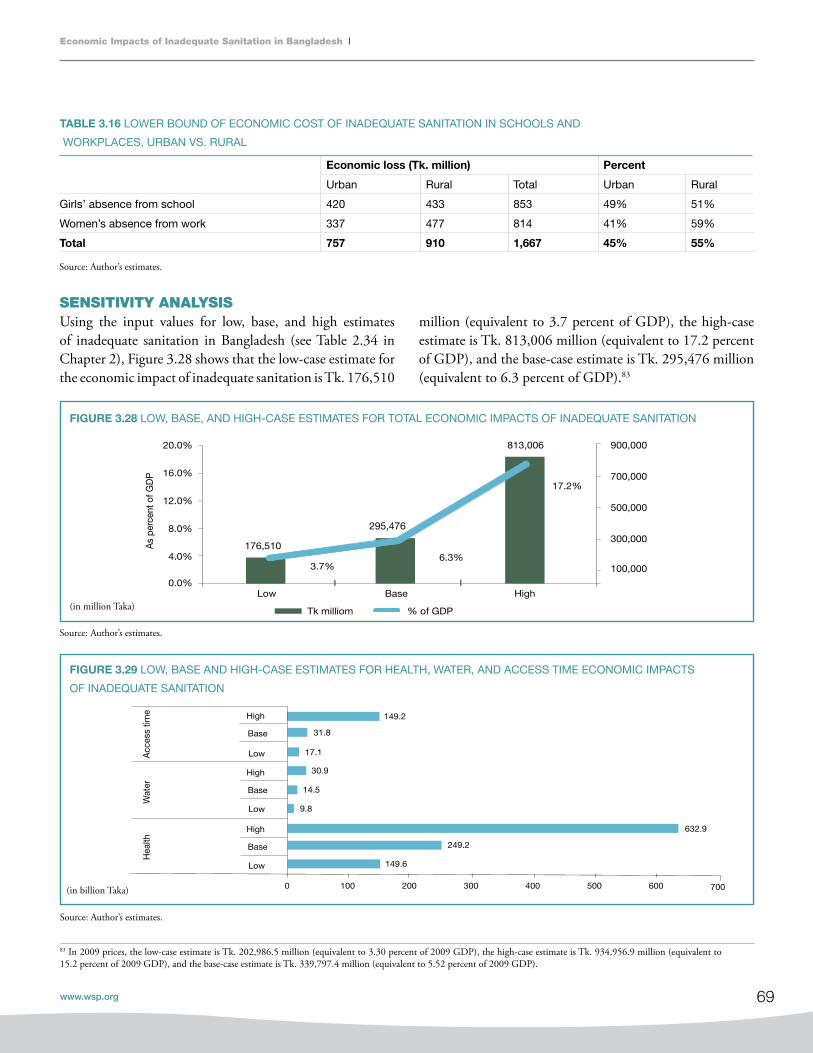
69
Economic Impacts of Inadequate Sanitation in Bangladesh
www.wsp.org
SENSITIVITY ANALYSIS Using the input values for low, base, and high estimates of inadequate sanitation in Bangladesh (see Table 2.34 in Chapter 2), Figure 3.28 shows that the low-case estimate for the economic impact of inadequate sanitation is Tk. 176,510
83 In 2009 prices, the low-case estimate is Tk. 202,986.5 million (equivalent to 3.30 percent of 2009 GDP), the high-case estimate is Tk. 934,956.9 million (equivalent to 15.2 percent of 2009 GDP), and the base-case estimate is Tk. 339,797.4 million (equivalent to 5.52 percent of 2009 GDP).
TABLE 3.16 LOWER BOUND OF ECONOMIC COST OF INADEQUATE SANITATION IN SCHOOLS AND
WORKPLACES, URBAN VS. RURAL
fIgURE 3.28 LOW, BASE, AND HIGH-CASE ESTIMATES FOR TOTAL ECONOMIC IMPACTS OF INADEQUATE SANITATION
Source: Author’s estimates.
Source: Author’s estimates.
Source: Author’s estimates.
Economic loss (Tk. million) Percent
Urban Rural Total Urban Rural
Girls’ absence from school 420 433 853 49% 51%
Women’s absence from work 337 477 814 41% 59%
Total 757 910 1,667 45% 55%
million (equivalent to 3.7 percent of GDP), the high-case estimate is Tk. 813,006 million (equivalent to 17.2 percent of GDP), and the base-case estimate is Tk. 295,476 million (equivalent to 6.3 percent of GDP).83
176,510
295,476
813,006
3.7%6.3%
17.2%
100,000
300,000
500,000
700,000
900,000
0.0%
4.0%
8.0%
12.0%
16.0%
20.0%
Low Base High
As
perc
ent o
f GD
P
Tk milliom % of GDP
149.6
249.2
632.9
9.8
14.5
30.9
17.1
31.8
149.2
0 100 200 300 400 500 600 700
Low
Base
High
Low
Base
High
Low
Base
High
Hea
lthW
ater
Acc
ess
time
Billion Tk.
fIgURE 3.29 LOW, BASE AND HIGH-CASE ESTIMATES FOR HEALTH, WATER, AND ACCESS TIME ECONOMIC IMPACTS
OF INADEQUATE SANITATION
(in billion Taka)
(in million Taka)

70
Economic Impacts of Inadequate Sanitation in Bangladesh
Bangladesh Impact Study
POTENTIAL GAINS FROM SANITATION AND HYGIENE INTERVENTIONS Estimates show that improved hygiene behavior could have resulted in gains of an estimated Tk. 143,913 million (equivalent to 3.0 percent of GDP), or Tk. 1,009 per person (See Table 3.17, a duplication of Table 3.3 reproduced here for convenience).84 Improved sanitation could have led to gains of Tk. 111,519 million (equivalent to 2.4 percent of GDP) or Tk. 782
per capita.85 Interventions that increased access to safe quality water could have led to gains worth Tk. 110,559 million (equivalent to 2.3 percent of GDP) or Tk. 775 per person. Much water contamination occurs due to improper containment and disposal of fecal matter; interventions that aimed at safe confinement and disposal of fecal matter after appropriate sewage treatment would have generated gains of Tk. 93,116 million (equivalent to 2 percent of GDP) or Tk. 653 per person.86
Interventions Million Tk. Million US$ Percent
of gdP
Percent of
economic impacts
Per-capita
gains (Tk.)
Per-capita
gains (US$)
Gains for sanitation
+ hygiene
interventions
Sanitation and
hygiene combined158,423 2,263 3.4% 54% 1,111 15.9
Sanitation alone 111,519 1,593 2.4% 38% 782 11.2
Improved hygiene
behavior143,913 2,056 3.0% 49% 1,009 14.4
Water free from
bacteriological
contamination
Improved access to
safe water110,559 1,579 2.3% 37% 775 11.1
Safe confinement
and disposal of fecal
matter (sewage
treatment)
93,116 1,330 2.0% 32% 653 9.3
TABLE 3.17 POTENTIAL ECONOMIC GAINS FROM SANITATION AND HYGIENE INTERVENTIONS
84 In 2009 prices, gain will be Tk. 165,500 million (equivalent to 2.69 percent of 2009 GDP), or Tk. 1,160.35 per person.85 In 2009 prices, gain will be Tk. 128,246.85 million (equivalent to 2.09 percent of 2009 GDP), or Tk. 899.3 per capita.86 In 2009 prices, gain will be of Tk. 107,083.4 million (equivalent to 1.74 percent of 2009 GDP), or Tk. 750.95 per person.
Source: Author’s estimates.

71
Economic Impacts of Inadequate Sanitation in Bangladesh
www.wsp.org
SUMMARY OF IMPACTS
Total economic impactsThis report estimates that inadequate sanitation has substantial economic impacts in Bangladesh. The annual economic impact of inadequate sanitation is estimated to be Tk. 295.48 billion, equivalent to $4.23 billion.87 This impact is equivalent to 6.3 percent of Bangladesh’s GDP.88
Health impactsThe total health impact of inadequate sanitation is equal to Tk. 249,186 million, which is 84 percent of the total economic impact and equivalent to 5.3 percent of GDP in 2007.89 Of the total health-related impact, 13 percent (Tk. 31,941 million) consists of productivity losses.90
The costs of treatment for illnesses makes up another 9 percent (Tk. 22,144 million) and the costs (loss) due to premature deaths makes up 78 percent (Tk. 195,101 million).91 Deaths, treatment cost, and productivity losses from diarrhea alone have the largest impacts in each of these categories.
Domestic water impacts The total domestic water impact of inadequate sanitation is equal to Tk. 14.51 billion.92 The cost of household water treatment is Tk. 9.84 billion, which is 68 percent of the total economic cost related to domestic water.93 The cost due to piped water is Tk. 1.13 billion (8 percent),
and the cost due to hauling cleaner water from outside the household premises is Tk. 3.54 billion (24 percent).94
The financial cost of household water treatment is Tk. 3.04 billion (73 percent), and the cost of piped water attributable to sanitation is Tk. 1.13 billion (27 percent).95
Access time impactsThe estimated cost stemming from lost access time is equal to Tk. 31.78 billion.96 An extra 5,119 million hours are spent accessing open defecation sites and shared toilets (in 2007). The economic cost of this lost time is estimated at Tk. 30.11 billion.97 Of that total, 3.47 billion hours and Tk. 17.36 billion (57 percent) in costs are due to the extra time used in accessing open defecation sites, and 1,647 million hours and Tk. 12.75 billion (43 percent) in costs are due to the extra time used in accessing shared toilets.98 Separately, the economic cost of inadequate sanitation in schools and workplaces due to the loss of time is estimated to be Tk. 853.37 million for girls and Tk. 813.96 million for working women, totaling Tk. 1.67 billion.99
Potential gains from sanitation and hygiene interventionsEstimates show that improved hygiene behavior could have resulted in gains of Tk. 143,913 million (equivalent to 3.0 percent of GDP), or Tk. 1,009 per person.100 Improved sanitation could have led to gains of Tk. 111,519 million
87 In 2009 prices, it is Tk. 339.802 billion, equivalent to $4.85.88 In 2009 prices, it is 5.52 percent of the GDP in 2009.89 In 2009 prices, it is Tk. 286,563.9 million and 4.66 percent of GDP in 2009.90 In 2009 prices, it is Tk. 31,941 million. 91 In 2009 prices, costs of treatment is Tk. 22,144 million and the impact of premature deaths is Tk. 195,101 million.92 In 2009 prices, it is Tk. 16.69 billion.93 In 2009 prices, the economic cost is Tk. 11.316 billion.94 In 2009 prices, the costs due to piped water is Tk. 1.3 billion and due to cloth-filtration is Tk. 4.071 billion. 95 In 2009 prices, the financial cost of household water treatment is Tk. 3.5 billion and the cost of piped water for sanitation is Tk.1.3 billion.96 In 2009 prices, it is Tk. 36.5 billion.97 In 2009 prices, it is Tk. 34.63 billion.98 In 2009 prices, the economic cost for accessing open defecation sites is Tk. 19.964 billion and for accessing shared toilets it is Tk. 14.7 billion.99 In 2009 prices, the economic cost of inadequate sanitation for girls is Tk. 981.4 million and for women 936.04 million, totaling Tk. 1.9205 billion.100 In 2009 prices, it is Tk. 165,499.95 million (equivalent to 2.69 percent of 2009 GDP), or Tk. 1,160.35 per person.
Conclusion and Lessons Learned4.

72
Economic Impacts of Inadequate Sanitation in Bangladesh
Bangladesh Impact Study
(equivalent to 2.4 percent of GDP), or Tk. 782 per capita.101
Interventions that increased access to safe quality water could have led to gains worth Tk. 110,559 million (equivalent to 2.3 percent of GDP) or Tk. 775 per person.102 Interventions that aimed at safe confinement and disposal of fecal matter after appropriate sewage treatment would have generated gains of Tk. 93,116 million (equivalent to 2 percent of GDP) or Tk. 653 per person.103
KEY LESSONS LEARNED1. Increased investment in water and sanitation is needed.It is important to ensure that every household has access to sanitary latrines within easy distance, including in urban areas, by promoting multiple technology options ranging from pit latrines to water-borne sewerage systems, with a special focus on supporting households in transitioning from very basic latrines to sustainable options. The increased investment should also aim to install public latrines in schools, bus stations, and important public places, as well as community latrines in densely populated poor communities that lack sufficient space for individual household latrines. It is also very important to ensure proper storage, management, and use of surface water and to prevent its contamination.
2. A comprehensive communication campaign is needed.Bangladesh’s progress in sanitation has been largely due to social action mobilized by a communications campaign. While there has been an admirable use of a wide variety of communication materials, standardization and uniformity have been missing, and the materials have often been used in an ad hoc fashion without a systematic and reinforcing media plan. Therefore, to improve the situation further, a more dynamic communications strategy, including a comprehensive media plan, is needed to mobilize communities.
3. Effective and replicable hygiene education intervention strategies are needed. Effective and replicable hygiene education outreach strategies to promote behavior change are needed. It is imperative to develop and assess different models for health and hygiene
education outreach. In primary schools, for example, children should be educated about safe water, sanitation, and personal hygiene. They should also be trained and encouraged to disseminate what they have learned to other children and to their families and communities so that the information and good practice spread throughout the population. There is also a need to give primary stakeholders the knowledge and the means to make informed choices about hygiene practices and water and sanitation facilities, including options for safe disposal of excreta. A functioning institutional framework must be in place in order to support these needs.
4. Local government needs to have a more proactive role.It is absolutely necessary to build the capacity of local governments and communities so they can deal more effectively with problems relating to water supply and sanitation. The structure of local governments should be strengthened by establishing and/or proactivating water and sanitation committees. This can empower people to take sustained action at a local level.
5. Relevant health interventions are needed, especially for rural children. This study documents the fact that health-related losses, specifically mortality and morbidity due to diarrheal disease, are the single largest contributors to the financial and economic impact of inadequate sanitation. Therefore, to mitigate the ill effects of inadequate sanitation, relevant and significant health interventions are needed. Interventions should be made with attention to equity, special emphasis being given to poor rural people, particularly children, and people living in hard-to-reach areas like the haor and char regions. Health interventions should be executed by grassroots-level facilities, such as the Thana health complex, community clinics, satellite clinics, and family welfare centers.
6. Strategies need to be made complementary.Complementary strategies should be developed to address rural sanitation, hygiene, and water needs. Such strategy development can happen by:
101 In 2009 prices, it is Tk. 128,246.85 million (equivalent to 2.08 percent of 2009 GDP), or Tk. 899.3 per capita. 102 In 2009 prices, it is Tk. 127,142.85 million (equivalent to 2.06 percent of 2009 GDP), or Tk. 891.25 per person.103 In 2009 prices, it is Tk. 107,083.4 million (equivalent to 1.74 percent of 2009 GDP), or Tk. 750.95 per person.
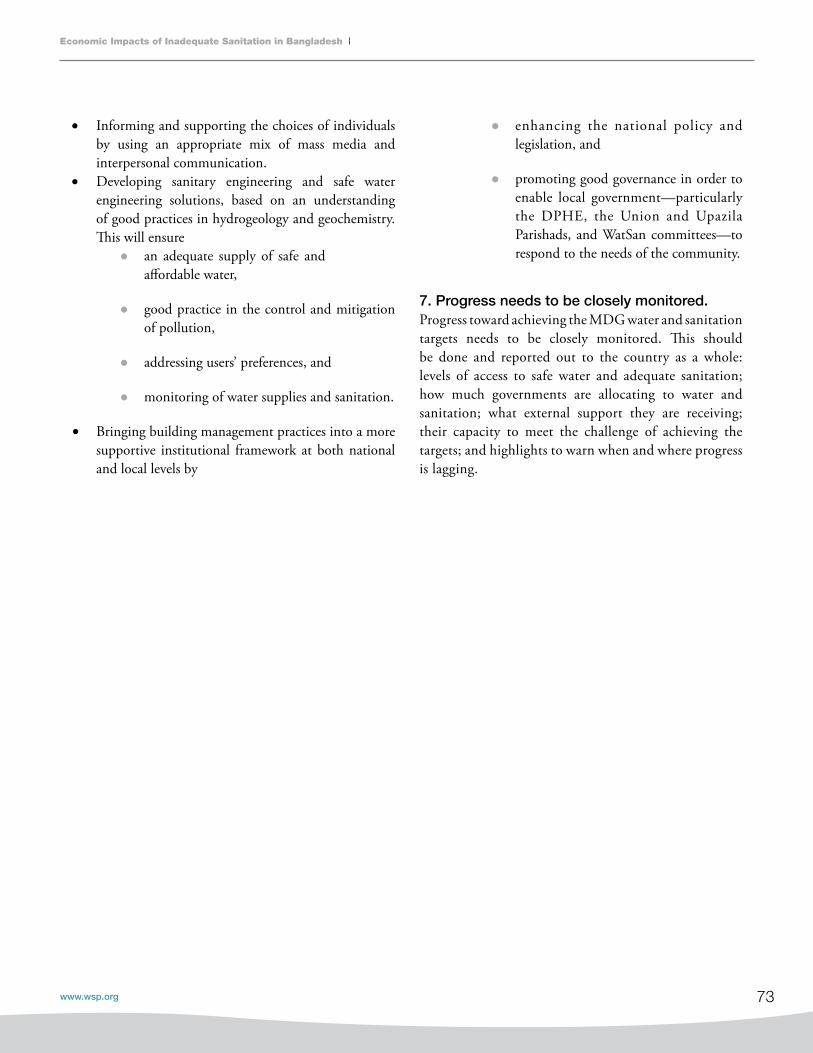
73
Economic Impacts of Inadequate Sanitation in Bangladesh
www.wsp.org
Informing and supporting the choices of individuals •by using an appropriate mix of mass media and interpersonal communication.Developing sanitary engineering and safe water •engineering solutions, based on an understanding of good practices in hydrogeology and geochemistry. This will ensure
l an adequate supply of safe and affordable water,
l good practice in the control and mitigation of pollution,
l addressing users’ preferences, and
l monitoring of water supplies and sanitation.
Bringing building management practices into a more •supportive institutional framework at both national and local levels by
l enhancing the national policy and legislation, and
l promoting good governance in order to enable local government—particularly the DPHE, the Union and Upazila Parishads, and WatSan committees—to respond to the needs of the community.
7. Progress needs to be closely monitored.Progress toward achieving the MDG water and sanitation targets needs to be closely monitored. This should be done and reported out to the country as a whole: levels of access to safe water and adequate sanitation; how much governments are allocating to water and sanitation; what external support they are receiving; their capacity to meet the challenge of achieving the targets; and highlights to warn when and where progress is lagging.

74
Economic Impacts of Inadequate Sanitation in Bangladesh
Bangladesh Impact Study
A1: Total loss
Total loss due to poor sanitation:
L=HL+WL+UL
Total health-related loss due to poor sanitation:
HL=HL_PD+HL_T+HL_P
Total water-related loss due to poor sanitation:
WL=WL_DWT+WL_PW+WL_WF
Total user preference loss due to poor sanitation:
UL=UL_AT+UL_AS+UL_AW
A2: Health-related loss due to poor sanitation
Total cost of premature death due to poor sanitation:
Cost of premature death for ith disease:
Total treatment cost related to poor sanitation:
Treatment cost for ith disease:
Total productivity loss due to poor sanitation:
Productivity loss for ith disease:
Annex A: Algorithms
A3: Water-related loss due to poor sanitation
Total cost for treating drinking water:
Cost of treating drinking water for mth method:
Total cost of piped water:
Total cost for fetching drinking water:
A4: User preference loss due to poor sanitation
Cost of access time for unimproved latrine:
Cost of days absent from school:
Cost of days absent from work:
75
Economic Impacts of Inadequate Sanitation in Bangladesh
www.wsp.org
Symbol description
L Total loss due to poor sanitation
L Total loss due to poor sanitation
HL Total health-related loss due to poor sanitation
WL Total water-related loss due to poor sanitation
UL Total user preference loss due to poor sanitation
HL_PD Cost of premature death from diseases attributable to poor sanitation
HL_T Cost of treatment of all diseases attributable to poor sanitation
HL_P Cost of productivity loss from diseases attributable to poor sanitation
WL_DWT Cost of treating drinking water
WL_PW Cost of piped drinking and non-drinking water
WL_WF Cost of fetching clean water
UL_AT Cost of access time for open defecation and using shared latrine
UL_AS Cost of days absent from school
UL_AW Cost of days absent from work
pop Total population
〖uhealth〖_ih Unit price of treatment for ith disease and hth health provider
〖dh〖_i Duration of ith disease
〖vtime〖_j Value of time per day for jth age group
〖death〖_ij Number of premature death for ith disease and jth age group
〖vdeath〖_j Value per premature death for jth age group
〖pop_ul〖_j Population having unimproved latrine by age group
taccess Average access time per day per person for using unimproved latrine
egirls Number of girls aged 11-19 years attending secondary school
days Days missed from school by the girls
vstime Value of time per day missed from school
ewomen Number of working women
dayw Days missed from work by the women
vwtime Value of time per day missed from work
〖HH〖_m Number of households using mth treatment method
cdwater Consumption of drinking water per household
〖udwater 〖_m Unit price per 1 liter drinking water using mth treatment method
〖HH〖_p Number of households using piped water
cwater Consumption of water per household
〖uwater 〖_p Unit price per 1 liter piped water
〖HH〖_f Number of households fetching drinking water
ftime Average fetching time per household per day
vtime Value of time per day
TABLE: VARIABLES
A5: Variables

76
Economic Impacts of Inadequate Sanitation in Bangladesh
Bangladesh Impact Study
Code description Components
i Disease type Diarrhea, malaria, ALRI (etc.)w
j Age group < 5 years, 5-14 years and 15+
h Treatment provider Treated at medical facility, at pharmacy, or by
traditional treatment
m Treatment method Boiling, bleaching, straining through cloth, or using filter
TABLE: PARAMETERS
TABLE: SUBSCRIPTS
Symbol description
〖_ij Incidence rate per person for ith disease and jth age group
〖_i Proportion of cases attributable to poor sanitation
〖_ih Proportion of cases treated for ith disease and hth health provider
〖_ij Proportion of death attributable to poor sanitation
μ Proportion of school without separate toilet for girls
Proportion of women missed days from work due to poor sanitation
∆ Water pollution attributable to poor sanitation
δ
δ
77
Economic Impacts of Inadequate Sanitation in Bangladesh
www.wsp.org
Barkat, A., and A. Hussam. 2008. ‘Provisioning of Arsenic-Free Water in Bangladesh: A Human Rights Challenge.’ Presented at the Workshop on Engineering, Social Justice, and Sustainable Community Development, The National Academy of Engineering (NAE), Washington, DC, October 2-3.
Barkat, A., G. Mahiyuddin, M. Majid, M. B. Rahman, A. Osman, M. Hoque, S. Khan, and M. Rahman. 2010. Baseline Survey: Urban Component of SHEWA-B (GOB-UNICEF) Project. Bangladesh and Dhaka: WaterAid.
Barkat, A., G. Mahiyuddin, A. Poddar, R. Ara, M. Rahman, M. Badiuzzaman, S. Khan, and A. Osman. 2009. Advancing Sustainable Environmental Health (ASEH): Impact Study. Bangladesh and Dhaka: WaterAid.
Becker, S., R. E. Black, and K. H. Brown. 1991. ‘Relative Effects of Diarrhea, Fever, and Dietary Energy Intake on Weight Gain in Rural Bangladeshi Children.’ American Journal of Clinical Nutrition 53:1499-1503.
Bellavance, F., G. Dionne, and M. Lebeau. 2009. ‘The Value of a Statistical Life: A Meta-Analysis With a Mixed-Effects Regression Model.’ Journal of Health Economics 28: 444-64.
Black, R. E., K. H. Brown, and S. Becker. 1984. ‘Effects of Diarrhea Associated with Specific Enter Pathogens on the Growth of Children in Rural Bangladesh.’ Pediatrics 73: 799-805.
Bureau of Statistics. 2007. Bangladesh Multiple Indicator Cluster Survey 2006. Dhaka: Bureau of Statistics, Planning Division, Ministry of Planning.
________. 2008a. Statistical Pocket Book of Bangladesh 2007. Dhaka: Bureau of Statistics, Planning Division, Ministry of Planning.
________. 2008b. Statistical Yearbook of Bangladesh 2007. Dhaka: Bangladesh Bureau of Statistics, Planning Division, Ministry of Planning.
________. 2009. Gender Statistics of Bangladesh 2008. Dhaka: Bureau of Statistics, Planning Division, Ministry of Planning.
References
Curtis, V., and S. Cairncross. 2003. ‘Effect of Washing Hands with Soap on Diarrhea Risk in the Community: A Systematic Review.’ The Lancet Infectious Diseases 3 (5): 275-81.
Directorate General of Health Services. 2008a. Health Bulletin 2008. Dhaka: Directorate General of Health Services, Ministry of Health and Family Welfare.
________. 2008b. Year Book-2008. Dhaka: Directorate General of Health Services, Ministry of Health and FamilyWelfare.
Fewtrell. L., R. Kaufmann, D. Kay, W. Enanoria, L. Haller, and John M. Water Jr. 2005. ‘Sanitation, and Hygiene Interventions to Reduce Diarrhea in Less Developed Countries: A Systematic Review and Meta-Analysis.’ The Lancet Infectious Diseases 2005.
Fishman, S., L. Caulfield, M. Onis, A. Hyder, L. Mullany, and R. Black. 2004. Comparative Quantification of Health Risks: Global and Regional Burden of Diseases Attributable to Selected Major Risk Factors. Geneva: World Health Organization.
General Economics Division. 2008. A Strategy for Poverty Reduction in the Lagging Regions of Bangladesh. Dhaka: General Economics Division, Planning Commission.
Haller, L., G. Hutton, and J. Bartram. 2007. ‘Estimating the Costs and Health Benefits of Water and Sanitation Improvements at Global Level.’ Journal of Water and Health (May).
Harding, Luke. 2002. ‘Pollution Poisons Bangladesh’s Riverside Slums.’ The Guardian, December 16. Online at guardian.co.uk.
Howard, G., and J. Bartram. 2003. Domestic Water Quantity, Service Level and Health. Geneva: World Health Organization.
Hutton, G., E. Rodriguez, L. Napitupulu, N. Thang, and P. Kov. 2008. Economic Impact of Sanitation in Southeast Asia. Research Report. Jakarta: Water and Sanitation Program, World Bank.
ICDDR’B. 2008. ‘Handwashing Behavior in Rural Bangladesh.’ ICDDR’B Health and Science Bulletin 6: 3 (September).

78
Economic Impacts of Inadequate Sanitation in Bangladesh
Bangladesh Impact Study
Larsen, B. 2008. ‘Cost of Environmental Health Risks in Children Under 5: Accounting for Malnutrition Linkages in Ghana and Pakistan.’ Background report for malnutrition and environmental health (MEH) study, Environment Department, World Bank, Washington, DC.
Local Government Division, Ministry of Local Government, Rural Development, and Cooperatives (MLGRDC). 2008. Bangladesh Country Paper: Sanitation in Bangladesh. Prepared for the Third Asian Conference on Sanitation, Colombo, November 2008.
Lorna, F., R. Kaufmann, D. Kay, W. Enanoria, L. Haller, and J. Colford Water. 2005. ‘Sanitation, and Hygiene Interventions to Reduce Diarrhea in Less Developed Countries: A Systematic Review And Meta-Analysis.’ The Lancet Infectious Diseases 5 (January).
Luby, S. P., M. Agboatwalla, D. R. Feikin, J. Painter, W. Billhimer, A. Altaf, and R. M. Hakestra. 2005. ‘Effect of Handwashing on Child Health: A Randomized Control Trial.’ The Lancet 366: 225-33.
Luke, H. 2002. ‘Pollution Poisons Bangladesh’s Riverside Slums.’ Published on the online edition of The Guardian at guardian.co.uk, December.
Milton, A., H. Rahman, W. Smith, R. Shrestha, and K. Dear. 2006. ‘Water Consumption Patterns in Rural Bangladesh: Are We Underestimating Total Arsenic Load?’ Journal of Water and Health 4 (4): 431-6.
National Institute of Population Research and Training (NIPORT), Mitra and Associates, and Macro International. 2007. Bangladesh Demographic and Health Survey 2007. Dhaka: Ministry of Health and Family Welfare.
Office of the High Commissioner for Human Rights (OHCHR), United Nations. 2007. Consultation on Human Rights and Access to Safe Drinking Water and Sanitation: Summary of Discussions. Geneva.
Planning Commission. 2005. Unlocking the Potential: National Strategy for Accelerated Poverty Reduction. Dhakar: General Economics Division, Planning Commission.
________. 2008. A Strategy for Poverty Reduction in the Lagging Regions of Bangladesh. Dhakar: General Economics Division, Planning Commission. 62, 85.
Pruss-Ustun, A., D. Kay, L. Fewtrell, and J. Bartram. 2004. ‘Unsafe Water, Sanitation and Hygiene.’ In M. Ezzati, A. D. Lopez, A. Rodgers, and C. J. L. Murray, eds., Comparative Quantification of Health Risks: Global and Regional Burden of Disease Attributable to Selected Major Risk Factors. Geneva: World Health Organization.
United Nations. 2007. The Millennium Development Goals Report 2007. New York.
USAID. 2008. 2006 Bangladesh Urban Health Survey. Washington, DC, December.
Viscusi, W., and J. Aldy. 2003. ‘The Value of a Statistical Life: A Critical Review of Market Estimates Throughout the World.’ Working Paper No. 9487, National Bureau of Economic Research, Cambridge, MA.
WaterAid. 2008. Counting the Cost: Poor Progress on Sanitation in South Asia. London: WaterAid, WaterAid India, November.
Whitehead, R. G., M. G. Rowland, and T. J. Cole. 1976. ‘Infection, Nutrition, and Growth in a Rural African Environment.’ The Proceedings of the Nutrition Society 35: 369-75.
World Bank. 2011. Economic Impacts of Inadequate Sanitation in India. World Bank Economics of Sanitation Initiative (ESI) series. Washington, DC: World Bank.
World Health Organization (WHO). 2002. The World Health Report 2002: Reducing Risks, Promoting Healthy Life. Geneva.
________. 2004. The World Health Report 2004: Changing History. Geneva.
________. 2008. The Global Burden of Disease: 2004 Update. Geneva.
World Health Organization (WHO) and UNICEF. 2006. Meeting the MDG Drinking Water and Sanitation Target: The Urban and Rural Challenge of the Decade. Geneva.
79
Economic Impacts of Inadequate Sanitation in Bangladesh
www.wsp.org
Economics of Sanitation
The Economics of Sanitation Initiative was launched in 2007 as a response by the Water and Sanitation Program (www.wsp.org) to address major gaps in evidence among developing countries on the economic aspects of sanitation. The study aims to provide evidence that supports sanitation advocacy, elevates the profile of sanitation, and acts as an effective tool to convince governments to take action.
The first study completed in Southeast Asia found that the economic costs of poor sanitation and hygiene amounted to over US$9.2 billion a year (2005 prices) in Cambodia, Indonesia, Lao PDR, the Philippines, and Vietnam. Its second phase analyzes the cost-benefit of alternative sanitation interventions and will enable stakeholders to make decisions on how to spend funds allocated to sanitation more efficiently.
Due to the study’s successful traction, WSP carried out ESI studies in Bangladesh, India, and Pakistan. ESI studies are also planned for countries in the Latin America and the Caribbean region, as well as several countries in Africa.
Water and Sanitation Program E-32, Sher-e-Bangla Nagar, Agargaon, Dhaka Phone: (+880-2) 8159091-14 E-mail: [email protected] Web site: www.wsp.org, www.worldbank.org.bd
WSP FUNDING PARTNERSThe Water and Sanitation Program (WSP) is a multi-donor partnership created in 1978 and administered
by the World Bank to support poor people in obtaining affordable, safe, and sustainable access to water
and sanitation services. WSP provides technical assistance, facilitates knowledge exchange, and promotes
evidence-based advancements in sector dialog. WSP has offices in 25 countries across Africa, East Asia
and the Pacific, Latin America and the Caribbean, South Asia, and in Washington, DC. WSP’s donors include
Australia, Austria, Canada, Denmark, Finland, France, the Bill and Melinda Gates Foundation, Luxembourg,
Netherlands, Norway, Sweden, Switzerland, the United Kingdom, the United States, and the World Bank.