fixed income investors - new york life insurance company€¦ · · 2018-03-29fixed income...
TRANSCRIPT
October 2014 Fixed Income Investors
1
Market Summary
− The market experienced a bout of volatility in the month. Spreads widened, equity price fell and Treasuries rallied.
− A combination of fear, short-covering and limited liquidity across assets exacerbated the moves.
− Corporate bonds underperformed Treasuries by 19 bps bearing the brunt of volatility.
− CMBS, ABS and MBS all recovered and had positive, though modest excess returns by the end of the month
− Third quarter GDP growth reached 3.5% and the unemployment rate fell to 5.8% in October.
− The Fed ended its asset purchase program but will continue to reinvest principle payments.
Source: Bloomberg, NYL Investors, Barclays November 2014. Past performance is no guarantee of future results, which will vary.

October 2014 Fixed Income Investors
2
Source: Bloomberg, NYL Investors, Barclays November 2014. Past performance is no guarantee of future results, which will vary.
Market Review
The markets experienced a bout of volatility in the new “limited liquidity” world and no asset class was immune. Equities came under extreme pressure in the first half of the month erasing their year-to-date gains. The S&P500 fell nearly 150 points to an intra-month low of 1820. By the end of the month, equities had retraced their losses and then some. While equities fell, Treasury prices melted up in the month with yields touching the lows of the year. On October 15th the move in yields was the most dramatic of the year. The ten year Treasury yield closed the 14th of October at 2.20%, touched 1.86% on the 15th and closed the day at 2.14%. Market fear, short-covering, and a lack of liquidity across assets exacerbated the moves.
October 2014 Fixed Income Investors
3
Market Review
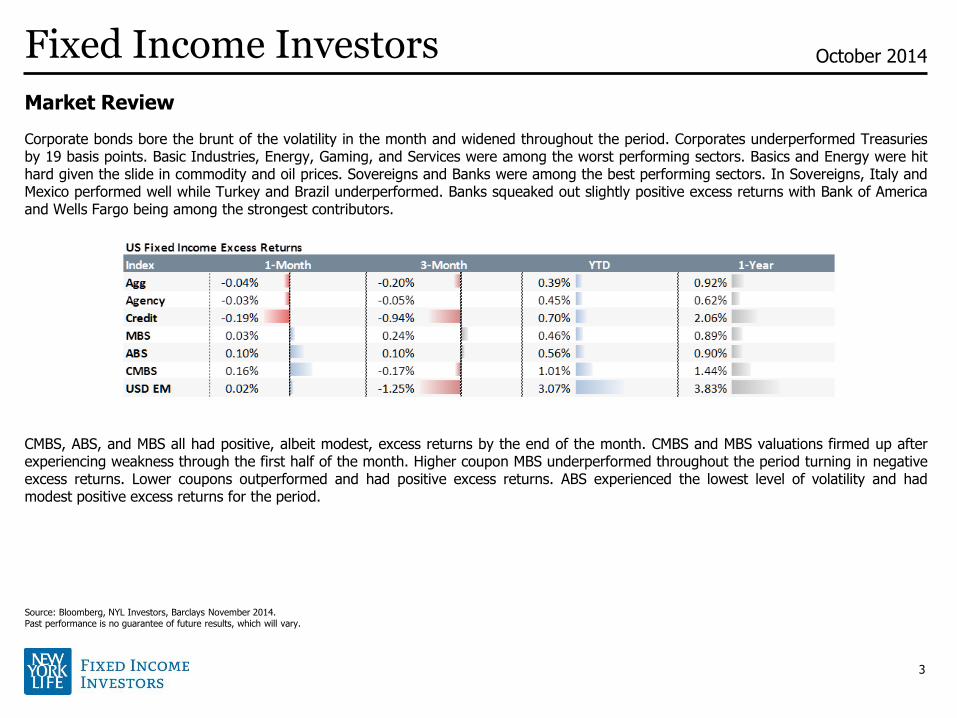
Corporate bonds bore the brunt of the volatility in the month and widened throughout the period. Corporates underperformed Treasuries by 19 basis points. Basic Industries, Energy, Gaming, and Services were among the worst performing sectors. Basics and Energy were hit hard given the slide in commodity and oil prices. Sovereigns and Banks were among the best performing sectors. In Sovereigns, Italy and Mexico performed well while Turkey and Brazil underperformed. Banks squeaked out slightly positive excess returns with Bank of America and Wells Fargo being among the strongest contributors.
CMBS, ABS, and MBS all had positive, albeit modest, excess returns by the end of the month. CMBS and MBS valuations firmed up after experiencing weakness through the first half of the month. Higher coupon MBS underperformed throughout the period turning in negative excess returns. Lower coupons outperformed and had positive excess returns. ABS experienced the lowest level of volatility and had modest positive excess returns for the period.
Source: Bloomberg, NYL Investors, Barclays November 2014. Past performance is no guarantee of future results, which will vary.

October 2014 Fixed Income Investors
4
Market Review
The United States’ economy continued to perform well through the third quarter. GDP growth for the period registered in at 3.5%, outpacing analyst expectations and our own. Though we may see the advance figure revised down somewhat. The employment situation has also steadily improved pushing the unemployment rate down to 5.8% in October. Very strong job creation observed by the Household Survey pushed the rate down despite an increase in labor market participation. The Establishment Survey was more benign, indicating Nonfarm Payrolls expanded by 209,000 which is consistent with the year-to-date monthly average of 223,000.
Initial Jobless Claims indicate labor market conditions are tightening as well. They have trended down at a steady pace and the four week moving average fell to 279,000, their lowest level since March 2000. As expected, though, inflation has remained well contained allowing the Fed to maintain its accommodative monetary policy. Our expectation is that as labor markets tighten further, wages will rise, encouraging consumption and putting some upward pressure on inflation and rates. While wage inflation has remained low, it is beginning to trend up. In September, the Employment Cost Index hit 2.2% matching its highest print since 2008. We don’t believe this is cause for concern, but bears close watching over the next several quarters.
Source: Bloomberg, NYL Investors, Barclays November 2014. Past performance is no guarantee of future results, which will vary.

October 2014 Fixed Income Investors
5
Market Review
The Fed meeting was largely uneventful. As expected, the Committee ended its asset purchase program but reiterated that they will continue to reinvest principle payments. The statement did have a more hawkish tone with respect to the strength of the economy and the state of the labor market. But this was consistent with the economic data recorded over the previous quarter. We were also drawn to the fact that the lone dissenter was Mr. Kocherlakota, a dove. Over the most recent meetings, only the more hawkish members dissented. This is consistent with the more hawkish statement leading us to believe the tone of the FOMC meeting itself had become somewhat more hawkish.
Source: Bloomberg, NYL Investors, Barclays November 2014. Past performance is no guarantee of future results, which will vary.

October 2014 Fixed Income Investors
6
Market Review
Central banks in Europe and Japan were also active during the month. Europe embarked on their own asset purchase program in October by purchasing covered bonds. They are set to begin investing in asset-backed securities in November. These programs will allow the ECB to expand their balance sheet modestly, but more aggressive programs are necessary if they are going to grow the size of their balance sheet since earlier programs will continue to roll-off. The Bank of Japan was more aggressive than expected at their policy meeting held on October 31st. The BOJ announced that they would be increasing their asset purchases and extending the average remaining maturity of their JGB purchases. The program called for purchasing an additional 30 trillion Yen of JGBs and approximately 2 Trillion Yen of ETFs and J-REITs. The BOJ news caught the markets by surprise, sparked a rally in risky assets, especially global equities.
Early in November the U.S. held their midterm elections. Consistent with expectations, the Republican Party expanded their majority in the House of Representatives taking at least 244 seats of the 435 (seven elections are still pending). Republicans also won control of the Senate holding at least 52 seats (2 elections have not been called). It’s unlikely Republicans will be able to push forward their agenda without a super-majority in the Senate. Therefore, it is more likely that for any policy to have a chance it will need to move towards the center. While it has been nearly impossible for the parties to find a middle ground on any issues over the past six years, the election results will necessitate it if any material legislation is to pass.
Source: Bloomberg, NYL Investors, Barclays November 2014; Credit Suisse, Haver Analytics 2014. Past performance is no guarantee of future results, which will vary.

October 2014 Fixed Income Investors
7
Outlook
Our outlook for growth remains constructive, though we would not be surprised to see the economy trend closer to 2.5% over the next couple of quarters. As the economy expands, the labor markets are forecast to tighten further leading to modestly higher wage and price inflation. We still don’t foresee this slow increase in inflation to be enough to cause a material shift in monetary in the near term. It still seems likely the Fed will begin raising rates in the middle of 2015.
The recent softness in spreads was not unexpected. Higher supply, limited liquidity, and a general discontent with Europe, Japan, and geopolitical risk in Ukraine and the Middle East have had an understandable impact on the markets. Our expectation remains that softness in spreads is an opportunity and we will add risk to the portfolios as we see opportunities and value. We expect to bring our exposure levels to corporate bonds back near their peaks of the year. CMBS and ABS valuation have been relatively stable recently and we will likely maintain our existing allocations. In Agency MBS we are flat and remain biased towards reducing exposure to the sector but are mindful of the favorable technicals benefiting the asset class.
Source: Bloomberg, NYL Investors, Barclays November 2014. Past performance is no guarantee of future results, which will vary.

October 2014 Fixed Income Investors
8
Appendix
Source: Bloomberg, NYL Investors, Barclays November 2014. Past performance is no guarantee of future results, which will vary.
0
50
100
150
200
O-13 D-13 F-14 A-14 J-14 A-14 O-14
US Credit Spreads
Aaa Aa A Baa
US Fixed Income Total Returns
Index
Agg 0.98% 1.40% 5.12% 4.14%
Treasury 0.97% 1.48% 4.07% 2.78%
Agency 0.63% 0.97% 3.04% 2.45%
Credit 1.06% 1.08% 6.80% 6.24%
MBS 0.97% 1.75% 5.23% 4.08%
ABS 0.51% 0.69% 1.84% 1.84%
CMBS 0.92% 0.93% 3.32% 3.13%
USD EM 1.20% 0.53% 7.88% 6.86%
1-Month 3-Month YTD 1-Year

October 2014 Fixed Income Investors
9
Appendix
Source: Bloomberg, NYL Investors, Barclays November 2014. Past performance is no guarantee of future results, which will vary.
US Fixed Income Total Returns
Index
Credit Aaa 0.69% 1.05% 3.23% 2.54%
Credit Aa 1.00% 1.37% 6.20% 5.42%
Credit A 1.15% 1.20% 6.44% 5.94%
Credit Baa 1.09% 0.88% 8.12% 7.62%
Finance 0.97% 1.03% 5.31% 5.22%
Industrial 0.99% 0.87% 7.02% 6.56%
Utility 1.53% 1.88% 9.42% 8.50%
Supranational 0.58% 0.88% 2.34% 1.79%
Sovereign 2.28% 1.92% 11.26% 8.79%
YTD 1-Year1-Month 3-Month
US Fixed Income Excess Returns
Index
Credit Aaa -0.05% -0.07% 0.29% 0.50%
Credit Aa -0.18% -0.53% 0.58% 1.53%
Credit A -0.13% -0.88% 0.12% 1.56%
Credit Baa -0.27% -1.31% 1.41% 3.04%
Finance -0.07% -0.58% 0.77% 2.11%
Industrial -0.38% -1.36% 0.18% 1.87%
Utility -0.13% -0.90% 0.64% 2.34%
Supranational -0.02% 0.00% 0.34% 0.40%
Sovereign 0.78% -0.56% 3.64% 3.59%
1-Month 3-Month YTD 1-Year

October 2014 Fixed Income Investors
10
Appendix
Source: Bloomberg, NYL Investors, Barclays November 2014. Past performance is no guarantee of future results, which will vary.
US Fixed Income Spreads
Index Change vs. 1 Year Ago
Agg 44 1 4 -1 -8
Agency 16 0 2 -1 -4
Credit 112 5 17 1 -14
MBS 27 -3 -5 -7 -17
ABS 55 -1 4 0 -8
CMBS 97 -2 9 -29 -35
USD EM 303 -2 23 -10 -13
10/31/2014 Change vs. 1 Month Ago Change vs. 3 Months Ago Change YTD
US Fixed Income Spreads
Index Change vs. 1 Year Ago
Credit Aaa 19 2 3 -2 -3
Credit Aa 72 4 11 1 -8
Credit A 102 4 16 7 -8
Credit Baa 154 7 22 -4 -22
Finance 112 5 17 3 -13
Industrial 122 7 21 8 -11
Utility 109 3 12 -16 -29
Supranational 14 2 2 -4 -4
Sovereign 146 -6 11 -24 -23
10/31/2014 Change vs. 1 Month Ago Change vs. 3 Months Ago Change YTD
October 2014 Fixed Income Investors
11
Appendix
Source: Bloomberg, NYL Investors, Barclays November 2014. Past performance is no guarantee of future results, which will vary.
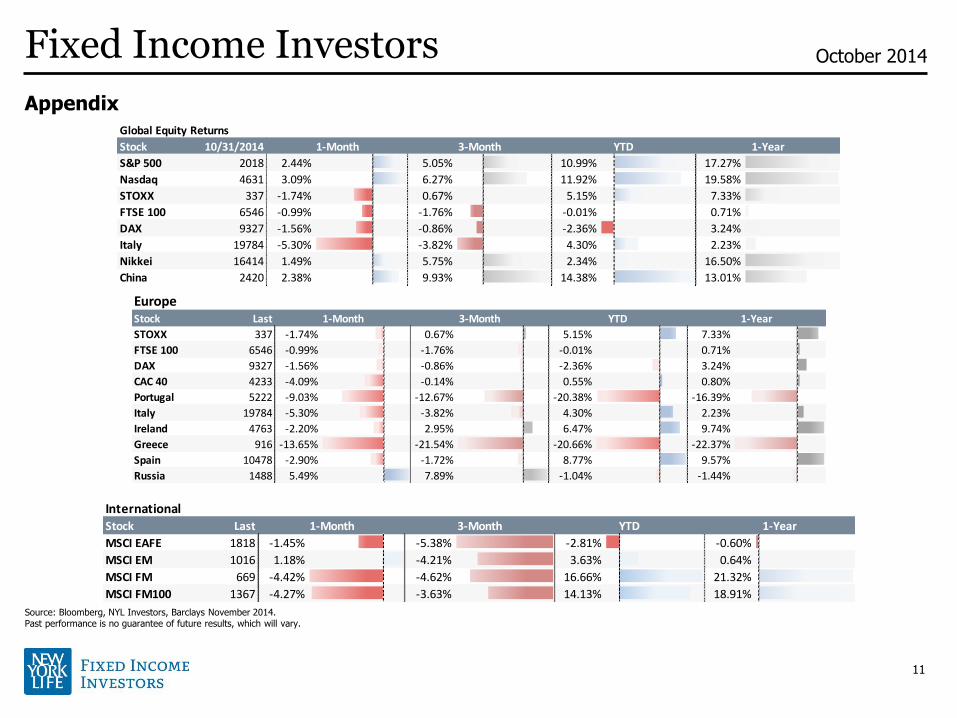
Global Equity Returns
Stock 10/31/2014
S&P 500 2018 2.44% 5.05% 10.99% 17.27%
Nasdaq 4631 3.09% 6.27% 11.92% 19.58%
STOXX 337 -1.74% 0.67% 5.15% 7.33%
FTSE 100 6546 -0.99% -1.76% -0.01% 0.71%
DAX 9327 -1.56% -0.86% -2.36% 3.24%
Italy 19784 -5.30% -3.82% 4.30% 2.23%
Nikkei 16414 1.49% 5.75% 2.34% 16.50%
China 2420 2.38% 9.93% 14.38% 13.01%
1-Month 3-Month YTD 1-Year
EuropeStock Last
STOXX 337 -1.74% 0.67% 5.15% 7.33%
FTSE 100 6546 -0.99% -1.76% -0.01% 0.71%
DAX 9327 -1.56% -0.86% -2.36% 3.24%
CAC 40 4233 -4.09% -0.14% 0.55% 0.80%
Portugal 5222 -9.03% -12.67% -20.38% -16.39%
Italy 19784 -5.30% -3.82% 4.30% 2.23%
Ireland 4763 -2.20% 2.95% 6.47% 9.74%
Greece 916 -13.65% -21.54% -20.66% -22.37%
Spain 10478 -2.90% -1.72% 8.77% 9.57%
Russia 1488 5.49% 7.89% -1.04% -1.44%
1-Month 3-Month YTD 1-Year
InternationalStock Last
MSCI EAFE 1818 -1.45% -5.38% -2.81% -0.60%
MSCI EM 1016 1.18% -4.21% 3.63% 0.64%
MSCI FM 669 -4.42% -4.62% 16.66% 21.32%
MSCI FM100 1367 -4.27% -3.63% 14.13% 18.91%
1-Month 3-Month YTD 1-Year

October 2014 Fixed Income Investors
This document is for information purposes only and is not a solicitation or a recommendation for the sale or purchase of any financial product, service, investment or security. It is intended solely for use by the recipient and may not be copied or redistributed without prior written consent of NYL Investors LLC. The information presented herein is current only as of the date hereof, and is subject to change without notice as market and economic conditions change. Any forward-looking statements are based on a number of assumptions concerning future events and although we believe that the sources used are reliable, the information contained in these materials has not been independently verified and its accuracy is not guaranteed. In addition, there is no guarantee that market expectations will be achieved. Please note that an investors cannot invest directly in an index. Historical returns are provided for illustrative and informational purposes only and the value of investments may fluctuate. Past performance is not indicative of future results. Third-party information providers make no representation or warranty as to the appropriateness, accuracy, completeness, or applicability of such information nor are they responsible for the results obtained there from. The information provided by these entities is an opinion only and not a recommendation to take any action. The investments and strategies discussed herein may not be suitable for all investors. Fixed Income Investors is the fixed income asset management division of NYL Investors LLC, a subsidiary of New York Life Insurance Company and an affiliate of New York Life Investment Management LLC.
12
34439