fixed income investor presentation - goldman sachs · read the forward-looking disclaimers in our...
TRANSCRIPT
Fixed Income Investor Presentation January 2013

Cautionary Note on Forward Looking Statements
Today’s presentation may include forward-looking statements. These statements represent the Firm’s belief regarding future events that, by their nature, are uncertain and outside of the Firm’s control. The Firm’s actual results and financial condition may differ, possibly materially, from what is indicated in those forward-looking statements.
For a discussion of some of the risks and factors that could affect the Firm’s future results, please see the description of “Risk Factors” in our annual report on Form 10-K for our fiscal year ended December 31, 2011. You should also read the forward-looking disclaimers in our quarterly earnings release, particularly as it relates to capital ratios, risk-weighted assets, total assets, level 3 assets and global core excess liquidity, and information on the calculation of non-GAAP financial measures and the impact of Basel 3 that is posted on the Investor Relations portion of our website: www.gs.com.
The statements in the presentation are current only as of its date, January 23, 2013.

1
2012 Earnings Highlights $ in millions, except per share amounts
Key Statistics Revenue Mix
Net revenues:
Operating expenses:
Pre-tax earnings:
Net earnings:
Diluted earnings per common share:
Book value per common share:
Return on common shareholders’ equity:
$34,163
$22,956
$11,207
$7,475
$14.13
$144.67
10.7%
Investment Banking
15%
FICC Client Execution
29%
Equities Client
Execution9%
Securities Services
6%
Investing & Lending
17%
Investment Management
15%
Commissions and fees
9%
2
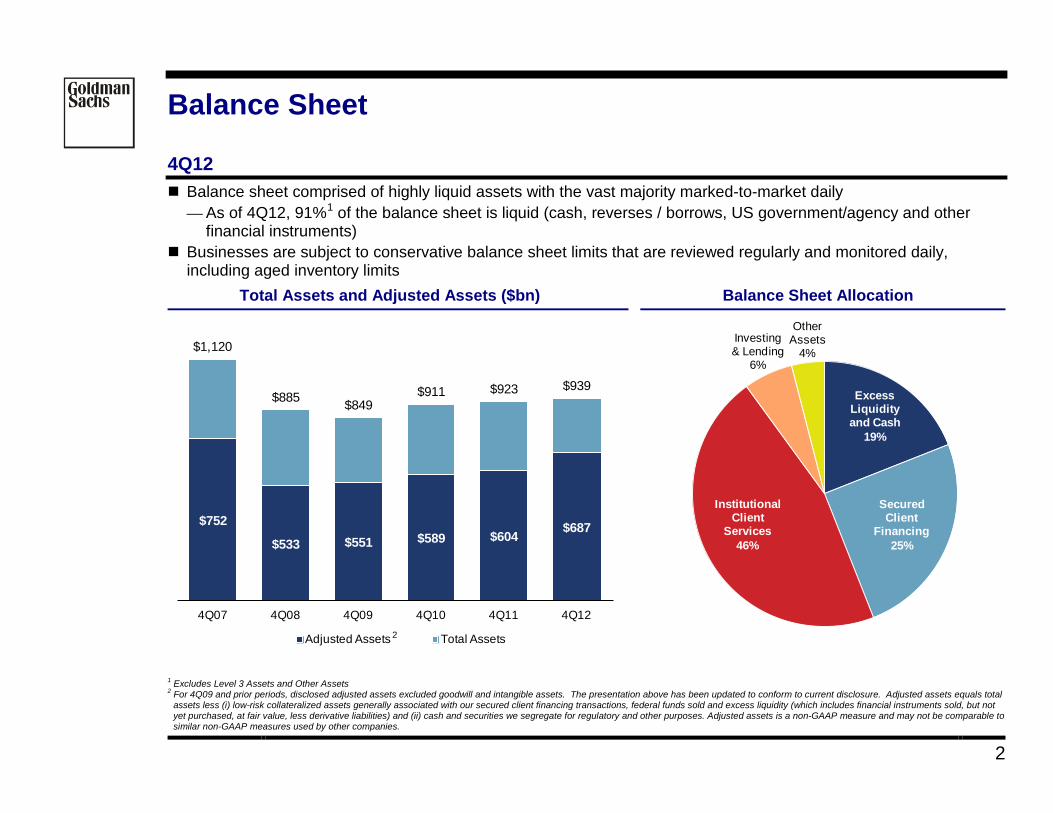
Balance Sheet 4Q12 Balance sheet comprised of highly liquid assets with the vast majority marked-to-market daily
— As of 4Q12, 91%1
Businesses are subject to conservative balance sheet limits that are reviewed regularly and monitored daily, including aged inventory limits
of the balance sheet is liquid (cash, reverses / borrows, US government/agency and other financial instruments)
Total Assets and Adjusted Assets ($bn)2 Balance Sheet Allocation
1 Excludes Level 3 Assets and Other Assets 2 For 4Q09 and prior periods, disclosed adjusted assets excluded goodwill and intangible assets. The presentation above has been updated to conform to current disclosure. Adjusted assets equals total
assets less (i) low-risk collateralized assets generally associated with our secured client financing transactions, federal funds sold and excess liquidity (which includes financial instruments sold, but not yet purchased, at fair value, less derivative liabilities) and (ii) cash and securities we segregate for regulatory and other purposes. Adjusted assets is a non-GAAP measure and may not be comparable to similar non-GAAP measures used by other companies.
$752
$533 $551 $589 $604 $687
$1,120
$885 $849$911 $923 $939
4Q07 4Q08 4Q09 4Q10 4Q11 4Q12
Adjusted Assets Total Assets2
Excess Liquidity and Cash
19%
Secured Client
Financing25%
Investing & Lending
6%
Other Assets
4%
Institutional Client
Services46%
3
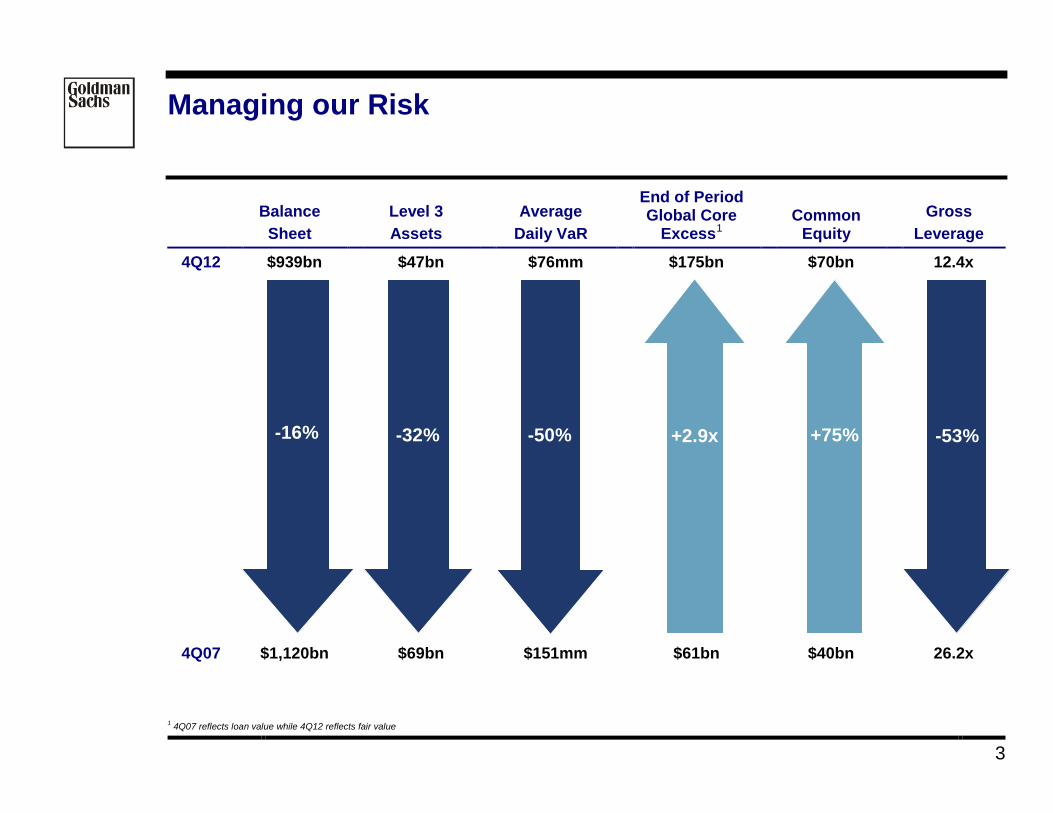
Managing our Risk
Balance
Sheet
Level 3 Assets
Average Daily VaR
End of Period Global Core
Excess1
Common
Equity
Gross Leverage
4Q12 $939bn
$47bn
$76mm
$175bn
$70bn
12.4x
4Q07 $1,120bn
$69bn
$151mm
$61bn
$40bn
26.2x
1 4Q07 reflects loan value while 4Q12 reflects fair value
-16% -32% -50% +75% -53% +2.9x
4
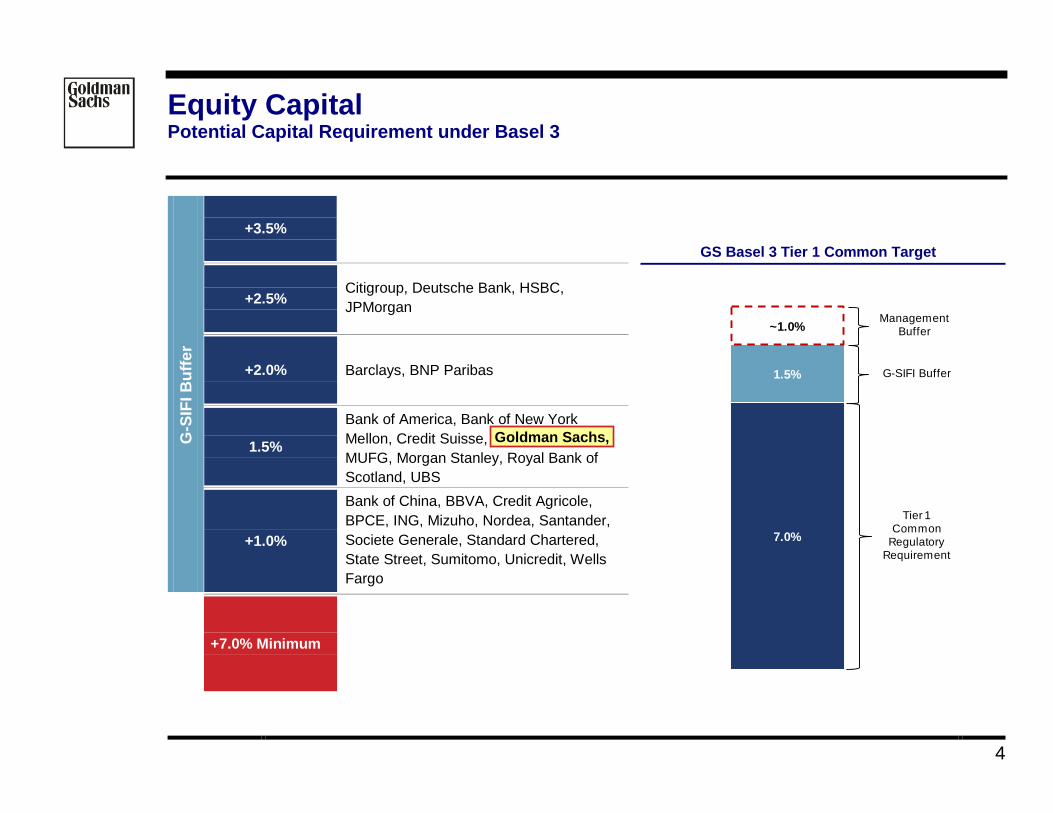
Equity Capital Potential Capital Requirement under Basel 3
G-S
IFI B
uffe
r
+3.5%
GS Basel 3 Tier 1 Common Target
+2.5% Citigroup, Deutsche Bank, HSBC, JPMorgan
+2.0% Barclays, BNP Paribas
1.5%
Bank of America, Bank of New York Mellon, Credit Suisse, Goldman Sachs, MUFG, Morgan Stanley, Royal Bank of Scotland, UBS
+1.0%
Bank of China, BBVA, Credit Agricole, BPCE, ING, Mizuho, Nordea, Santander, Societe Generale, Standard Chartered, State Street, Sumitomo, Unicredit, Wells Fargo
+7.0% Minimum
7.0%
1.5%
~1.0%Management
Buffer
G-SIFI Buffer
Tier 1 Common
Regulatory Requirement
Goldman Sachs,
5
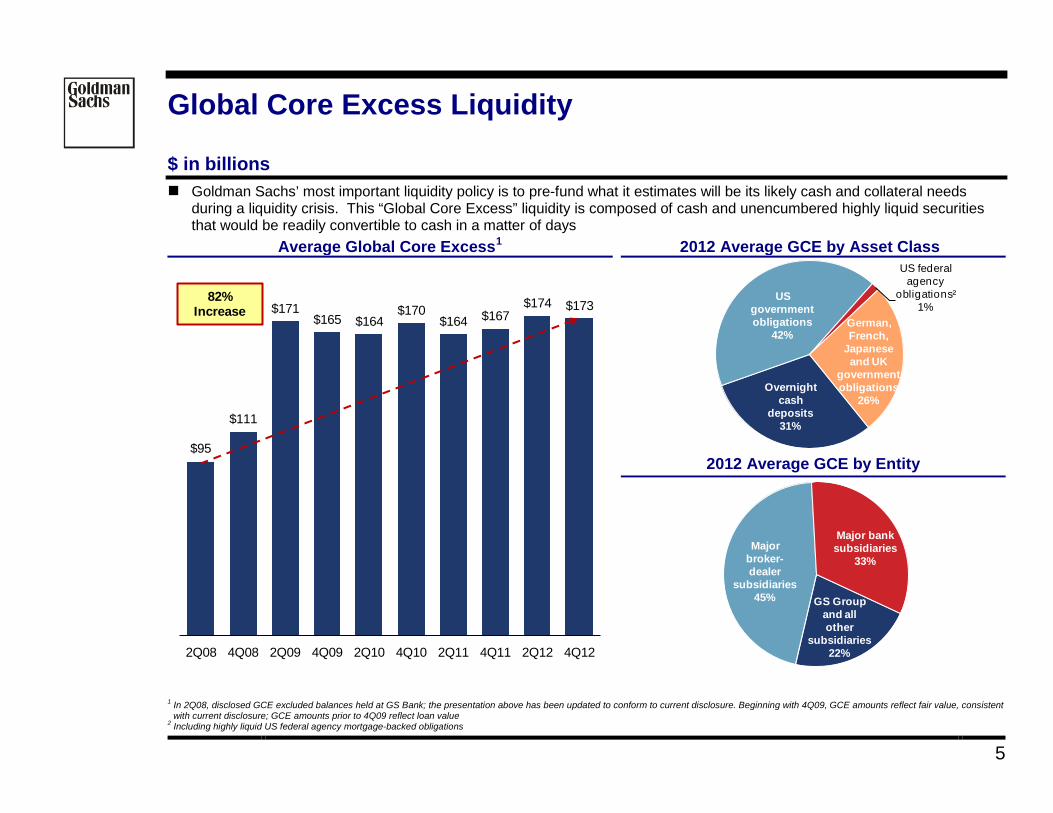
Global Core Excess Liquidity $ in billions Goldman Sachs’ most important liquidity policy is to pre-fund what it estimates will be its likely cash and collateral needs
during a liquidity crisis. This “Global Core Excess” liquidity is composed of cash and unencumbered highly liquid securities that would be readily convertible to cash in a matter of days
Average Global Core Excess1 2012 Average GCE by Asset Class2
2012 Average GCE by Entity
1 In 2Q08, disclosed GCE excluded balances held at GS Bank; the presentation above has been updated to conform to current disclosure. Beginning with 4Q09, GCE amounts reflect fair value, consistent
with current disclosure; GCE amounts prior to 4Q09 reflect loan value 2 Including highly liquid US federal agency mortgage-backed obligations
$95
$111
$171 $165 $164
$170 $164 $167
$174 $173
2Q08 4Q08 2Q09 4Q09 2Q10 4Q10 2Q11 4Q11 2Q12 4Q12
82% Increase
Overnight cash
deposits31%
US government obligations
42%
US federal agency
obligations²1%
German, French,
Japanese and UK
government obligations
26%
GS Group and all other
subsidiaries22%
Major broker-dealer
subsidiaries45%
Major bank subsidiaries
33%
6
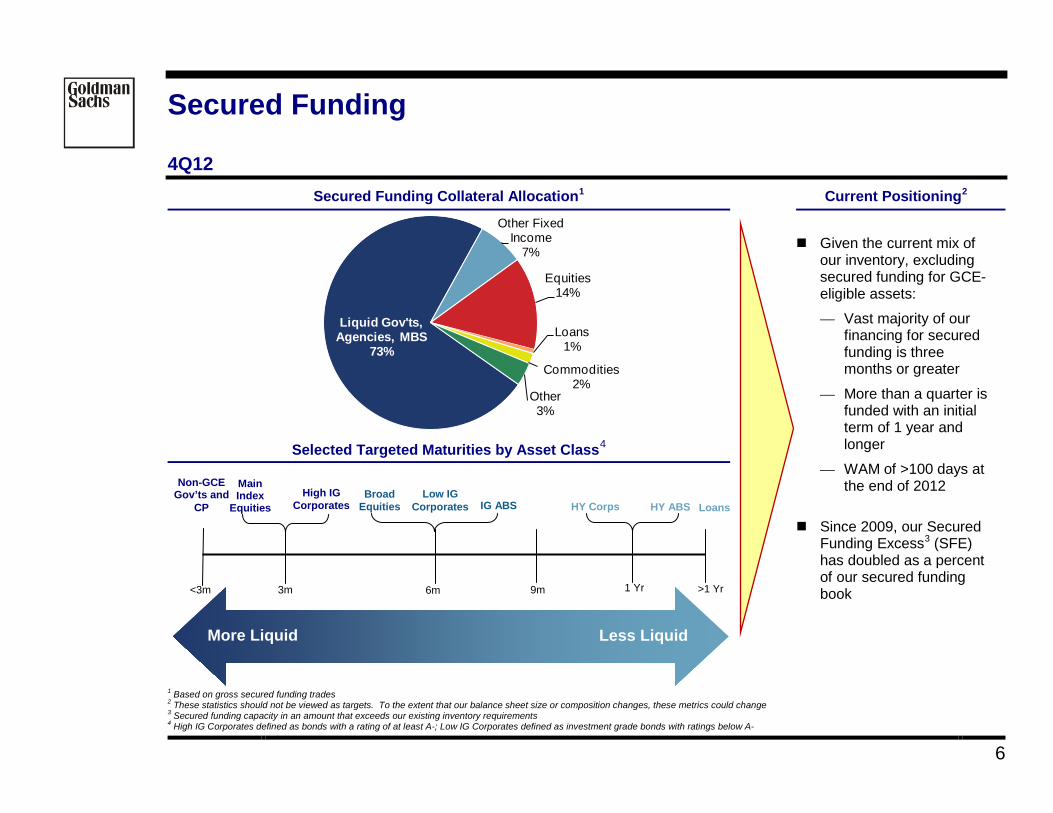
Secured Funding 4Q12
Secured Funding Collateral Allocation1 Current Positioning2
Given the current mix of
our inventory, excluding secured funding for GCE-eligible assets: — Vast majority of our
financing for secured funding is three months or greater
— More than a quarter is funded with an initial term of 1 year and longer
— WAM of >100 days at the end of 2012
Since 2009, our Secured Funding Excess3
Selected Targeted Maturities by Asset Class
(SFE) has doubled as a percent of our secured funding book
4
1 Based on gross secured funding trades 2 These statistics should not be viewed as targets. To the extent that our balance sheet size or composition changes, these metrics could change 3 Secured funding capacity in an amount that exceeds our existing inventory requirements 4 High IG Corporates defined as bonds with a rating of at least A-; Low IG Corporates defined as investment grade bonds with ratings below A-
Liquid Gov'ts, Agencies, MBS
73%
Other Fixed Income
7%
Equities14%
Loans1%
Other3%
Commodities2%
More Liquid Less Liquid
3m 6m 9m 1 Yr >1 Yr
Main Index
Equities Broad
Equities IG ABS HY Corps HY ABS High IG
Corporates Low IG
Corporates Loans
Non-GCE Gov’ts and
CP
<3m

7
Secured Funding Funding at Risk Metric
Secured Funding Risk Considerations
We use various metrics to evaluate the risks in our secured funding book including:
Tenor Ensure the appropriate tenor relative to the collateral mix
Maturity Diversification Avoid maturity concentration
Counterparty Diversification
Avoid reliance on single or few counterparties
Inventory Composition vs. Repo Capacity
Ensure the repo facilities have collateral profiles to finance the assets we have or will have in the future
We developed a risk measurement for our securities financing activities called Funding at Risk (FaR), which uses various scenarios to estimate the amount of liquidity that could be lost as a result of secured funding maturities. It is a comprehensive metric which incorporates each of the risk factors above
— The simulations take into account our aggregate capacity, trade tenors, counterparty concentrations, bespoke collateral schedules, roll probabilities, current fundable inventory and different inventory levels
— In addition, these simulations are capable of stressing multiple factors including counterparty rollover behavior, balance sheet, financing haircuts, time periods and estimating the resulting forward liquidity changes
FaR helps us understand how to mitigate the potential risks in the secured funding book through:
— The right amount and mix of SFE
— Lengthening and spreading our funding maturities
— Ensuring we are raising funding with the right collateral profiles
— Holding Global Core Excess against residual risk
8
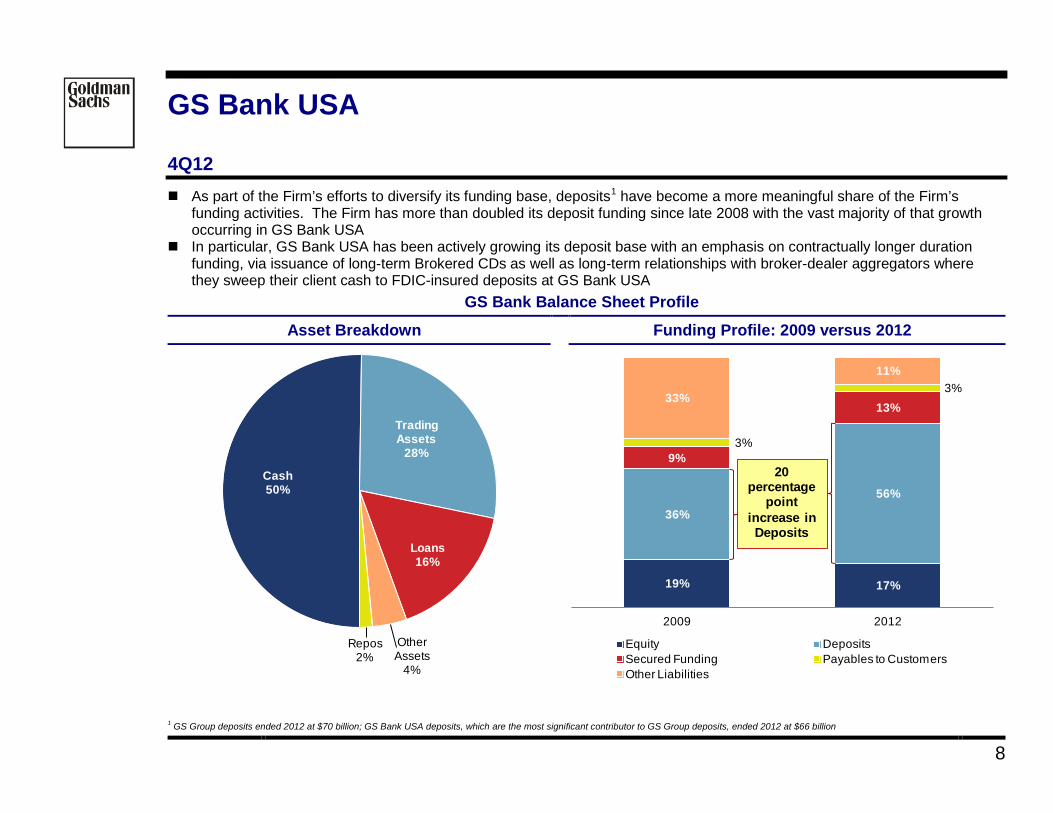
GS Bank USA 4Q12 As part of the Firm’s efforts to diversify its funding base, deposits1
In particular, GS Bank USA has been actively growing its deposit base with an emphasis on contractually longer duration funding, via issuance of long-term Brokered CDs as well as long-term relationships with broker-dealer aggregators where they sweep their client cash to FDIC-insured deposits at GS Bank USA
have become a more meaningful share of the Firm’s funding activities. The Firm has more than doubled its deposit funding since late 2008 with the vast majority of that growth occurring in GS Bank USA
GS Bank Balance Sheet Profile
Asset Breakdown Funding Profile: 2009 versus 2012
1 GS Group deposits ended 2012 at $70 billion; GS Bank USA deposits, which are the most significant contributor to GS Group deposits, ended 2012 at $66 billion
Cash 50%
Trading Assets
28%
Loans 16%
Other Assets
4%
Repos2%
19% 17%
36%
56%
9%
13%
3%
3%33%
11%
2009 2012
Equity DepositsSecured Funding Payables to CustomersOther Liabilities
20 percentage
point increase in Deposits
9
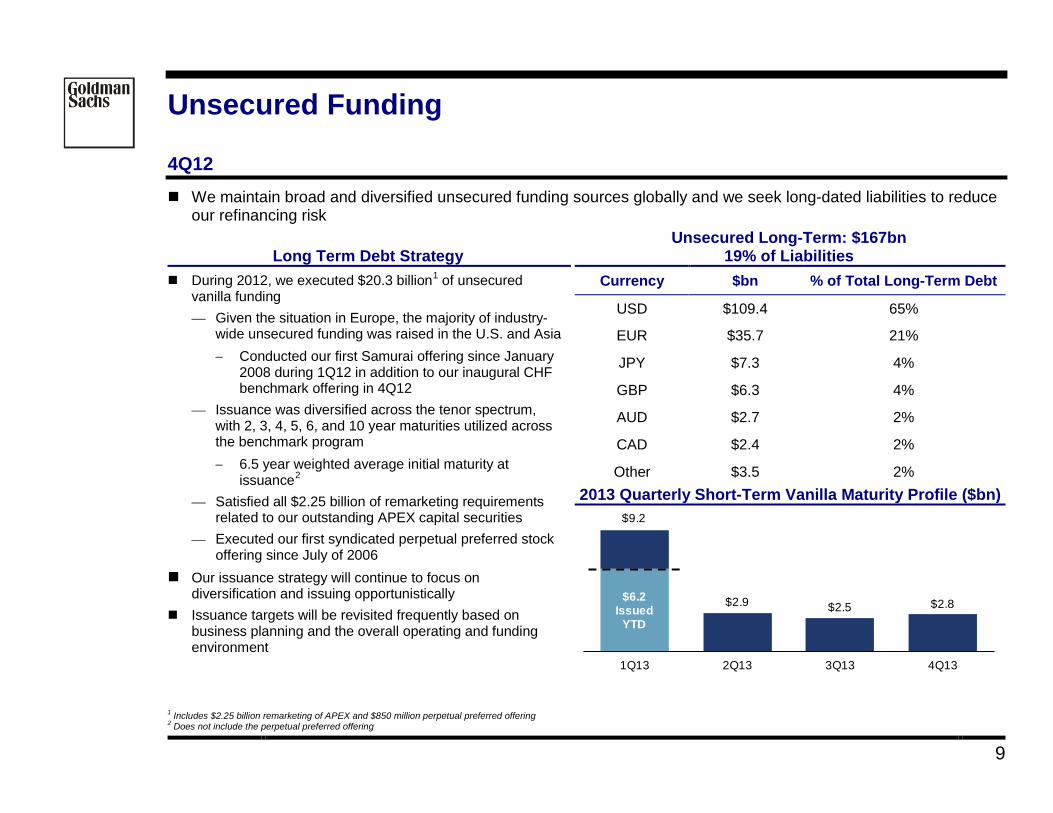
Unsecured Funding 4Q12 We maintain broad and diversified unsecured funding sources globally and we seek long-dated liabilities to reduce
our refinancing risk
Long Term Debt Strategy Unsecured Long-Term: $167bn
19% of Liabilities During 2012, we executed $20.3 billion1
— Given the situation in Europe, the majority of industry-wide unsecured funding was raised in the U.S. and Asia
of unsecured vanilla funding
− Conducted our first Samurai offering since January 2008 during 1Q12 in addition to our inaugural CHF benchmark offering in 4Q12
— Issuance was diversified across the tenor spectrum, with 2, 3, 4, 5, 6, and 10 year maturities utilized across the benchmark program − 6.5 year weighted average initial maturity at
issuance2
— Satisfied all $2.25 billion of remarketing requirements related to our outstanding APEX capital securities
— Executed our first syndicated perpetual preferred stock offering since July of 2006
Our issuance strategy will continue to focus on diversification and issuing opportunistically
Issuance targets will be revisited frequently based on business planning and the overall operating and funding environment
Currency $bn % of Total Long-Term Debt
USD $109.4 65%
EUR $35.7 21%
JPY $7.3 4%
GBP $6.3 4%
AUD $2.7 2%
CAD $2.4 2%
Other $3.5 2% 2013 Quarterly Short-Term Vanilla Maturity Profile ($bn)
1 Includes $2.25 billion remarketing of APEX and $850 million perpetual preferred offering 2 Does not include the perpetual preferred offering
$2.9 $2.5 $2.8
1Q13 2Q13 3Q13 4Q13
$6.2 Issued
YTD
$9.2

10
Resolution Overview US Construct for SIFIs
Regulatory Perspectives on Title II Orderly Liquidation Authority (OLA)
Resolution and Recovery Plans will be beneficial to the financial system: — Will provide firms and regulators with road maps of how to wind down or resolve a
distressed firm — Should help to eliminate any need for a taxpayer bailout and mitigate the impact of a
single firm’s failure on the broader financial system Financial credit profiles have also improved materially since the crisis
— Capital and liquidity levels for GS and its peers are markedly higher post the crisis and asset quality is much improved
— These trends have reduced the probability of a resolution/bail-in The combination of a well-developed resolution framework and stronger credit profiles will
result in a more secure financial system
Normal Course
Operations
Recovery Point of
Non Viability
Title II: FDIC OLA
Treasury Secretary / Presidential Determination
FDIC control / receivership
Title I: Traditional Bankruptcy
Resolution:
Bankruptcy
OLA
Recovery Planning Resolution Planning