five year report on full service partnerships
TRANSCRIPT

San Francisco Department of Public Health
Community Programs Off ice of Qual i ty Management and
Community Behaviora l Heal th Serv ices 1380 Howard Street
San Francisco , CA 94103
Gavin Newsom, Mayor
FIVE YEAR REPORT ON FULL SERVICE PARTNERSHIPS
Primary Authors: Diane Prentiss, MA MPH, MHSA Epidemiologist/Evaluator Office of Quality Management, Community Programs Maria Iyog-O’Malley, MBA, MHSA Coordinator Community Behavioral Health Services Contributors: Alice A. Gleghorn, Ph.D., Steve Solnit, Tom Bleecker, Ph.D.,
John Young, Ph.D., Eric Whitney, MPH, Sherri Little, MPH, Ann Santos, MPH, and all of the civil service and contracted Full Service Partnership providers

Table of Contents EXECUTIVE SUMMARY 1
OVERVIEW OF THE MENTAL HEALTH SERVICES ACT 3
FUNDING 7
IMPLEMENTATION
FULL SERVICE PARTNERSHIPS (FSP) 10
EXPENDITURE ANALYSIS 11
PROGRAM DESCRIPTIONS 14
CLIENT COUNTS and PARTNERSHIP HISTORY IN FSP 16
FOCUS ON “REASONS FOR DISCHARGE” 18
DEMOGRAPHICS OF FSP CLIENTS 22
PREVALENCE OF MENTAL HEALTH DIAGNOSES 24
PREVALENCE OF SUBSTANCE USE PROBLEMS 26
OUTCOMES
DCR DATA MANAGEMENT AND QUALITY 29
DCR DOWNLOAD PROCESS 30
DCR DATA AND RESIDENTIAL OUTCOMES 32
EMERGENCY EVENTS OUTCOMES 37
MILESTONES OF RECOVERY SCORES (MORS) 42
FIDELITY TO MHSA PRINCIPLES
CLIENT CENTERED WELLNESS AND RECOVERY MODEL OF CARE 47
CULTURAL COMPETENCE AND ACCESS TO SERVICES 49
CONSUMER AND FAMILY MEMBER EMPLOYMENT AND TRAINING 50
COMMUNITY COLLABORATION AND LINKAGES TO SERVICES 52
VIGNETTES OF CLIENTS IN RECOVERY 53
HOUSING FOR FSP CLIENTS
HOUSING SERVICE PARTNERSHIPS 59
HOUSING AVAILABILITY AND ACCESS 59
APPLICATION PROCESS 60
HOUSING SERVICE PARTNERSHIP UTILIZATION 61
POLK SENIOR HOUSING 64
SUMMARY OF FINDINGS 68
BIBLIOGRAPHY 70

EXECUTIVE SUMMARY The Mental Health Services Act, legislated in January 2005, was envisioned to expand and enhance the current public mental health system. In order to do so, the Act was written to extend existing funding sources beyond treatment services to include: community services and supports, prevention and early intervention; workforce development education and training; capital facilities; information technology; and innovative programming. Community Services and Supports (CSS) was the first component to be rolled out in FY2005‐2006. This report highlights San Francisco’s implementation of the Full Service Partnerships, a CSS service track intended to deliver a comprehensive array of services and supports to individuals with serious mental illness, or children with serious emotional disorders, who are new to the system or whose needs are not being met. After a brief overview of the legislative mandate and the subsequent planning process at the county level, the report offers the following:
‐ A summary of the implementation of Full Service Partnerships (FSPs) ‐ An assessment of the fidelity of FSPs to MHSA principles ‐ A description of the FSP client populations ‐ FSP client and program outcomes ‐ A summary of the implementation of Housing Service Partnerships (HSPs) ‐ A preliminary assessment of the implementation of Polk Senior Housing.
HIGHLIGHTS
Data from the implementation of the FSPs suggest promising outcomes, in terms of the improvement in the lives of people served and in the delivery of services. Implementation of MHSA services in San Francisco has shown to improve the quality of life of FSP clients in several domains (e.g. reductions in arrests and other emergencies, time in restrictive settings, and increases in safer and more stable living situations). Some clients are even achieving “advanced recovery” according to the Milestones of Recovery Scores (MORS). Consumer and family member employment has increased system wide. Inter‐agency collaboration has also improved, according to the FSP programs. In terms of using data, San Francisco is at the forefront of counties in California with respect to generating output reports for quality and outcomes from the State’s FSP data repository called the Data Collection and Reporting system (DCR). Providing detailed and aggregate data has both motivated FSP programs about their data and informed the providers about their clients.
LESSONS LEARNED
MHSA funding has its limitations. Finding viable and affordable housing in safe neighborhoods has proven to be a challenge for our housing partners. Although all FSP programs report adherence to cultural competency expectations, including having linguistic reach, but that reach does not closely mirror their own client populations. Efforts to include consumers and family members in all facets of implementation have raised unexpected issues. FSP programs describe challenges inherent in supervising staff, such as the need to communicate very clear instructions, facilitate the development of professional skills, and supervise with appropriate support. Programs also report that peer staff relapses can sometimes impede long‐term retention. A downward economy and reducing program budgets exacerbate these challenges.
Page 1 of 70

Accessing the FSP data through the state’s DCR system has required immense resources from IT and Research and Evaluation staff at CBHS, in order to produce useful reports. Unfortunately, support at the state level has been severely hampered by resource limitations. Additionally, the outcomes as collected and reported from the DCR are dependent on the providers staying current and complete in entering their clients’ Key Events throughout treatment. Incomplete Key Event Tracking (KET) data collection can go undetected and misrepresent reality. As increasing numbers of clients with time in FSP treatment reach levels of recovery that suggest a need to reduce their access to intensive levels of services, it seems imperative to outline a protocol for “stepping down” services, or graduating existing clients, and to open up FSP slots to new clients with greater and more urgent need.
IMPACT MHSA’s impact on FSP clients demonstrates the power of focusing resources on the wellness and recovery of individuals in severe need of support. As programs have evolved within the Recovery Model, and CBHS has adopted MHSA guidelines and strategies, the system has slowly begun to shift. One positive change within Community Behavioral Health Services is the development of a new programming structure called the Integrated Full Service Organizations (IFSOs). The main objective of IFSO is to restructure the delivery of mental health services system‐wide so that each mental health site is able to provide a continuum of service from the most intensive level of care to outpatient care, promoting CBHS’s “Any Door is the Right Door” policy. With the implementation of IFSO, CBHS aims to eliminate silos and instead promulgate an integrated and comprehensive mental health specialty care throughout the City incorporating many of the tenets of MHSA.
Page 2 of 70

MHSA Five Year Report
Five years ago, the enactment of the Mental Health Services Act (Proposition 63) promised to transform mental health care services in California and redefine the experience of mental health care consumers from being confined by their illness to celebrating their movement through recovery. Based on a Recovery Model of mental health, MHSA was intended to empower clients and foster a partner relationship with providers in working toward a shared goal of overall mental and emotional wellness.
This report offers an assessment of several aspects of MHSA as it has been operationalized in the City and County of San Francisco since the enactment of Proposition 63. After a brief overview of the legislative mandate and the subsequent planning process at the county level, this report will summarize the implementation of Full Service Partnerships, the MHSA intervention that received the majority of allocated funding. The report will assess fidelity of FSPs to MHSA principles, as well as describe their client populations and provide outcomes data. Finally, the report will describe Polk Senior Housing, the first Capital Facilities Development project to be funded by MHSA Housing statewide. The Polk project experience reflects the challenges facing MHSA clients in obtaining safe and affordable housing. This initial evaluation of the MHSA Full Service Partnerships is intended to inform consumers, administrators, program directors, legislators and other interested stakeholders about the improvements that have taken place in the San Francisco Behavioral Health system, and the challenges that on‐going challenges in the effort to transform the behavioral health system. Detailed evaluation of other aspects of MHSA implementation in San Francisco will be undertaken in future reports.
OVERVIEW OF THE MENTAL HEALTH SERVICES ACT (MHSA) In 2000, Assembly Bill 2034 (AB2034) was approved by California legislators to fund comprehensive mental health services with set guidelines. AB2034 focused not only on treating mental illness but also addressed aspects of a person’s life that contribute to mental instability and those that support behavioral health recovery. AB2034 furthered the work of AB32 which piloted a client‐centered recovery approach at three California counties. Buoyed by the successes of AB32 and AB2034, the voter initiative Proposition 63 was introduced in the November 2004 election to implement a statewide transformation of the mental health system. Proposition 63 was approved by 53.4% of CA voters to provide funding for the expansion of the mental health system in order to adequately meet the needs of individuals with serious mental illness and children with serious emotional disorders (Mental Health: Facts & Analysis). Proposition 63 was enacted into law in January 2005 and became known as the Mental Health Services Act (MHSA). MHSA is funded through a 1% income tax on California residents with incomes over $1 million. The legislation also requires both the State and counties to maintain, at the very least, the same level of service that existed prior to this Act and prohibits them from replacing existing mental health programs funded by local and state general funds with MHSA funds. This landmark legislation sought to define mental illness as a condition deserving priority attention and to mitigate the long‐term effect of mental illness on the individual and on state and local budgets through innovative and evidence‐based programming and culturally appropriate services. An extensive community planning process was required of all counties in the development of implementation plans for each MHSA
Page 3 of 70

MHSA Five Year Report
component. The State required plan approval prior to releasing funds to counties. To help guide counties in its implementation, the following principles were defined within the Act: 1. Wellness and Recovery Focused Programs and Services MHSA upholds the ideal that individuals can overcome serious mental health illness and live more independent and productive lives. With MHSA funding, programs and services are designed to provide individuals with the right tools and support to successfully re‐engage in their communities, attain their individual goals, and live fulfilling lives. 2. Consumer Participation and Family Involvement MHSA promotes significant participation of consumers and family members in all aspects of the mental health system and in all levels of responsibilities. At the service level, MHSA encourages consumer participation in development of treatment plans that take into consideration the individual’s strength, goals, cultural background, and social beliefs. At a planning and implementation level, MHSA supports the involvement of consumers and family members in stakeholders’ planning, policy development, implementation of programs and services, and evaluation. 3. Integrated Service Delivery System MHSA envisions consumers and family members to have a seamless experience in accessing mental health services and supports. It promotes an integrated service delivery system where consumers are guided through the process, treatment is individualized and responsive to consumers’ needs, and supports are coordinated among different agencies. 4. Community Collaboration MHSA supports partnerships and collaborations among agencies and community‐based organizations to increase opportunities for jobs, housing, education, social interactions, and other supportive services that would enable the creation of meaningful and productive lives for individuals with mental illness. 5. Culturally and Linguistically Competent Services and Supports MHSA endeavors to provide mental health services that reflect the values, customs, and beliefs of the population it serves and to eliminate disparities in accessing services. Cultural competence encompasses a client’s ethnicity, race, gender, age, sexual orientation, religious or spiritual beliefs, and economic status.
MHSA COMPONENTS
The following components were designed to achieve the breadth and scope of transformation envisioned by this act: Community Services and Supports; Workforce Development Education and Training; Prevention and Early Intervention; Capital Facilities and Information Technology; and Innovation. Community Services and Supports (CSS) – funds two service tracks: (1) The Full Service Partnership (FSP) is an intensive and comprehensive case management program that provides treatment and supportive services with a client and family centered philosophy toward achieving greater independence and living meaningful and productive lives; and (2) The General System Development effort covers gaps in system‐wide services and assists counties in achieving the goals and principles embodied by this Act. The majority (51%) of the CSS funds must be allocated to Full Service Partnerships. Included in CSS is funding for the Housing Service Partnerships which provide short‐term stabilization and long‐term permanent housing units for FSP clients.
Page 4 of 70

MHSA Five Year Report
Workforce Development Education and Training (WDET) – WDET funds educational and training programs to: increase the mental health workforce in professional shortage categories; hire staff that reflect the cultural and linguistic characteristics of the population served; enable consumers and family members to compete for job opportunities; educate the community about mental illness; and reduce stigma and discrimination about mental illness. Prevention and Early Intervention (PEI) – The PEI component funds services that help recognize mental health issues in early stages, raise awareness of available services, and develop short‐term strategies to prevent issues worsening, promote positive outlook, and develop resiliency with individuals and in underserved communities. Capital Facilities and Information Technology (CF & IT) ‐ Capital Facilities funds the purchase, development, or renovation of buildings that provide county mental health and administrative services. Information Technology funds the modernization of clinical and administrative information systems toward a goal of empowering consumers and family members through electronic access to personal health records. Innovation – This component funds creative and novel practices that: increase access to services; increase access for underserved populations; promote community collaboration; and increase the quality of mental health services including development of outcomes. The focus of innovation is on learning rather than the provision of service. MHSA Housing Program ‐ MHSA funds were made available through the Governor’s Homeless Initiative to finance the capital costs of acquiring, developing, rehabilitating, constructing and operating permanent supportive housing for individuals with serious mental illness and their families.
SAN FRANCISCO STAKEHOLDERS AND PLANNING PROCESSES
In San Francisco, the planning process commenced with the creation by the Mayor of a 40 member citywide Behavioral Health Innovation Task Force, headed by the Deputy Director of Health. The BHI Task Force was responsible for identifying and prioritizing mental health needs in the community and developing a Three Year Program and Expenditure Plan. The BHI Task Force held over 70 meetings over a 5 month period with consumers, their families, behavioral health service providers, representatives from the criminal justice system, educational professionals, human services providers and administrators, and members of the community. Information was collected through provider surveys, peer‐to‐peer interviews, penetration analyses, transcripts and summaries of meetings, as well as 80 position papers received from various constituents. This process resulted in the development of the County Three Year Program and Expenditure Plan for the Community Services and Supports component. The plan was submitted to the Department of Mental Health in November 2005 and was approved in March 2006. To initiate MHSA‐funded services in the community, a Request for Proposals (RFP) was released in May 2006 through Community Behavioral Health Services (CBHS) unit of the Department of Public Health. CBHS received nine proposals for Full Service Partnerships and 19 proposals for General System Development programs. Contracts were awarded to four agencies to provide Full Service Partnership services to individuals of all ages and 11 agencies in the General System Development service track to provide housing services and supports, vocational rehabilitation services, operate peer‐based and school‐based wellness centers, specific services to individuals affected by trauma, and to increase culturally specific and relevant services to Asian Pacific Islander children, youth and families. In addition, two civil service programs implemented Full Service Partnerships, and three primary care clinics integrated behavioral health services into their systems.
Page 5 of 70

MHSA Five Year Report
The planning process continued well into Fiscal Year (FY) 2008‐2009 for the other components, following the successive releases of each component’s Plan guidelines. Each of these planning processes built upon the recommendations of the respective committees and workgroups established during the 2005 community‐wide planning meetings. Committee memberships for the other components were solicited from the early planning subcommittees as well. The Workforce Development, Education, and Training (WDET) planning meetings were held for 8 months from April to December 2007. The Plan was submitted in March 2008 and approved in September 2008. The Prevention and Early Intervention (PEI) planning meetings were held for 6 months from January 2008 to July 2008. The Plan was submitted to both the Department of Mental Health and the Oversight and Accountability Commission for their review and approval in February 2009. The plan was approved in April 2009. The Request for Proposals for both the WDET and PEI projects was released in May 2009 and contracts were awarded for services effective October 2009. The planning process for the Capital Facilities and Information Technology were held separately. The Plan for the Capital Facilities component was submitted in April 2009, after a series of three community planning meetings held in February 2009. The options available to the county were very limited as the department owns only four buildings eligible for renovation under this component. The Plan included renovations for three sites and all three projects were approved. The Information Technology component held two informational meetings and six community planning meetings from November 2008 to April 2009. The Plan was submitted in March 2010 and was approved in August 2010. The community meetings for the Innovation component were held from April through August 2009. The Plan was finally submitted in March 2010 and approved in May 2010. The next phase is to release a Request for Proposals and contract out specific projects and implement civil service directed projects.
MHSA ADVISORY COMMITTEE
The MHSA Advisory Committee was formed in FY2005‐06. At the end of the initial planning process, all the task force members were requested to apply for membership in the new MHSA Advisory Committee. About half of the defunct task force became members of the MHSA Advisory Committee and additional members were recruited to ensure diverse community representation. About 30% of the original membership was comprised of individuals who have or have had personal experience as consumers of mental health services. In June 2009, CBHS recruited for continued and new membership of the Committee. Twenty‐three members were appointed, eighteen of whom were continuing members, and six self‐identified as consumers. The MHSA Advisory Committee meets every two months, alternating between committee meetings and community forums. These meetings and forums serve as platforms to discuss the progress of the MHSA implementation and provide updates about further State implementation of the other components of MHSA. During the community forums, the public is invited to speak about their ideas, suggestions, or critiques of the implementation process. The MHSA Advisory Committee holds these community forums at different locations within the city to encourage participation and to gain recognition of MHSA services within that neighborhood.
Page 6 of 70

MHSA Five Year Report
FUNDING MHSA is funded through a 1% tax on California residents with incomes above $1 million. These revenues, deposited into the State Mental Health Trust fund, are allocated to counties based on a formula that calculates the need for mental health services within each county. The factors considered to determine mental health service need are: total county population, need for mental health services and the prevalence of mental illness. The need for mental health services is determined by the sum of the portion of the county population who are below 200% of Federal Poverty Level (FPL) and the portion of the population who are uninsured for at least a year or a portion of the year. An adjustment factor is applied to account for the cost of services and the resources already available to meet the mental health needs within each county. Counties have three years to spend down each fiscal year allocation, except for WDET and CF/IT which have ten year grace periods. After the end of three years (ten years for WDET and CF/IT), counties may deposit any unspent balance to a local prudent reserve or the funds revert to the State Mental Health Trust fund for redistribution to counties using the allocation formula.
MHSA EXPENDITURES IN SAN FRANCISCO
MHSA Components FY04‐05 FY05‐06 FY06‐07 FY07‐08 FY08‐09 TOTALPlanning 207,487 207,487 Community Services & Supports 5,332,900 5,386,299 7,995,700 11,570,900 30,285,799 Prevention & Early Intervention 2,269,600 4,570,600 6,840,200 Workforce Education & Training 1,923,400 2,026,590 3,949,990 Capital Facilities 3,156,550 991,800 4,148,350 Technological Needs 3,156,550 991,800 4,148,350 Innovation 1,313,800 1,313,800 Housing 9,877,600 9,877,600 TOTAL REVENUES 207,487 5,332,900 7,309,699 28,482,590 19,438,900 60,771,576
TOTAL EXPENSES 6,148,146 7,992,741 9,829,975 23,970,862
Mental Health Services Act Revenues and Expenditures
San Francisco’s allocation from FY04‐05 through FY08‐09 totaled $60.8M. However, the CSS component was the only one that had an approved Three Year Program and Expenditure Plan through these fiscal years. Through the CSS approved Three Year Plan, San Francisco had spending authority for $30.5M (combined Planning and CSS allocations). Of the $30.5M in revenues, San Francisco has expended $24M; $1M was set aside in prudent reserve, and the remaining $5.5M were carried forward to augment the operations budget in FY09‐10.
Implementation of WDET ($3.9M) and PEI ($6.8M) initiatives began in FY09‐10. Capital Facilities funds of $4.1M have been earmarked for renovations of three City‐owned sites to integrate primary care and behavioral health services at two sites and to provide residential treatment services to dually‐diagnosed individuals at one site. Renovations are scheduled for FY09‐10 through FY12‐13.
Page 7 of 70

MHSA Five Year Report
The Technological Needs component, with $4.1M in funding, will begin implementation in FY10‐11. Funds will provide access, training and help desk support for Consumer Connect, an electronic health record portal within the Behavioral Health Information System, which would allow behavioral health clients to view their health records through a secured website, and support conversion of existing paper records to digital images. Community Planning for the Innovation component ($1.3M) began in April 2009, with implementation set for FY10‐11.
As required by the state, San Francisco’s MHSA Housing funds of $9.9M from the Governor’s Homeless Initiative were assigned to the California Housing Finance Agency (CalHFA), the agency responsible for financing approved capital development projects and related operating subsidies. To date, $1M has been released to finance the capital development of Polk Senior Housing Senior Housing, wherein 11 MHSA FSP clients have been housed in 10 dedicated units since November 2008. Two more applications were approved (Richardson Apartments and Central YMCA), for both capital development and operating subsidies, that will create 29 new housing units for homeless adults with serious mental illness. Applications for additional projects are in the pipeline.
Page 8 of 70

MHSA Five Year Report
IMPLEMENTATION
COMMUNITY SERVICES AND SUPPORTS
The CA Department of Mental Health (DMH) allowed one‐time projects for county allocations for FY2005‐06 to provide counties start up funding for effective implementation of services in future years. In San Francisco one‐time funding for various projects and three months of implementation of the project was included in its Three Year Program and Expenditure Plan. The one‐time funding request included: IT infrastructure improvements and consolidation of various databases; pilot implementation of transitional housing for transitional aged youths and violence and trauma recovery services; and evaluation of the early childhood mental health consultation and the youth guidance center. Implementation of services was not possible in FY2005‐06 since the Plan was approved late in the fiscal year (March 2006). Following the release of the Request for Proposal in May 2006, four agencies and two civil service programs implemented the Full Service Partnership service track, and 11 agencies was awarded in the General System Development (GSD) service track. The GSD agencies were selected to provide: housing services and supports, vocational rehabilitation services, operation of peer‐ and school‐based wellness centers, specific recovery services to individuals affected by trauma, and services to increase interventions to Asian Pacific Islander children, youth and families beginning in fiscal year 2006‐07. Additionally, three primary care clinics integrated behavioral health services within their systems. In FY08‐09, the State defunded the AB2034 program despite vocal protests from various mental health advocacy groups that this action contravened the provision within the Act to maintain a level of funding that existed prior to the passage of MHSA. The defunding of AB2034 forced counties that received AB2034 funds to look towards MHSA funding to continue to serve existing clients. The existing AB2034 program in San Francisco was discontinued and a new civil service full partnership service program was added to serve the adult population. Another attempt was made by the State to redirect MHSA funding to help balance the FY2009‐10 State budget. In May 2009, Proposition 1E was included in a special election statewide ballot that would amend MHSA legislation to allow the State to redirect $230M for two years to pay for the Early Periodic Screening, Diagnosis and Treatment (EPSDT) program, a federally mandated Medicaid program for low income individuals below 21 years of age. Proposition 1E was resoundingly defeated by 66.4% of California voters. Community Services and Supports (CSS) funds two service tracks. The Full Service Partnership (FSP) is an intensive and comprehensive case management program that provides treatment and supportive services with a client‐ and family‐centered philosophy, doing “whatever it takes” so that individuals with serious mental illness (SMI) and/or serious emotional disorders (SED) can achieve more independent, meaningful and productive lives. In the second track, the General System Development initiative provides funding to improve the mental health service delivery system by assisting agencies in achieving the goals and principles embodied by this Act. The majority of the CSS funds must be allocated to Full Service Partnerships.
Page 9 of 70

MHSA Five Year Report
FULL SERVICE PARTNERSHIPS MHSA Full Service Partnership (FSP) services emphasize community integration outcomes such as housing, employment, training/education, access to health care, and decreased criminal justice system involvement. In San Francisco, access to FSP services is controlled through a centralized Program Utilization Review Committee (PURC). To guide the PURC in determining who qualifies for participation in an FSP program, the following flow diagram was developed. SAN FRANCISCO - MHSA CLIENT FLOW
YES NO
OR Client is new to System
YES NO YES NO YES NO
YES NO
Eligible for FSP
Not Eligible for FSP
Eligible for FSP
Not Eligible for FSP
Eligible for Other CSS but not FSP
Not Eligible for MHSA
Reengage or continue with existing
services
Reengage or continue with existing
services
Reengage or continue with existing
services
Has client been diagnosed with SMI/SED?
Client was inadequately served by system in the
past?Client is exhibing SMI/SED behaviors?
Does client meet one or more priority criteria?
Does client meet one or more priority criteria?
To be eligible for FSP services in San Francisco, one must meet three distinct criteria. First, an individual must have been diagnosed with serious mental illness or, for a child, with a serious emotional disorder. Second, one must be unserved or underserved by the current mental health system. Underserved is defined as one who has been diagnosed with serious mental illness or serious emotional disturbance and is receiving services, but is not provided the necessary or appropriate opportunities to support his/her recovery, wellness, and/or resilience. The underserved may include but are not limited to:
(1) those who are poorly served that they are at risk of homelessness, institutionalization, incarceration, out‐of‐home placement or other serious consequences; (2) members of ethnic/racial, cultural, and linguistic populations that do not have access to mental health programs due to barriers such as poor identification of their mental health needs, poor engagement and outreach, limited language access, and lack of culturally competent services; and (3) those in rural areas, Native American Rancherias and/or reservations who are not receiving sufficient services.
Unserved are those who may have serious mental illness and/or serious emotional disturbance and are not receiving mental health services, including individuals who may have had only emergency or crisis‐oriented contacts and/or services from the County.
Page 10 of 70

MHSA Five Year Report
Third, one must meet priority criteria identified by San Francisco’s Adult/Children’s Systems of Care. The priority criteria include those detailed in the underserved category and those who:
(1) have been dually diagnosed with substance abuse or medical issues; (2) have been exposed to violence at home or in the community; (3) are isolated, lonely, or living alone; (4) have aging associated problems such as restricted mobility, decreases in cognitive functioning due to physical illness or injury, or loss of support systems; (5) are immigrants and/or monolingual; (6) belong to a minority or disadvantaged group (Asian American, Latino, Asian Pacific Islander, Russian immigrant, Native American, African American, LGBTQ); and (7) are unable to work or manage independence or unable to be in a mainstream school environment or failing in school.
EXPENDITURE ANALYSIS One of the purposes of MHSA is to ensure that all funds are expended in the most cost‐effective manner. In the FSP model, many aspects of services delivered are not traditionally reimbursed by Medi‐Cal. The “whatever it takes” philosophy may come with a higher price tag when compared to outpatient mental health services since FSPs are expected to provide additional supports and services to address other aspects of an individual’s life and show better outcomes. The significant savings in reduction of utilization of other systems is hoped to offset these costs. The table below shows actual expenditures from FY06‐07 through FY08‐09 only since implementation of services occurred during this period. Expenses include Housing Service Partnerships and ancillary services, such as the Family and Youth Involvement Team for Children, Youth and Families (CYF).
Full Service Partnership Expenditures
-
1,000,000
2,000,000
3,000,000
4,000,000
5,000,000
6,000,000
7,000,000
FY06-07 49,756 472,157 1,054,040 428,219 2,004,172
FY07-08 825,029 685,022 1,737,287 709,721 3,957,059
FY08-09 917,846 962,677 4,014,384 745,771 6,640,678
CYF TAY ADULT OLDER ADULT TOTAL
The first half of FY06‐07 was the start‐up period for FSP implementation and was dedicated to program development. Services did not begin until the second half of the fiscal year. Expenses for CYF were recognizably low in FY06‐07 since the contracted agency did not bill for services until the following year due to contractual
Page 11 of 70

MHSA Five Year Report
delays. In addition, the civil service program did not begin its implementation until nearly the last quarter of the fiscal year. The increases in FY07‐08 in all age groups were mainly due to full year implementation of FSP services, with the exception of the CYF FSP contracted agency’s expenses which included those incurred in FY06‐07 but were paid for in FY07‐08. FY08‐09 increases were attributed to the addition of the Family and Youth Involvement Team for CYF; final lease negotiations for budgeted number of slots for Transitional Age Youth (TAY) housing; and the addition of one FSP (previously AB2034 team) for adults. Majority of the FSP funds were budgeted for the adult population and consequently accounts for majority of expenses. Expenses for TAY, Adult, and Older Adult include the Housing Service Partnerships, which were contracted to locate housing units specifically for FSP clients.
Average Cost per client
The average cost per client is calculated by dividing the total expenses for the Full Service Partnerships by the unduplicated clients served for each age group for each fiscal year. Total expenses include direct services and housing only, and does not include ancillary services such enrichment services for families of serious emotionally disturbed (SED) children or “step‐down” services for adults.
Cost per Client (including Housing)
-2,0004,0006,0008,000
10,00012,00014,00016,00018,00020,000
FY06-07 9,951 14,554 12,205 9,385
FY07-08 4,436 13,432 13,421 17,310
FY08-09 4,269 16,598 12,346 13,811
CYF TAY ADULT OLDER ADULT
Unduplicated Client Count by Age Group By Fiscal Year
0
50
100
150
200
250
300
350
FY06-07 5 24 83 50
FY07-08 186 51 122 41
FY08-09 215 58 319 54
CYF TAY ADULT OLDER ADULT
The average cost per client in FY06‐07 was significantly higher for CYF, slightly higher for TAY, slightly lower for Adults and significantly lower for Older Adults. The CYF civil service FSP began implementation in FY06‐07 but enrolled clients late in the fiscal year, which resulted in a significantly higher cost per client when compared to the following fiscal years. In FY07‐08 and FY08‐09, the CYF costs per client were substantially lower than the other age groups. One of the CYF FSP leverages MHSA income with SB163 funding, which provides a capitated rate per client per month to prevent removal of children from their homes. MHSA provides funding for much needed wrap‐around services that are not covered through SB163 funding. The cost per client is diluted by the blending of these two funding sources, which allowed this agency to report a substantially higher number of unduplicated clients than the civil service program which does not received SB163 funding. In a study of 40 CSS Plans and Annual Updates conducted by the Petris Center, counties are budgeting services for CYF at $3,700 less than other age groups
Page 12 of 70

MHSA Five Year Report
(Felton et al, 2010). One of the reasons cited is the availability of other funding sources for foster care children. The impact of SB163 funding to San Francisco’s cost per client for CYF is significantly higher than the $3,700 cited in the Petris Study when compared to other age groups, but is consistent with the stated “watering down” impact of foster care funding on cost per client costs. For TAY, the average cost per client in FY06‐07 was slightly higher compared to FY07‐08, despite the fact that start up costs were excluded in the calculation. A possible explanation could be that the agency had paid for leases for the full complement of eight housing units in FY06‐07 but only five clients were actually housed. In FY07‐08, seven clients were housed, thus driving down the cost per client. Cost per client increased 23% to $16,598 in FY08‐09 from FY07‐08. This could be attributed to an increase in expenses of 41% (from $685,022 to $962,677) while the unduplicated clients served only increased by 14% (from 51 to 58). A notable factor in the increased expenses is the addition of two shared housing sites in safer middle class neighborhoods, the leases for which are much more expensive than single room occupancy hotels. The average lease for each tenant at these shared housing sites ranges from 1.2 to 1.5 times greater than an operating subsidy at a single room occupancy hotel. Without factoring the housing costs, the average costs per client for each fiscal year were as follows: FY06‐07, $10,257; FY07‐08, $10,926; and FY08‐09, $13,047. Additionally, both FSPs report significant increases in expenditures in FY08‐09 due to addition of direct services staff. For Adults, the cost per client in FY06‐07 was slightly lower compared to FY07‐08. The cost per client was lower because there was fewer permanent housing (4 units only). Additionally, the turnover rate for stabilization rooms in FY06‐07 was 53% lower than FY07‐08. The cost per client increased in FY08‐09 because the number of clients housed in both permanent housing and emergency stabilization units tripled from 39 to 94. Without factoring the housing costs, the average costs per client for each fiscal year increased steadily, although not significantly, as follows: FY06‐07, $10,453; FY07‐08, $11,005; and FY08‐09, $11,124. These increases are attributed to the average changes in price of goods and services for these years. The average cost per client for the Older Adult age group fluctuated from year to year. Without factoring the housing costs, the average costs per client for each fiscal year also shows the same fluctuating pattern, as follows: FY06‐07, $8,564; FY07‐08, $15,946; and FY08‐09, $13,028. Looking closely at the data, the unduplicated client counts for the Older Adult population started at 50 in FY06‐07, decreased to 41 in FY07‐08, and increased to 54 in FY08‐09, while the expenses steadily increased each fiscal year. In FY06‐07, the permanent housing negotiations fell through and as a result, there were no available permanent sites leased by the end of the fiscal year. This explains why the cost per client in FY06‐07 is very low compared to FY07‐08. In FY07‐08, the number of clients who utilized emergency stabilization rooms more than doubled from 11 to 23. Also, 3 permanent housing units were leased in FY07‐08. These two factors contributed to the increase in the average cost per client in FY07‐08. It would take further analysis of the severity of cases, intensity and types of services, and the level of staffing to actually understand the variances from year to year. It should be noted, however, that Medi‐Cal revenues increased from 9% in FY06‐07, to 16% in FY07‐08 and 14% in FY08‐09. Therefore, it was not only MHSA funding that supported the expenditure increases but also the increased Medi‐Cal revenues. When compared to the Average County per client funding requests for FSPs which are: $12,192 in FY06‐07 and $14,601 in FY08‐09 [Felton, et al 2010], San Francisco’s expenditures for CYF and Older Adults are well within the average for FY06‐07, insignificantly higher than the average for Adults, and 20% higher than average for TAY. In FY08‐09, all age groups were within average except for TAY which is 14% higher than average. In both years, the increased expenditures for TAY were within the standard deviation amounts.
Page 13 of 70

MHSA Five Year Report
PROGRAM DESCRIPTIONS The FSP component has been implemented in San Francisco by nine programs, seven of which are housed in contract community based organizations. Three are civil service programs.
Child, Youth and Families, CYF (Under 18 years) PROGRAM TARGET
POPULATION SERVICES OFFERED
SENECA SF Connections
Children and adolescents up to age 18 with challenging behaviors in high level group homes
Provide SB163 Wrap Around services so adolescents can stay in family settings within the community and achieve permanency and stability
Access community resources to address needs of the target population Facilitate transition to TAY services as they age out of CYF services Empower the caregiver (birth parent, foster parents, or guardian) to care for the child
FAMILY MOSAIC PROJECT (FMP)
Children and adolescents up to age 18 who are in or at risk of out of home placements
Provide intensive case management and wrap around services to children and their families to enable the child to remain at home and progress in a natural environment (i.e., home, school, community) within a family driven and youth focused model
Provide or arrange for mental health services, therapeutic services, mentoring, respite care, and other services as individually developed through the development of a comprehensive care plan
FAMILY AND YOUTH INVOLVEMENT TEAM (FIT)
Children and adolescents up to age 18 who are in or at risk of out of home placements and their respective families
Serve as Peer Parents and Youth Development Mentors to clients served by Family Mosaic Project and the Children’s System of Care. The peer parents work with parents who are consumers of the mental health system, and the youth peer mentors work with youth and young adult consumers to provide outreach, support, mentoring, information, advocacy, and assistance in navigating the various child and family serving systems, including the school system
Transitional Age Youth, TAY (16‐25 years) PROGRAM TARGET POPULATION SERVICES OFFERED
FAMILY SERVICES AGENCY (FSA)
TAY (18‐25 years old) with SMI; many will have HIV/AIDS; some may be homeless
Provide physical health care, mental health treatment, medication management, substance abuse treatment, employment assistance, post‐employment support, benefits assistance and advocacy, and peer support integrated into a single service team – the Consumer Services Team
Work closely with Housing Service Partnership (HSP) and support this service through established referral arrangements with other supportive services providers
Utilize flexible funding to purchase specialized services and supports
COMMUNITY BEHAVIORAL HEALTH SERVICES (CBHS)
Youth who are currently not served or underserved, with SMI or SED, who are homeless or at risk of homelessness
Develop comprehensive assessment and treatment care plans; Provide intensive services that include mental health treatment, substance abuse counseling
Link clients to employment/job coaching/placement, education, training on independent living skills, referrals to legal assistance, recreation and social activities, and coordinate with HSP for transitional and supportive housing
Page 14 of 70

MHSA Five Year Report
Adults (26‐59 years) PROGRAM TARGET POPULATION SERVICES OFFERED
FAMILY SERVICES AGENCY (FSA)
Homeless adults ages 18 ‐59 with SMI and/or substance abuse problems
Conduct outreach to homeless encampments, parks, homeless shelters and food programs, & other service locations
Address immediate needs of potential clients such as food, shelter, clothing & other amenities
Provide health screening and first aid, dispense minor medications, prescribe psychotropic medications with supervision from a psychiatrist & arrange for medical treatment
Provide mental health and substance abuse treatment and case management Assist with initial applications for food stamps, general assistance & Medi‐Cal, SSI & other benefits
Conduct crisis assessments & interventions
UNIVERSITY OF CALIFORNIA at SAN FRANCISCO (UCSF) – CITYWIDE CASE MANAGEMENT (FORENSICS)
Individuals who suffer from SMI and are referred by the San Francisco Behavioral Health Court
Work closely with Behavioral Court in finding appropriate treatment and judicial disposition for clients
Actively participate in discharge planning from jail or hospital Link client to services on day of discharge Support clients in educational, pre‐vocational and vocational activities and placements
Provide case management services Develop and implement wellness and recovery action plan specifying goals for increased skills & functioning, increased personal resources and illness management
Involve client in group therapy, dual diagnosis groups, and other social activities
HYDE STREET COMMUNITY SERVICES INC
Adults identified as dually diagnosed & present with multiple & complex issues
Assist clients in developing individualized plan of care in collaboration with staff Conduct case management focusing on entitlements, social benefits, housing, primary care
Coordinate care with other social services, criminal justice, mental health & substance abuse services
Evaluate clients bi‐annually for continued need for intensive services & progress of care plan objectives
SAN FRANCISCO FULLY INTEGRATED RECOVERY SERVICE TEAM (SFFIRST)
Target populations are homeless, seriously mentally ill and/or dually diagnosed individuals, who are high users of multiple systems (Emergency Departments, Emergency Medical Services, Psychiatric Emergency Services, Crisis services, Urgent care clinics)
Promote wellness and recovery Stabilize mental health symptoms and improve and sustain quality of life Provide wrap around services adhering to a Recovery Model, including; intensive case
management, individual and group therapy, medication support services, peer support, and crisis intervention.
Provide integrated services including employment services, recreational and community integration activities, benefits advocacy, money management, linkage to primary care, and stable housing.
Older Adults (60 years and over) PROGRAM TARGET POPULATION SERVICES OFFERED
FAMILY SERVICES AGENCY (FSA)
Dually and multiply diagnosed SMI Older Adults ages 60
Meet clients where most often found: non‐office settings such as streets, shelters, SRO hotels
Conduct assessment & evaluation Offer MH treatment, including dual disorder services both individual & group Provide case management services and crisis intervention Purchase basic needs Engage clients in vocational assessment & rehabilitation services Link clients to housing & follow‐up in‐home services
Page 15 of 70

MHSA Five Year Report
CLIENT COUNTS Since the inception of the Full Service Partnership programs, a total of 947 unduplicated clients have enrolled, with annual total unduplicated enrollments increasing steadily over three years. The greatest jump (92%) occurred from FY 2008 to FY 2009 when SF First ICM, the largest of the nine FSPs, officially shifted from AB2034 to MHSA.
FSP Enrollment FY 2006 through 2009
37
123
215
26
51
58
83
122
319
50
41
54
-
100
200
300
400
500
600
700
FY 06-07 (n=196) FY 07-08 (n=337) FY 08-09 (n=646)
# pa
rtne
rs Older AdultAdultTAYCYF
*as of July 1, 2010.
HISTORY IN FULL SERVICE PARTNERSHIP Clients have varied amounts of time in treatment depending on when they entered their FSP program. New client enrollment is continuous and on‐going. The DCR Partnership Report shown on the following page is generated from data entered by the providers into the Data Collection and Reporting System (DCR) described in more depth in the section on DCR Data Management and Quality. Briefly, the DCR system tracks client enrollment, as well as outcomes, for the FSP programs. The report shows a snapshot of all clients ever enrolled in an FSP as of July 1, 2010 (n=947), grouped by the amount of time in partnership in the FSP and their current active/inactive status. This report offers a way to see the reasons that clients are discharged from FSPs and where more intensified outreach or engagement might need to be focused.
92% increase
Page 16 of 70

MHSA Five Year Report
Page 17 of 70

MHSA Five Year Report
FOCUS ON “REASONS FOR DISCHARGE”
A total of 466 clients have had their FSP episode close (i.e., been discharged from care). The DCR system provides the opportunity to indicate a Reason for Discharge. These data are summarized in the following charts. CHILDREN A total of 239 discharges occurred from the two Child Youth and Family (CYF) FSPs. Within this age group, 122 (51%) met their treatment goals, the highest proportion of any age group. However, 42 of the children were discharged because they were in need of residential care. It would be useful to examine these cases to learn about the factors that made it impossible for these youth to be treated in the community. It may be that such a study would point to enhanced models of care that would prevent the need for them to be placed in residential care.
CYF FSPsNumber of Client Discharges by Reason for Discharge
122
20
42
22
3 8 39 10
0
20
40
60
80
100
120
140
Met goals Moved Needsresidential
care
Partner leftprogram
Placed DJJ PlacedJuvenile Hall
Serving jail Target criterianot met
Unable tolocate
Reason for Discharge
Num
ber
Page 18 of 70

MHSA Five Year Report
TRANSITIONAL AGE YOUTH (TAY) A total of 53 discharges occurred from the two TAY FSPs. Nine (17%) of these clients met their treatment goals. Ten TAY clients moved out of county, FSP staff were unable to locate 15 clients, and 12 were discharged because the clients left the program. There are many challenges with treating transitional aged youth who have serious mental illness, including difficulty forming treatment alliances. For each of these “reason for discharge” categories, average length of the treatment episode was over a year (423 days for clients who moved, 425 days for clients unable to be located, and 408 for clients who left the program), indicating that considerable time was spent working with the clients. It would be desirable to study and share successful engagement strategies among staff. Perhaps there are innovative strategies that programs could use to prevent clients from leaving while treatment is underway.
TAY FSPsNumber of Client Discharges by Reason for Discharge
910
5
12
2
15
0
2
4
6
8
10
12
14
16
Met goals Moved Needs residential care Partner left program Target criteria not met Unable to locate
Reason for Discharge
Num
ber
Page 19 of 70

MHSA Five Year Report
ADULTS A total of 137 discharges occurred from the four adult FSPs. Twenty (15%) are listed as having met their goals while in treatment; however, there are a number of unfavorable outcomes as well. Twenty seven clients left the program prior to completion, 26 were unreachable, and 8 were discharged due to justice system involvement (jail or prison). In addition, 23 of the adult FSP clients passed away during the treatment episode, highlighting the importance of forming connections with primary care providers for clients to receive routine screening and treatment.
ADULT FSPsNumber of Client Discharges by Reason for Discharge
2320
29
3
27
53
1
26
0
5
10
15
20
25
30
35
Deceased Met goals Moved Needsresidential
care
Partner leftprogram
Serving jail Serving prison Target criterianot met
Unable tolocate
Reason for Discharge
Num
ber
Page 20 of 70

MHSA Five Year Report
OLDER ADULTS Of the 37 discharges from the Older Adult FSP, very few (n=2, 5%) indicated that they had successfully met their goals. Ten clients moved out of county and eight clients discontinued their involvement with the program. These data raise many questions ‐‐ it will be important to learn about and enhance program features that encourage clients to remain engaged in, and benefit from, treatment for as long as possible. Nine older adult clients died during the treatment episode. These clients were relatively young (average age 67, as of January 1, 2010), yet have a heightened vulnerability to premature mortality ‐ many have experienced significant periods of homelessness and years of substance abuse. It will be important to ensure that all program participants are connected to medical services for routine screening and provision of urgent care in order to live well as long as possible.
OLDER ADULT FSPNumber of Client Discharges by Reason for Discharge
9
2
10
3
8
1 12
0
2
4
6
8
10
12
Deceased Met goals Moved Needsresidential care
Partner leftprogram
Serving prison Target criterianot met
Unable to locate
Reason for Discharge
Num
ber
Page 21 of 70

MHSA Five Year Report
DEMOGRAPHICS OF FSP CLIENTS
Demographic and diagnostic data for the 514 currently active FSP clients were pulled from the Mental Health billing database (INSYST) as of June 1, 2010.
SEX/GENDER Two‐thirds of current FSP clients are male, and the proportion of males to females is relatively consistent across age categories, except for Older Adults for whom there is an even split between men and women.
ETHNICITY The ethnic breakdown of active clients shown on the next page suggests that slightly more than a third of clients are African American and another third self‐identify as White. Hispanic or Latino clients comprise 18% of those actively enrolled. Asian and Pacific Islanders make up 8%, while the 6% remaining report either multiple, unknown or other ethnicities.
Gender of Current FSP Clients, n=514
MALE, n=355, 69%
FEMALE, n=158, 31%
Gender by Age Group, Current FSP Clients, n=514
20 (50%)
84 (61%)
40(77%)
212(74%)
53 (39%)
12 (23%)
73(26%)
20 (50%)
0
50
100
150
200
250
300
CYF TAY Adult Older Adult
# FS
P C
lient
sFemaleMale
Page 22 of 70

MHSA Five Year Report
ETHNICITY, N=514*
White (n=175)34%
African American (n=176) 34%
Native American (N=2) <1%
Latino(a) (n=90) 18%
Pacific Islander (n=10) 2%
Asian (n=32) 6%
Other/Unknown (n=10) 2%
Multi-ethnic (n=19) 4%
White (n=175)
African American (n=176)
Native American (N=2)
Latino(a) (n=90)
Pacific Islander (n=10)
Asian (n=32)
Other/Unknown (n=10)
Multi-ethnic (n=19)
*Self-Report, Multiple Answers Allowed
The ethnic distribution within FSPs is more similar to the population served by Medi‐CAL than to the general population of San Francisco. Clients identifying primarily as African Americans are notably over‐represented in the FSPs to the same extent that Asian/Pacific Islanders are under‐represented when compared to the general population. Given the on‐going concern about African American health disparities, these data suggest that if African Americans have the greatest need for intensive behavioral health services, as other data demonstrate, the FSPs appear to be penetrating those under‐served populations in particular. It may be worth exploring the unmet need for intensive services in the Asian communities, since they are less proportionately represented here, especially given that one in five Medi‐CAL clients is Asian or Pacific Islander, compared to less than one in ten of FSP clients. There may be some cultural or language barriers to access, or that serious mental illness is still deeply stigmatized, and people are not seeking help outside their own communities.
San Francisco* Medi‐CAL FSP ClientsJune 2010
African‐American 7% 26% 34% White/Caucasian 46% 30% 34% Latino/Hispanic 14% 14% 18% Asian + Pacific Islander 32% 21% 8% Other, Unknown, Mixed 3% 9% 6%
*Values may not sum exactly to 100% due to rounding.
The vast majority (88%) of FSP clients select English as their “preferred language”, and 8% prefer to speak Spanish.
Page 23 of 70

MHSA Five Year Report
PREVALENCE OF MENTAL HEALTH DIAGNOSES
Like the demographic data, prevalence of mental health diagnoses and substance abuse problems are also based on the CBHS billing system, INSYST, as of June 1, 2010. All episodes open on this date were captured in a snapshot to create a cross‐sectional dataset of the 514 clients. Mental Health Axis I diagnoses among TAY (n=52), Adults (n=285) and Older Adults (n=40) are heavily weighted toward Mood Disorders (42‐48%) and Psychotic Disorders (42‐44%). Among children’s programs, not surprisingly, Childhood Disorders are the most common diagnoses, 42%, with Mood Disorders (32%) and Anxiety Disorders (21%), comprising nearly half of all primary Axis I diagnoses.
Primary Axis I Diagnoses of FSP Clients, Client Percentages by Program and Disorder Type
as of June 1, 2010 (n=514)
32%42% 46% 48%
44%42% 43%
21%
12% 9% 5%
42%
1%
2% 3%1% 1%1% 1% 3%
0%
10%
20%
30%
40%
50%
60%
70%
80%
90%
100%
CYF (n=137) TAY (n=52) AD (n=285) OA (n=40)
OtherSubstance DisordersChildhood DisordersAnxiety DisordersPsychotic DisordersMood Disorders
Looking closer at Childhood Disorders, 18% of all children appear with Axis I diagnoses in Conduct/Oppositional/Disruptive Disorders (n=24). Attention Deficit Disorder (n=18) comprises 13% of young clients’ primary diagnoses, and the remaining 11% are other Childhood Disorders.
Page 24 of 70

MHSA Five Year Report
Primary Axis I Diagnoses of FSP Clients, Client Counts by Program and Disorder Type
as of June 1, 2010 (n=514)
9
35
616 20
10
99
19158
1223 11
73
17
23
1511
47
41
12
5
6
2
3 3
5
1
1
2
4
2
21
0
20
40
60
80
100
120
140
160
180
200
FamilyMosaic CYF
(n=27)
SenecaCYF
(n=110)
CivilService
TAY (n=24)
FSA TAY(n=28)
FSA Adult(n=37)
Citywide(n=29)
Hyde StreetAdult
(n=38)
SF FIRSTICM
(n=181)
FSA OlderAdult
(n=40)
Other
Substance Disorders
Childhood Disorders
Anxiety Disorders
Psychotic Disorders
Mood Disorders
The two TAY programs (Civil Service and Family Services Agency) differ somewhat in their client diagnostic profiles. FSA serves a greater proportion of youth with Mood Disorders (57% vs. 25%) compared to Civil Service TAY whose most prevalent diagnosis is Psychotic Disorders (63% vs. 29%). This may exist as a legacy of the early implementation of the FSP, when Civil Service TAY served primarily clients transitioning from foster care, rather than homeless, on the street youth, which was the target population for FSA. More recently, referrals to the two programs have been assigned to whichever program has an open slot, which is expected to distribute primary diagnoses more evenly across the two programs.
Page 25 of 70

MHSA Five Year Report
PREVALENCE OF SUBSTANCE USE PROBLEMS
Fifty‐four percent (54%) of all FSP clients were identified as having a significant co‐morbid problem with substance use. Adults present with the highest rate of substance use problems (81%) which drops among Older Adults to 33%. Citywide Forensics (83%) and SF First (84%) adult programs serve a higher proportion of clients with substance problems, compared with other adult programs (73‐76%). Less than half the TAY clients (42%) indicate significant substance use problems.
Indication of Substance Use among FSP Clients, Percentages by Age Groupas of June 1, 2010 (n=514)
9%
42%
81%
33%
91%
58%
19%
68%
0%
10%
20%
30%
40%
50%
60%
70%
80%
90%
100%
CYF (n=137) TAY (n=52) Adult (n=285) Older Adult(n=40)
SA NotIndicated
SAIndicated
Page 26 of 70

MHSA Five Year Report
Indication of Substance Use among FSP Clients, Client Counts by Program as of June 1, 2010 (n=514)
10 12 27 24 29
152
13 22
103
14 16 9
29
27
7 5
10 5
0
20
40
60
80
100
120
140
160
180
200
Family Mosaic
CYF (n=27)
Seneca CYF
(n=110)
Civil
Service TAY
(n=24)
FSA TAY (n=28)
FSA Adult (n=37)
Citywide Forensics
(n=29)
Hyde Street (n=38)
SF FIRST ICM
(n=181)
FSA Older Adult (n=40)
SA Not Indicated SA Indicated
CYF TAY ADULT OA
Page 27 of 70

MHSA Five Year Report
Among the 279 clients with evidence of substance use, 223 received a DSM diagnosis that identified the main drug problem. Alcohol is the most commonly named drug (35%). However, 123 (44%) clients indicated either “Polysubstance” or “Unknown”.
Substance Use Problem by Named DrugClient Percentages for All FSP Clients with SA Indicator (n=279)
35%
24%
6% 5% 5%4%
1%
20%
0.4%0%
5%
10%
15%
20%
25%
30%
35%
40%
45%
50%
Alcohol Polysubstance Marijuana Amphetemines Cocaine Heroin Caffeine Hallucinogens DrugUnknow n
Historically the FSP programs were not particularly focused on providing substance use treatment services. The transition to integrating substance counseling and treatment begs the question of how it has been implemented and how is it going? Have the programs trained staff within their programs to be more skilled at addiction counseling, or have they hired addiction or drug and alcohol counselors to increase their capacity to address these issues among their co‐morbid clients? Do the programs refer out clients to substance use services housed with other providers? This is worth understanding further and following up on the quality of the integration and the linkages.
Page 28 of 70
MHSA Five Year Report
OUTCOMES DCR DATA MANAGEMENT AND QUALITY The Data Collection and Reporting system (DCR) is a state DMH‐designed and maintained database for MHSA‐funded Full Service Partnership (FSP) client data for the purpose of illustrating client and program outcomes. The FSP providers access the DCR database by logging in through an internet browser program such as Microsoft Explorer and navigating to the State’s Performance Outcomes & Quality Improvement (POQI) website and, in particular, the Information Technology Web Services (ITWS) site. The DCR resides within the suite of secured databases on ITWS. Program providers have established accounts and secured access that allows them to enter client data into the DCR. San Francisco CBHS is able to extract the data for all civil service and contracted programs within the City and aggregate it to illustrate client and program outcomes. San Francisco was the first county in California to pilot the DCR, and one of only a few that has the Information Technology (IT) expertise and resources dedicated to accessing and reporting outcomes from the system.
Data Collection Tools
At client enrollment into the FSP, providers complete an initial assessment called the Partnership Assessment Form, or PAF. In addition to basic administrative information, such as the client’s enrollment date, the PAF covers several functional domains in the client’s life: residential setting, financial supports, education, employment, legal issues and medical and mental health emergency data. In addition, one item captures the Milestones of Recovery Scale (MORS). The PAF captures client information for the 12 months immediately preceding enrollment, which we refer to as the “baseline” in many analyses. As clients accumulate time in the FSP program, follow‐up data are collected on the domains in two ways: 1) Quarterly, using the 3M Assessment; and as 2) Key Events, using the Key Event Tracking form, or KET. The 3M and KET data are designed to provide a complete picture of changes in the clients’ lives as they move through recovery.
Getting San Francisco data from DMH
The DCR system itself provides no direct reporting capability, which is a significant limitation to the system, especially for the FSP program staff who are unable to view any client or program level reports. It does, however, allow counties to download their own data. San Francisco built a process to download DCR data from the state’s central server into a local data warehouse, where it is analyzed and used as the source for several data quality and outcomes reports. These reports are then provided to the programs. More specifically, the DCR data are downloaded from the DMH server in XML format to San Francisco, then subjected to several programming steps that transform and load the data into a SQL Server database. Quality assurance procedures are performed to remove any invalid records.
Page 29 of 70

MHSA Five Year Report
Page 30 of 70

MHSA Five Year Report
The San Francisco IT team has encountered several challenges in the download process. The structure of the downloaded DCR data is based on the domains on the three assessments and repeated occurrences over time. The data for any particular domain are split across multiple tables. In addition, there is no direct data on the duration of such things as a residential setting, the partnership, employment or education. In order to produce reports that show partner outcomes over time, IT had to restructure the DCR data and calculate intermediate results in the data warehouse. Lookup tables were added to the data warehouse so data values could be translated into meaningful descriptions. Several quality and outcomes reports have been produced using various applications, primarily MS‐Access, Crystal Reports, and Excel. Building the download process, the data warehouse, and preparing these reports have all taken significant IT and MHSA resources.
Quality Assurance Reports
Data quality problems became evident with the first reports generated from the DCR. It is clear from meetings with the program directors that providing real‐time reports organized by program and domain is extremely informative and motivating in terms of correcting data inaccuracies and beginning dialog about the quality of services. The following is a sample list of quality assurance reports supplied regularly to the FSP programs:
Missing DCR Registrations: For each FSP provider, this report compares open client episodes in the MH billing system to clients registered in the DCR in order to identify new clients whose registration in the DCR needs to be completed.
DCR Quarterly Assessment Completion by PSC: For each FSP provider, lists all Partnership Service Coordinators (PSCs), partners and 3Ms due for a given period, and whether or not they were completed.
DCR Quarterly Assessment Completion by FSP: Lists FSP providers along with their rates of 3M completion.
KEY Summary by FSP: Lists FSPs and their rates of KET collection. KEY Summary Report – Detail: For each FSP provider, by PSC, this report lists clients’ detailed log of KET activity by domain (e.g. Education, Emergency, Employment, Legal, and Residential) and the total of KET events by date.
MORS Score for 6 Months: For each provider, individual clients are listed with their episode opening date, number of days into their episode and the MORS score for each of the past 6 months, color coded for severity‐wellness. A blank score indicates that the MORS was not collected for that month.
Client reports have been generated listing detailed histories of residential settings and financial supports. The reports include each domain item and its associated date in order to show a client’s key events data over time. The case managers (or PSCs) can review these lists and see where the DCR data do not match their notes or their client’s experience, and they provide staff with a historical summary of a partner’s data that is not easily visible in the DCR. Other quality improvement efforts include periodic on‐site retraining of staff on the DCR system and reviewing data coding and collection practices at meetings of program directors, held monthly. The MHSA Evaluation Team at CBHS staff members are also available by email and telephone to provide technical assistance.
Page 31 of 70

MHSA Five Year Report
DCR DATA OUTCOMES
The following outcome graphs are based on the Mental Health Services Act (MHSA) Data and Collection Reporting system (DCR), a web‐based system for Full Service Partnership (FSP) programs funded by MHSA. Data cover the time period from the implementation of MHSA funding to July 2010.
Residential Outcomes
The Residential Outcomes analysis examines the number of days that clients stay in different settings, based on data entered in the Partnership Assessment Form (PAF) at intake and the Key Events Tracking (KET) entries through the client’s course of FSP enrollment. The Baseline Year is drawn from the PAF (intake) form on the DCR, where the client is asked: “During the past 12 months, indicate the total # of days” in each residential setting. Once services begin, each time a client changes a residential setting, the client’s Partnership Service Coordinator is expected to log it as a Key Event in the DCR. Time periods are calculated between KET entries to determine length of time in each setting. The Residential Outcomes graphs that follow include only those FSP clients who have at least one full year in partnership. Clients who transfer from one FSP to another have their entire history listed under their current FSP, but this applies to fewer than 20 of the total number of clients represented here. RESIDENTIAL DEFINITIONS: General Living applies when a client owns or rents their own housing independent of system supports. Supervised Placement includes individual and congregate placements, community care and assisted living. Residential Treatment includes group home settings, community and residential treatment facilities, as well
as nursing physical, psychiatric and long term care. MHSA Stabilization refers to single‐room occupancy hotel placements which gave clients a stable place for
90 days in order to acquire documentation necessary for more permanent housing. Shelter/Temp Housing includes homeless or domestic violence shelters and any single room occupancy
(SRO) stays without benefit of tenants’ rights. SRO (Single Room Occupancy) w/Lease acknowledges the rights of tenants which are automatically invoked
after 30 days in an SRO hotel unit. Criminal Justice may include Juvenile Hall or Camp (for children only), or any prison or jail setting. Hospitalization encompasses medical or local and state psychiatric hospital stays
Page 32 of 70

MHSA Five Year Report
CHILDREN The majority of children in our FSP client population lived with family during their first year. Optimally, children reside within their own families, however an unfortunate reality is that some family settings are not the best option for a child due to violence or other unsafe conditions. In general, community settings are more favorable than restrictive settings such as residential treatment, hospitals or in the criminal justice setting. It is generally a more favorable outcome for children and youth to move from restrictive settings to community based settings appropriate to their needs. From baseline to the first year in partnership, the data show a notable reduction in the number of days spent in residential treatment (66%) and hospitalizations (82%), with a corresponding increase in placement with family (23%), or foster care (38% with relatives; 57% with non‐relatives). There was a slight increase in time spent (102 days, 38%) in criminal justice settings which may be a function of children increasing in age, and along with it, exposure to and engagement in higher risk behaviors.
RESIDENTIAL SETTINGS for CHILD ClientsBaseline Year vs. First Year in Full Service Partnership (FSP)
(n=123, as of July 2010)
4,698
6,960
1,087
88 269 255
6,501
10,932
4,912
79693 371 46
17,269
14,239
21,244
0
5,000
10,000
15,000
20,000
WithParents/Family
Foster Care(w/relative)
Foster Care(w/non-relative)
ResidentialTreatment
Other/Unkown Shelter/TempHousing
Criminal Justice Hospital
# Day
s in
Res
iden
tial S
ettin
g
Baseline Year1st Year in Treatment
+ 23%
- 82%+ 38%- 27%
- 66%
+ 57%
+ 38%+ 6%
Page 33 of 70

MHSA Five Year Report
TRANSITIONAL AGE YOUTH (TAY) “General Living” represents the vast majority of days that the 53 youths spent in their first year. For other settings, the TAY chart shows deep reductions from Baseline to First Year in Treatment for Homeless (82%), Criminal Justice (71%), and Hospital (42%) days. Concurrently, spiked increases in MHSA Stabilization, Shelter/Temporary housing (74%) and SRO with a Lease (>2000%) suggest that youth not already in General Living situations are being directed with the support of the FSP into more stable residency. Interpretation of the 157% increase in Supervised Placement requires a more individualized understanding of each client’s situation and where s/he is moving from. Going from homelessness to a supervised placement may be an improvement if previously unmet need is being addressed. However, a youth moving from General Living to Supervised Placement may be suffering a significant setback in his/her recovery.
RESIDENTIAL SETTINGS for TAY Clients Baseline Year vs. First Year in Full Service Partnership (FSP)
(n=53, as of July 2010) 9,901
530
3,100
1,2591,105
60
1,323 1,439
628
1,361
2,623
228 113
1,920 1,841
386
833
326
N/A
9,714
0
1,000
2,000
3,000
4,000
5,000
6,000
7,000
8,000
9,000
10,000
General Living SupervisedPlacement
Residential Tx Homeless MHSAStabilization
Shelter/TempHousing
SRO w/Lease Criminal Justice Hospital Other/Unknown
# Day
s in
Res
iden
tial S
ettin
g
Baseline Year1st Year in Treatment
- 2%
- 48%
- 42%
- 71%
+ 2968%
+74%
- 82%
- 15%
+ 157%
(N/A)
Page 34 of 70

MHSA Five Year Report
ADULTS Among the 261 adults, days spent in an SRO with Lease increase from 36% of total days at baseline to 47% in their first year. Notable decreases are seen in Homeless (59%), Shelter/Temporary Housing days (27%) and the more highly restrictive settings of Criminal Justice (32%) and Hospital (42%) in the first year of treatment. Increases are seen in more favorable settings that suggest movement toward greater stability, such as MHSA Stabilization and SRO with Lease (30%). Of interest among adults is the increase in relatively restrictive settings of Residential Treatment (52%) and Supervised Placements (21%). If clients are moving off the streets into residential mental health or substance abuse treatment, these may be viewed as relatively positive outcomes. Further inspection of the client data would clarify the direction of their movement and help interpret these results. For adults, it may be considered an improvement to move into Residential Care if it is a step out of unstable living, such as homeless or shelter living, and toward substance use recovery.
RESIDENTIAL SETTINGS for ADULT Clients Baseline Year vs. First Year in Full Service Partnership (FSP)
(n=261, as of July 2010)
4,081
14,928
11,678
6,353
3,064 2,489
4,918
8,006
6,097
4,126
8,502
45,030
421
34,663
N/A
5,254
12,755
1,777
4,297
12,091
0
5,000
10,000
15,000
20,000
25,000
30,000
35,000
40,000
45,000
General Living SupervisedPlacement
Residential Tx Homeless MHSAStabilization
Shelter/TempHousing
SRO w/Lease CriminalJustice
Hospital Other/Unknown
# D
ays
in R
esid
entia
l Set
ting
Baseline Year
1st Year in Treatment
- 5%
- 83%
- 42%- 32%
+ 30%
- 27%- 59%
+ 52%
+ 21%
Page 35 of 70

MHSA Five Year Report
OLDER ADULTS Residential outcomes for Older Adults mimic those of the adults, with two significant exceptions. Older adults show movement out of General Living (decreasing 26%) in the first year along with an increasing number of days in the hospital (53%). Increasing age and decreasing physical health may be driving the shift away from independent living into increasing inpatient care, or possibly, the FSP program has given these older clients access to previously unmet intensive health care.
RESIDENTIAL SETTINGS for OLDER ADULT Clients Baseline Year vs. First Year in Full Service Partnership (FSP)
(n=38, as of July 2010)
5,648
403
5
1,210
2,954
1,210
125
600
2,050
1,139
405
812
365
2,503
1,896
59
919
1,579
N/A
4,193
0
1,000
2,000
3,000
4,000
5,000
6,000
General Living SupervisedPlacement
Residential Tx Homeless MHSAStabilization
Shelter/TempHousing
SRO w /Lease Criminal Justice Hospital Other/Unknow n
# Day
s in
Res
iden
tial S
ettin
g
Baseline Year
1st Year in Treatment- 26%
- 23%
+ 53%
- 53%
+ 57%
- 15%
- 33%
+ 8000%
+ 183%
Overall, the data for all age groups generally suggest decreases in less desirable settings and increases in more stable and independent living in the first year of treatment. It would be interesting to explore the results comparing three‐to‐four years in partnership for clients who are served longer in their FSP.
Page 36 of 70

MHSA Five Year Report
Emergency Event Outcomes Emergency Events are those situations that may signal a change for the worse in a client’s recovery. These events include: arrests, use of emergent/urgent mental health services (e.g. Psychiatric Emergency Services or Crisis Intervention) or medical emergency services among all FSP clients, and suspension or expulsion from school for children and youth. The following four charts allow comparison of the number of emergency events from clients’ baseline year (prior to enrollment in the FSP) to their time in treatment, as derived from the Key Events Tracking data (KET) in the DCR. All clients with time in FSP treatment are included in the Emergency Events analysis (unlike the Residential Outcomes analysis that was limited to those clients with at least one year in treatment). The report displays “number of events per person‐year”, meaning these are not averages per individual. It counts the number events for the age group over the total amount of time in treatment for all clients in that age group, then averaged for a one year period, in order to compare the rate during Baseline to the rate during the Treatment period. Overall, these charts show dramatic decreases in the occurrence of Emergency Events from the Baseline Year (the 12 months prior to enrollment into an FSP program), to FSP treatment.
Page 37 of 70

MHSA Five Year Report
CHILDREN Among Child, Youth, and Family partners, all emergency events show substantial declines during treatment. The rate for School Suspensions, had a baseline rate of 1.2 events per year for all Child clients, was cut 50% to 0.6 during treatment. Arrests and Mental Health Emergencies, although beginning at lower rates at baseline, dropped by more than 60%. Physical Health Emergencies were reduced to nearly zero for the time in treatment. Because the child population is largely comprised of clients from Seneca Connections (n=294), the percentage changes most closely reflect those of Seneca rather than FMP. Within FMP (n=73), Arrests dropped 54% and Mental Health Emergencies declined 57%. Physical Health Emergencies (‐92%) and School Expulsions (‐92%) showed impressive reductions and School Suspensions dropped by 77%
EMERGENCY EVENTS for CHILD Clients Baseline Year vs. Full Service Partnership (FSP)
(n=366, 2007-2010)
0.4 0.37
0.15
1.15
0.110.15 0.130.03
0.58
0.010
0.5
1
1.5
2
2.5
Arrests Mental HealthEmergencies
Physical HealthEmergencies
SchoolSuspensions
SchoolExpulsions
Even
t Rat
e (#
Eve
nts
/ per
son-
year
)
Baseline
In Treatment
- 63%
- 65%
- 80%
- 50%
- 91%
Page 38 of 70

MHSA Five Year Report
TRANSITIONAL AGE YOUTH (TAY) Among TAY participants, the most common Emergency Event at baseline was Mental Health Emergencies. Mental Health Emergencies averaged nearly two per person/year at program start; by the end of the year they drop 86% to 0.3, however this masks differences between the two TAY‐serving programs. Civil Service TAY Mental Health Emergency event rate at baseline is 2.6 and drops to 0.1, an improvement of 95%. Physical Health Emergencies show a similar pattern where Civil Service TAY dropped 97%, but the initial event rate was quite small to begin with (0.5). While the percentage changes for School Suspensions and Expulsions appear significant, the actual numbers of events were relatively small. Four Suspensions at baseline (event rate=0.04) dropped to one in treatment (event rate=0.01), and one Expulsion at baseline dropped to zero in the follow‐up period, with little difference between programs.
EMERGENCY EVENTS for TAY Clients Baseline Year vs. Full Service Partnership (FSP)
(n=102, 2007-2010)
0.49
1.9
0.29
0.010.11
0.26
0.04 0.01 00.040
0.5
1
1.5
2
2.5
Arrests Mental HealthEmergencies
Physical HealthEmergencies
SchoolSuspensions
SchoolExpulsions
Even
t Rat
e (#
Eve
nts
/ per
son-
year
)
Baseline In Treatment
- 78%
- 86%
- 86%
- 75% - 100%
Page 39 of 70
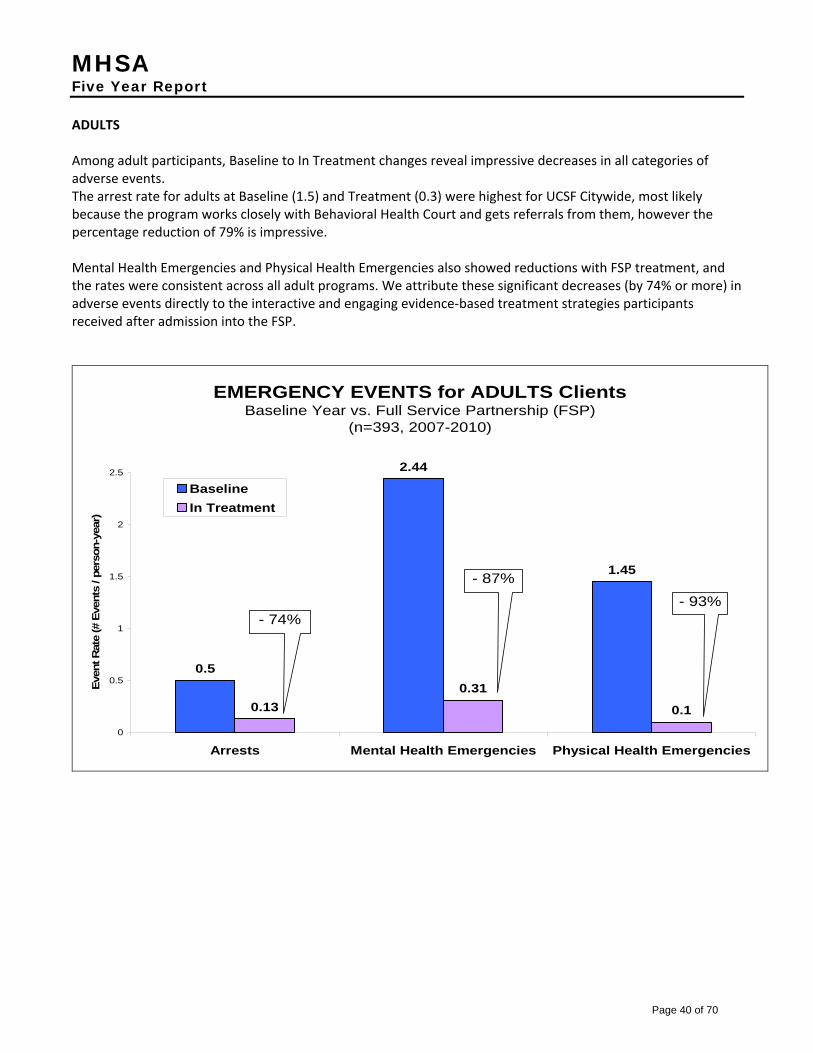
MHSA Five Year Report
ADULTS Among adult participants, Baseline to In Treatment changes reveal impressive decreases in all categories of adverse events. The arrest rate for adults at Baseline (1.5) and Treatment (0.3) were highest for UCSF Citywide, most likely because the program works closely with Behavioral Health Court and gets referrals from them, however the percentage reduction of 79% is impressive. Mental Health Emergencies and Physical Health Emergencies also showed reductions with FSP treatment, and the rates were consistent across all adult programs. We attribute these significant decreases (by 74% or more) in adverse events directly to the interactive and engaging evidence‐based treatment strategies participants received after admission into the FSP.
EMERGENCY EVENTS for ADULTS Clients Baseline Year vs. Full Service Partnership (FSP)
(n=393, 2007-2010)
0.5
2.44
1.45
0.130.31
0.10
0.5
1
1.5
2
2.5
Arrests Mental Health Emergencies Physical Health Emergencies
Even
t Rat
e (#
Eve
nts
/ per
son-
year
)
Baseline In Treatment
- 74%
- 87% - 93%
Page 40 of 70

MHSA Five Year Report
OLDER ADULTS Since there is only one older adult FSP program, Family Services Agency (FSA), there are no comparisons to make here. These data are based on the 72 clients who have ever received services at FSA Older Adult. Despite what may fairly be assumed is a group with the poorest health, Mental Health and Physical Health Emergencies fell sharply during their first year, down to 0.16 and 0.30 per person/year respectively. Arrests almost disappeared; down 98% to 0.02.
EMERGENCY EVENTS for OLDER ADULTS Clients Baseline Year vs. Full Service Partnership (FSP)
(n=72, 2007-2010)
0.82
1.53 1.46
0.020.16
0.3
0
0.5
1
1.5
2
2.5
Arrests Mental Health Emergencies Physical Health Emergencies
Even
t Rat
e (#
Eve
nts
/ per
son-
year
)
Baseline In Treatment
- 98% - 90%
-79%
These findings present compelling evidence of the value FSP programs are providing to individual clients and to the system as a whole. Addressing previously under‐treated mental illness, providing education and employment supports for recovery, connecting clients to primary care and substance use treatment, and all the other efforts of intensive case management provided by the FSPs, appear to lead to very positive functional outcomes for clients. These results further suggest that MHSA has enabled FSPs to successfully empower clients and foster a partner relationship with providers in working toward a shared goal of overall mental and emotional wellness. LIMITATIONS OF RESIDENTIAL and EMERGENCY EVENTS DATA Baseline data are dependent upon client or family self‐report that demands recall of a 12 month historical interval immediately preceding enrollment. There is no way of knowing how accurate these recollection data are. Recall beyond a few days can be difficult, even in the best circumstances. Events that occur during treatment depend upon the FSP provider entering Key Events to the database in a timely and accurate manner. This may not always occur. At present, data systems are not in place to allow cross checking with the DCR to identify actual events that have yet to be logged. It is possible that some residential changes or emergency events that occurred during FSP treatment are missing from these analyses. With increasing integration of city‐wide data systems, future data quality cross checks may allow CBHS to identify events in non‐DCR systems and produce reports that show missing data in the DCR Key Events Tracking.
Page 41 of 70

MHSA Five Year Report
MILESTONES OF RECOVERY SCORE (MORS)
The Milestones of Recovery Score (MORS) is a single item assessment of how a client is doing in their process of recovery. It was developed by the founders of The Village in Long Beach, an early innovator in the application of the Recovery Model in the treatment of people with severe mental illness. . The MORS rates a client’s recovery based on three factors: 1) Level of Risk, 2) Level of Engagement with treatment, and 3) the client’s Skills and Supports. The MORS also provides a common metric for communicating how clients are progressing, or not. (For more information about the MORS, please follow this link to http://www.cmhda.org/committees/documents/ASOC_handouts_(2‐14‐07)_Milestones_of_Recovery_Paper_(Dave_Pilon).pdf.)
MORS Score
MORS Description
1 Extreme Risk 2 High Risk / Not Engaged 3 High Risk / Engaged 4 Poorly Coping / Not
Engaged 5 Poorly Coping / Engaged 6 Coping / Rehabilitating 7 Early Recovery 8 Advanced Recovery
We have developed two reports based on the MORS. The first report (see below) displays individual MORS scores, by client, over a six month period, grouped for each FSP program. Scores are color‐coded from red to orange to yellow to green. Red, orange and yellow suggest that the client is not doing very well, and is involved with the milestones of risk and engagement (or not) with services . Clients in the green shades are doing better, and are moving along with their recovery. These scores may suggest that clients are approaching readiness to transition to less intensive levels of service, . However, no single score can, by itself, indicate that a client is ready to “step‐down.” It may be that the client’s MORS score is as high as it is because they are being provided with high levels of support from the FSP. In this instance, to step them down might risk potential relapse. It is important to note that as the client moves along the milestones, he or she will become less engaged with the professional services sector, and come to rely more on community institutions and s/he will be more “self‐responsible” for managing his or her own life. The FSP programs do not have uniform or clearly defined protocols for graduating a client from the FSP program based on the MORS, or any other single data point. It would be useful to examine MORS scores more closely for those clients who appear to be doing well, along with other data (e.g., utilization, crises), in order to determine which clients would best benefit from “stepping down” in services or graduating from the FSP.
Page 42 of 70

MHSA Five Year Report
For example, this client has been in treatment at this FSP for 8 months. His MORS score in Sept was 5, implying that he was engaged in services, though coping poorly. The Oct rating implies that he became unengaged, though the Nov rating suggests re-engagement. In December, the client was rated at Extreme Risk, and there is no January rating, implying that the case manager had no contact with the client during that month. In February, he is back to a 5 rating, re-engaged but coping poorly.
This section is a summary “snapshot” of the FSP as a whole during the month of Feb. In that month, no FSP clients were at extreme risk (MORS=1), two were at High Risk/Not Engaged (MORS=2), etc.
Page 43 of 70

MHSA Five Year Report
In addition to providing client‐level feedback, we are also exploring the use of MORS data to assist programs in evaluating overall program performance. While still in development, the next report (below) shows MORS scores grouped for each program, stored in cells that indicate the number of clients who changed from one month to the next. Looking at the first row of grids (Citywide Adult FSP), the number of unduplicated counts of clients with scores for March and April 2010 appears in the upper left gray box, “TOTAL = 28”, next to the RU number displayed vertically. Gray cells indicate the number of clients whose scores remained unchanged from month one (March) to month two (April). In this case they total to 20 (71.4%). Green cells indicate improvement (n=2, 7.1%), while yellow cells show the reverse (n=6, 21.4%). Moving right, the months move ahead showing April to May, then May to June. Each grid counts only those clients for whom scores are submitted for both months displayed, so the specific clients can vary from one grid to the next. In general, there appears to be considerable stability of clients within the adult programs (70‐83%), meaning that most stayed the same from one month to the next. The most common score is a “5”. Two exceptions to this pattern emerge. The first is with Citywide Adult FSP whose stable scores for April (71%) and May (72%) decrease to 56% for June, and the percentage of clients who scored lower (“Deteriorated”) increased considerably to 36%, compared to 21% and 10% in prior months. Secondly, FSA Adult shows higher percentages of clients “Improved” (21‐36%), compared to the other programs, and higher percentages as well of those who deteriorated from one month to the next. FSA’s total number of MORS scores also declined significantly from April and May (n=29 and 27, respectively) to June (n=11). Older Adults showed exceptional improvement in May in which 43% percent of clients improved, including 4 people who jumped from “3” to “5”. The next month shows stability of people at score “5” (n=9) accounting for 86% of scores for that month. On the high end, two buckets stand out. In the month of June, both FSA Adult and Civil Service TAY Outpatient Services have clients who scored “8” on the MORS two months in a row. If these clients continue to score in the 7‐8 range, we would understand that they are experiencing an advanced stage of recovery and should be considered as candidates for graduation from the FSP, or stepping down to a less intensive level of outpatient care. Other factors should also be taken into account, but the MORS can be one useful piece of information in making that determination.
Page 44 of 70

MHSA Five Year Report
Page 45 of 70

MHSA Five Year Report
Page 46 of 70

MHSA Five Year Report
FIDELITY TO MHSA PRINCIPLES
CLIENT‐CENTERED WELLNESS AND RECOVERY MODEL OF CARE
Client‐centered recovery hinges on adapting support to the individual needs of the client, using “whatever it takes” to help move them out of high risk and low engagement behavior into engagement and self‐care. Doing “whatever it takes” is a cornerstone philosophy of MHSA. MHSA “Flexible Funds” represent one strategy to provide clients with supports not conventionally available from public funds. Flexible funds are used in many situations by FSP programs as they act as partners in their clients’ lives, providing or advocating for services as basic as food, transportation and self‐care, or more involved support, such as accessing stable housing or connecting to employment opportunities. The programs repeatedly express commitment to creativity, flexibility and persistence in supporting clients in their recovery, going beyond conventional client/provider relationship roles.
Examples of the use FSP support, in the spirit of “whatever it takes,” as reported by FSP programs in San Francisco, include:
• Meeting clients on the streets, in their homes, at community centers, in hospitals and clinics, and anywhere the client might be; or meeting clients at unconventional times (before 7am, for example). Because of the innovative notion of providing nearly all services “where the client is at,” FSPs are able to help clients generally considered too challenging for other programs.
• Socialization activities, such as taking clients out to lunch to facilitate the engagement process or taking clients on outings (education, entertainment, sports events, etc.) to engage in clean and sober fun activities
• Transportation Assistance, such as helping to purchase bus passes so clients can access services, go to school or seek employment
• Advocacy, such as negotiating with medical providers to get clients seen more quickly to minimize distress in the waiting room
• Community integration activities, such as facilitating self‐care; accompany them to a salon/barber or supporting client in reconnecting to music (one program helped a client budget and save money to buy an instrument and found and facilitated auditions).
• Housing related activities, such as supporting the client through the housing process with help assembling written documentation, making reminder calls, accompany clients to housing program interviews, writing letters of support or purchasing furniture for clients’ homes to make it more comfortable for them.
At least one provider expressed a concern about managing client expectations, however: “the staff learned that [whatever it takes] does not always mean whatever the client wants, but rather being flexible and creative in interventions and often saying ‘No’ and setting limits when appropriate.”
Page 47 of 70

MHSA Five Year Report
Examples of the use flexible funds include: • Financial Assistance, such as paying out of pocket for specialized therapy for clients;
o dentures when client’s insurance would not cover it or o corrective lenses for clients, when Medi‐Cal stopped covering vision, or o other medical care not covered by insurance o “bridge” loan for rent
• General living assistance for food, hygiene supplies, and child care • Employment assistance in the form of work stipends and career counseling • Legal assistance: paying for legal fees or fines • Education support for text books, tuition, and mentoring
MHSA funding has enabled the provision of services to address needs that would otherwise go unmet. Programs appreciate the flexibility of MHSA monies, enabling them to fund the most essential client needs on an individualized basis. As one put it “we would not be able to use the ‘whatever it takes’ approach if we did not have MHSA funding”. Wrap‐around services, including extensive outreach, allow programs to keep the most difficult clients engaged and connected. This approach helps to foster trust and more holistic relationships.
Five Full Service Partnership (FSP) programs (CBHS TAY, FSA Adult and TAY, Seneca SF Connections, SF FIRST FSP and Citywide Forensics FSP) of the eight in San Francisco reported making adjustments to their original design plans that involved adding staff and/or new services. For example, they:
1) Added staff to serve a larger caseload 2) Increased focus on the most difficult, “high‐end user” cases 3) Provided wraparound services in‐house (vs. referrals to other agencies) 4) Provided new, targeted services, such as those helping youth stay with their families 5) Established or enhanced supportive employment within the agency 6) Supported clients in their integration into the wider (non‐behavioral health) community.
With these increased or redirected resources, the programs reported a greater capacity to accommodate specific needs of their FSP clients. For some programs success is defined by service add‐ons such as: having a drop‐in center, community bonding activities, transportation options, and the ability to pay for small items such as gift cards that helps retain relationships. While some programs report treatment success in numbers, most measure success on an individual client level. Sometimes success is graduation from the program into the community, such as with Transitional Age Youth. More often it is harm reduction— improvements in housing stability, independent functioning, employment, volunteering, or school attendance and community integration, as well as decreases in substance abuse and criminal justice incidents – where most functional improvements are demonstrated.
CLIENT FEEDBACK
San Francisco CBHS satisfaction conducts a bi‐annual client satisfaction survey for all civil service and contracted programs, including those receiving MHSA finding. Nearly all FSP programs cited this event as their primary
Page 48 of 70

MHSA Five Year Report
input from clients. One agency reported use of a standardized evaluation tool (Wraparound Fidelity Index (WFI‐4), administered to caregivers and clinicians as well as the children served. Another program has plans to implement a Consumer Council which is designed to elicit regular feedback from clients. The programs also report frequent one‐on‐one or small group opportunities for clients to set priorities and provide input to their care. Feedback from clients can directly influence the provision of services. “Consumers are encouraged to regularly provide feedback to staff individually or in groups. The establishment of additional groups was in response to client input, as was the development of a vocational program and activity groups in the former Clubhouse..” (HYDE STREET FSP)
Grievance procedures are also in place so that clients may file a grievance with their FSP provider, (or other service). If the grievance is not satisfactorily addressed by the program, a client may file a grievance with CBHS directly, and it will be assessed and investigated by CBHS Quality Management.
CULTURAL COMPETENCE AND ACCESS TO SERVICES
All programs report that they have diversified staff, with respect to ethnicity/race, culture, sexual orientation, and language capabilities. Cultural competency trainings for staff are prevalent among the programs, including: “Supportive services for parents/caregivers of LGBT youth”, “Culturally Relevant Assessment”, “Trauma and Healing – Multicultural Considerations”, “Race and Identity of Clients”, among others. Unfortunately, ethnic diversity of staff do not always reflect the client population.
Discrimination in the community toward clients seeking housing and employment persists. Most often the reasons cited by program directors as barriers to care are discrimination against clients with a criminal background (particularly sex offenders), young age (TAY), and/or being non‐English speaking.
BARRIERS TO ACCESS
Some of the supportive services mentioned above are more easily accessed than others. Unfortunately, significant barriers are encountered by clients seeking substance abuse treatment for which the wait time is often 2‐3 months. For an addicted person ready to enter detoxification treatment, the long wait can often miss a window of opportunity and motivation, and send the client back into the streets with a high risk of relapse. Programs report long waits to access primary care for their clients as well.
Linking youth to housing resources has proved especially challenging, as many agencies are not trained nor adequately prepared to support the specific challenges of housing young adults (TAY). For clients of any age with criminal histories, many housing programs are completely off limits, per regulations that bar sex offenders or those with felony convictions from residing in federally supported housing.
Page 49 of 70

MHSA Five Year Report
CONSUMER AND FAMILY MEMBER EMPLOYMENT AND TRAINING
All programs report having at least two consumers (current or former users of the public mental health or substance abuse treatment system) employed at their site, many hired with MHSA funds. Several clients are paid stipends, as well as competitive market‐level salaries for their positions within the agencies. Roles and titles are varied and include: “outreach worker”, “peer case aide”, “vocational specialist”, “parent support network coordinator” and “life coach”. They provide assistance in linkages to housing, vocational and education programs, support groups and workshops. Peers run workshops such as WRAP groups, lead outings to social and cultural events and provide one‐on‐one and peer counseling. In the case of Seneca, which is a children’s FSP program, peer families are trained to support other families whose children are enrolled in FSP services.
Agencies recognize the importance of hiring consumers or peers to work with other clients and articulate three‐fold benefits: for the agency, other clients, and the consumer him/herself. Peers are able to engage with clients in ways other staff cannot especially in modeling recovery and hope. They offer lived experience to a provider team, improving the responsiveness of non‐peer staff to the clients. As for the integration of peers into one program’s team, “these peers have proven to be an invaluable and critically important part of our treatment team and overall strategy”.
They know better than any clinician the most intimate details of life for mentally ill people, and often contribute critically important knowledge about conditions on the streets, in the SROs and hotels, and in clinics and hospitals. Consumers also tend to know where to look for clients who have “gone underground” and are using heavily; they often serve as “bridges” to wellness for clients, using their own life experiences to build trust, rapport, and engagement. (FAMILY SERVICE AGENCY)
In a discussion of Housing definitions at CBHS, it was immensely helpful to have peer employees contribute to the understanding of what would distinguish an apartment from a Single Room Occupancy (SRO) in San Francisco where there are many variations on hotel and apartment building units. What it means to have a bathroom shared with one neighbor in an adjoining unit, compared with having to walk out into the hallway to a bathroom down the hall shared with multiple residents, for example, offered important insight to the discussion. In addition, consumers have the opportunity to garner work experience and increase perceptions of self‐worth.
[Peers] are eager to learn and establish themselves as “professional” within their scope of practice. Given truly meaningful responsibilities, they express a sense of accomplishment, pride and self‐worth. (HYDE STREET FSP)
A handful of clients have transitioned from supported employment to work as case managers, employment or housing specialists, or have moved entirely out of social services into other fields (e.g. security guard, paid musician). The impact of employment on their lives is tremendous, and for some, coincides with stable housing and the pursuit of more education.
Page 50 of 70

MHSA Five Year Report
CHALLENGES
Challenges encountered in employment were often related to the consumer’s ability to adapt to the new role, adopt professional behaviors, learn new skills, and set appropriate boundaries with other clients, all while maintaining their own recovery. Peers, working in settings that are familiar and that can present triggers for relapse, often struggle with counter‐transference, over‐identification with clients, and difficulty managing high‐risk situations. Some peers lack general work experience, professional training in mental health, familiarity with computers and/or adequate writing skills, necessary for billing and documentation. Agencies report that they need funding for vocational training to support peer employees, and extra time to provide additional, more intensive support and supervision to them than is typically required.
“If consumers are to be valuable members of the treatment team they must have meaningful tasks and be integrated into the program. Consumer staff members require good supervision helping them to understand their roles and responsibilities and learn how to interact as a “professional’ with clients, staff and community contacts. The major challenge has been to help them establish boundaries, set realistic goals, and learn to deal with frustration and disappointment.” (HYDE STREET FSP)
Lessons learned by staff in supervising consumers include providing direction in setting appropriate boundaries with other clients, which would include training in client confidentiality (e.g. HIPAA), as well as with other co‐workers. One agency implemented a requirement of one year of recovery for all peer positions to reduce relapse problems. Managers acknowledge the difficult balance of working with peers as employees, while giving them the additional training and support they need.
“The most important lesson I have learned in supervising consumers is that the transition to employment can be an immensely powerful tool for recovery and wellness. Providing adequate support, training, and regular supervision is also critically important to making the transition successful.” (FSA OLDER ADULT FSP)
Agencies report the need to define jobs clearly and provide meaningful tasks or activities that genuinely involve and engage the peer employee (e.g. participation in case conferences that invites peer insight and experience, rather than just filing papers or other more menial work).
RETENTION OF STAFF
Turnover is high working with a client population with multi‐layered challenges. Peer workers, although valuable in engaging clients in a meaningful way, can become stressed and/or triggered in the environments with clients, and this requires additional time on training and crisis assistance. Difficulties in retaining committed, effective staff are cited by programs as a major impediment to significant reform under MHSA. Programs also voiced concern about limited funding for employment of peers for use toward training, vocational support or stipends.
More detailed attention to supported and peer employment is warranted. A more in‐depth evaluation study of peer employment in San Francisco is intended for the near future.
Page 51 of 70

MHSA Five Year Report
COMMUNITY COLLABORATION AND LINKAGES TO SERVICES
VARIETY OF LINKAGES
Linking clients to services in the community is a keystone principle of the Full Service Partnerships (FSPs). Nearly all FSP programs report connecting clients to primary care, substance abuse, dental, vision and holistic therapy services, as well as housing and employment assistance, often involving vocational training. FSP programs also connect their partners to numerous community based, client‐focused, recovery‐supporting programs, such as: tutoring, mentoring/youth leadership training, legal help, independent living skills training, community gardens, computer classes, art programs/therapy, day care for seniors, social clubs and yoga or movement classes. Of particular interest among these programs are peer‐led groups that specifically support behavioral health recovery.
THE WRAP PROGRAM
One evidence‐based program in place at several sites in San Francisco is the Wellness Recovery Action Plan (WRAP). Pioneered by Mary Ellen Copeland and now part of the Copeland Center for Wellness and Recovery (www.copelandcenter.com), WRAP is a peer‐ facilitated program that supports participants in developing self‐directed wellness plans, self‐management skills and strategies for dealing with mental health crises, in a peer group setting. Led by a Peer Implementation Specialist, a total of 109 participants have experienced the WRAP program at eight different sites since first implementation in 2009. One WRAP program was conducted with mono‐lingual Chinese clients using an interpreter. New WRAP programs continue to be established at additional sites in San Francisco.
Page 52 of 70

MHSA Five Year Report
VIGNETTES OF CLIENTS IN RECOVERY
I have been with TAY since before I was eighteen and they have always had my back. When I struggle with my mind, my case managers talk me through it and help me develop a plan to develop my well being. They have provided me with housing, both through the Larkin Street Youth “Routz” program, and then again with a stabilization room. When I have no food, they take me shopping at Safeway. When I felt like I wasn’t well enough to hold a job, they set me up with a job working as a receptionist in a clinic. We’ve been to baseball games, museums, the movies and once in a while we fire up the barbeque and just chill. Without their help in the last couple of years, I know I would be much further down a different, more negative road in life. I appreciate most their open ears and their understanding of issues I once could not talk about. And what they say actually makes sense, it’s not just some crazy mumbo jumbo. I still stumble from time to time with my personal vices, but instead of completely shutting down, I try to think about all of the good things in my life right now, the majority I would not have without the help of TAY and the services they provide. (Civil Service TAY)
“F” is a young Latino man with a diagnosis of Schizophrenia, Paranoid type. F was diagnosed in 2000 at the age of 15. He entered the mental health system through a local day treatment program, then entered Family Mosaic Intensive Case Management (ICM). When he was aging out of the Children’s System of Care at age 17, soon to be turning 18, he was picked up by the Civil Service TAY program. Since his first diagnosis, F has been hospitalized on a 5150 four times; incarcerated twice for striking his mother in 2004 and in 2007 for hitting his father. F had severely decompensated on both occasions. For a brief period, he left CBHS to be cared for under Kaiser. In early 2007, F entered Family Services Agency TAY FSP. The staff worked intensively with him for 1 year. After living 18 months in a group home for youth, F moved into an MHSA housing program, where he paid 30% of his income into a savings account for future housing, as required by the program. F was also assigned to a housing case manager. During this time, F was using marijuana and methamphetamines. He eventually transferred back to the Civil Service TAY to work with his original bi‐lingual case manager, per his own request, since she was able to connect well with his monolingual Spanish‐speaking parents. Through the FSP framework, the case manager was able to work more intensely with F and provide assistance through MHSA flex funds (for public transit fast passes and purchase food) than would have otherwise been available. F continued to struggle with his drug use and psychotic symptoms until he was issued a 5150 in January 2009. This was his last hospitalization. He has worked with Civil Service TAY since then and is doing much better now. Throughout his ups and downs, F managed to earn his high school diploma. Currently he lives independently with roommates. With the help of his SSI benefits and his Payee, he consistently pays his rent. He lives only a few blocks from his family and keeps in close contact with them. He keeps in touch with a circle of friends he has known since elementary school. A few months ago, he obtained a job through Community Vocational Enterprises (CVE). He has future goals that include attending carpentry trade school through the Department of Rehabilitation, and getting his driver’s license. F has increased insight around his diagnosis and meets regularly with his psychiatrist for medication monitoring. He has consistently engaged in therapy and case management services and remained clean and sober from meth use since his hospitalization in 2009. He does however report continued marijuana use, roughly 2‐3 times per month. F will soon be transferring to an adult outpatient clinic. (Civil Service TAY)
One of our 21‐year‐old youths came from the foster care system and the criminal justice system with multiple trauma experiences. When he first came to our clinic he was guarded and difficult to engage. He has now been working as peer staff since August 2009. He is a responsible and conscientious worker. Staff and other
Page 53 of 70

MHSA Five Year Report
peers really respect and admire him for the hard work he puts in, and he engages with everyone in a respectful manner. He currently lives in an apartment through Foster Care Lease Program, has a girlfriend, and just became a father. He is also taking college classes now to complete his GED. (Civil Service TAY)
MHSA can do a lot in changing people’s lives. When this client came to our program, he had a serious drug problem and was in a cycle of crisis and using the emergency room and dual diagnosis programs as his only form of support. He was eventually able to articulate to his FSP case manager that his crises often went in cycles: he would get money from Social Security on the first of the month, use it on drugs, and then have no where to stay and no money. This is when he would go into crisis and go to the emergency room. His case manager immediately set him up with payee services and a single room occupancy (SRO) hotel unit, so his rent would always be paid and he would not go homeless. We assisted him with using harm reduction strategies, which helped him decrease his speed use considerably (down to 1 – 2 times per month). He had no teeth when he came to our program, and his insurance would not cover another pair (he lost the first set), so we purchased him a new set of dentures using MHSA flex funds. This did wonders for his self image and confidence, as well as his quality of life. He also began taking psychiatric medications, which helped to stabilize his mood. Our client got involved in Problem Solving Therapy with a clinician on our team and learned some concrete skills in solving his everyday life problems. While in therapy he completed homework assignments, including signing up for volunteer work through the a local non‐profit group working with animals, and working on daily living skills such as keeping his living space clean. Over the holidays (2009), he went to visit his family, from whom he had been estranged. In light of the strides he made in his recovery, he was able to rebuild healthy relationships with them, and eventually, his sister invited him to live with her. He has decided to go live with her (out of county), so we set up medication and case management services for him in her area. He has made incredible strides in only 9 months or so, and we are so proud of him. (Family Service Agency FSP)
In July of 2008, “T” was at very high risk of placement in residential care due behavioral needs and the lack of viable family placements known to her social worker. T’s behaviors included opposition, defiance, AWOLing, and verbal and physical aggression. Prior to involvement with Connections services, she had been in several placements—most recently two foster homes in as many weeks. At the start of Connections services and with the support of the Wraparound team, T moved back in with her maternal aunt with whom she had lived as a young child. Individual and family support services helped her to strengthen her relationship with her aunt. Plans regarding safety, prevention and early intervention were also created and implemented to ensure that her immediate needs were being met in her aunt’s home. Connections staff also worked with her on her ongoing needs, including emotional regulation, mood stabilization, developing and maintaining positive relationships, decreasing high‐risk behaviors (running away, substance abuse), and achieving academic, vocational, and recreational goals. By creating and supporting the stability of the placement with her aunt, the Connections team ensured that T could remain in her community and connected to family and natural supports. Eventually, Family Finding services were put in place. The team built the “genogram” (a tool to name family members and relationships) and utilized online searches to locate as many relatives as were known by T and her aunt. Through the searches, it was discovered that her mother had recently passed away and her brother had also passed away in a tragic incident. T’s team persisted in spite of slow progress and made strides to help T connect to as many people as possible within her natural ecology. Most recently, her father was released from prison and has begun to reconnect with her. He remains the sole surviving member of her nuclear family. This relationship is highly significant to her. In addition, over 10
Page 54 of 70

MHSA Five Year Report
other natural connections have been identified and several have been invited to join T’s team, including another aunt. This individual (different from the aunt with whom T was living) emerged as a significant support and has provided regular weekend respite care. Recently this aunt asked for T to move in with her ‐ instead of T being placed in a more restrictive placement out of San Francisco County—ensuring that T can remain in her local community and with natural supports. This has allowed T time to stabilize in this community and enroll with JobCorps in an effort to pursue vocational training and a high school diploma. With the support of Family Finding and intensive Wrap‐Around services, T has reconnected with family, remained in the home of her aunt and is now in the process of transitioning successfully to adulthood. (Seneca Center Connections FSP)
After his removal from home at age 2, “F” has bounced around numerous foster and residential care placements. His father is deceased and his relationship to his mother has been strained, as she is unavailable as a caregiver. F’s behavioral issues began upon entering the foster care system. His connections to immediate and extended family decreased over time as a result of his numerous hospitalizations, foster and residential placements, and school placements. In July 2008, F began receiving intensive Wraparound services from Seneca Center Connections in preparation for his step‐down from the San Francisco Community Treatment Facility (CTF). While at the CTF—where he had been placed for the previous 15 months—F’s team began the process of Family Finding and increasing his connections to immediate and extended family. Simultaneously, F’s team also supported his transition to the home of his biological mother. At the time of his step‐down, it was clear that he could benefit from Wraparound services as he continued to present with behaviors and needs including sexualized behaviors, impulsivity and difficulty with social awareness. In August of 2008 and after 12 years of F living in foster care, his mother graduated from her recovery program, obtained stable housing and was able to reunify with F. As well as focusing on placement stability and safety, the Wraparound team worked intensively with F and his mother develop coping skills to deal with his anxiety and symptoms of mood disorder, increasing family functioning and participation in their new community. Though the scope of these services are broad and addressed all the drivers to F’s presenting needs, key activities included reinforcing the use of support people in a child’s natural ecology like attending a church weekly and attending a breakfast for recovering women every morning. Furthermore, the team supported the family in advocating for F's education and provided psycho‐education regarding future academic supports and needs for the family. Since his move home, F has transitioned to a public school and has an IEP in the fall to discuss mainstreaming F into general classes. F enjoys playing basketball and is currently on a competitive team at the Salvation Army. F takes great pride in his accomplishments and enjoys sharing his interests with his mother. F’s mother is stalwart in her commitment to F and has met all her goals and maintained her stability for F. With the hard‐work, support and collaboration of F, his mother, the CTF, and Wraparound and Family Finding, F has successfully reunified with his mother, built a strong connection with her and is making long‐term plans for his future. (Seneca Center Connections FSP)
When Seneca Center first implemented the Family Finding service, “L” was among the first youth to benefit from this new approach to connecting youth with families. He was living at Seneca San Francisco Community Treatment Facility (CTF) and was deemed one of the loneliest teens at the facility. Though L has always been a kind‐hearted young man, at that time, his intense loneliness was driving a myriad of negative behaviors that greatly limited his ability to transition successfully into the community. In the summer of 2006, L’s treatment team located and contacted L’s paternal great‐uncle, who lived in Oregon. As soon as his great‐uncle heard about L, he offered any assistance needed. L’s treatment team, in partnership with his HSA worker, flew out to Oregon to meet and assess L’s family. L’s therapist discovered that
Page 55 of 70

MHSA Five Year Report
they were a “historical family”. Many great‐uncles, uncles, aunts, and numerous cousins were found and were eager to meet and reconnect with him. The treatment team visit was a success, which ultimately led to L’s first visit in September of 2006. Since then, David has traveled to Oregon several times, first with Seneca staff and then on his own, to meet and spend time with his family. Within a month of reconnecting with his family, L’s behaviors shifted dramatically. Though L’s behavioral challenges didn’t extinguish completely, as he became more connected with his family, his aggressive/self‐harming behaviors and extremely poor self‐esteem disappeared. It quickly became clear that there was a direct link between L’s behavioral challenges and his connectedness with his biological family. In fact, L’s behaviors shifted so much that he no longer needed the intensity of the CTF and moved to a foster home in 2008. He currently lives at this same home and has successfully transitioned into the community. Most recently, L’s Seneca Center Connections Care Coordinator met with L’s family to begin the process of developing transition plans that will best support his stability. Some of these tasks included reviewing what support resources would be available for L, where he would live and where he would attend college or work should he relocate to Oregon to be with his family. During this process, the Care Coordinator was struck by the abundant amount of love and sense of responsibility and protection that L’s family has toward him. This was apparent in how his Great Aunt and Uncle spent hours showing her pictures of L before the family was separated, and telling stories of L as a small child. The family also embodies and values doing “whatever it takes” to ensure L was receiving the best treatment and academic support possible by opening their home and telephone lines to countless Seneca support staff over the last two years. Throughout this process, L has visited his family regularly both on major holidays as well as during summers, including one trip lasting over 30 days. L’s ultimate goal is to move to Oregon once he turns eighteen to be with his family and with his birthday quickly approaching, his treatment team is working hard to make this a reality for L in August. It is clear that for L, it would be advantageous for him to join his family in Oregon, as their support is a huge factor in his success. L states that he belongs with his family, and this connection has made all the difference for him. (Seneca Center Connections FSP)
In February, “N” graduated from the Senior Full Service Wellness Program (SFSP), after having made enough progress that intensive services were no longer needed. She came to the program (FSA) two years ago. “I was born in Manila, a city girl,” N said. She came to the United States in 1973 with her two sons, “I wanted to have a better life for my children.” As a single mother, she describes having had a hard time raising two boys on her own. In 1991, when her mother died, N ran into more serious problems. Feelings of depression and sadness overwhelmed her, and she began to “collect things” and bring them back into the apartment that she shared with her son. Hoarding and cluttering behavior put them both at risk for eviction.
N recalled the trauma of sudden eviction, compounded by depression and isolation. “I was evicted and lost all of the things that were important to me – pictures of my parents, a stamp collection from my childhood, lots of things,” she said. Once homeless, her relationship with her son took a turn for the worse. “I could have killed myself, given up, but I didn’t,” N said. Instead, she began to maneuver the streets as best she could, alone. This was a frightening time for her. “I traveled to Reno on the night bus, so I could get a free place to stay and a shower,” she remembered. Her case manager, Liz, points out that N came up with impressive and creative strategies to stay safe. During the day, N sought the company of other Filipino seniors. Meeting at a local McDonald’s and a nearby senior center, she learned how to keep herself busy and in the protective company of trusted friends. At night, N rode buses on the night routes to stay warm and get sleep. N joined groups going on casino trips where she could be social with a supportive network of friends. It was also a good way to get sleep, get a cheap meal and enjoy a little entertainment.
Page 56 of 70

MHSA Five Year Report
Eventually, N was referred to FSA. She said, “Canon Kip tried to catch me, to help me, and finally they connected me to FSA. I met my first case manager, who helped me show up. I couldn’t believe they could open my case and help me, but they did.” She was experiencing depression, as chronic homelessness was taking its toll. “When I first met N, I will never forget her colorful clothing, an eclectic array of colors and textures. This vivid display, I would soon find out, was a clear indication of the vivacity that dwells deep inside her,” said Liz. N and Liz began to meet and establish rapport. Liz points out, “Many folks are weary of agencies and have been burned or disappointed in the past; it’s important to build a strong foundation of trust.”
The SFSP multidisciplinary team of outreach peers, clinical case managers, and a psychiatric nurse practitioner, the “Dream Team”, helped N begin to put the pieces of her life back together again. N recalled, “They helped me regain my identity, since I couldn’t prove my identity before, and FSA helped me get back on my feet.” Over time, SFSP and N worked together to get her stabilized in temporary and ultimately permanent housing, connect her to Social Security benefits and entitlements, obtain pertinent documentation for her residency status, and replace her lost “green card.”
Now, N lives in a lovely new apartment. Partially funded by MHSA funds, this housing provides on‐site case management and nursing services. N has found a home there. “You’re a princess there,” she told Jon‐David Settell, SFSP program director. With a new outlook on life, N’s depressive symptoms diminished significantly. Where she used to collect items and bring them into her home, now she is sorting through her things and sharing them with people in need. Significantly, N has reestablished her relationship with her son, who is an important source of love and support to her.
In describing her experience as a graduate of the FSP, she said, “I felt like a winner, since I was the only one graduating. Everybody was glad I made it.” She now will receive low‐intensity case management through Geriatric Outpatient Services at FSA, to help monitor her overall health and provide her with extra supports in the future, should she need them. As our (FSA’s) first graduate, N deserves a round of applause. (Family Service Agency FSP)
We had a client who was once a very successful musician but had lost everything to his Bipolar Disorder
and drug addiction. Over the years, his case manager and employment specialist helped him get all the things necessary to re‐engage with his music. We helped him budget and save money for a new instrument, get new teeth in order to properly play the instrument, find and audition for bands and eventually join several bands and perform in local venues, as well as maintain safe and permanent housing. This client continues to struggle with his substance use, but we believe his connection to music and the clinic has helped keep him from completely decompensating and returning to the streets. We continue to maintain caring hope for him and all our clients during both their ups and downs. (Citywide Forensics FSP)
“Q” was not an eager or engaged client. I first met him in jail. At the time, he was paranoid and angry.
He had spent much of the past three years in and out of jail on a variety of charges, convinced he would never end the cycle of release from jail, relapse and re‐arrest. He had been through several programs and was not optimistic that any treatment program could help him and was participating in the FSP only because he was mandated by the court to do so. He resented being forced into it.
Q's original goals were simply to stay out of jail for a year. He wanted to rekindle his relationship with his girlfriend and celebrate Christmas as a free man. Other than that he had no immediate plans.
The wrap‐around services of case management, housing and support provided by the FSP program allowed Q to acclimate slowly to treatment and set the pace on his own personal recovery process. His progress was slow, uneven, and at times frustrating. Some parts of his recovery came easier than others, but he kept working at improving his life. The fact that he could count on the support and stability of FSP services was a major factor in his recovery trajectory.
Page 57 of 70

MHSA Five Year Report
Q has now been out of jail for more than two years. He has stable housing and currently lives with his long‐time girlfriend. Although he still struggles with substance abuse and mental health issues, the quality of his life has improved dramatically.
Q reports being happy with his new life and is glad that he no longer spends part of the year living in jail. He is now trying to create a new identity for himself and is starting to set long‐term goals. Although he still experiences difficulties, Q is starting to believe that his life is worth living. His newfound sense of optimism and hope is a product of his own resiliency and the services offered by the FSP program and its staff. (Citywide Forensics FSP)
“K” is a 58 year old, African American single male originally from the East Coast. He has been diagnosed
with schizophrenia paranoid type and poly substance dependency, and has a history of incarcerations and of hearing voices dating back to 1973.
In 2007, K was referred to Citywide from SF County Jail for intensive case management. At that time, he was a new resident to SF County, and, prior to his arrest, had not successfully linked with any other mental health services. K successfully graduated from Behavioral Health Court (BHC) in 2008.
When we first started to working together, K presented with severe auditory hallucinations and delusional thought content regarding his body being infested with parasites and other beings. These symptoms prevented him from performing Activities of Daily Living (ADLs) such as tying shoe laces or putting on clothes each morning.
Since being linked with Citywide, K has not picked up any new criminal charges, and has stabilized with medication support, intensive case management that includes permanent housing, and supportive employment. His original treatment goals were to engage in treatment with Citywide and attend groups. K worked one stipended position at Citywide and another with San Francisco General Hospital. K also completed a 6‐week computer class and a 3 month intensive janitorial training program with HireAbility. K is actively meeting with his employment specialist and engaging in a search for additional work experience. (Citywide Forensics FSP)
Page 58 of 70

MHSA Five Year Report
HOUSING HOUSING SERVICE PARTNERSHIPS
Housing is another critical support service that was funded by CBHS, initially for Full Service Partnership clients only. “Housing First” is a repeated refrain among MHSA staff, the assumption being that all other supportive services (ongoing medical and behavioral health care, financial supports, employment, etc.) are more easily and consistently accessed once the client is stably housed. San Francisco is one of the most expensive housing markets in the U.S., so MHSA supported housing initiatives are fundamental to clients’ recovery here. In FY06‐07, 20% of the Full Service Partnership budget was carved out to fund short‐term stabilization and permanent housing units. A Request For Proposal was let for the Housing Service Partnership (HSP) to seek interested agencies willing to master lease and provide housing application and retention supports to the Full Service Partnerships. However, only one agency, serving transitional aged youth, responded to the Request For Proposal for HSP and was consequently awarded the contract to provide eight units of permanent housing. In the absence of other responders, the HSP for the Adult and Older Adult populations were assigned to the Department of Public Health’s Housing and Urban Health (HUH), a unit charged with contracting and master leasing buildings for housing for the entire Department of Public Health. In the first year, 20 single room occupancy (SRO) hotel units were contracted for permanent housing. HOUSING AVAILIBILITY AND ACCESS
The greatest challenge in San Francisco is in finding affordable and safe housing within a reasonable time frame. For most programs, finding permanent and affordable housing for their clients is an arduous and sometimes unsuccessful task that requires extensive collaboration with housing agencies, such as Housing and Urban Health’s (HUH) Direct Access to Housing (DAH) program, and property management companies like Tenderloin Neighborhood Development Corp (TNDC).
In the first year, the transitional age youth (TAY) HSP was allowed a start up period of three months to locate viable housing sites. A site was identified in the outskirts of the Tenderloin area, but the proximity to drug transactions rendered the site unsafe and made it harder for clients to remain in recovery.
“We have formal partnerships with Larkin Street Youth Services and Tenderloin Neighborhood Development Corp for housing our clients, but we have had great difficulty finding housing that works for everyone. There are not enough spots, they are located in impoverished, drug filled neighborhoods, and they are not always sensitive to our clients needs….For the clients that do qualify for housing and are comfortable in SROs, it has been successful. We are able to provide wraparound services when our clients are in housing with our housing partners.” (FSA ADULT+TAY FSP)
Finding an agreeable site for housing took nearly two years before the programs and the HSP agency settled on various shared housing sites well away from the Tenderloin District. Permanent housing sites were finally leased in established middle class neighborhoods of Richmond, Excelsior, and North Beach.
Page 59 of 70

MHSA Five Year Report
Yet there still exists a clear gap in appropriate housing resources for youth. Transitional Age Youth and those with 290 (sex offense) convictions are the most difficult to place.
“We need more scattered housing … Putting these youth in a SRO in a hotel where they are not ready for independent housing has caused some of our youth to fail in housing programs…The challenge in finding and maintaining housing is we do not have a continuum of different levels of care. We do not have appropriate housing for clients who are just coming out of a children’s locked facility or group homes.” (CBHS TAY FSP)
As the Adult and Older Adult FSPs started enrolling clients, it became apparent that the majority of clients were not able to move quickly into permanent housing for a variety reasons. Housing applications require valid proof of San Francisco residency, such as a CA Resident ID card, client income, and housing histories. Securing a CA Resident ID involves obtaining a birth certificate from the state where the client was born. However, years of homelessness and unattended mental issues often prove to be a barrier to obtaining these documents. Some clients, who were born outside of the United States, have no documentation to prove legal entry into the U.S. Emergency stabilization single‐room occupancy hotels give clients a relatively stable place to establish 3 to 6 months of SF residency while acquiring the necessary documentation to obtain birth certificates and general assistance. Beginning with the second year, emergency stabilization units were retained along with permanent housing. An equal number of permanent housing units were brought on board in the second year in anticipation of first year FSP enrollees who would be transitioning from emergency stabilization units. In many cases, availing of these temporary emergency housing options has worked well for TAY and adult clients. But when the maximum stay of 90 days requires they move on, clients sometimes have few alternatives but to return to temporary shelters. One program describes the process this way:
Our housing process works as follows: a homeless client who is referred to our program is immediately given the option of a stabilization unit, funded by MHSA, or, if no room is available, a room for the week until such room becomes available, with the cost of the room paid either through our flex funds or through the client’s income, depending on each client’s individual circumstances. It should be noted here that not all clients are willing to move from the streets to temporary housing; those clients are supported as necessary through street‐based interventions aimed at preparing them for the transition to housing. Once a client is housed in a stabilization unit, the client and the clinician work together to identify potential fits among permanent housing opportunities. Once several potential fits are identified, the client and the clinician work together to complete applications and interview processes. For most of our clients, this process eventually results in permanent housing. For those of our clients with 290 convictions (sex offender), however, there are few options for making use of MHSA subsidies for housing, because of the exclusion of sex offenders from any housing that receives federal funding. These clients “maxed out” their time in stabilization units, and have now moved to private rooms, the rent of which takes up ¾ of their monthly income. We do not consider these housing transitions to be successful, sustainable, or long‐term. (FSA OLDER ADULT FSP)
APPLICATION PROCESS
When available permanent housing is identified, clients then must “qualify”, a bureaucratic process requiring extensive documentation, visits, interviews, and time to process, all of which can be intimidating and discouraging to clients who have little or no documented housing histories and are working on recovery from
Page 60 of 70

MHSA Five Year Report
serious mental illness and possibly substance addiction. FSP programs work intensively to support clients through this process, which can take several months. When clients are included and supported in the process, it can be very empowering for them.
“Clients seem to succeed with finding better housing when case managers are actively involved in the process and are available to provide support to both the client and the hotel staff. Preemptively explaining any past incidents on their criminal background checks and evictions and explaining how things are different now that client is in treatment has proven to be helpful.” (CITYWIDE FORENSICS FSP)
Unfortunately, being declined for housing after the difficult, time‐consuming application process can be an “unexpected failure” that requires additional support and navigation for the FSP case managers. Establishing clear expectations at the outset has helped mitigate disappointing outcomes. HOUSING SERVICE PARTNERSHIP UTILIZATION Despite the challenges encountered by both programs and clients, the Housing Service Partnership utilization data indicates overall successful transitions for all TAY, Adults, and Older Adults. Transitional Age Youth (TAY)
MHSA FUNDEDFY
06‐07FY
07‐08FY
08‐09FY
09‐10TOTAL Housed
Total Days Stay
Avg. Length of
StayMinimum Days Stay
Maximum Days Stay
Permanent Housing 5 7 11 9 32 9,185 287 15 1197Emergency Stabilization Rooms ‐ ‐ ‐ 11 11 683 62 18 222
TAY FSP HOUSING# of Clients
In FY06‐07, 21% of TAY FSP clients (5/24) were housed exceeding CBHS’s stated goal of 20% but was short of the contracted number of units of eight. In FY07‐08 14% were housed (7/51) and in FY08‐09, 19% were housed (11/58). In FY09‐10, the emergency stabilization rooms contracted through Housing and Urban Health were opened up to TAY clients, driving the utilization rate higher. The average length of stay in permanent housing was less than one year. Reasons cited for moving out of permanent housing were: (1) moving out of State or County or moving in with family [n=4]; (2) moving into independent living on client’s income [n=3]; (3) incarceration [n=1]; and (4) deported to country of origin [n=1]. Adults
MHSA FUNDEDFY
06‐07FY
07‐08FY
08‐09FY
09‐10TOTAL Housed
Total Days Stay
Avg. Length of
StayMinimum Days Stay
Maximum Days Stay
Permanent Housing 4 19 10 4 37 17,103 462 24 1,099 Emergency Stabilization Rooms 35 75 47 42 199 23,786 120 120 714
ADULTS FSP HOUSING# of Clients
Page 61 of 70

MHSA Five Year Report
In FY06‐07, 47% of clients were housed, exceeding the stated goal of 20% by a wide margin. Utilization of emergency stabilization rooms was significantly higher making it evident that the emergency stabilization rooms were the appropriate placements for adult FSP clients. In FY07‐08, an equal number of permanent and emergency stabilization units of 21 each opened up more opportunities for housing. Reasonable accommodations were put in place to allow the FSP Personal Service Coordinator (PSC) to advocate for his/her client especially regarding their clients’ criminal histories. Efforts to accelerate approvals of applications in FY07‐08 for permanent housing through reasonable accommodations resulted in 19 clients being permanently housed, and 75 availed of the emergency stabilization rooms. Several changes took effect in FY08‐09. Housing and Urban Health had contracted two sites for permanent housing, 10 units at one site and 11 at the other, and both sites managed by the same property owner. One of the sites receives Section 8 HUD funding, locally administered by the San Francisco Housing Authority. Federal regulations governing resident selection trumps all local requirements, thus access to some permanent housing units were very restrictive, particularly pertaining to criminal, and eviction histories. The other site was completely full because the property management’s requirements were relatively lax compared to the Housing Authority. This was complicated by the fact that the other site experienced a high turnover rate because of behavior issues and serious felonies. Reasons cited for the high turnover rate were: (a) death [n=3]; (b) abandonment of unit [n=1]; (c) eviction for nuisance, destruction of property and unspecified reasons [n=4]; (d) transfer to a higher level of care [n=1]; (e) incarceration [n=3]; (f) moved to other housing or living independently [n=2]; (g) voluntary surrender [n=7]. Voluntary surrender was an option given to clients who are at high peril of eviction to avoid having an eviction on their record. As a result, all applications were then directed towards filling the vacancy at the Housing Authority site. Because of past criminal histories, nearly all of the FSP clients could not qualify at this site. Another significant dynamic was the limitation of FSP slots for all age groups. Without clear graduation criteria, slots could not be opened, thus limiting the number of clients who could be referred to permanent housing and emergency stabilization rooms. And with high turnover and low acceptance rates at CBHS’s contracted sites, the FSP programs had to find alternative housing elsewhere, leaving a large number of vacant units at the contracted sites. Other clients opted to convert their stabilization rooms to permanent housing. Under these circumstances, 10 FSP clients were permanently housed and 47 were admitted in the emergency stabilization units in FY08‐09, and in FY09‐10, four FSP clients were permanently housed and 42 were admitted into emergency stabilization units. Older Adults
MHSA FUNDEDFY
06‐07FY
07‐08FY
08‐09FY
09‐10TOTAL Housed
Total Days Stay
Avg. Length of
StayMinimum Days Stay
Maximum Days Stay
Permanent Housing ‐ 3 12 1 16 9,509 594 247 849Emergency Stabilization Rooms 11 23 6 8 48 5,608 117 6 364
OLDER ADULTS FSP HOUSING# of Clients
In FY06‐07, negotiations for a permanent housing site for Older Adults fell through. Nevertheless, 11 clients were able to stay at the emergency stabilization SRO hotels. In FY07‐08, Housing and Urban Health contracted for five permanent housing units at one site. Three successfully moved in by fiscal year end and 23 moved into emergency stabilization units (ESU). In FY08‐09, the first MHSA Housing Program opened 10 units for tenancy in November 2008, and the majority of the 11 clients who moved into this permanent housing building
Page 62 of 70

MHSA Five Year Report
transitioned from ESUs. In addition, six clients were approved for ESUs. The same dynamic noted in the Adult housing utilization occurred with Older Adults, that is, the limitation of FSP slots and its consequence. In FY09‐10 only one client moved into permanent housing, leaving one contracted unit still to be filled, and eight moved into ESUs.
MAINTAINING RESIDENCE
Once clients are housed, maintaining their residency can be a challenge. Clients may relapse and/or have behavioral or money management problems. Most supportive services operate during regular business hours, and some programs reported a need for better trained, 24‐hour support on site to deal with crises and relapse. Involvement and collaboration of all parties—the client, MHSA provider, and housing management—is the overarching theme. In order to maintain their housing, clients are advised and supported in what they need to know in terms of expected behaviors and possible repercussions if not followed.
“Challenges have included frustration with the requirements and process of getting clients into DAH housing, the location of most hotels in the Tenderloin, and the condition of many of the stabilization units…at times, a client’s behavior or unwillingness to continue to pay rent interferes with maintaining housing.” (HYDE STREET FSP) “I think it is incredibly important to be organized and very clear from the beginning what the expectations are for the clients’ behavior. In the past we have had difficulty maintaining clients in housing because of problematic behaviors. Now, we are sure to have meetings in which all the expectations are clearly outlined, and we respond quickly when these expectations are not met. This has gone a long way in setting limits and helping all our clients to feel safer in their housing.” (FSA ADULT+TAY FSP)
In addition to reporting a need for more 24 hour coverage in supportive services, programs have also observed “the need for culturally sensitive, respectful, and truly supportive building management staff.” It was reported that some property management staff were taking action that suggested a lack of understanding about residents with serious mental illness, particularly seniors. On‐site staff people who are genuinely capable and willing to support the client in a way that is recovery‐focused and neither punitive nor threatening, is key to clients’ residential stability. Permanent housing is not always a viable outcome, unfortunately, but here’s how one program worked with that limitation:
Utilization of FSP Stabilization and Permanent Housing Programs has been successfully getting some chronically homeless clients housed. One client joined our program with a very long history of homelessness and little interest in being housed. Client was housed in an FSP stabilization bed, where the case manager worked closely with client to follow all rules of the hotel and maintain up keep of his room. Client was unable to qualify for permanent housing beds and the county made the decision to turn his stabilization unit into a permanent bed. Client has been living in the same place for years now and is more engaged in treatment and stable than he has ever been. (CITYWIDE FORENSICS FSP)
Key to maintaining stable residence for FSP clients is keeping open and honest communication between FSP case managers and on‐site staff, identifying early warning signs of client decompensating behavior that threatens their housing and putting in place the appropriate supports in a timely way.
Page 63 of 70

MHSA Five Year Report
LACK OF VIABLE HOUSING OPTIONS
Not surprisingly, limited access to stable and appropriate housing is the greatest impediment to client recovery and reveals a limitation to MHSA funding in San Francisco, due in part to the extremely high cost of housing. Of particular concern are the inappropriate housing alternatives for Transitional Age Youth in areas of high crime and drug traffic, and the especially thorny issue of clients with prior sex offenses being barred from most housing opportunities, keeping them in shelters and on the streets. Programs have implemented several strategies to address housing difficulties: use of blended funds, gaining face‐to‐face contact wherever clients are, including streets and shelters, and finding placements in private (but more expensive) housing.
THE RECOVERY MODEL IN MHSA HOUSING
An underlying philosophy of the Recovery Model in MHSA is the movement toward integration of people with mental illness into the community with supports for recovery. Recovery embodies a vision of the person as a being capable of healing, wellness, engagement and social integration, provided s/he is appropriately supported. MHSA tries to fund the supports designed to facilitate client recovery where they are, bringing them steps closer to wellness, through any door available and doing “whatever it takes”. This may include connecting clients to financial supports, getting into safer or permanent housing, supporting efforts to gain and maintain employment, as well as prevent relapse. In the Recovery Model, the guideline of client‐driven care is sometimes brought into conflict with provider/stakeholders’ priorities as professionals working in mental health. The reality of the Recovery and integration services vision in the every day lives of clients can look pretty messy on the ground. In its worst form, unintended effects of implementation can hinder client recovery. On the one hand, client‐driven care optimizes autonomy in decision making, a relatively recent development in the care of people with serious mental illness, with a goal of greater client self‐esteem and self‐sufficiency. Clients are encouraged to set treatment and life goals, with their providers, then supported to work toward those goals at a pace and in a manner with which s/he is comfortable. For example, client‐driven care can mean the client sets a goal for stable housing, but it can also mean s/he decides not to take medications prescribed for a diagnosed condition. Providers are trained to respect and incorporate client decisions and work with them. On the other hand, client autonomy sometimes comes into conflict with other important parameters that health workers must consider: 1) client disturbance of community norms, and 2) clients acting against their own best interests, as viewed by professions.
POLK SENIOR HOUSING The Governor’s Homeless Initiative allocated $400 million statewide of MHSA funds to finance the capital costs associated with development, acquisition, construction and/or rehabilitation of permanent supportive housing for individuals with mental illness and their families, especially including homeless individuals with mental illness and their families, and is widely referred to as the MHSA Housing Program. In San Francisco, $9M was directed to the California Housing Finance Agency (CALHFA) for housing development, as required by DMH. The MHSA Housing Program opened an opportunity for CBHS to partner with the Mayor’s Office of Housing to fill a funding gap for a senior housing development. At Polk Senior Housing, CBHS was able to set aside 10 units for MHSA clients. Completed in November 2008, Polk Senior Housing became the first housing development to have been funded by the MHSA Housing Program. Eleven (11) MHSA FSP clients moved into 10 brand‐new studio units complete with kitchen and bathroom, on‐site support and nursing service, and continued case
Page 64 of 70

MHSA Five Year Report
management provided by the FSP personal service coordinator. CBHS, through its partnership with the Mayor’s Office of Housing have several projects in the pipeline which are scheduled for tenancy in the coming years, opening up dozens of units dedicated to MHSA clients. Polk Senior Housing was designed to meet a crucial need in San Francisco by serving 109 low‐income senior (55+) households. Fifty units, administered by the San Francisco Direct Access to Housing (DAH) program, are dedicated to seniors who have been homeless or are at risk of homelessness. Of these fifty units, 10 units are reserved for MHSA Full Service Partnership (FSP) clients. These units differ from MHSA Stabilization units in that they provide an opportunity for permanent housing, and there is a high level of supportive services, including primary care, available on‐site. Many key players have collaborated to form this innovative project. The integrated services team consists of on‐site and off‐site program staff. The on‐site team, contracted by DAH to Lutheran Supportive Services (LSS), includes case managers and a supervisor. This group is supplemented by a civil service public health nurse from San Francisco’s Community Health Network. The team provides the Polk Senior Housing community with a full range of on‐site services and linkages to off‐site resources such as community‐building events and educational opportunities, information and referrals to local social services, health management support, case management, and crisis prevention and intervention. In addition to the on‐site services, the 11 MHSA seniors are provided with recovery and treatment services by FSP staff at Family Service Agency’s Senior Full Service Wellness Program (SFSWP), the Full Service Partnership for Older Adults, and the staff from Hyde Street Community Services Clinic. Finally, DAH maintains a contract for property management with the Tenderloin Neighborhood Development Corporation (TNDC) for rent up (the rental application and approval process), lease management and building maintenance. Community Behavioral Health Services (CBHS) and DAH work collaboratively to provide oversight to the project. On‐site support services are available Monday through Friday between 9:00am and 5:00pm. The property manager maintains a residential unit on‐site but does not typically stay there and is not on duty during the weekends. In urgent situations, Full Service Partnership staff are available on‐call 24 hours to help clients deal with problematic situations. Problematic behavior can surface and be recognized in a variety of ways. The client may be the first to identify their own risky or problem behavior and seek access to services. In these instances, clients raise their concerns with the on‐site staff (public health nurse, an LSS staff person), or with their FSP case manager. In other instances, the property manager may identify a concern about a resident and may first communicate the concern directly to the resident or speak with LSS staff. TNDC’s expectation is that LSS will follow up with the resident to avert instances in which problematic behaviors may escalate to become possible lease violations. Five lease violations will trigger eviction procedures, according to the lease agreement. Evaluation Project The MHSA evaluation team at CBHS is in the process of conducting an extensive evaluation of the Polk Senior Housing project. For the evaluation, the public health nurse, the property manager and supervisor from TNDC, and two LSS supervisors, were all interviewed in early spring of 2010. In May 2010, the team convened a focus group of FSP case managers who have clients residing at Polk Senior Housing, specifically for the evaluation. Residents who agreed to be contacted were interviewed in June and July 2010 as part of the effort. In addition, the MHSA Coordinator at CBHS contributed observations to the evaluation. Following is a summary of some preliminary findings.
Page 65 of 70

MHSA Five Year Report
WHAT WORKS AT POLK SENIOR HOUSING High Quality Services The on‐site supportive services team is highly regarded by both the residents who were interviewed and by the FSP case managers. Lutheran Support Services, along with the public health nurse, practice a “team approach”, with open communication with each other, the client, and the FSP case managers. Respondents report that the team provides sensitive, timely and appropriate follow up with case managers, seeks out clients who have not been seen within 24 hours, provides psychosocial support, creates community meeting events, and facilitates linkages to care, transportation and community support services. In general, the residents and the FSP case managers praised the on‐site team as being attentive, supportive, and responsive to the residents’ needs. Security Residents appreciate how safe they feel in the building after many years of living as homeless persons. Among the specific features that enhance their feeling of safety, residents mentioned that they like that the front door is locked and monitored, and people cannot easily walk in off the streets; that disruptive behavior of residents or guests is not tolerated, and offending guests may be asked by property management to leave the premises; and that disruptive residents may receive a lease violation from property management. Facilities In addition to feeling secure in the building, residents enjoy the amenities of independent apartment living, such as private bathrooms and a full kitchen to store their own food, and prepare and eat their meals. One client expressed gratitude that she has a quiet place to live and interact with others only when she chooses to. She appreciated the privacy and solitude. Another resident mentioned that the location is convenient to most of what she needs in terms of shopping and activities. REMAINING CHALLENGES AT POLK Weekend and Evening On‐site Support Lacking During non‐business hours, skilled staff are not immediately available to assist residents when problems arise. One desk person monitors the door 24 hours a day, but this person is not sufficiently trained to handle significant behavioral problems that can escalate into psychiatric or other types of emergencies. FSP case managers are available on‐call, but little support exists on‐site. Conflicting Perspectives Property management’s priorities focus on the safety and security of the building. Mental health workers emphasize client well‐being. These two perspectives need not, and often do not, conflict. However, one instance of conflicting perspectives played out in the case of a resident who stores a considerable amount of her belongings at Polk Senior Housing. Property management became concerned about an increasing level of clutter and its impact beyond the unit (pests, inappropriate use of common space, for example). Supportive Services viewed the situation as non‐cluttering, and perceived that property management was overstepping their bounds. Property management wanted assurances that the situation was being addressed to their satisfaction but expressed doubt that the problem was taken seriously. Differing objectives (in this case, high standards of cleanliness versus sensitive understanding of residents’ needs), caused miscommunication and misunderstandings and suggested a need for a shared vocabulary and better working relationships. Protected Health Information The flow of information about clients cannot be bi‐directional between TNDC and LSS when the information consists of protected health information. The on‐site social workers may not share specific psychiatric or medical
Page 66 of 70

MHSA Five Year Report
information with the property management staff without client consent, abiding by privacy laws under HIPAA and other regulations. Without this context for residents’ behavior, property management may not have a clear understanding of these behaviors. TNDC staff could potentially misinterpret behaviors, reacting punitively, rather than with a supportive approach in line with MHSA guidelines. Limited Access to Shared Space Every client interviewed wondered why several community spaces were not accessible for residents. Use of common areas such as the group kitchen, ground floor courtyard, upper floor common balcony where space was designed for a community garden are off limits to residents, except under supervision by on‐site staff. One resident wondered why the staff were able to access the courtyard seemingly “whenever they wanted,” but residents “who live here,” are not. TNDC and LSS staff cited concerns about residents gathering without supervision, in case a behavioral problem erupted. All group activities appear to be organized and supervised by LSS staff. Residents are not provided large group space nor encouraged to organize gatherings informally. Residents expressed deep concern about this issue and felt it reflected a lack of respect or trust on the part of on‐site staff.
CONCLUDING REMARKS The supportive services team at Polk Senior Housing is essential for the MHSA funded residents to live independently in the community. While the on‐site team performs well, the contrast with off‐hours support is evident. Outside emergency services must handle escalating problems which could be averted with skilled night and weekend staff. The residents describe Polk Senior Housing repeatedly as their “home”, they enjoy their private living spaces, and feel safe from the outside world. Residents had mixed interest in socializing with others, but all felt disturbed about the lack of access to common areas, especially those outside (courtyard/garden and balconies). Open communication between all stakeholder parties has begun to ameliorate tensions and needs to develop further to ensure an on‐going conversation with all stakeholders, in order to foster the well‐being and long term stability of residents.
Page 67 of 70

MHSA Five Year Report
SUMMARY OF FINDINGS The Mental Health Services Act, legislated in January 2005, was envisioned to expand and enhance the current public mental health system. In order to do so, the Act was written to extend existing funding beyond treatment services to prevention and early intervention; workforce development education and training; capital facilities; information technology; and innovative programming. Community Services and Supports was the first to be rolled out in FY2005‐2006 and the Full Service Partnerships, is a CSS service track intended to deliver a comprehensive array of services and supports to individuals with serious mental illness or children with serious emotional disorders who are new to the system or whose needs are not being met. Data from the implementation of the Full Service Partnerships has shown great promise, in terms of the improvement in the lives of people served and in the delivery of services. Below are the highlights, lessons learned and next steps/future actions towards continuous program improvement.
HIGHLIGHTS OF THE FSP PROGRAMS
• Client Outcomes: Implementation of MHSA services in San Francisco has shown to improve the quality of life of Full Service Partnership clients in several domains (reductions in arrests and other emergencies, time spent in restrictive settings, and increases in safer and more stable living situations).
• Advanced Recovery: Some clients are achieving “advanced recovery” according to the Milestones of
Recovery Scores (MORS), and may be ready to step down to less intensive services. • Residents at Polk Senior Housing feel “safe” and are connecting to high quality services available on‐site.
• Consumer and family member employment has increased system wide.
• Inter‐agency collaboration has improved. • FSP Data Collection and Reporting (DCR): San Francisco is in the forefront of California counties in
generating output reports for quality and outcomes from the State’s FSP data repository called the DCR, and using these reports to improve FSP services.
• Data Reports: Providing detailed and aggregate data has both motivated FSP programs about their data
and informed providers about their clients.
LESSONS LEARNED
• Cultural Competence: Although all FSP programs report adherence to cultural competency expectations,
they and partner agencies may not have the capacity to serve the clients’ diverse cultural and linguistic backgrounds. The FSP programs have some linguistic reach but that reach may not accurately mirror their own client populations.
• Advanced Recovery: As increasing numbers of clients with time in FSP treatment reach levels of recovery
that suggest a need to reduce their access to intensive levels of services, it seems imperative to outline a
Page 68 of 70

MHSA Five Year Report
protocol for “stepping down” services or graduating existing clients, and opening up FSP slots to new clients with greater and more urgent need.
• MHSA funding has its limitations. Finding viable and affordable housing in safe neighborhoods has
proven to be a challenge for our housing partners. Well‐conceived efforts but poor coordination of care can create confusion about the roles and responsibilities of each of the parties and the consequent tensions resulting from these unclear and undefined roles can serve as a barrier to promoting clients’ wellness and recovery.
• Peer Employment: Efforts to include consumers and family members in all facets of implementation
brought some unexpected challenges. The FSP programs describe the challenges in supervising staff, ensuring that they have very clear instructions and are closely supervised. Programs also report that peer staff relapses can impede long‐term retention. Supervision is a challenge. A downward economy and reducing budgets add to these challenges.
• DCR Data Access: Accessing the FSP data through the DCR system has required immense resources from
IT and Research and Evaluation staff at CBHS, and ongoing demand for these resources will continue.
• DCR Outcome Data: The outcomes as collected and reported from the DCR are dependent on the providers staying current and complete in entering their clients’ Key Events throughout treatment. Incomplete KET data collection can go undetected until detailed inspection of clients’ case notes can be performed.
NEXT STEPS/FUTURE ACTION
• One positive change within Community Behavioral Health Services is the development of a new programming structure called the Integrated Full Service Organizations (IFSOs). The main objective of IFSO is to restructure the delivery of behavioral health services system‐wide so that each site is able to provide a continuum of service from the most intensive level of care to outpatient care, promoting CBHS’s “Any Door is the Right Door” policy. With the implementation of IFSO, CBHS aims to eliminate silos and instead promulgate an integrated and comprehensive behavioral health specialty care throughout the City, in keeping with the tenets of MHSA.
• A more in‐depth examination of MHSA Housing, including Polk Senior Housing, will help CBHS
understand more completely the benefits and challenges to clients’ housing stability and behavioral health recovery.
• Partnership Analysis: It would be helpful to understand what precipitates a client changing FSP
Partnership status from “Active” to “Unable to Locate” or “Partner Left Program”. It may prove worthwhile to work with the FSP programs to define a protocol that would minimize clients lost to follow up.
• Substance Use: With the integration of substance use treatment into behavioral health services, it is
important to understand how implementation of this change has played out within the FSP programs, and assess its effectiveness.
Page 69 of 70

MHSA Five Year Report
• Outcomes Results: DCR data completion rates could be improved if we can cross‐check KET reporting in the DCR with similar data already captured in existing systems in San Francisco (such as arrests, PES and Crisis Interventions, as well as housing), and this effort would better inform programs as to the well being of their clients and program performance.
• Outcomes Analyses: It would be highly informative to view outcomes by domain, broken out by years in
program, so that the “effects” of FSP treatment can be seen longitudinally for Year 1, Year 2, Years 3, for example, and potentially demonstrate the long‐term effectiveness of FSP programs.
MHSA funding provides an extraordinary opportunity for San Francisco to fundamentally transform and enhance its behavioral health service delivery. This report offers a window into some of the efforts carried out under MHSA’s Community Services and Supports component, specifically the FSPs and the San Francisco‐specific housing initiatives.
BIBLIOGRAPHY
Cal. Code Regs., title 9, div.1, ch.14. Authority cited: Section 5898, Welfare and Institutions Code. <http://www.dmh.ca.gov/Laws_and_Regulations/docs/Readopt_Final_2007Apr30.pdf> HealthVote.org. “Mental Health: Facts & Analysis”. Web. 13 June 2010.
<http://www.healthvote.org/index.php/facts_analysis/C26> CA Department of Mental Health. "DMH Letter No. 07‐06 ‐ Initial Planning Estimates for Mental Health Services
Act Housing Program". 14 May 2007. 24 June 2010 <http://www.dmh.ca.gov/DMHDocs/docs/letters07/07‐06.pdf> Felton, M.C., Cashin, C.E., and Brown, T.T., “What Does it Take? California County Funding Requests for
Recovery‐Oriented Full Service Partnerships under the Mental Health Services Act”. Nicholas C. Petris Center on Health Care Markets and Consumer Welfare. 19 August 2010. <http://www.petris.org/Docs/Felton_WhatDoesItTake.pdf>
Page 70 of 70