five-year evaluation of habitat remediation in thunder bay
TRANSCRIPT

FHs
JJa
b
c
d
e
f
a
ARRAH
KALHRS
1
m
(((k
h0
Fisheries Research 183 (2016) 275–286
Contents lists available at ScienceDirect
Fisheries Research
journa l homepage: www.e lsev ier .com/ locate / f i shres
ive-year evaluation of habitat remediation in Thunder Bay, Lakeuron: Comparison of constructed reef characteristics that attract
pawning lake trout
. Ellen Marsden a,∗, Thomas R. Binder b, James Johnson c, Ji He c, Natalie Dingledine d,anice Adams e, Nicholas S. Johnson f, Tyler J. Buchinger f, Charles C. Krueger b
Rubenstein Ecosystem Science Laboratory, University of Vermont, 3 College St., Burlington, VT 05401, USADepartment of Fisheries and Wildlife, Michigan State University, 480 Wilson Rd., East Lansing, MI 48824, USAMichigan Department of Natural Resources, Alpena Fishery Research Station, 160 East Fletcher St., Alpena, MI 49707, USADLZ Michigan, 1425 Keystone Ave., Lansing, MI 48911, USAMichigan Department of Environmental Quality, 2100 West M-32, Gaylord, MI 49735, USAU.S. Geological Survey, Great Lakes Science Center, Hammond Bay Biological Station, 11188 Ray Rd., Milllersburg, MI 49759, USA
r t i c l e i n f o
rticle history:eceived 4 February 2016eceived in revised form 9 June 2016ccepted 11 June 2016andled by George A. Rose
eywords:rtificial reefake troutabitatestorationpawning
a b s t r a c t
Degradation of aquatic habitats has motivated construction and research on the use of artificial reefs toenhance production of fish populations. However, reefs are often poorly planned, reef design character-istics are not evaluated, and reef assessments are short-term. We constructed 29 reefs in Thunder Bay,Lake Huron, in 2010 and 2011 to mitigate for degradation of a putative lake trout spawning reef. Reefswere designed to evaluate lake trout preferences for height, orientation, and size, and were comparedwith two degraded natural reefs and a high-quality natural reef (East Reef). Eggs and fry were sampledon each reef for five years post-construction, and movements of 40 tagged lake trout were tracked duringthree spawning seasons using acoustic telemetry. Numbers of adults and spawning on the constructedreefs were initially low, but increased significantly over the five years, while remaining consistent onEast Reef. Adult density, egg deposition, and fry catch were not related to reef height or orientation of theconstructed reefs, but were related to reef size and adjacency to East Reef. Adult lake trout visited andspawned on all except the smallest constructed reefs. Of the metrics used to evaluate the reefs, acoustictelemetry produced the most valuable and consistent data, including fine-scale examination of lake troutmovements relative to individual reefs. Telemetry data, supplemented with diver observations, identifiedseveral previously unknown natural spawning sites, including the high-use portions of East Reef. Reef
construction has increased the capacity for fry production in Thunder Bay without apparently decreasingthe use of the natural reef. Results of this project emphasize the importance of multi-year reef assessment,use of multiple assessment methods, and comparison of reef characteristics when developing artificialreef projects. Specific guidelines for construction of reefs focused on enhancing lake trout spawning aresuggested.© 2016 Elsevier B.V. All rights reserved.
. Introduction
Loss of critical habitat is widely recognized as one of theost important variables affecting stability of natural populations
∗ Corresponding author.E-mail addresses: [email protected] (J.E. Marsden), [email protected]
T.R. Binder), [email protected] (J. Johnson), [email protected]. He), [email protected] (N. Dingledine), [email protected]. Adams), [email protected] (N.S. Johnson), [email protected] (T.J. Buchinger),[email protected] (C.C. Krueger).
ttp://dx.doi.org/10.1016/j.fishres.2016.06.012165-7836/© 2016 Elsevier B.V. All rights reserved.
(National Research Council, 1992; Benaka, 1999). In aquatic envi-ronments, critical habitat is often associated with nearshore areasthat are vulnerable to on-shore pollution and sediment depositionresulting from human activities such as agriculture and industry.The attraction of fishes to coral or rocky habitat, whether for feed-ing, shelter, or spawning, and damage to habitats in coastal watershas motivated the use of artificial reefs to replace these habitats
and to restore fish populations (Bassett, 1994; Benaka, 1999; Baine,2001; McLean et al., 2015).Artificial reefs can be used as a management tool to solve theproblem of a reduction in the amount or quality of essential habi-

2 s Rese
ttHowvPofiosdswmutc
psopaibtp
fd2aueb1sbaMa1H1ysie
rcaltMiitvrltm1c
76 J.E. Marsden et al. / Fisherie
ats (Baine, 2001). Artificial reefs may increase abundance of fisheshrough improved recruitment and survival, or increased growth.owever, poor reef design or planning can result in under-user have undesirable consequences such as aggregating fish in aay that makes them more vulnerable to predators or fishery har-
est (Carr and Hixon, 1997; Grossman et al., 1997; Bortone, 1998;ickering and Whitmarsh, 1997). Reef construction should be basedn prior data on habitat characteristics that will benefit the targetsh species, either by providing refuge for adults, eggs, or larvae,r habitat for their prey. If these characteristics are not well under-tood, then the reef design should include first an evaluation ofifferent reef habitat characteristics of natural reefs before con-truction (Bassett, 1994; Baine, 2001). Reefs must also be locatedhere the target species is likely to find them, such as near existingigratory corridors or nearby natural habitats. Artificial reefs are
sually constructed to help one particular species, but are likelyo provide benefits to non-target species, and consequently haveommunity-level effects.
In freshwater lakes, rocky substrates with interstitial spaces arearticularly valuable habitats, as they provide a three-dimensionaltructure and refuge for benthic organisms and the eggs and larvaef spawning fishes (McLean et al., 2015). Interstitial spaces providerotection from the physical forces associated with wave and icection and from large-bodied predators and, if free of decompos-ng organic material, provide ideal habitat for incubation of eggs ofenthic-spawning fishes. Among species that use such habitats inhe Laurentian Great Lakes, lake trout (Salvelinus namaycush) are ofarticular concern.
Lake trout were extirpated from the main basins of the lowerour Great Lakes by the 1960s, largely due to overfishing and pre-ation by sea lamprey (Petromyzon marinus; Krueger and Ebener,004; Muir et al., 2014). U.S. and Canadian federal, provincial, state,nd tribal agencies are committed to restoring self-sustaining pop-lations of lake trout to the Great Lakes (e.g., GLFC, 2011). Thesefforts began with sea lamprey control in the late 1950s, extensiveasin-wide stocking of hatchery-reared juvenile lake trout in the960s, and regulation of commercial and sport harvest. Evidence ofpawning by stocked fish has been extensive in most of the lakes,ut until recently little evidence of sustained recruitment to age-1nd older has been observed except in Lake Superior, western Lakeichigan, and at three sites in Lake Huron—South Bay, Parry Sound,
nd Thunder Bay (Anderson and Collins, 1995; Cornelius et al.,995; Elrod et al., 1995; Eshenroder et al., 1995; Hansen et al., 1995;anson et al., 2013; Holey et al., 1995; Johnson and VanAmberg,995; Reid et al., 2001). Because lake trout stocked as fingerlings orearlings survive and grow well to maturity, the impediments touccessful lake trout reproduction likely occur between spawningn fall and emergence of fry from spawning reefs in spring (Brontet al., 2007).
The role of habitat degradation or loss in the failure of lake troutestoration in the Great Lakes is not clear. Lake trout spawn onobble-rubble substrates with deep interstitial spaces; locationsdjacent to a steep drop-off appear to be particularly attractive,ikely because Venturi-effect currents reduce sediment depositionhat may suffocate eggs (Ellrott and Marsden, 2004; Fitzsimons and
arsden, 2013; Marsden et al., 1995a,b). Deep, offshore spawn-ng habitats are distant from sedimentation sources and humannfluences, but nearshore habitats, where most documented lakerout spawning historically occurred (Marsden et al., 1995b), areulnerable to deposition processes such as silt or sawdust as aesult of changes in nearby landscapes. For example, the col-apse of lake trout populations in Lake Champlain by 1900, in
he absence of commercial fishing pressure, may be attributed toassive deforestation and subsequent lake-wide siltation in the800s (Ellrott and Marsden, 2004). Stocked lake trout use nearshoreonstructed habitats such as breakwalls extensively for spawning
arch 183 (2016) 275–286
(Fitzsimons, 1996; Marsden and Chotkowski, 2001; Marsden et al.,1995a,b; Peck, 1986). Whether this habitat use is a consequenceof some combination of limited natural habitat, loss of habitat dueto degradation, or simply attraction to available good substrates,the intentional addition of cobble substrates as spawning sites(Marsden et al., 1995a) or unintentional addition as breakwalls inharbor areas (Peck, 1986) has effectively increased the amount ofavailable spawning habitat. However, the relative contribution ofnatural versus artificial reefs to recruitment of lake trout or otherharvestable species such as lake whitefish (Coregonus clupeaformis)in the Great Lakes has not been evaluated. Likewise, the character-istics of artificial reefs that make them attractive to spawning laketrout and result in successful egg incubation have not been quan-titatively assessed. In this study, we evaluated whether spawninglake trout were attracted to different designs of constructed rockreefs and compared spawning activity and fry production at thosereefs to high quality and degraded natural reefs, over five yearspost-construction. If the quantity or quality of spawning habitat islimiting recruitment in the Great Lakes or elsewhere, then a bet-ter understanding of optimal reef configurations will enhance reefhabitat design, construction and evaluation.
The project was focused in the northwestern portion of Thun-der Bay, Lake Huron (Fig. 1). Past collection of unclipped (wild)young-of-year and post-yearling fish indicated natural reproduc-tion by lake trout in Thunder Bay has occurred since at least asearly as 1984 (Johnson and VanAmberg, 1995). Aggregations ofspawning lake trout, including unclipped fish, were found at Misch-ley Reef near the entrance to Thunder Bay in 1991–1993 (Johnsonand VanAmberg, 1995). Suppression of sea lamprey (Petromyzonmarinus) populations and increased control of fisheries harvestssubstantially improved lake trout survival to maturity after 2000,and collapse of alewife (Alosa pseudoharengus) after 2004 increasedsurvival and recruitment of lake trout fry (Riley et al., 2007; Johnsonet al., 2015). As of 2012, over 50% of lake trout less than age-8 inwestern Lake Huron were wild origin. Continued progress towardrehabilitation of lake trout populations in Lake Huron depends onmaintenance and improvement of natural reproduction.
The goal of the reef construction project was to increase recruit-ment of lake trout in Thunder Bay by mitigating the putativedegradation and loss of spawning habitat. The goals of our post-construction monitoring study were to (1) determine whether laketrout would use the newly constructed reefs and, if they did, howlong it would take for the fish to find and use the reefs, (2) identifycharacteristics of the new reefs that attract lake trout (height, ori-entation, and size), and (3) compare spawning on the new reefsrelative to the natural (degraded and unaffected) reefs nearby.Specifically, our objectives were to (1) evaluate changes in the den-sity of lake trout eggs and fry on 29 newly constructed reefs over fiveyears, relative to two natural, low-quality reefs, and one natural,high-quality reef (East Reef), and (2) evaluate relative attraction ofconstructed reef characteristics (height, orientation, size, and age)to spawning lake trout. We hypothesized that
(1) lake trout will recognize the constructed reefs as suitablespawning habitat and colonize them within five years of con-struction;
(2) the degree to which the constructed reefs are used by spawn-ing lake trout will depend on the physical characteristics of thereefs (e.g., total area, height, and orientation); and
(3) the addition of constructed reefs will increase overall fryproduction in Thunder Bay, as opposed to simply attracting
spawners away from existing spawning areas.Our approaches provide useful lessons for those assessing otherlarge-scale aquatic restoration projects and inform the construction

J.E. Marsden et al. / Fisheries Research 183 (2016) 275–286 277
F d CKDt r arra
oe
2
2
tlSdwsdtiwbvosnrtiiaRasRMn(aa
Rri
ig. 1. Bathymetric map of study area within Thunder Bay, Lake Huron. The CEM anhe Cement and CKD reefs. The dotted line indicates the area of the acoustic receive
f additional reefs in the Great Lakes and other nearshore aquaticnvironments.
. Methods
.1. Study area and reef construction
Historically, lake trout spawning in Thunder Bay was presumedo occur on two parallel, shallow, natural reefs, approximately 1 kmong by 0.5 km wide, approximately 0.7 km apart, and oriented NW-E (Fig. 1). In the 1950s, a cement plant stockpiled cement kilnust (CKD) on the shoreline and much of this material washed oras blown into the lake, resulting in substantial infilling of inter-
titial spaces on the eastern reef, now called CKD Reef. Furtheregradation of the site appears to be unlikely due to stabiliza-ion of the on-shore CKD pile in 2002; however, materials alreadyn the lake have hardened and consolidated. Cement Reef, to the
est, is of similar size, elevation, and configuration, but has noteen affected by deposition from the CKD pile. However, diver sur-eys in 2009 indicated that this reef also has substantial infillingf sediments, resulting in sub-optimal conditions for attraction ofpawning lake trout and retention and incubation of eggs. We doot know whether this infilling is of recent origin, perhaps as aesult of materials deposited during harbor dredging; however,his reef appears to be a low quality, potential lake trout spawn-ng site. In 2009, we located an area of dense cobbles and boulders,n patches of varying sizes, some estimated to be as large as 35 m2,long the eastern edge of Thunder Bay, 0.6 km from the tip of CKDeef. Maritime archeologists believe many of these piles of rocksre either cribs used to anchor rafts of logs during a period of inten-ive logging in the 1800s, or spoils from dredging the Thunder Bayiver entrance and Alpena Harbor in the late 1800s (Wayne Lusardi,DNR Thunder Bay National Marine Sanctuary, personal commu-
ication). We named the dense central portion of this area East ReefFig. 1). During the course of the current study we further defined
region of high lake trout activity (the Hotspot) and low lake troutctivity (the Coldspot) within East Reef.
To mitigate for loss of presumed spawning substrate on CKDeef, new reefs were constructed adjacent to the CKD and Cementeefs. Use of artificial reefs has raised concerns about toxins leach-ng from man-made construction materials, siting reefs distal to
lines of constructed reefs are shown on the lower portion of the map, parallel withy. * symbol is the Rend, a 87 m wooden ship wrecked in 1917.
existing spawning aggregations, and attraction of fish to areaswhere mortality, particularly from fishing, may be high (e.g.,Pickering and Whitmarsh, 1997; Baine, 2001). To address theseconcerns, the reefs were constructed of natural materials (locallimestone rock, rather than concrete or other man-made materi-als), adjacent to known spawning habitat, in an area protected fromlake trout harvest during the spawning season. To emphasize thispoint we refer to the reefs throughout this paper as constructedrather than artificial. Multiple reefs were constructed in a replicateddesign that allowed quantitative comparison of lake trout spawn-ing density, egg incubation, and fry hatch relative to orientation,height, and size over time. Reefs were designed based on evalua-tion of natural spawning reefs used by lake trout, i.e., cobble reefswith deep interstitial spaces and a steep contour (Marsden et al.,1995b). Annual spawning (i.e., egg density) and fry abundance onthe adjacent natural reefs were compared before (two years) andafter (five years) reef construction. Locations of adult lake troutin Thunder Bay (Fig. 1) were determined using acoustic telemetryafter reef construction over a three-year period.
Thirty-three reefs were constructed between 2010 and 2011,using angular crushed limestone from a nearby quarry, sortedinto 64–256 mm size range (cobbles on the Wentworth scale;Wentworth, 1922). Rocks were placed by a barge with a crane, usingGPS coordinates. Eight small ‘pilot’ reefs were constructed in 2010;each reef was approximately 9 m in diameter at the base, 2.4 macross at the top, and 2.5–3 m high (Table 1). In summer, 2011, 24large reefs were constructed in two lines of 12 reefs each, paral-lel with and offshore from the Cement Reef and CKD Reef (Fig. 1).Each reef was 23 m long × 7 m wide at the base and 18 × 2.4 m atthe top, to maximize the edge:area ratio (Fig. 2). Each line of reefsincluded three replicates of a height x orientation design, in whicheach replicate consisted of four reefs, a pair of 1.5 m and 3 m highreefs oriented NW-SE, and a second pair oriented NE-SW (Fig. 3).Four of the small reefs constructed in 2010 were incorporated intothe reefs built in 2011 and the remaining four (Reefs B, D, E, G) wereunchanged, resulting in 29 final reefs. The two lines of reefs werenamed for the adjacent natural reef (CEM Line near the Cement
Reef, and CKD Line near the reef degraded with CKD) and numberedfrom north to south. An additional large reef, named Lafarge, wasconstructed at the outer end of the CKD reef line from left-over reefmaterial, with final dimensions of 90 m long, 7 m wide at the base,
278 J.E. Marsden et al. / Fisheries Research 183 (2016) 275–286
y, Lake
aiibR
2
dEoc2(ooapltbwwd
2
2ou
TRrR
Fig. 2. Schematic of short and tall reefs constructed in Thunder Ba
nd 1.5 m high (Table 1). Annual post-construction diver surveysndicated that little change in reef configuration has occurred, andnterstices have not begun to fill in with sediments. High-resolutionathymetric data were collected on the finished reefs, and on Easteef.
.2. Sampling design overview
Pre-construction sampling of lake trout eggs and fry was con-ucted in fall 2009 and spring 2010 at the Cement Plant, CKD, andast reefs (Fig. 1). Post-construction data collection commencedn the small reefs in fall 2010 and spring 2011 and on the entireonstructed reef array (29 reefs) in fall 2011. In each year after009, sampling occurred on East Reef, one of the two degraded reefsCement or CKD, alternated each year), two of the small reefs, andne complete replicate of four reefs (tall and short in each of tworientations) in each line. Lake trout eggs were sampled each fall,nd lake trout fry were sampled each spring. Lafarge Reef was sam-led every year from 2012 to 2014. In fall 2012 through 2014, adult
ake trout movements were monitored using positional acousticelemetry in the study area. Although the egg and fry collectionegan before adult lake trout were tracked with telemetry, heree present methods and results in a biological sequence startingith the location of adult lake trout based on telemetry and then
escribe the location of eggs and fry based on traps.
.3. Acoustic telemetry
Forty lake trout were tagged with VEMCO V16-4H (68 mm long,4 g in air; Vemco, Halifax, N.S. Canada) acoustic transmitters tagsn Oct. 12 or 23, 2012. Tags were programmed to transmit aniquely coded signal at random intervals between 170 and 310 s,
able 1eef characteristics and construction schedule in Thunder Bay, Lake Huron. Dimensions oeefs are per individual reef and are based on post-construction mapping rather than deeef and the Hotspot and Coldspot areas, and indicate the areas used for calculation of ac
Reef type Reef name(s) # of Reefs
Natural East Reef 1
Natural Hotspot Reef 1
Natural Coldspot Reef 1
Constructed—small B, D, E, G 4
Constructed—medium CEM 1- CEM 12 12
Constructed—medium CKD 1- CKD 12 12
Constructed—large Lafarge 1
Huron. Reefs are pictured in cross-section across their short axis.
with a battery life of three years. Lake trout were collected in gill-nets comprised of two panels each of 114, 127, 140, and 152 mmstretch mesh multifilament nylon, 1.8 m high set by the Michi-gan Department of Natural Resources near East Reef. Our intentwas to tag equal numbers of each sex. Fifteen females (mean totallength ± 1 SD 71.3 ± 5.2 cm) and 25 males (mean total length ± 1SD 71.3 ± 9.5 cm) were tagged on Oct. 12 (four fish, all male) andOct. 23 (36 fish). Five of the females (33%) and 13 of the males(52%) were hatchery fish, the remainder were wild fish. Only laketrout larger than 55 cm (presumed to be mature) were selectedfor tagging. Only “green” unspawned females were tagged. Laketrout were anesthetized in a solution of 0.8 ml l−1 of a 1:9 cloveoil:ethanol solution, then a 2–3 cm incision, parallel to the longaxis of the fish, was made in the ventral surface just posterior tothe pectoral girdle using a sterile scalpel. The tag was inserted byhand and moved posterior to the incision. Incisions were closedwith two to three simple interrupted 2-0 monofilament sutures,fish were placed in fresh water, and released after they regainedequilibrium. All fish were released 1.4 km west of the CEM reefs, sothat fish, if they returned to East Reef, would pass across or near toboth lines of constructed reefs.
Twenty-seven VR2W acoustic receivers were deployed in thenorth-eastern portion of Thunder Bay and organized as a VEMCOPositioning System (VPS) array with overlapping detection rangesfor calculation of two-dimensional positions of each fish (hyper-bolic positioning, Smith, 2013). Receivers were deployed prior tothe spawning season and retrieved as late as weather permitted,mid to late November. Receivers were deployed from Sept. 26 toNov. 27 in 2012, Sept. 6 to Nov. 16 in 2013, and Aug. 14 to Nov. 24
in 2014.For statistical analysis of lake trout position data, we definedpolygons around each of the constructed reefs and East Reef
f the constructed reefs are measured at the base of each reef; areas of constructedsign dimensions. Areas of natural reefs are based on fine-scale bathymetry of Eastoustic telemetry position densities.
Reef Year constructed
Area (m2) Dimensions (m)
52,575 – –15,441 – –6506 – –80 each 9 diam., 3 h 2010214 each 7 w, 23 l, 1.5 or 3 h 2011214 each 7 w, 23 l, 1.5 or 3 h 2011647 7 w. 90 l, 1.5 h 2011

J.E. Marsden et al. / Fisheries Rese
Fs
(iaatHaEowRpbpfu
ocoutl
design criteria, fry CPUE (number of fry per trap per day) were log-
ig. 3. Schematic of constructed reef layout in Thunder Bay, Lake Huron (not tocale). Shaded reefs are 3 m high, unshaded reefs are 1.5 m high.
Table 1). Polygons around the constructed reefs extended approx-mately 2.5 m around the basal outline of each reef, taking intoccount the probability that a fish within this distance was movingdjacent to and therefore in association with the reef. Based on ini-ial observation of the data, we also defined polygons around theotspot and Coldspot portions of East Reef; fine-scale bathymetrynd diver observations showed that these areas, similar to all ofast Reef, are dense regions of scattered rock mounds. The numberf fish detected and the number of individual fish positions per fishithin each polygon were counted using programming language. We first evaluated the number of fish that visited each reef as aroportion of the number of fish in the array each year. The num-er of positions for each fish on each reef were then divided by theolygon area of each reef to standardize the data among the dif-
erently sized reefs. The number of positions m2 for each fish wassed to evaluate lake trout ‘interest’ of each reef.
Relative attraction to constructed reef characteristics (height,rientation, and size) in each year of the study was evaluated byomparing the proportion of fish detected, and the mean numberf positions per unit area among the four reef configurations (i.e.,
nique height and orientation combinations; see Fig. 2). Mean posi-ions m2 for each configuration were compared statistically usinginear mixed models (one for each year). Within each line (CEMarch 183 (2016) 275–286 279
and CKD), the three replicates for each configuration were aver-aged for each fish to produce a single mean value for each fish andconfiguration combination. These values were the dependent vari-able in the models (number of observations = number of fish × 4reef configurations × 2 reef lines). Height, orientation, line (CEM orCKD), and interactions between line and height and line and orien-tation were fixed effects in the mixed models, and tag identificationnumber was a random effect in the mixed models (i.e., 3-factorrepeated measures ANOVA design). Data were log-transformed toimprove normality. Linear mixed models were constructed usingthe R Package ‘lme4’ (Bates et al., 2015), and P-values and degreesof freedom were calculated using the Scatterthwaite approxima-tion, implemented in the R package ‘lmerTest’ (Kuznetsova et al.,2015).
Repeated measure ANOVAs (one for each year; R Package ‘stats’;R Core Team, 2015) were used to determine the relative attractive-ness (number of positions per unit area) of our constructed reefscompared to the natural spawning reef (i.e., Hotspot). Activity onindividual reefs in the CEM and CKD lines for each fish were pooledto create a single value for each fish and reef line combinationand position data were log-transformed to improve normality. Thedependent variable in the models was the total number of positionsper unit area for each fish on each reef. Fish identification numberwas the repeated measure (i.e., random variable) in the models.Where a significant reef effect was observed in the ANOVA, aTukey’s multiple comparisons test (R Package ‘multcomp’; Hothornet al., 2008) was used to identify which reefs differed significantlyfrom one another.
2.4. Lake trout egg sampling
Lake trout eggs were sampled using surface-deployed egg traps(Riley et al., 2011) and diver-deployed egg bags (Perkins andKrueger, 1994). Egg bags were set in lines along the top of eachreef, parallel to the long axis of each reef, near the edge; prior workindicates that egg deposition is focused near the edge of a con-tour break (Ellrott and Marsden, 2004; Marsden et al., 1995a,b). Eggtraps were set on top of and partially down the sides of each reef;location of the traps varied, as deployment from the surface wasdifficult to control exactly. Egg bags were set in late summer andsurface traps were deployed in mid-October; all gear was retrievedin mid to late November, after the peak of spawning activity. Eachyear, we sampled four reefs on each of the CKD and CEM lines, twosmall reefs, Lafarge Reef, either CKD or Cement Reef, and East Reef.Ten egg bags were used on East Reef, and 10 were used on eitherCKD or Cement Reef; five egg bags were used on the small reefs andreefs in the CKD and CEM lines. Surface-deployed egg traps wereset in gangs of ten traps per reef.
2.5. Lake trout fry sampling
Fry were sampled using modified surface-deployed passive frytraps (Marsden et al., 1988); traps were a steel mesh cone, 73 cmdiameter at the base and 22 cm high, with a capture bottle at thetop held in place with a steel collar. Traps were deployed as soonas the area was ice-free in spring, and were checked for fry everytwo weeks until early June (2011, 2013, 2014) or mid-May (2010,2012, 2015). Ten traps were placed on each sampled site exceptfor the small reefs, where five traps were used. In each year, asubset of reefs was sampled with fry traps, similar to the subsetsampled using egg collecting gear. To determine if significant dif-ferences in fry captures occurred among years, reef lines, and array
transformed and compared using an ANOVA (R Package ‘stats’) withyear, reef line (CEM or CKD), orientation, and height as independentvariables. Where a significant year effect was identified, a Tukey’s

2 s Research 183 (2016) 275–286
tsauo
3
3
resaOaOfiawfis2iOsto(
etidboopwtp
drmwr
AttE9Ha
e(Pffiat
Fig. 4. Number of acoustically tagged lake trout detected per day within the studyarea in each year of the study. The period of receiver deployment spans the interval
80 J.E. Marsden et al. / Fisherie
est (R package ‘stats’) was used to identify which years differedignificantly. We compared the aggregated fry CPUE from the CEMnd CKD constructed reefs with fry CPUE from East Reef each yearsing a paired t-test; catches on the other natural reefs were zero,r the reefs were not sampled.
. Results
.1. Acoustic telemetry
All 40 lake trout were detected in 2012 on a line of acousticeceivers located at the entrance to Thunder Bay (THB line, Haydent al., 2014, http://data.glos.us/glatos), confirming post-surgeryurvival and movement. Four fish were subsequently caught bynglers—one female in June 2013 and three males in July 2014.ne tagged fish died on the East Reef Hotspot in 2014 two yearsfter tagging and was excluded from the analysis during that year.f 36 fish that were detected within the array in 2012, twenty-onesh (17 males, 3 females) had more than 100 positions within therray within the first two days after tagging. Fish that left the arrayithin a day of tagging or had fewer than 100 positions within therst two days were presumed to be behaviorally affected by theurgery and were not included in subsequent analyses for 2012. In013, 22 fish (17 males, 5 females) were detected in the array, and
n 2014, 16 fish (14 males, 3 females) were detected in the array.f the forty fish tagged, twelve fish (8 females, 4 males) left the
tudy area within a day after tagging and were never detected inhe area again, eight fish (4 females, 4 males) were detected only inne year, six fish (all males) were detected in two years, and 14 fish3 females, 11 males) were detected in all three years of the study.
Arrival into the study area and peak of lake trout activity werearlier in 2014 than in 2013 (Fig. 4). Because most fish were notagged until Oct. 23 in 2012, we cannot be certain when activ-ty began that year; the number of females detected at the siteecreased for the first five days as tagged females left the area,ut the number of male detections peaked on Nov. 7. The numberf fish detections in 2013 began to increase on Oct 13 and peakedn Oct. 26. In 2014, fish activity began to increase on Oct. 1, andeaked Oct. 12 (Fig. 4). Most tagged fish had left the study areahen the receivers were retrieved in 2012 and 2014, but in 2013
he receivers were removed early and most tagged fish were stillresent in the area (Fig. 4).
The majority of positions in our array were confined to areasefined by our reef polygons, i.e., most positions were on the natu-al or constructed reefs. No additional areas of focused activity by a
ajority of fish were noted outside our polygons; however, a ship-reck (the ‘Rend’) situated between the two lines of constructed
eefs was visited frequently by one fish (tag 511) every year.The most highly visited area in all three years was East Reef.
ll fish detected over the three-year study spent time each year onhe Hotspot, with the exception of one fish that was not detectedhere in 2012 (Fig. 5a). Most lake trout positions were located onast Reef (72–97% of all reef-associated positions in each year), and2–98% of all positions on East Reef were located on the East Reefotspot. Therefore, the rest of East Reef was excluded from furthernalysis and comparisons were focused on the Hotspot.
The number of fish that visited the constructed reefs increasedach year. Among the constructed reefs, the small, isolated reefsreefs B, D, E, G) were visited by the fewest fish each year (Fig. 5a).ercent of fish detected on at least one of the small reefs ranged
rom 9.5% to 27.2% of all fish detected in the array, while percent ofsh detected on Lafarge Reef ranged between 57.1% and 81.3% ofll fish detected in the array (Fig. 5a). The greatest improvement inerms of percent of fish that visited the constructed reefs occurredbetween the first and last datum each year. Lake trout detected the day they weretagged were omitted from the graph, as these detections may be biased by post-surgery recovery behavior.
on the CEM and CKD lines, which rose from 19% and 42% in 2012 to69% and 81% in 2014.
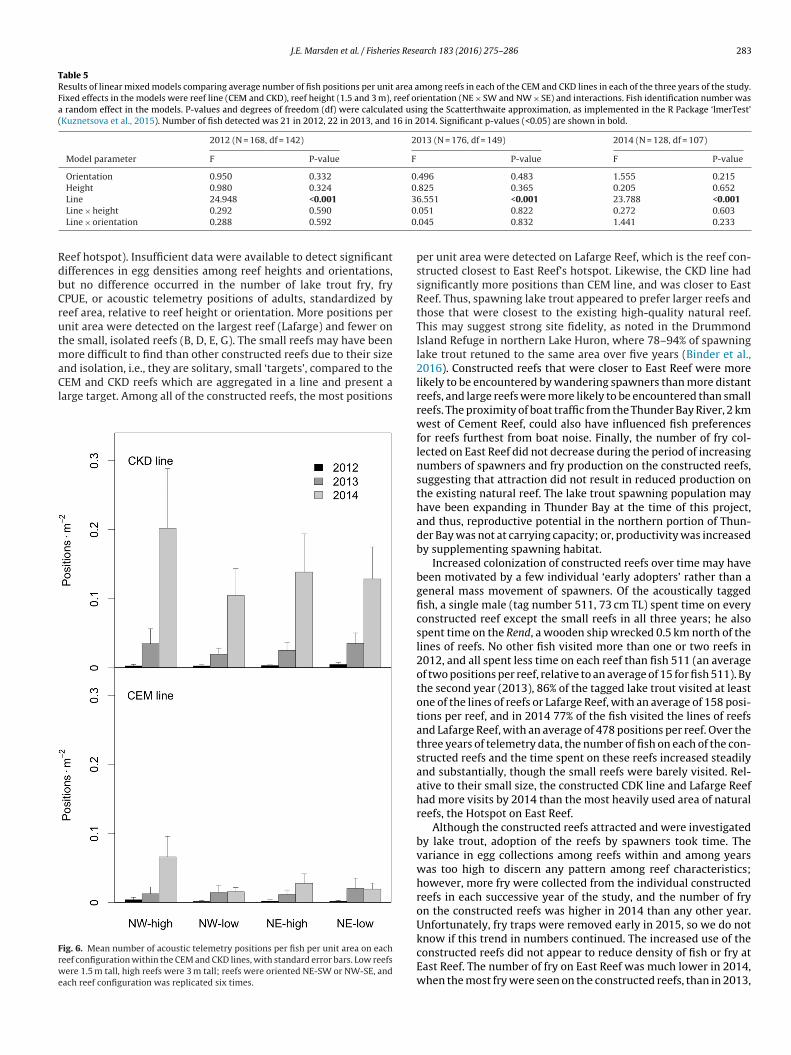
Mean number of positions per fish on the constructed reefs alsoincreased over time, but was fairly consistent among years on thenatural reefs (Fig. 5b). In general, fewer positions per unit areaoccurred on the constructed reefs than on the East Reef hotspotin each year of the study. However, differences in mean number ofpositions per unit area declined over the three years of telemetryobservations, as more fish began to adopt the constructed reefs assites to investigate and potentially spawn over (Fig. 5b). Notably, by2014, mean number of positions per unit area on both Lafarge Reefand the CKD line did not differ significantly from that on the EastReef Hotspot (Table 4). The CEM line consistently had lower meannumber of positions per unit area than the CKD line, but owing tohigh variability on the CKD line (Fig. 5b), the difference was statisti-cally significant in only 2012 (Table 4). Neither the CEM line nor thesmall, isolated reefs reached levels of activity observed on the EastReef hotspot (Table 4). Among reefs in the CEM and CKD lines, laketrout showed no apparent preference for reefs of a specific heightor orientation (Fig. 6 and Table 5); however, a significant line effectoccurred in the model between the CEM and CKD lines (Fig. 6 andTable 5).
3.2. Egg deposition
Among the natural reefs, eggs were consistently collectedin egg bags each year on or near the hotspot on East Reef
−2 −2
(4.7–156 eggs m ), only three eggs (0.38 eggs m ) were collectedin an egg trap on Cement Reef in 2011, and no eggs were collectedon CKD Reef (Table 2). Among constructed reefs, no eggs were col-lected on any of the small reefs (Reefs B, D, E, and G) during the five
J.E. Marsden et al. / Fisheries Research 183 (2016) 275–286 281
F per lar ron in
yclep32r
TEm
ig. 5. Percent of acoustically tagged lake trout (a) and average number of positionseef (East Reef and its sub-sections, Hotspot and Coldspot) in Thunder Bay, Lake Hu
ears of monitoring. No eggs were collected from the two lines ofonstructed reefs in the year they were constructed (2011), but allines of reefs sampled had eggs each year thereafter. Numbers ofggs collected on the lines of reefs were small (1–12 eggs per reefer year, 1.4–25.5 m−2) with two exceptions; in 2012 there were
0 (84.9 eggs m−2) eggs sampled on the low, NE-SW reefs and in015 there were 36 (51.5 eggs m−2) sampled on the high, NW-SEeefs (Table 2). Egg traps were less effective at collecting eggs thanable 2gg collections using surface egg traps and diver-deployed egg bags. Numbers represent
2. Egg bags were not used in 2010; egg traps were not used in 2015. ND indicates no co
Gear type Reef 2009 2010 2011
Egg bags East ND ND 110 (155.6Egg bags CKD 0 ND 0
Egg bags Cement 0 ND ND
Egg bags B, D, E, G – – 0
Egg bags NE high – – 0
Egg bags NE low – – 0
Egg bags NW high – – 0
Egg bags NW low – – 0
Egg bags Lafarge – – ND
Egg traps East 42 (23.2) 0 0
Egg traps CKD 0 0 ND
Egg traps Cement 0 0 3 (0.38)
Egg traps B, D, E, G – 0 0
Egg traps NE high – – 0
Egg traps NE low – – 0
Egg traps NW high – – 0
Egg traps NW low – – 0
Egg traps Lafarge – – ND
ke trout per unit area (b) detected on each of the constructed reefs and the natural 2012–2014.
diver-deployed egg bags; eggs were collected in only four of 35 site-years with egg traps (in which a single reef sampled in one year isone site-year), relative to 20 of 35 site-years in which eggs werecollected in egg bags. In every year in which eggs were collected intraps, they were also collected in egg bags. In late October 2010 a
severe storm generated 3-m waves within the bay; this storm mayhave dislodged eggs from reefs and traps.total eggs in all egg bags; numbers in parentheses are the total number of eggs perllections at the site, “–” indicates reefs were not yet constructed.
2012 2013 2014 2015
) 2 (4.7) 2 (4.7) ND 104 (186.4)ND 0 ND 0ND ND 0 ND0 0 0 03 (6.1) 1 (0.6) 5 (10.1) 1 (2.9)30 (84.9) 1 (0.6) 12 (25.5) 3 (4.3)1 (1.4) 3 (1.7) 7 (14.1) 36 (51.6)1 (1.4) 2 (3.5) 5 (8.7) 2 (3.2)ND ND ND ND0 0 0 ND0 ND ND NDND 0 0 ND0 ND ND ND0 0 0 ND0 0 0 ND3 (0.92) 0 0 ND48 (22.1) 0 0 ND0 ND 0 ND

282 J.E. Marsden et al. / Fisheries Research 183 (2016) 275–286
Table 3Lake trout fry collections on each reef or reef configuration in Thunder Bay using fry traps. Numbers are the total fry in all fry traps on each reef, except for the CKD and CEMlines of reefs, for which total fry are summed among six replicates of each reef configuration (height × orientation). Reefs were oriented NE-SW (‘NE’) or NW-SE (‘NW’); highreefs were 3 m and low reefs were 1.5 m tall. Number and proportion of individual reefs sampled in the CEM and CKD lines on which fry were collected is shown in the lastline. Numbers in parentheses are number of fry per trap-day. ND indicates no collections at the site, “–” indicates reefs were not yet constructed. Years in which fry trappingended in mid-May rather than early June are indicated with an asterisk.
Reefs 2010* 2011 2012* 2013 2014 2015*
East 14 (0.04) 3 (0.004) 47 (0.07) 127 (0.22) 47 (0.11) 4 (0.01)CKD 0 0 ND 0 ND NDCement 0 ND 0 ND 0 0B, D, E, G ND 1 0 0 0 1 (0.01)NE high – – 0 1 (0.001) 25 (0.03) 9 (0.03)NE low – – 1 (0.001) 1 (0.001) 9 (0.01) 9 (0.02)NW high – – 3 (0.004) 0 44 (0.05) 14 (0.03)NW low – – 0 2 (0.002) 14 (0.02) 10 (0.02)Lafarge – – 2 (0.004) 1 (0.002) 17 (0.04) 4 (0.01)# (%) reefs with fry – – 3 (38%) 4 (50%) 8 (100%) 7 (88%)
Table 4Results of repeated measures ANOVA analysis comparing average number of positions per fish per unit area among constructed reefs and a natural reef (Hotspot) in ThunderBay, Lake Huron, in each of three years (2012–2014). CEM and CKD refer to two lines of constructed reefs; B, D, E, and G were small constructed reefs, and Lafarge was alarge constructed reef. Values in parenthesis are the statistical results from the ANOVA models, and tabulated values are the subsequent post-hoc inter-reef comparisons(Tukey’s multiple comparisons tests). Tag identification number was the repeated measure (i.e., random factor) in the ANOVA models. N = 21, 22, and 16 in 2012, 2013, and2014, respectively. Significant p-values (<0.05) are shown in bold.
Reef comparisons 2012 2013 2014(F4,80 = 18.772, p < 0.001) (F4,84 = 17.0022, p < 0.001) (F4,60 = 16.701, p < 0.001)
z-statistic p-value z-statistic p-value z-statistic p-value
B, D, E, G vs. CKD −2.967 0.025 −5.452 <0.001 −5.762 <0.001B, D, E, G vs. CEM −0.043 0.917 −1.344 0.663 −4.211 <0.001CEM vs. CKD −2.124 0.210 −4.108 <0.001 −1.551 0.529Hotspot vs. CKD 4.754 <0.001 1.692 0.439 1.932 0.300Hotspot vs. CEM 6.878 <0.001 5.800 <0.001 3.483 0.004Hotspot vs. Lafarge 3.400 0.006 3.918 <0.001 2.000 0.266Hotspot vs. B, D, E, G 7.721 <0.001 7.145 <0.001 7.694 <0.001
−213
adoaciaf
3
yaoctiirdaac1fdEf
Lafarge vs. CKD 1.355 0.657
Lafarge vs. CEM 4.478 0.005
Lafarge vs. B, D, E, G 4.321 <0.001
Egg bags yielded presence-absence data but had high variabilitymong bags; Riley et al. (2011) reported three orders of magnitudeifferences among adjacent bags on one small reef, with coefficientsf variation of 0.67–1.35. Statistical comparisons of egg bag datamong our reefs, i.e., among constructed reef designs or betweenonstructed and natural reefs, had little power due to the predom-nance of zero catches in individual bags and the high variabilitymong non-zero bags, and the results of such analyses would there-ore be misleading.
.3. Fry collections
Lake trout fry were collected on the natural East Reef everyear (Table 3), but no fry were collected on Cement or CKD reefsnd only a single fry was collected in each of two years on onef the small, isolated reefs (Reefs B, D, E, and G). Among the eightonstructed reefs sampled each year in the CKD and CEM lines,he number of reefs on which fry were collected rose from threen 2012 to four in 2013 and then to all eight in 2014 and sevenn 2015. Numbers of fry sampled on the two lines of constructedeefs increased from an average of 0.5 fry per reef (0.004 per trap-ay) in 2013 to 11.5 fry per reef (0.03 per trap-day) in 2014; theverage dropped to 5.3 fry per reef (0.025 per trap-day) in 2015,
year in which fry trapping ended early. Fry were consistentlyollected on the constructed Lafarge Reef and also increased from
to 2 fry (0.002–0.004 per trap-day) in 2012 and 2013 to 17
ry (0.04 per trap-day) in 2014, dropping to 4 fry (0.01 per trap-ay) in 2015. Fry were considerably more abundant at the naturalast Reef than any other site in all years except 2015 (14–127ry, 0.04–0.25 per trap-day; Table 3). The number of fry per trap-.225 0.170 −0.068 1.000
.883 0.327 1.483 0.573
.227 0.011 5.694 <0.001
day on East Reef rose between pre- and post-construction years,except for 2015 when fry trapping ended early (Table 3). No dif-ferences in fry CPUE occurred among the constructed reef heightcomparison (ANOVA, F1,25 = 0.003, p = 0.956) or orientation com-parison (ANOVA, F1,25 = 0.815, p = 0.375), or between the two linesof constructed reefs (ANOVA, F1,25 = 0.022, p = 0.884); however,fry CPUE increased significantly between 2012 and 2014 (ANOVAF2,25 = 4.728, p = 0.010; Tukey’s test, p = 0.020), and was consistentbetween 2014 and 2015 (ANOVA F2,25 = 4.728, p = 0.010; Tukey’stest, p = 0.940). Fry CPUE on East Reef was approximately 10 timeshigher than on the constructed reefs in all years except 2015; how-ever, this difference was not statistically significant (paired t-test,t = −2.0348, df = 3, p = 0.1347).
4. Discussion
Consistent with our hypotheses, lake trout were attracted to andspawned on constructed reefs in Thunder Bay. Use of the new reefswas initially low, but increased over the five years of assessment(hypothesis 1). Attraction of spawners, egg deposition, and fry catchwas not related to reef height or orientation of the constructed reefs,but was related to reef size (hypothesis 2). Use of the reefs was alsorelated to proximity to the natural reef, such that more spawningoccurred on the reefs closest to the natural reef. Adult abundanceand fry production increased on the constructed reefs over the fiveyears of the study, while remaining consistent on the natural reef
(hypothesis 3).Adult abundance and number of eggs and fry on the constructedreefs were higher than on the two degraded reefs in all years, butsubstantially lower than on the non-degraded natural reef (East
J.E. Marsden et al. / Fisheries Research 183 (2016) 275–286 283
Table 5Results of linear mixed models comparing average number of fish positions per unit area among reefs in each of the CEM and CKD lines in each of the three years of the study.Fixed effects in the models were reef line (CEM and CKD), reef height (1.5 and 3 m), reef orientation (NE × SW and NW × SE) and interactions. Fish identification number wasa random effect in the models. P-values and degrees of freedom (df) were calculated using the Scatterthwaite approximation, as implemented in the R Package ‘lmerTest’(Kuznetsova et al., 2015). Number of fish detected was 21 in 2012, 22 in 2013, and 16 in 2014. Significant p-values (<0.05) are shown in bold.
2012 (N = 168, df = 142) 2013 (N = 176, df = 149) 2014 (N = 128, df = 107)
Model parameter F P-value F P-value F P-value
Orientation 0.950 0.332 0.496 0.483 1.555 0.215Height 0.980 0.324 0.825 0.365 0.205 0.652
300
RdbCrutmaCl
Frwe
Line 24.948 <0.001
Line × height 0.292 0.590
Line × orientation 0.288 0.592
eef hotspot). Insufficient data were available to detect significantifferences in egg densities among reef heights and orientations,ut no difference occurred in the number of lake trout fry, fryPUE, or acoustic telemetry positions of adults, standardized byeef area, relative to reef height or orientation. More positions pernit area were detected on the largest reef (Lafarge) and fewer onhe small, isolated reefs (B, D, E, G). The small reefs may have been
ore difficult to find than other constructed reefs due to their size
nd isolation, i.e., they are solitary, small ‘targets’, compared to theEM and CKD reefs which are aggregated in a line and present aarge target. Among all of the constructed reefs, the most positions
ig. 6. Mean number of acoustic telemetry positions per fish per unit area on eacheef configuration within the CEM and CKD lines, with standard error bars. Low reefsere 1.5 m tall, high reefs were 3 m tall; reefs were oriented NE-SW or NW-SE, and
ach reef configuration was replicated six times.
6.551 <0.001 23.788 <0.001.051 0.822 0.272 0.603.045 0.832 1.441 0.233
per unit area were detected on Lafarge Reef, which is the reef con-structed closest to East Reef’s hotspot. Likewise, the CKD line hadsignificantly more positions than CEM line, and was closer to EastReef. Thus, spawning lake trout appeared to prefer larger reefs andthose that were closest to the existing high-quality natural reef.This may suggest strong site fidelity, as noted in the DrummondIsland Refuge in northern Lake Huron, where 78–94% of spawninglake trout retuned to the same area over five years (Binder et al.,2016). Constructed reefs that were closer to East Reef were morelikely to be encountered by wandering spawners than more distantreefs, and large reefs were more likely to be encountered than smallreefs. The proximity of boat traffic from the Thunder Bay River, 2 kmwest of Cement Reef, could also have influenced fish preferencesfor reefs furthest from boat noise. Finally, the number of fry col-lected on East Reef did not decrease during the period of increasingnumbers of spawners and fry production on the constructed reefs,suggesting that attraction did not result in reduced production onthe existing natural reef. The lake trout spawning population mayhave been expanding in Thunder Bay at the time of this project,and thus, reproductive potential in the northern portion of Thun-der Bay was not at carrying capacity; or, productivity was increasedby supplementing spawning habitat.
Increased colonization of constructed reefs over time may havebeen motivated by a few individual ‘early adopters’ rather than ageneral mass movement of spawners. Of the acoustically taggedfish, a single male (tag number 511, 73 cm TL) spent time on everyconstructed reef except the small reefs in all three years; he alsospent time on the Rend, a wooden ship wrecked 0.5 km north of thelines of reefs. No other fish visited more than one or two reefs in2012, and all spent less time on each reef than fish 511 (an averageof two positions per reef, relative to an average of 15 for fish 511). Bythe second year (2013), 86% of the tagged lake trout visited at leastone of the lines of reefs or Lafarge Reef, with an average of 158 posi-tions per reef, and in 2014 77% of the fish visited the lines of reefsand Lafarge Reef, with an average of 478 positions per reef. Over thethree years of telemetry data, the number of fish on each of the con-structed reefs and the time spent on these reefs increased steadilyand substantially, though the small reefs were barely visited. Rel-ative to their small size, the constructed CDK line and Lafarge Reefhad more visits by 2014 than the most heavily used area of naturalreefs, the Hotspot on East Reef.
Although the constructed reefs attracted and were investigatedby lake trout, adoption of the reefs by spawners took time. Thevariance in egg collections among reefs within and among yearswas too high to discern any pattern among reef characteristics;however, more fry were collected from the individual constructedreefs in each successive year of the study, and the number of fryon the constructed reefs was higher in 2014 than any other year.Unfortunately, fry traps were removed early in 2015, so we do not
know if this trend in numbers continued. The increased use of theconstructed reefs did not appear to reduce density of fish or fry atEast Reef. The number of fry on East Reef was much lower in 2014,when the most fry were seen on the constructed reefs, than in 2013,
2 s Research 183 (2016) 275–286
br
saphdaaatsskOcmubTPo(swautivt
fiuaEeotsaeaatwtof
BRreocotvbptooc
Fig. 7. Finescale bathymetry of the East Reef Hotspot (lower left on each panel) andColdspot (upper right on each panel), with outlines of the polygons used to quantify
84 J.E. Marsden et al. / Fisherie
ut equivalent to 2012 when few fry were found on constructedeefs (Table 3).
Our study revealed misconceptions about natural lake troutpawning sites in Thunder Bay and altered some of our assumptionsbout what constitutes prime spawning habitat. The project wasredicated on the assumption that CDK and Cement Reefs may haveistorically been important spawning areas for lake trout in Thun-er Bay, and therefore expanding the available spawning substratedjacent to these reefs would rapidly attract spawning lake troutnd increase fry production. No wild spawners had been seen innnual gillnetting on either reef, and East Reef was unknown prioro inception of the project. Examination of Cement Reef by diversuggested that it was unlikely to support egg incubation, due to sub-tantial infilling of interstitial spaces with fine material. We do notnow how long ago, if ever, this reef was suitable for egg incubation.ur results confirm that neither the CKD nor Cement reefs wereurrently being used for spawning by lake trout. In contrast, bathy-etric and diver surveys of East Reef indicated that this previously
n-surveyed area contained prime spawning substrate, confirmedy subsequent egg and fry collections and acoustic telemetry data.he constructed reefs were built parallel to the CKD and Cementlant natural reefs, based on the possibility that the orientationf those reefs had created favorable conditions for egg incubatione.g., currents that may maintain high dissolved oxygen in inter-tices), or some other attractive characteristic. If reef orientationas important for egg incubation, and therefore an important vari-
ble in reef choice by adults, then we expected to see a difference inse of the two orientations of constructed reefs. We also expectedhat lake trout would prefer the tall reefs (i.e., 3 m high) with morenterstitial spaces. However, no difference in any of the responseariables for which we had sufficient data occurred between thewo reef orientations.
Analysis of telemetry data by positions per unit area allowedne-scale examination of lake trout behavior relative to individ-al constructed reefs; however, we recognize issues related to reefrea estimation when comparing constructed and natural reefs.ast Reef and its sub-sections, the Hotspot and Coldspot, are notntire areas of spawning substrate, but collections of small ‘reefs’,r mounds of cobble and boulders. Thus, to compare density ofelemetry positions on these areas with the constructed reefs, wehould use the total area of each reef line, which would include thereas between each reef. The extended polygons we drew aroundach reef encompassed, on average, twice the calculated basalrea based on reef design dimensions (Table 1), and thus partlyccounted for inter-reef area. Inclusion of the matrix area betweenhe reefs or mounds, or use of only reef or mound areas (if theyere individually mapped), may change our estimation of teleme-
ry position density, primarily by inflating the density of positionsn East Reef, but would not obscure the orders-of-magnitude dif-erences in position density among reefs.
Within the broad area of the northeastern portion of Thunderay, and particularly the area with most complex bathymetry (Easteef), virtually all lake trout spent the majority of their time on theelatively small area that we refer to as the Hotspot at the south-ast side of East Reef (Fig. 7). This area is approximately 15,440 m2,nly 28% of the size of East Reef (54,567 m2). Subsequent to dis-overy of East Reef by divers in 2009, a focused bathymetric surveyf the area, with ground-truth observations by divers, showed ito be a highly heterogeneous jumble of rocky material of widelyarying sizes. Acoustic telemetry positions exactly mapped thisathymetry, with most of the positions clustered on the highestarts of each rock cluster (Fig. 7). The attraction of lake trout to
hese piles of rocks is particularly well illustrated by the behaviorf male 511; his positions detected by acoustic telemetry echo theutlines of the reef (Fig. 7). The Coldspot area of dense rock piles isomparable to the East Reef Hotspot and adjacent to the Hotspotacoustic telemetry positions. Dotted line delineates the polygon area for East Reef.The lower panel shows the acoustic telemetry positions of a single male lake troutin 2012.
to the northeast, but was visited very rarely by lake trout, althoughmost or all fish encountered the site each year (Fig. 6). Both areas areof similar extent, and rise to a similar depth; visually, the Hotspotappears to have steeper contours and more concentrated piles ofrock than the Coldspot. The differences between these two areaswere clearly important to lake trout, and warrant further inves-tigation to improve our understanding of what lake trout preferas spawning substrate. Additional extensive arrays of rock pilesare present throughout the northeastern portion of Thunder Bay;visual inspection of this area suggested abundant potential spawn-ing habitat is present in the bay. Nevertheless, lake trout adoptedthe constructed reefs as new spawning sites fairly quickly, suchthat the number of adults and time spent by adults on the con-
structed reefs approached densities seen on the Hotspot by the endof the study. The constructed reefs must have been higher qualitysubstrate than some of the available natural habitat, or had otherattractive features we did not recognize, but not to the extent that
s Rese
sHbtr
resglsdltiwirdtevottmaTdwafRrwtsvtse
omtSMcoad(oaetmohimbtst
J.E. Marsden et al. / Fisherie
pawning lake trout measurably reduced their use of the East Reefotspot. Is spawning habitat therefore limiting in Thunder Bay, andy extension, elsewhere in the Great Lakes? Ultimately, the answero this question depends on detecting an increase in year-classecruitment that can be attributed to a local increase in spawning.
We used several methods to evaluate the use of constructedeefs by spawning lake trout; thus, the study also provided data tovaluate the relative value of each of these methods for locatingpawning aggregations of lake trout. Among the physical samplingear, fry traps collected the most data and egg traps collected theeast, suggesting that fry traps were a better measure of lake troutpawning habitat. Several lines of egg traps were broken, lost, orislodged from the reefs in storms. Eggs may be more easily dis-
odged from the egg traps than from the rock substrate in egg bags;raps were designed for deep-water work where wave turbulences not an issue. In contrast, egg bags remained in place but some
ere lost because divers were unable to find them due to poor vis-bility. Fry traps were challenging to set from the surface on theelatively small (narrow) reefs, but generated highly informativeata in terms of successful production of fry from the reefs. Eggs, inheory, should be more abundant than fry and easier to catch, butgg data we collected were sparse and highly variable. The mostaluable data in terms of understanding the behavioral responsef lake trout to the new reefs, and locating spawning aggrega-ions, was generated by acoustic telemetry. In particular, prior tohe inception of this project, East Reef and the large areas of rock
ounds to the north and east were not recognized as spawningreas by the local fishery managers, and were largely unmapped.he extensive area of heterogeneous piles of cobbles and boul-ers revealed by visual inspection and high-resolution bathymetryould have been extremely challenging to evaluate using egg bags
nd fry traps. However, use of acoustic telemetry data identified theocus of lake trout activity on a relatively small proportion of Easteef. Telemetry provided rapid data recovery (downloaded fromeceivers as soon as spawning was ending); the only major issueas the problem of acquiring enough spawners to tag. Acoustic
elemetry is clearly an optimal method for finding the relativelymall foci of activity in large reef areas; spawning can be confirmedisually by diver searches for eggs or with fry traps. Fry traps havehe advantage of also confirming the suitability of the substrate foruccessful incubation and providing quantitative catch-per-unit-ffort data on fry abundance.
Artificial reef research has been plagued by poorly devel-ped objectives, weak experimental design, use of inappropriateaterials, short-term and inadequate assessment, lack of quanti-
ative data, and lack of communication of results (Bohnsack andutherland, 1985). In their review of artificial reefs in Great Lakes,cLean et al. (2015) noted that most artificial reef studies did not
onduct biological assessment for more than three years (only 12f 38 they reviewed), few did quantitative assessment of the reefs,nd none compared physical characteristics among different reefesigns. We used quantitative data from four response variablesegg density, fry CPUE, number of tagged fish per reef, and numberf positions per fish per unit area) for five years of post-constructionssessment. Pre-construction assessment included three years ofgg, fry, and adult lake trout sampling, but lacked the acousticagging information. If we had only done post-construction assess-
ent for one or two years, we might have concluded that the goalf increasing lake trout spawning habitat had failed. By 2013, onlyalf of the reefs were producing fry, and in small numbers. Sim-
larly, if we had only used one or two assessment methods, weight have missed the slow but steady increase in reef occupancy
y lake trout and numbers of fry produced. We evaluated the rela-ive importance of reef height, orientation, and size, and found thatize may be the most important characteristic for attracting lakerout. Previous studies of artificial reef use by spawning lake trout
arch 183 (2016) 275–286 285
found that lake trout responded very rapidly to newly constructedreefs by spawning on them within a few months after constructionwas completed (Marsden et al., 1995a; Marsden and Chotkowski,2001), so we expected rapid adoption of the new reefs by spawn-ing lake trout. However, colonization of our constructed reefs tookseveral years. This result suggests that short-term assessment stud-ies may underestimate the long-term potential effect that artificialreef construction projects can have on fish populations. Rapid colo-nization of new reefs in the prior studies may have been to due theclose proximity of constructed reefs to existing spawning substrate(80 m in Lake Ontario, Marsden et al., 1995a), or continuity betweenexisting and new substrate (along a breakwall in Lake Michigan,Marsden and Chotkowski, 2001), so lake trout were more likelyto encounter the new reefs. Likewise, data from Thunder Bay alsoindicated that reefs constructed closer to existing spawning habitathave the highest potential for discovery and use by spawning laketrout.
In summary, construction of 29 reefs in Thunder Bay resulted,after three years, in an increase in spawning substrate used byspawning lake trout. The reefs successfully produced fry, with anorder of magnitude increase in the abundance of fry between thefirst year after construction and the third year after construction.The use of these reefs did not appear to reduce the number of fish, orfry produced, on the adjacent natural reef. In other words, address-ing the attraction:production dilemma emphasized by Bortone(1998), spawning in the bay does not appear to have shifted to theconstructed reefs at the expense of production on the natural reef.Thus, the capacity for fry production has been increased in ThunderBay. If this is the case, then over time, we expect to see more spawn-ers in the bay, and an increasing number of wild recruits observedin annual gillnet assessments.
Our assessment of 29 constructed reefs identified characteristicsthat are important for attracting spawning lake trout, and providesguidance for future projects aimed at spawning reef restoration.Larger reefs are more attractive than small reefs, and lake trout aremore likely to find reefs adjacent to natural spawning sites. Clus-tered reefs are more likely to attract spawners than small, isolatedreefs. In the presence of a non-degraded natural reef, colonizationof new reefs may take several years; however, reef siting near anatural spawning reef is important, otherwise lake trout would beunlikely to encounter constructed reefs. Addition of spawning habi-tat does not appear, at least in the relatively short term (five years),to detract from spawning on natural reefs. As seen in prior stud-ies, lake trout spawned on tall piles of rocks with open interstitialspaces, but did not spawn on natural reefs where interstices werefilled with sediment. Further research on artificial reef character-istics that attract spawning lake trout should evaluate the relativeimportance of rock size, a factor that was not included in our study.
The anticipated outcome of reef construction was to directlybenefit the goal of lake trout restoration by increasing spawningsuccess and survival of early life stages. The constructed reefs willlikely also benefit other benthic-spawning species such as sculpins,whose populations have recently been threatened by competitionwith round gobies (Janssen and Jude, 2001); lake whitefish, whichare suffering population declines throughout the lakes (Owenset al., 2005), and walleye, which are a valuable and widely-soughtsport fish. Because fish tend to congregate near submerged struc-tures, construction of these reefs will likely increase recreationalfishing opportunities for species in addition to lake trout; however,it will be important to regulate the fishery to ensure protection ofspawning fishes. If lake trout return to their natal sites to spawn,we should detect an increased use of the constructed reefs begin-
ning in approximately 2018 when the 2012 year class spawnedon the reefs begins to reach maturity. Thus, we suggest that thiswork be repeated in 2018–2021 to observe production of a secondgeneration of wild lake trout on the reefs.
2 s Rese
A
tMTKFDWEDBSLabQatbRCS
R
A
B
B
B
B
B
B
B
B
C
C
E
E
E
F
F
G
86 J.E. Marsden et al. / Fisherie
cknowledgements
Many individuals and agencies contributed to this project, par-icularly Wayne Lusardi (Michigan DNR, Thunder Bay National
arine Sanctuary), Tane Casserly, Russ Green, and Jeff Gray (NOAA,hunder Bay National Marine Sanctuary), Adam Kowalski, Scottoproski, Steve Lennart, and Darren Vercnocke (USFWS), Davidielder, Ji He, Jeff Dimond, and William Wellencamp (MichiganNR, Alpena Fisheries Station), Aaron Berndt, Nick Ekel, Kevinilcox, and Dan Peabody (Michigan DEQ Geological Services Unit),
rick Larson, Henry Thompson, Chris Wright, Lindsey Lesmiester,an Operhall, Bill Lamareaux, and Zach Wickert (USGS Hammonday Biological Station), Lee Simard (University of Vermont), andkye Fissette (Michigan State University). We thank John Janssen,ee Simard, Peter Euclide, and an anonymous reviewer for valu-ble comments on the manuscript. This project was made possibley funding obtained from Michigan Department of Environmentaluality—Clean Michigan Initiative Fund, USFWS Great Lakes Fishnd Wildlife Restoration Grant and Corps of Engineers, Detroit Dis-rict, Estuary Restoration Act Grant. The telemetry work was fundedy the Great Lakes Fishery Commission by way of Great Lakesestoration Initiative appropriations (GL-00E23010). This paper isontribution 22 of the Great Lakes Acoustic Telemetry Observationystem (GLATOS).
eferences
nderson, D.M., Collins, J.J., 1995. Natural reproduction by stocked lake trout(Salvelinus namaycush) and hybrid (backcross) lake trout in South Bay, LakeHuron. J. Gt. Lakes Res. 21 (Suppl. 1), 260–266.
aine, M., 2001. Artificial reefs: a review of their design, application, managementand performance. Ocean Coast. Manage. 44, 241–259.
assett, C.E., 1994. Use and evaluation of fish habitat structures in the lakes of theeastern United States. USDA For. Serv. Bull. Mar. Sci. 55, 1137–1148.
ates, D., Maechler, M., Bolker, B., Walker, S., 2015. Lme4: Linear Mixed-effectsModels Using Eigen and S4. R Package Version 1., pp. 1–8 http://CRAN.R-project.org/package=lme4.
enaka, L., (Ed). 1999. Fish Habitat: Essential Fish Habitat and Rehabilitation,American Fisheries Society; Bethesda, MD, 400 pp.
inder, T.R., Riley, S.C., Holbrook, C.M., Hansen, M.J., Bergstedt, R.A., Bronte, C.R.,He, J.X., Krueger, C.C., 2016. Spawning site fidelity of wild and hatchery laketrout (Salvelinus namaycush) in northern Lake Huron. Can. J. Fish. Aquat. Sci. 73,18–34.
ohnsack, J.A., Sutherland, D.L., 1985. Artificial reef research: a review withrecommendations for future priorities. Bull. Mar. Sci. 37, 11–39.
ortone, S.A., 1998. Resolving the attraction-production dilemma in artificial reefresearch: some yeas and nays. Fisheries 23, 6–10.
ronte, C.R., Holey, M.E., Madenjian, C.P., Bronte, C.R., Holey, M.E., Madenjian, C.P.,Jonas, J.J., Claramunt, R.M., McKee, P.C., Toneys, M.L., Ebener, M.P., Breidert, B.,Fleischer, G.W., Hess, R., Martell, A.W., Olsen, E.J., 2007. Relative abundance,site fidelity, and survival of adult lake trout in Lake Michigan from 1999 to2001: implications for future restoration strategies. N. Am. J. Fish. Manage. 27,137–155.
arr, M.H., Hixon, M.A., 1997. Artificial reefs: the importance of comparisons withnatural reefs. Fisheries 22, 28–33.
ornelius, F.C., Muth, K.M., Kenyon, R., 1995. Lake trout rehabilitation in Lake Erie:a case history. J. Gt. Lakes Res. 21 (Suppl. 1), 65–82.
llrott, B.J., Marsden, J.E., 2004. Lake trout reproduction in Lake Champlain. Trans.Am. Fish. Soc. 133, 252–264.
lrod, J.H., O’Gorman, R., Schneider, C.P., Eckert, T.H., Schaner, T., Bowlby, J.N.,Schleen, L.P., 1995. Lake trout rehabilitation in Lake Ontario. J. Gt. Lakes Res. 21(Suppl. 1), 83–107.
shenroder, R.L., Payne, N.R., Johnson II, J.E., Bowen, C., Ebener, M.P., 1995. Laketrout rehabilitation in Lake Huron. J. Gt. Lakes Res. 21 (1), 108–127.
itzsimons, J.D., Marsden, J.E., 2013. Relationship between lake trout spawning,embryonic survival, and currents: a case of bet hedging in the face ofenvironmental stochasticity? J. Gt. Lakes Res. 40, 92–101.
itzsimons, J.D., 1996. The significance of man-made structures for lake troutspawning in the Great Lakes: are they a viable alternative to natural reefs? Can.J. Fish. Aquat. Sci. 53, 142–151.
LFC, 2011. Strategic Vision of the Great Lakes Fishery Commission 2011–2020.Great Lakes Fishery Commission, Ann Arbor, MI.
arch 183 (2016) 275–286
Grossman, G.D., Jones, G.P., Seaman, W.J., 1997. Do artificial reefs increase regionalfish production? A review of existing data. Fisheries 22, 17–23.
Hansen, M.J., Peck, J.W., Schorfhaar, R.G., Selgeby, J.H., Schreiner, D.R., Schram, S.T.,Swanson, B.L., MacCallum, W.R., Burnham Curtis, M.K., Curtis, G.L., Heinrich,J.W., Young, R.J., 1995. Lake trout (Salvelinus namaycush) populations in LakeSuperior and their restoration in 1959–1993. J. Gt. Lakes Res. 21 (Suppl. 1),152–175.
Hanson, S.D., Holey, M.E., Treska, T.J., Bronte, C.R., Eggebraaten, T.H., 2013.Evidence of wild juvenile Lake Trout recruitment in western Lake Michigan. N.Am. J. Fish. Manage. 33, 186–191.
Hayden, T.A., Holbrook, C.M., Fielder, D.G., Vandergoot, C.S., Bergstedt, R.A.,Dettmers, J.M., Krueger, C.C., Cooke, S.J., 2014. Acoustic telemetry revealslarge-scale migration patterns of walleye in Lake Huron. PLoS One 9, e114833,http://dx.doi.org/10.1371/journal.pone.
Holey, M.E., Rybicki, R.W., Eck, G.W., Brown, E.H., Marsden, J.E., Lavis, D.S., Toneys,M.L., Trudeau, T.N., Horrall, R.M., 1995. Progress toward lake trout restorationin Lake Michigan. J. Gt. Lakes Res. 21 (Suppl. 1), 128–151.
Hothorn, T., Bretz, F., Westfall, P., 2008. Simultaneous inference in generalparametric models. Biom. J. 50, 346–363.
Janssen, J., Jude, D.J., 2001. Recruitment failure of the mottled sculpin Cottus bairdiin Calumet Harbor, southern Lake Michigan, induced by the newly introducedround goby Neogobius melanostomus. J. Gt. Lakes Res. 27, 319–328.
Johnson, J.E., VanAmberg, J.P., 1995. Evidence of natural reproduction of lake troutin western Lake Huron. J. Gt. Lakes Res. 21 (Suppl. 1), 253–259.
Johnson, J.E., He, J.X., Fielder, D.G., 2015. Rehabilitation stocking of Walleyes andLake Trout: restoration of reproducing stocks in Michigan waters of LakeHuron. N. Am. J. Fish. Aquac. 77, 396–408.
Krueger, C.C., Ebener, M., 2004. Rehabilitation of lake trout in the Great Lakes: pastlessons and future challenges. In: Gunn, J.M., Steedman, R.J., Ryder, R.A. (Eds.),Boreal Shield Watersheds: Lake Trout Ecosystems in a Changing Environment.CRC Press, Boca Raton, Florida, pp. 37–56.
Kuznetsova, K., Brockoff, P.B., Christensen, R.H.B., 2015. LmerTest: Tests in LinearMixed Effects Models. R Package Version 2., pp. 0–29 http://CRAN.R-project.org/package=lmerTest.
Marsden, J.E., Chotkowski, M.A., 2001. Lake trout spawning on artificial reefsfouled by zebra mussels: fatal attraction? J. Gt. Lakes Res. 27, 33–43.
Marsden, J.E., Krueger, C.C., Schneider, C.P., 1988. Evidence of natural reproductionby stocked lake trout in Lake Ontario. J. Gt. Lakes Res. 14, 3–8.
Marsden, J.E., Perkins, D.L., Krueger, C.C., 1995a. Recognition of spawning areas bylake trout: deposition and survival of eggs on small, man-made rock piles. J. Gt.Lakes Res. 21 (Suppl. 1), 330–336.
Marsden, J.E., Casselman, J.M., Edsall, T.A., Fitzsimons, J.D., Horns, W.H., Manny,B.A., McAughey, S.C., Sly, P.G., Swanson, B.L., 1995b. Lake trout spawninghabitat—a synthesis of current knowledge. J. Gt. Lakes Res. 21 (Suppl. 1),487–497.
McLean, M., Roseman, E.F., Pritt, J.J., Kennedy, G., Manny, B.A., 2015. Artificial reefsand reef restoration in the Laurentian Great Lakes. J. Gt. Lakes Res. 41, 108.
Muir, A.M., Blackie, C.T., Marsden, J.E., Krueger, C.C., 2014. Lake charr Salvelinusnamaycush spawning behaviour: new field observations and a review ofcurrent knowledge. Rev. Fish Biol. Fish. 22, 575–593.
National Research Council, 1992. Restoration of Aquatic Ecosystems: Science,Technology, and Public Policy. National Academy Press, Washington, DC.
Owens, R.W., O’Gorman, R., Eckert, T.H., Lantry, B., Dittman, D.E., 2005. Recoveryand decline of lake whitefish in U.S. waters of eastern Lake Ontario,1980–2001. Proceedings of a Workshop on the Dynamics of Lake Whitefish(Coregonus clupeaformis) and the Amphipod Diporeia Spp. in the Great Lakes,66, Great Lakes Fish. Comm. Tech. Rep.
Peck, J.W., 1986. Dynamics of reproduction by hatchery lake trout on a man-madespawning reef. J. Gt. Lakes Res. 12, 293–303.
Perkins, D.L., Krueger, C.C., 1994. Design and use of mesh bags to study eggdeposition and embryo survival in cobble substrate. N. Am. J. Fish. Manage. 14,866–869.
Pickering, H., Whitmarsh, D., 1997. Artificial reefs and fisheries exploitation: areview of the ‘attraction versus production’ debate, the influence of design andits significance for policy. Fish. Res. 31, 39–59.
R Core Team, 2015. R: A Language and Environment for Statistical Computing. RFoundation for Statistical Computing, Vienna, Austria https://www.R-project.org/.
Reid, D.M., Anderson, D.M., Henderson, B.A., 2001. Restoration of lake trout inParry Sound, Lake Huron. N. Am. J. Fish. Manage. 21, 156–169.
Riley, S.C., He, J.X., Johnson, J.E., O’Brien, Schaeffer, J.S., 2007. Evidence ofwidespread natural reproduction by lake trout Salvelinus namaycush in theMichigan waters of Lake Huron. J. Gt. Lakes Res. 33, 917–921.
Riley, J.W., Thompson, N.F., Marsden, J.E., Janssen, J., 2011. Development of twonew sampling techniques for assessing lake trout reproduction in deep water.
N. Am. J. Fish. Manage. 30, 1571–1581.Smith, F., 2013. Understanding HPE in the VEMCO Positioning System (VPS).VEMCO DOC-005457-01.
Wentworth, C.K., 1922. A scale of grate and class terms for clastic sediments. J.Geol. 30, 377–392.