five recent paradoxes and anomalies of … recent paradoxes and anomalies of economics ... a typical...
TRANSCRIPT

Asia-Pacific Development Journal Vol. 7, No. 2, December 2000
1
FIVE RECENT PARADOXES AND ANOMALIESOF ECONOMICS
V.R. Panchamukhi*
This paper presents five major paradoxes and anomalies that characteriserecent economic phenomena in the world, viz. (i) the paradox of growthand stability, (ii) the immiserizing effects of structural adjustment,(iii) the paradox of growing unemployment in a framework of fullemployment goals, (iv) the growth of market imperfections while pursuinga strategy of creating perfectly competitive markets, and (v) the paradox ofthe World Trade Organization trading system. The paper argues that despitethe fact that anomalies and paradoxes have in the past been fertile groundfor research the five paradoxes discussed here have not so far received theattention of analysts and of policy makers that they deserve.
The New Palgrave Dictionary of Economics (1988) classifies paradoxes intothree categories. Rhetorical paradoxes; fact of life paradoxes, such as the failure ofaggregation rules; and the main group, theoretical paradoxes and empirical anomalies.Adam Smith’s diamonds and water paradox is a typical example of a rhetorical paradox.The paradox of thrift, Mandeville’s paradoxes about private vices leading to publicvirtues, and Arrow’s impossibility theorem are given as examples of fact of lifeparadoxes. The possibility of capital reversal or reswitching, Giffen’s paradox,preference reversal paradox, St. Petersburg paradox, the Allais paradox, the Gibsonparadox and the Leontief paradox are examples of the third category of paradoxes.We have also many paradoxes in capital theories and also the paradox of voting in thetheory of choices. World economic events of the past two or three decades signify asharp departure from those that have occurred in the decades of the 1950s and the1960s.In particular, the quick sequence of crises that have been taking place since the 1970shave triggered off many paradoxes and anomalies that have great analytical and policysignificance.
This paper has identified the following five paradoxes or anomalies for detaileddiscussion: one, the paradox of growth and stability. Two, the paradox ofimmiserization from structural adjustment. Three, the paradox of growing
* Director General, Research and Information System for the Non-Aligned and Other DevelopingCountries, New Delhi, India.

Asia-Pacific Development Journal Vol. 7, No. 2, December 2000
2
unemployment in a framework of full employment goals. Four, the growth of marketimperfections while pursuing a strategy of creating perfectly competitive markets andfive, the paradox of the World Trade Organization (WTO) trading system.
The words paradoxes or anomalies have been used only to describe thecontradictions that exist in each of the above situations. They may be either realparadoxes, apparent paradoxes or illusory paradoxes, but in any case they providesome fertile avenues for analysis.
I. PARADOX OF GROWTH AND STABILITY
The recent literature on growth and stability raises essentially three types ofissues. The first one is concerned with the thesis that stability is a necessary thoughnot a sufficient precondition for achieving high growth. The second issue is concernedwith the thesis that the stabilisation policies adopted for realising high growth havethemselves generated the crisis of growth and stability. The third issue is the questionas to whether sustainable low growth with stability is better than unsustainable highgrowth with large instabilities.
An interesting study by Ricardo Hausmann and Michael Gavin (1995)brings out clearly as to how volatility has adversely affected growth in Latin America.Table 1 reproduces some of the results of this interesting study. It brings out thatLatin America was more volatile in the period 1970-92 than the industrial countriesand also most other regions of the developing world.
The volatility is measured by the standard deviation of the select variablesover the period 1970-92 for each country and country estimates are aggregated for theregion by the 1992 population level of the individual countries. The volatility indexof real GDP growth for the Latin American region was 4.7 as against the level of 2.2for the industrial countries, 3.04 for the East Asian countries and 3.4 for the SouthAsian countries. The volatility indices of real Gross Domestic Product (GDP) growthfor the African region are greater than those of the Latin American region. Thevolatility index of the annual inflation rate was 463.5 for the Latin American regionas against 3.9 for industrial countries and 6.2 for East Asian countries. Volatilityindex numbers for monetary growth, fiscal deficit as a proportion of GDP and publicconsumption as a proportion of GDP were all higher for the Latin American countriesthan those for the other regions. The indicators of external shocks, such as terms oftrade and international capital flows as a percentage of GDP, are also found to behighly volatile.
By using the conventional growth regression worked out by Hausmann andGavin shows that the Latin American region has lost 3 percentage points of growth asa result of volatility and other factors. The study also brings out the inverse relationshipbetween macroeconomic volatility on the one hand and the investment rate andreduction of income inequalities on the other.

Asia-Pacific Development Journal Vol. 7, No. 2, December 2000
3
Table 1. Indices of volatility in Latin America and other regions
Latin Industrial East South Other Sub- Middle
America countries Asia Asia East Saharan East andand the Asia and Africa North
Caribbean Pacific Africa
Macroeconomic outcomesStandard deviation of:Real GDP growth 4.7 2.2 3.0 3.4 4.1 5.3 7.9Private consumption growth 5.6 2.1 4.1 5.4 4.0 10.3 8.2Domestic investment growth 16.1 8.3 16.4 11.0 15.3 28.7 20.3Change in real exchange rate 13.4 4.8 6.2 n.a. 8.9 19.4 5.5Annual inflation rate 463.5 3.9 6.2 7.9 10.8 88.7 7.0
PolicyStandard deviation of:Fiscal deficit (per cent of GDP) 4.7 2.4 2.4 4.2 3.5 4.5 8.5Public consumption (per cent of GDP) 2.5 1.6 1.1 2.1 4.1 3.7 5.5Narrow money (per cent of GDP) 5.5 2.4 1.9 1.4 1.0 3.8 3.1Monetary growth 211.11 5.6 13.6 7.4 13.3 93.7 13.1
External shocksStandard deviation of:Terms of trade (growth rate) 5.1 8.9 8.0 7.9 11.4 22.1 25.6External capital flows (per cent of GDP) 2.8 1.7 1.5 1.1 3.9 4.4 6.1
Source: Hausmann, Ricardo and Michael Gavin, 1996. “Securing stability and growth in
a shock-prone region: the policy challenge for Latin America”; in Securing Stability and
Growth in Latin America – Policy Issues and Prospects for Shock-Prone Economies, Paris,France, Organisation for Economic Co-operation and Development, Ricardo Hausmann and
Helmut Reisen, eds.Note: Standard deviations are computed over the 1970-92 period. All statistics are weighted by
1992 population.
Table 2 gives information about the number of recessions, average lengthof recession and average depth of recession for the different regions for the period1970-92. A recession is defined as a year in which real GDP declines. Regionalfigures are population weighted averages of the individual country estimates. Thelength of the recession is measured by the consecutive number of years for whichdecline in real GDP has occurred. The average depth of recession is measured by thecumulative decline in real GDP. This study indicates that for the Latin Americanregion, the number of recessions were on an average 2.7 as against 2.1 for industrialcountries and 0.7 for the East Asian miracle economies. The average length of recession

Asia-Pacific Development Journal Vol. 7, No. 2, December 2000
4
was 1.9 years for the Latin American region as against 1.3 for the industrial countriesand 1.0 for the East Asian miracle countries. Average length of recession of theLatin American region is one of the highest among the different regions compared inthe table. The average depth of the recession as a per cent of GDP was -8 per centfor the Latin American region as against -2 per cent for the industrial countries and-1.6 per cent for the East Asian miracle countries. The average depth of recession isgreater than in the Latin American region only in the case of the Middle East andnorth America.
Table 3 presents the results of an exercise done by Hausmann and Gavin toexamine the impact on the predicted growth rate due to differences between the valuesof the explanatory variables of the Latin American region and those of the industrialeconomies. The table brings out that the growth in per capita GDP was 1 percentagepoint lower in Latin America than in industrial economies. The Latin Americangrowth gap was around 3 percentage points during the period in question and this wasattributable to the differences in the various volatility factors and structural featureslike school enrolment ratio, domestic investment etc., between Latin America and theindustrial economies.
Table 2. Recessions in Latin America and other regions(1970-92)
Number of Average length of Average depth of
recessions recession (years) recession (per cent)
Industrial countries 2.1 1.3 -2.0Latin America 2.7 1.9 -8.0East Asia 0.7 1.0 -1.6South Asia 1.8 1.2 -3.5Other East Asia and Pacific 3.7 1.5 -8.7Sub-Saharan Africa 3.9 1.5 -6.0Middle East and North Africa 3.2 1.7 -11.7Other 2.0 2.2 -18.3
Source: Hausmann, Ricardo and Gavin, Michael, 1996. “Securing stability and growth in
a shock-prone region: the policy challenge for Latin America”; in Securing Stability andGrowth in Latin America – Policy Issues and Prospects for Shock-Prone Economies, Paris,France, Organisation for Economic Co-operation and Development, Ricardo Hausmann and
Helmut Reisen, eds.Note: A recession is defined as a year in which real GDP declines. Regional figures are
population-weighted average of individual country experience.

Asia-Pacific Development Journal Vol. 7, No. 2, December 2000
5
Table 3. How has volatility affected growth in Latin America?
Determinants of growthImpact on predicted
growth rate
Difference in average growth rates minus predicted neoclassical “catch-up” -1.96Latin American “growth gap” -2.88Differences attributable to:
Initial school enrolments -0.92Domestic investment -0.44Volatility -1.06Other factors considered 0.04Unexplained -0.49
Impact of:Terms of trade volatility -0.41Real exchange rate volatility -0.23Monetary policy volatility -0.29Fiscal policy volatility -0.14
Total -1.06
Source: Hausmann, Ricardo and Gavin, Michael, 1996. “Securing stability and growth in
a shock-prone region: the policy challenge for Latin America”; in Securing Stability andGrowth in Latin America – Policy Issues and Prospects for Shock-Prone Economies, Paris,France, Organisation for Economic Co-operation and Development, Ricardo Hausmann and
Helmut Reisen, eds.Notes: In each case, numerical estimates give the predicted increase in the growth rate that would
have resulted if the indicated determinant of growth had taken the value observed in the
industrial economies, rather than the one that was actually observed in the region.* Includes effects of volatility in the term of trade, the real exchange rate, monetary and
fiscal policy.
Table 4 brings out the differences in the index of income inequalities betweenthe Latin American region and the industrial countries. This table brings out thatincome inequality in the Latin American region was much higher than that of theindustrial countries and initial difference in the income inequality was furtheraggravated due to the volatility of real GDP. The initial inequality levels contributedsignificantly to the differences in the income inequality to the extent of 51 per centwhile the volatility of real GDP contributed nearly 23 per cent of the difference inthe income inequality of the Latin American region and the industrial countries.The income inequality was measured by the ratio of income received by the richest20 per cent of the population to the income received by the poorest 40 per cent. Theinitial period was some year between 1959-1974 for the different countries dependingupon the availability of data. The income inequality of the later period refers to theperiod 1975 to 1989. By using the sample of 56 countries data the relationship

Asia-Pacific Development Journal Vol. 7, No. 2, December 2000
6
between income inequality of the later period and the other structural variables wasexamined. The study brings out that macroeconomic volatility has a strong impact onpoverty rates and that reducing macroeconomic volatility to industrial country levelsgreatly contributed to the reduction of poverty levels.
Table 5 reports the results of the studies based upon cross-country analysis ofthe volatility of real GDP and the volatilities of other select macroeconomic variablesand also indices of some political instabilities. The study has taken the standarddeviation of GDP growth from 1970-92 as the dependent variable and the independentvariables are monetary policy volatility, fiscal policy volatility, terms of trade volatility,capital flow volatility, index of political instability, indices of financial depth, and theexchange rate regime. The study brings out that external shocks have a significantrole to play in inducing GDP volatility. It is observed that roughly 28 per cent of thecross-country variation in GDP volatility is explained by external shocks such asvolatility in terms of trade and in capital flows.
It should be noted that the factor of volatility has again raised its ugly headin creating the recent crisis situations in the East Asian region, and that it is thiseconomic phenomenon, that has not received adequate analytical and policy attention.
Another interesting quantitative analysis of the effect of volatility on growthis to be found in Michael Bleaney and David Fielding (1999). The interface betweenthe exchange rate regime, on the one hand, and the inflation and the output volatility,on the other, has received some attention of the researchers. The study comes to theconclusion that there is a certain trade-off between the choice of exchange rate regime,
Table 4. Income inequality and macroeconomic volatility
Index of inequality Percentage of difference
Income inequalityLatin America 6.284Industrial countries 2.270Difference 4.014 100.0
Impact of:Initial income inequality 2.047 51.0Growth in per capita income 0.067 1.7Average inflation 0.029 0.7Volatility of real GDP 0.912 22.7Unexplained 0.959 23.9
Source: Hausmann, Ricardo and Gavin, Michael, 1996. “Securing stability and growth ina shock-prone region: the policy challenge for Latin America”; in Securing Stability and
Growth in Latin America – Policy Issues and Prospects for Shock-Prone Economies, Paris,France, Organisation for Economic Co-operation and Development, Ricardo Hausmann andHelmut Reisen, eds.

Asia-Pacific Development Journal Vol. 7, No. 2, December 2000
7
Table 5. What explains the volatility of real GDP?Evidence from cross-country comparisons
(1) (2) (3) (4) (5)
Monetary policy volatility .00594 .00545 .00130 .00147(2.5) (2.8) (0.6) (0.8)
Fiscal policy volatility .1258 .0776 .0245(3.0) (0.9) (0.3)
Terms of trade volatility .1086 .1197 .0594 .0667(4.2) (4.2) (2.2) (3.0)
Capital flow volatility .1764 .1502 .1052 .1112(2.5) (2.2) (1.7) (1.9)
Number of revolutions and coups .0129 .0132(1.7) (1.7)
Financial depth -.0091 -.00915(-2.4) (-2.5)
Pegged exchange rate .0170 .0164(3.1) (3.3)
Number of observations 128 111 107 93 94Adjusted R2 0.1164 0.2768 0.3426 0.4489 0.4648
Source: Hausmann, Ricardo and Gavin, Michael, 1996. “Securing stability and growth ina shock-prone region: the policy challenge for Latin America”; in Securing Stability and
Growth in Latin America – Policy Issues and Prospects for Shock-Prone Economies, Paris,France, Organisation for Economic Co-operation and Development, Ricardo Hausmann andHelmut Reisen, eds.
Note: Numbers in parentheses are t-statistics Study calculations as described in the text. Dependent
variable is the standard deviation of GDP growth from 1970-92 (gdpst).
inflation reduction and the stability of output (and inflation). The cross-countryregression analysis of mean inflation, output volatility and inflation volatility, basedupon the data for 80 developing countries over the period 1980-89 brings out thisresult, which has great policy relevance. It shows that the countries which had adopteda pegged exchange rate regime have experienced lower inflation rates and significantlygreater inflation variance and output variance than the typical floating rate country.
Table 6 gives the result of cross-country regression analysis of output volatility.The regression results also show that the external shock in the form of terms of tradevolatility has had a statistically significant effect on output volatility. It is interestingto note that a 1 per cent change in the terms of trade volatility would increase thevolatility in real output growth by 10 percentage points. The results of this studythrow up many important policy questions. How should the developing countriesadopt a harmonious blend of exchange rate regimes and monetary policies whichwould result in low inflation and also less volatile output growth and inflation rates.

Asia-Pacific Development Journal Vol. 7, No. 2, December 2000
8
Table 6. Cross-country regression analysis of output volatility(dependent variable: standard deviation of real output
growth 1980-89 (in logs))
Variable Co-efficient
Constant 0.0766(3.25)
Pegged exchange rate dummy (DPEG) 0.00438(0.87)
Single currency peg dummy (DPEGSC) 0.00212(2.65)
CFA dummy (DCFA) 0.01903(2.65)
Middle East dummy (ME) -0.0074(-1.70)
Sub-Saharan Africa dummy (SSA) -0.0006(0.14)
Western hemisphere dummy (AM) -0.0152(3.39)
Asia-Pacific dummy (AP) 0.0015(0.34)
Standard deviation of terms of trade (SDTOT) 0.1003(3.91)
Agriculture share (AGR) -0.00723(-3.96)
Country size (INC) -0.00247(-2.33)
Number of observations 80
R-squared 0.484
Source: Bleaney, Michael and David Fielding, 1999. Exchange Rate Regimes, Inflation and Output
Volatility in Developing Countries, Centre for Research in Economic Development andInternational Trade (CREDIT), University of Nottingham, CREDIT Research Paper No. 99/4.
Notes: Figures in parentheses are t-statistics using White’s heteroscedasticity correction. Variables
are defined as follows. DPEG = 1 for all pegged-rate countries, = 0 for floating-ratecountries. DPEGSC = 1 for all currencies pegged to a single currency, = 0 otherwise.
DCFA = 1 for CFA countries, = 0 otherwise. Area dummies = 1 for region indicated,
= 0 otherwise. Figures in parentheses are uncorrected t-statistics. SDTOT = standarddeviation of the change in the log of the terms of trade. AGR = mean log share of agriculture
value added in GDP. INC = mean log of GDP.

Asia-Pacific Development Journal Vol. 7, No. 2, December 2000
9
The profiles of inflation and the exchange rate would indicate the nature ofthe interface between growth and stability. Chart 1 provides an insight into the profilesof inflation in the developing world, industrialised countries and the world as a whole.It is disturbing to find that inflation, as measured by the average percentage changein GDP deflators, has been on a rising trend since 1973 in the developing countries.The average rate of inflation in the 1973-91 period is much higher than that in thepre-1973 period. It may be noted that inflation in the industrialised countries andalso in the world as a whole both in the pre-1973 period and also in the post-1973period has been stable at relatively lower levels than what can be observed in thedeveloping countries. The increasing trend of inflation in the developed world clearlyreflects that instabilities have been greater in the developing world.
Chart 2 gives the nature of exchange rate volatility in the pre-1973 andpost-1973 periods. Exchange rate volatility has been measured by the monthlypercentage change in the deutschmark-US dollar exchange rate. One observes thatthere is a big leap in the exchange rate volatility in the early 1970s and this magnitudeof volatility has persisted in the 1980s and 1990s. This increased volatility of exchangerates has generated instabilities in the world economic environment which have inturn adversely effected the prospects of stability in the developing countries.
Exchange rate volatility has baffled researchers since the collapse of theBretton Woods system. Received theories of exchange rate determination, such aspurchasing power parity, are not able to explain exchange rate behaviour. In aninteresting study on exchange rate volatility, Dr Manohar Rao (1993) has brought outthat non-linear dynamic systems theory, also known as chaos theory, can explainexchange rate volatilities. Dr Manohar Rao’s model has the limitation of not bringinginto its framework the capital account of the balance of payments in analysing thedynamics of the exchange rates. However, as claimed by Dr Rao, the model based onchaos theory throws some light on excessive exchange rate volatilities thereby givingsome clues for the prediction of future exchange rates. Incidentally, Dr Rao refers toan inherent paradox of recent economic phenomena. He writes:
“Economics also contains the following paradox. In microeconomics, alleconomic variables are seen to be generated by the rational decisions ofmaximising agents, thereby implying that all microeconomic variables can beassumed to be completely deterministic. However, in macroeconomics, mostof these aggregated variables are frequently viewed as being random. Theproblem is to reconcile the fact that the same variables are deterministic andrandom at the same time – a paradox which may be explained if the economicsystem is chaotic.”

Asia-Pacific Development Journal Vol. 7, No. 2, December 2000
10
Chart 1. Is inflation under control?(average annual per cent change in GDP deflators)
Source: IMF International Financial Statistics
Chart 2. The leap in exchange rate volatility in the early 1970s(monthly per cent change in deutschmark/US dollar exchange rate)
Source: Chase Manhattan Bank

Asia-Pacific Development Journal Vol. 7, No. 2, December 2000
11
Dr Rao has rightly raised an important puzzle as to how one should understandthe volatility phenomenon and deal with the problem of relevant policy choice opento a policy maker who is often handicapped by inadequate supply of information.
The world has seen a series of crisis situations over the past three decades.The collapse of the par-value system in the early 1970s, emergence of oil price crisis,Latin American debt crisis, Mexican crisis of 1994 and the recent East and South-EastAsian currency and financial crisis, have again brought to the focus of attention thecatastrophe which the volatilities can cause. In a perceptive analysis of the currencyinstabilities and financial instabilities experienced in the recent past, FredericS. Mishkin (1999) provides a good analytical account of the sequence of instabilitiesand their interlinkages which caused significant impacts on the growth profile of thecrisis ridden countries. This study brings out that the currency and financial crisiswould occur even when the so-called macroeconomic fundamentals, as pronouncedby the World Bank and IMF mandarins, are sound. The analysis brings out thatvolatile short term capital flows and a weak domestic banking system, could beresponsible for the emergence of a currency crisis which would then grow into afinancial crisis, and then to an economic and social crisis.
II. IMMISERIZING EFFECTS OF STRUCTURAL ADJUSTMENT
The word “immiserization” is well-known to trade theorists, ever sinceProfessor Jagdish Bhagwati propounded the immiserization hypothesis. It is felt thatthe profile of structural adjustment, – both national and international – of recentvintage, has some form of immiserization built into it. Consider that there are threecountries: A, B and C with different wage rate levels and different growth rates ofwages. Country A has the highest growth rate of wages followed by country B andthen country C. When the wage rate of country A reaches a particular level, countryA loses its comparative advantage in product X – say textiles, leather goods orengineering goods – in favour of country B and then country B starts producing theproduct X and exporting it to country A and country C. Country A “vacates”product X and moves to some other product Z, where it has acquired some newtechnology-induced comparative advantage and tries to make up for the loss ofcomparative advantage in product X. This is often referred to as the flying geesemodel of restructuring. Country A would be better off if the induction of product Z inthe basket of comparative advantage more than compensates the loss of comparativeadvantage realized in product A. Suppose the period of losing comparative advantagegradually in product X by country A is TALX and the period of gaining the compensatorycomparative advantage in product Z is TAGZ. If TAGZ - TALX then country A has nospecific problems caused by this structural adjustment. Of course, the stipulation isthat the TAGZ - TALX would only be satisfied when country A has a good institutionalframework, sound banking system, dynamic R&D activity and a responsive government

Asia-Pacific Development Journal Vol. 7, No. 2, December 2000
12
policy system. It is also required that country A should be in a position to set in placeeffective safety nets, facilities for the redeployment of labour and implementing othersocial security schemes for the period of transition for moving from industry X toindustry Z.
The fact that country B moves to produce X and gains comparative advantageis largely prompted by the initial conditions available in country B of a relatively lowwage rate and the availability of skilled manpower and other infrastructural facilitiesrequired to produce X. In a globalized and liberalized framework, the wage rates incountry B start rising. The pace of this rise would depend upon the degree ofglobalization that country B has implemented. When the wage rates in country B alsoreach a certain level, it would also lose its comparative advantage in product X infavour of country C. Suppose the time taken by country B for losing its comparativeadvantage is TBLX. Country B has to vacate the industry X and gain a newcompensatory comparative advantage in some other activity, say R. Let the timetaken by country B to gain this new comparative advantage, be TBGR. Once again, thepreconditions for the compensatory structural adjustment from X to R, are more orless as before, namely, effective R&D activities, a responsive policy regime and goodinfrastructural and banking system. Further, country B has to set in place effectivesafety nets, a proper social security system and training facilities for redeployment oflabour etc. Let us assume that country B is not as well-equipped as country A tofulfill these preconditions for the internal structural adjustment from industry X toindustry R. Let us also assume that country B has implemented its globalization andliberalization programmes at a much faster pace than what country A had done earlierand this has resulted in making TBLX – the time taken for the loss of comparativeadvantage, very short. In view of all these factors, TBLX < TBGR. This means thatcountry B has lost its comparative advantage in product X and at the time, when thishas happened, it has not yet gained comparative advantage in product R.
The national and international structural adjustment processes in a free marketenvironment are advocated for facilitating the movement towards higher efficiencyand higher growth. However, those who advocate these processes themselves do notrecognize the importance of the various preconditions for the processes of compensatorystructural adjustment, required to facilitate the realization of the objectives of structuraladjustment. The period TBGR – TBLX is the period of immiserization. Why should weuse the word immiserization? The induction of globalization and free marketenvironment brings about the international and national restructuring of production.The expected result of this process of restructuring is that there would be increase inefficiency and growth. But this process of structural adjustment itself leads to aperiod viz. TBGR – TBLX when there is lower efficiency and lower growth with thecountry concerned being worse off. This thesis of immiserization requires carefuldetailed analysis. Let us explore some empirical evidence about its validity.

Asia-Pacific Development Journal Vol. 7, No. 2, December 2000
13
We have worked out revealed comparative advantage indices for a largenumber of products at three digit SITC for the periods 1980-85, 1985-90, and1990-94 for seven developing countries namely, Hong Kong, China; India; Indonesia;the Republic of Korea; Malaysia; Singapore; and Thailand. We have also worked outthe rates of change in the wage rate in these different periods, for the different products.Based upon the pooled data of time series and cross section of countries, industrieshave been classified by the different categories of changes in the revealed comparativeadvantage (RCA) index and changes in the wage rates. Three broad categories ofchanges are defined as low, medium, and high, and the range considered for thesecategories is presented in table 7.
Table 7. Relationship between changes in RCA index andwage over period of time
LW MW HW
LR 11 23 45(Text-5, Apparels-2, (Text-2, Apparels-4, (Text-6, Apparels-6,I&S-1, Leather-1, I&S-3 Nelec-, Elec-1, I&S-4, Nelec-4,IndChem-1, Trans-3 Lea-, Footwr-3, Elec-6, Trans-2,OthChem-1) Ichem22, OChem-1) Lea-5, Footwr-3,
Ichem-4, Ochem-5)
MR 2 4 3(I&S-1, Elec-1) (Non-elec-3, Footwr-1) (Apparels-1, Ochem-2)
HR 9 24 27(Text-1, Nelec-1, (I&S-2, Nelec-5, (Text-2, Apparels-3,I&S-1, Trans-, Lea-1, Trans-3, Lea-4, I&S-3, Nelec-1,IndChem-1, Footwr-4, IndChem-4, Elec-2, Trans-4,OthChem-1) OthChem-2) Lea-3, Footwr-4, Ichem-3,
Ochem-2)
Notes: Analysis based on time series and cross-country pooled data for the periods 1980-85,1985-90, 1990-94 and for seven developing countries (Hong Kong China, India, Indonesia,
Republic of Korea, Malaysia, Singapore, Thailand).
LR = Low increase in RCA indices LW = Low increase in wage rateMR = Medium level of increase in RCA indices MW = Medium increase in wage rate
HR = High increase in RCA indices HW = High increase in wage rate
Low growth indicates negative to 1 per centMedium growth indicates above 1 per cent to 5 per centHigh growth indicates 5 per cent and above.

Asia-Pacific Development Journal Vol. 7, No. 2, December 2000
14
It is observed that there are 45 cases of shifts in which high growth rate ofwages is accompanied by low increase in the rates of revealed comparative advantageand similarly there are 23 cases of medium growth rate of wages combined with lowrates of change in the revealed comparative advantage. This means, there are 68 outof 148 cases, or 46 per cent of the cases, where there is a strong positive associationbetween a large increase in the wage rate and low increase in the revealed comparativeadvantage. Hence, this seems to confirm the hypothesis that in the early phase ofstructural change, rapid increase in wage rates tends to adversely affect the sustainabilityof comparative advantage.
Using the criteria presented by UNIDO, industries have been classified aslow technology, medium technology, high technology and the rest. The profile ofgrowth in the revealed comparative advantage and that in the wage rate are presentedin table 8 for the periods 1980-85, 1985-90, and 1990-94 for seven countries whichhave participated in the process of global restructuring in different periods over thepast two to three decades. Of course, it is very difficult to draw categorical inferencesabout the cause and effect relationship between wage growth and shifts in RCA.However, some broad indications of the direction could be interesting. For India,extensive globalization and effective restructuring have begun in recent years. It isinteresting to note that for low technology industries, for which India can claim tohave some revealed comparative advantage, there has been very high wage growth in1985-90 and this has implied loss in the revealed comparative advantage level. Thoughthere seems to be some gain in the RCA for medium technology industries during1985-90, the period 1990-94 seems to have experienced persistent growth rate inwage rates and a sharp fall in the RCA. This inverse relationship between wagegrowth and RCA has also been seen in the case of high technology industries. Thus,for India, the hypothesis of immiserization implicit in rapid integration with the worldeconomy seems to be holding good in the sense that India has been losing itscomparative advantage in the low technology industries due to wage rate increasesand at the same time it has not been gaining any significant comparative advantage inthe other industrial categories. This inverse relationship seems to be valid also forIndonesia between 1985-90 and 1990-94 for the low and medium technology industries.
It is necessary to reiterate at this stage that the thesis of immiserization impliedin global restructuring of production is a subject which deserves very careful analysisby researchers and practitioners in a quantitative framework so that suitable institutionalchanges and policy guidelines could be derived for avoiding the adverse effects ofrapid globalization and structural changes on the patterns of comparative advantage.

Asia-Pacific Development Journal Vol. 7, No. 2, December 2000
15
Table 8. Growth in revealed comparative advantage and wage rate acrossindustries in selected developing countries between 1980 and 1994
(per cent)
PeriodsCountries Industry Specification
1980-85 1985-90 1990-94
Low technologyRCA growth 70.2 -16.3 -8.8Wage growth 24.3 9.9 –
Medium technologyRCA growth 115.4 45.2 9.5Wage growth 27.9 12.8 –
High technologyRCA growth 317.8 -5.4 25.2Wage growth 7.3 18.4 –
Low technologyRCA growth 8.8 -9.2 0.0Wage growth 7.4 30.5 6.3
IndiaMedium technology
RCA growth -43.1 145.9 10.9Wage growth 20.0 17.3 22.1
High technologyRCA growth -30.0 -19.4 -2.1Wage growth 11.4 18.3 11.1
Low technologyRCA growth -69.6 347.0 -5.1Wage growth 31.4 7.0 21.2
IndonesiaMedium technology
RCA growth -77.0 155.7 -10.3Wage growth 11.5 10.2 28.7
High technologyRCA growth -94.2 51.3 250.8Wage growth 4.9 11.3 31.5
Low technologyRCA growth -14.9 -6.1 -24.5Wage growth 10.1 – –
Medium technologyRCA growth -0.4 39.9 89.0Wage growth 16.9 – –
High technologyRCA growth 9.1 42.6 46.3Wage growth 6.5 – –
Low technologyRCA growth -8.4 -15.3 -29.1Wage growth 13.0 5.3 5.9
MalaysiaMedium technology
RCA growth 41.0 -24.9 39.1Wage growth 12.2 7.0 14.6
High technologyRCA growth -6.4 -15.2 -10.5Wage growth 2.1 1.4 4.0
Low technologyRCA growth -5.3 -20.3 -37.5Wage growth 8.5 2.6 –
Medium technologyRCA growth 98.2 -13.5 -18.9
Singapore Wage growth 9.8 9.5 –
High technologyRCA growth -3.3 -8.3 13.4Wage growth 4.4 – –
Low technologyRCA growth -20.6 -31.3 -21.6Wage growth – 9.9 12.5
ThailandMedium technology
RCA growth 27.7 -20.9 44.3Wage Growth – 14.8 8.9
High technologyRCA growth -47.4 6.2 43.4Wage growth – 38.3 5.6
Source: UNCTAD, Year Book of International Trade Statistics, vol. 1, various years and UNIDO,Industrial Statistics Year Book, various issues.
Notes: – Low technology consists of textile and manufactures, apparels, leather etc., footwear,iron and steel
– Medium technology consists of chemicals– High technology consists of machinery and transport equipment
Republic ofKorea
Hong Kong,China

Asia-Pacific Development Journal Vol. 7, No. 2, December 2000
16
III. PARADOX OF GROWING UNEMPLOYMENT IN A FRAMEWORKOF FULL EMPLOYMENT GOALS
Today, both the developed and developing countries are caught in the paradoxof growing unemployment while pursuing full employment models of development.The very process of structural adjustment and relocation of industries across the globebrings out this conflict between full employment goals and the experience of growingunemployment. In recent years, the strategies of globalization and liberalization andthe strategies giving increasing importance to the market have resulted in bringinginto sharp focus the contradictions between full employment goals and the groundrealities of rising unemployment. It is possible to term this contradiction betweenexpectations and reality as a paradox or an anomaly and it is an issue which deservesto be carefully examined.
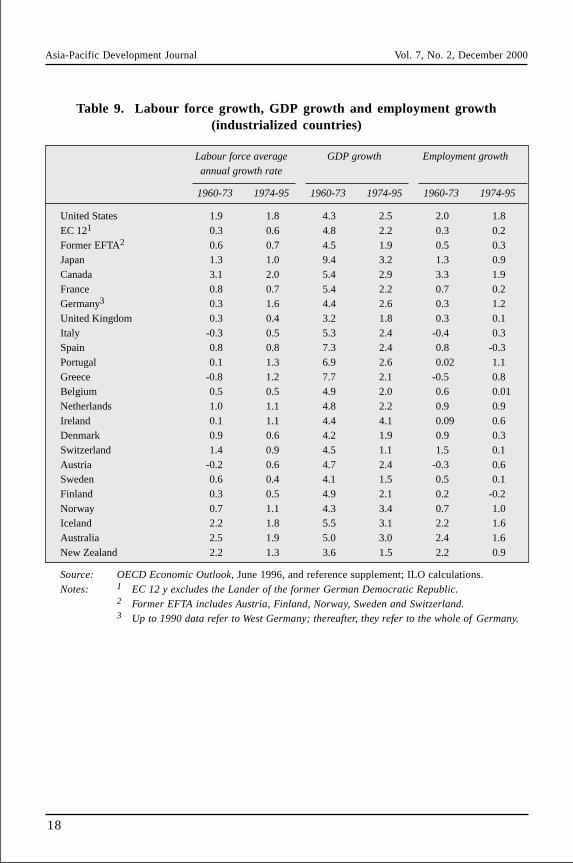
The World Employment Report of 1996-97 provides information on the annualgrowth rate of labour force and the annual growth rate of employment for the developedcountries for the periods 1960-73 and 1974-95. The employment growth in the UnitedStates in the latter period was 1.8 per cent as against 2 per cent in the former period.In the EU12 also the employment growth in the period 1974-95 was marginally lowerthan that in the period 1960-73. In Japan, it was 0.9 per cent in 1974-95, as against1.3 per cent in 1960-73. Similarly, growth rates of employment for the respectiveperiods were 0.2 per cent and 0.7 per cent for France and 0.01 per cent and 0.6 forBelgium, 1.6 per cent and 2.4 per cent for Australia, and 0.1 per cent and 0.3 per centfor the United Kingdom of Great Britain and Northern Ireland. The employmentgrowth rates for the periods 1974-95 have been in most cases lower than the growthrate of the labour force, raising the question as to whether employment has beengiven the importance it deserves in the development process. Apart from the facts ofthe case, there has also been public expression about the increasing unemploymentrates in many of the developed countries in the 1980s. Reflections of this phenomenonhave induced some analysts to describe the growth profile of the 1980s and 1990s asthe profiles of jobless growth and many issues have been raised about the possiblecauses for the phenomenon. It is argued that imports of goods produced with cheaplabour in the developing countries and the phenomenon of rapid labour-displacingtype of technological change have been the causal factors for the continued loss ofjobs in these countries. The apprehension that cheap imports from the developingcountries have caused these losses of jobs has increased the neo-protectionist tendenciesin the developed world and has also resulted in the adoption of many non-tariff barriersand restrictive policies aimed at curbing the flow of imports.
The ILO Convention No. 122 has categorically stated that full employmentshould mean full productive and freely chosen employment and not simply fullemployment in the statistical sense. Taken in this manner, the present unemploymentrates would be underestimates of the true unemployment rates in these economies. It

Asia-Pacific Development Journal Vol. 7, No. 2, December 2000
17
is also observed that the periods of the 1970s and 1980s have experienced an increasein wage inequalities and this is attributed to the liberalized flow of international tradeand increase in imports from the developing countries having relatively cheaper labour.Many studies have also brought out that the technological changes, that havesimultaneously occurred in the developed countries, have also been responsible forthe job losses. These periods have also seen a slowing down of growth and investmentper worker in equipment and also a relatively slower acceleration in productivitygrowth in the skill-intensive industries.
The main message of this fear of jobless growth in the world is that thestrategies of development and the policies of liberalization and globalization as partof the reforms package will have to be chosen very carefully in the developingcountries. In particular, South Asia with the large population size and highly alarmingunemployment and poverty situation cannot ignore the messages and lessons drawnfrom these past experiences.
IV. PARADOX OF MARKET IMPERFECTIONS
Most of the models and the policy prescriptions, both at the national leveland at the international level, are based upon the assumption of perfectly competitivemarkets. Multilateral organizations like the erstwhile General Agreement on Tradeand Tariffs (GATT) and the present World Trade Organisation (WTO), have the avowedobjective of bringing about a free and competitive world trading environment. All theagreements of WTO and the policies adopted as part of the reform process are alsoaimed at introducing a perfectly competitive market. The proposed multilateralagreement on investment has also built into it the thesis of competitive environmentfor the freer flow of capital. Many of the tools of analysis such as, total factorproductivity, domestic resource cost, benefit cost analysis, are all based upon theassumption of a perfectly competitive market. However, the ground reality is incontrast to the expectations that these models and strategies are generating. There arethree reasons for asserting that market imperfections have increased in recent years.These are: a) intensification of non-tariff measures; b) growing transnationalizationof production, including the adoption of non-competitive policies and increasingmergers and acquisitions, and c) increasing asymmetry of information.
Intensification of non-tariff measures
While the various rounds of tariff negotiations conducted earlier under theauspices of the GATT, including the latest Uruguay Round of trade negotiations, wereaimed at liberalizing the trading environment by gradual elimination of tariffs asbarriers to trade, the world has seen a consistent expansion of non-tariff measures andimposition of various trade restrictive impediments. Table 10 gives a profile of thevarious non-tariff measures now in practice, particularly in the policy basket of the
Asia-Pacific Development Journal Vol. 7, No. 2, December 2000
18
Table 9. Labour force growth, GDP growth and employment growth(industrialized countries)
Labour force average GDP growth Employment growth
annual growth rate
1960-73 1974-95 1960-73 1974-95 1960-73 1974-95
United States 1.9 1.8 4.3 2.5 2.0 1.8EC 121 0.3 0.6 4.8 2.2 0.3 0.2Former EFTA2 0.6 0.7 4.5 1.9 0.5 0.3Japan 1.3 1.0 9.4 3.2 1.3 0.9Canada 3.1 2.0 5.4 2.9 3.3 1.9France 0.8 0.7 5.4 2.2 0.7 0.2Germany3 0.3 1.6 4.4 2.6 0.3 1.2United Kingdom 0.3 0.4 3.2 1.8 0.3 0.1Italy -0.3 0.5 5.3 2.4 -0.4 0.3Spain 0.8 0.8 7.3 2.4 0.8 -0.3Portugal 0.1 1.3 6.9 2.6 0.02 1.1Greece -0.8 1.2 7.7 2.1 -0.5 0.8Belgium 0.5 0.5 4.9 2.0 0.6 0.01Netherlands 1.0 1.1 4.8 2.2 0.9 0.9Ireland 0.1 1.1 4.4 4.1 0.09 0.6Denmark 0.9 0.6 4.2 1.9 0.9 0.3Switzerland 1.4 0.9 4.5 1.1 1.5 0.1Austria -0.2 0.6 4.7 2.4 -0.3 0.6Sweden 0.6 0.4 4.1 1.5 0.5 0.1Finland 0.3 0.5 4.9 2.1 0.2 -0.2Norway 0.7 1.1 4.3 3.4 0.7 1.0Iceland 2.2 1.8 5.5 3.1 2.2 1.6Australia 2.5 1.9 5.0 3.0 2.4 1.6New Zealand 2.2 1.3 3.6 1.5 2.2 0.9
Source: OECD Economic Outlook, June 1996, and reference supplement; ILO calculations.Notes: 1 EC 12 y excludes the Lander of the former German Democratic Republic.
2 Former EFTA includes Austria, Finland, Norway, Sweden and Switzerland.3 Up to 1990 data refer to West Germany; thereafter, they refer to the whole of Germany.

Asia-Pacific Development Journal Vol. 7, No. 2, December 2000
19
Table 10. List of NTBs imposed by select developed countries
Australia:Tariff quota (code 101)Antidumping duty (code 102)Antidumping price undertakings (code 103)Countervailing duty (code 104)Price control measures (n.e.s.) (code 105)License for sensitive products (code 106)Prohibition for sensitive products (code 107)Technical standards (code 108)Labelling requirements (code 109)
EU:Tariff quota (code 101)Seasonal tariff rates (code 102)Variable changes n.e.s. (code 103)Antidumping investigations (code 104)Antidumping duties (code 105)Automatic licensing measures (code 106)Import monitoring (code 107)Retrospective surveillance (code 108)Non-automatic licence (code 109)Prior authorization (CITES) (code 110)Quotas (code 111)Bilateral quota (code 112)Quota in relation to Montreal Protocol (code 113)Prohibition for environmental protocol (code 114)Import monopoly (code 115)Product characteristics requirements (code 116)
Japan:Tariff quota (code 101)Seasonal tariff rates (code 102)Variable changes n.e.s. (code 103)Antidumping duties (code 104)Automatic licensing (105)Non-automatic licence (code 106)Authorization (code 107)Authorization for wildlife protection (code 110)Authorization ensure national security (code 111)Authorization for political reasons (code 112)Global quota (code 113)Quota for sensitive products (code 114)State monopoly of imports (code 122)Sole importing agency (code 123)Technical requirements (code 124)

Asia-Pacific Development Journal Vol. 7, No. 2, December 2000
20
Table 10. (continued)
Japan: (continued)
Product characteristics requirements to protect human health (code 125)Product characteristics requirement to protect environment (code 127)Product characteristics requirement to protect wildlife (code 128)Marking requirements to protect environment (code 132)Lableing requirement for human health protection (code 133)Testing, inspection and quarantine requirements (code 134)Technical measures n.e.s. (code 136)
United States:Tariff quota (code 101)Seasonal tariff low rates (code 102)Seasonal tariff high rates (code 103)Import monitoring (code 104)
Source: UNCTAD, Trade Analysis and Information System.For Analysis see Rajesh Mehta and S.K. Mohanty (1999), WTO and Industrial Tariffs – An
Empirical Analysis for India, New Delhi, Research and Information System for theNon-Aligned and Other Developing Countries.
developed countries. We find that Australia adopts nine types of Non-Tariff Barriers(NTBs), the EU has in practice 16 types of NTBs, Japan has 22 types of NTBs, whilethe United States is shown to be adopting four types of NTBs. Of course, in theUnited States the import monitoring practice covers a large number of undefinedNTBs. It is also known that many policy measures such as 301, Super 301,anti-dumping measures, health related barriers are also adopted by the United States.The induction of such NTBs obviously creates problems for effective market accessfor the goods of the developing countries and this would, in turn, generate distortionsin the free play of market forces. It should be noted that there is now increasingpressure by the developed countries for introducing many new considerations such as,labour standards, social clauses, environment standards, human rights, etc. in policiesconcerned with trade flows. It is legitimately feared that all these new measureswould increase market imperfections and thereby disturb the operation of the freeplay of the natural forces of comparative advantage.
Transnationalization of production and non-competitive policies
Further, the growing transnationalization of production and the varieties ofmergers and acquisitions that are taking place in the corporate world have allcontributed to the accentuation of market imperfections. UNCTADs World InvestmentReports have been describing how the size and distribution of international production

Asia-Pacific Development Journal Vol. 7, No. 2, December 2000
21
by the transnational corporations (TNCs) and hence their role in the world economyhave been increasing by leaps and bounds. The relevant excerpts from the WorldInvestment Report 1998 clearly bring out this point: “The size and distribution ofinternational production by TNCs – and hence their role in the world economy – canbe gauged from estimates of the worldwide FDI stock, assets, sales, gross product andexports of these firms. Indeed, all major indicators related to FDI and TNC activitiesshowed higher rates of growth in 1997 (as in 1996) than did GDP and exports,compensating for the decline in growth during 1991-1995 that reflected the recessionof the early 1990s. More specifically, world FDI stock, which constitutes the capitalbase for TNC operations, rose by over 10 per cent in 1997, to reach an estimated$3.5 trillion. It is held by a minimum of 53,000 TNCs – large and small. Theregional distribution of outward FDI stock is heavily skewed towards developedcountries, reflecting the fact that, in the past, most FDI originated and stayed indeveloped countries, though there are some noticeable recent increases in the stock ofdeveloping countries.”
Furthermore, it is striking that the cross-border mergers and acquisitionsaccount for the bulk of FDI inflows and their share in total FDI inflows rose from49 per cent in 1996 to 58 per cent in 1997 representing the highest share in 1990s.These cross-border mergers and acquisitions have the obvious effect of creating globalmonopolies and hence strategic economic power centres.
Transnationalization of production has also implied expansion of intra-industryand intra-firm trade defying all received norms of trade behaviour. The fact that themultinationals can now determine their prices as part of their global corporate strategy– not necessarily influenced by the short-run supply-demand considerations – hasadded strength to the thesis that international prices are not themselves free from theeffects of market distortions. This is a matter of serious analytical concern, becausein many studies analysing the nature of distortions in the domestic markets internationalprices are taken as benchmark prices free from market distortions. This approachwould be of doubtful validity when one finds that international prices are also loadedwith many distortion effects. Further, it is now widely recognized that many eventssuch as mergers and acquisitions, and intra-firm trade imply an anti-competitiveenvironment and that there is need for a competition policy to discipline the actionsof the multinationals.
Asymmetry of information
Yet another factor contributing to market imperfections is the asymmetry ofinformation access at the disposal of the different players in economic space. It isironical to note that the world information order is highly iniquitous despite theexplosive expansion of information technologies and the communication infrastructure.This asymmetry is caused by the high speed at which the new technologies generate

Asia-Pacific Development Journal Vol. 7, No. 2, December 2000
22
and disseminate information due to the massive expansion in the volume of informationon the one hand and, on the other, the continued sluggishness and incapabilities thatpersist in large sections of the global society in particular in the developing world toacquire new technologies, access information, sift the relevant from the irrelevant anddraw inferences for decision-making from the analysis of the relevant information.This mismatch between the growth and supply of information and the capability toutilize information has been increasing in intensity and scope with a rapid pace. Thisasymmetry in the information order has significantly affected the capability of manyplayers in the economic space to take advantage of the emerging opportunities fortrade and production. Further, it has adversely affected the productivity of thosecorporate entities which are not keeping pace with the speed of information flows andit has also changed the character of the labour markets by generating a demand for anew variety of skilled labour. In short, the iniquitous information order has significantlydamaged the established patterns of comparative advantage in trade and technologytransfers. For facilitating the optimum use of resources at the global level, the marketimperfections caused by the iniquitous information order need to be corrected.
V. PARADOX OF THE WTO TRADING SYSTEM
As we all know, the Uruguay Round of trade negotiations spanned over along period of seven years ultimately culminated in the establishment of the WTO in1995 as one of the most powerful supranational bodies. The Uruguay Round has hadmany unique distinctions in comparison with the earlier rounds. It brought intothe arena of trade liberalization many new sectors, such as agriculture, textiles,trade-related intellectual property rights, and services. Its focus on the gradualelimination of tariff and non-tariff barriers to trade has been one of the core aspectsof the negotiation process. Thus, liberalization of market access and, in general,effective market access, has been the much cherished objective of the new tradingsystem.
Has the Uruguay Round achieved this objective? Is the WTO well disposedto bring about a free and fair trading order? A detailed empirical analysis of theexperiences in regard to the implementation of the various WTO agreements and themarket access commitments brings out many revealing and disturbing facts on thedivergence between expectations and the ground realities. Some of these new insightson the emerging world trading system are presented here.
Gap between the expected growth and the actual growth of world trade
It was hoped that world trade would register an expansion of more than20 per cent as a result of the liberalization process introduced by the new world tradeorder under WTO. The growth rate experienced during 1996-1998 does not raise any

Asia-Pacific Development Journal Vol. 7, No. 2, December 2000
23
confidence that a major expansion in world trade would soon be realized. It is worthnoting that the rate of growth in the volume of merchandise exports slowed down to3.5 per cent in 1998 from the level of over 10 per cent in 1997. The projections forthe year 1999 suggest some recovery, provided recovery in Asia is realized.
Table 11 brings out that 1997 experienced somewhat larger growth in worldexports and imports and also regional exports and imports after a moderate performancein the year 1996 immediately after the launching of the WTO. However, this boom inworld trade activity was short-lived, partly because it was not matched by worldoutput. The sluggishness of world output during 1996 to 1998 is brought out intable 12. This brings out that even though world exports in 1997 increased by10.5 per cent, the growth rate of world output was stagnant at 3.3 per cent. In fact,there has been deceleration in world output in 1998 thus causing an upset in thegrowth of trade flows. The growth rate of output in Japan was 1.4 per cent in 1997compared to 5 per cent in 1996. The increase in the growth rate of output in theUnited States and EU in 1997 compared to 1996 was very marginal. The developingcountries output growth has also slowed down in 1997 being 5.4 per cent compared to5.8 per cent in 1996. Thanks to the sudden crisis in the Asian region the growth rateof output in 1998 has come down to 1.8 per cent in developing countries and become
Table 11. Growth in world exports and imports
Average Exports Average Imports
1990-95 1996 1997 1998 1990-95 1996 1997 1998
World 6.0 5.5 10.5 3.5 6.5 6.0 9.5 4.0
North America* 7.0 6.0 11.0 3.0 7.0 5.5 13.0 11.0
Latin America 8.0 11.0 11.0 6.5 12.0 8.5 22.0 9.5
Western Europe 5.5 5.5 9.5 4.5 4.5 5.5 7.5 7.5
European Union(15) 5.5 5.5 9.5 5.0 4.5 5.0 7.0 7.5
Transition economies 5.0 6.5 12.5 10.0 2.5 16.0 17.0 10.0
Asia 7.5 5.0 13.0 1.0 10.5 6.0 6.0 -9.0
Japan 1.5 1.0 12.0 -1.5 6.5 5.5 1.5 -6.0
East Asian six** 11.5 7.5 11.5 2.0 12.0 4.5 6.5 -16.0
* Canada and the United States.** Taiwan Province of China, Hong Kong, China, Malaysia; the Republic of Korea; Singapore
and Thailand.Note: Separate volume data are not available for Africa and the Middle East, although estimates
for these regions have been made in order to calculate.

Asia-Pacific Development Journal Vol. 7, No. 2, December 2000
24
Table 12. World output, 1990-98(percentage change over previous year)
Region/Country 1990-95 1996 1997 1998
World 1.9 3.3 3.3 2.0Industrialized countries of which: 1.7 2.9 2.9 2.2United States 2.3 3.4 3.9 3.9Japan 1.4 5.0 1.4 -2.8
European Union of which: 1.3 1.6 2.5 2.7Euro area 1.4 1.4 2.3 2.8Germany 1.7 0.8 1.8 2.3France 1.1 1.1 2.0 3.2Italy 1.1 0.9 1.5 1.4United Kingdom 1.2 2.6 3.5 2.1Transition Economies -8.2 -1.5 1.4 -1.3
Developing countries of which: 4.9 5.8 5.4 1.8Latin America 3.3 3.6 5.4 2.1China 12.4 9.6 8.8 7.8Other countries 5.1 6.4 5.0 -0.3
Memo Item:Developing countries, excluding China 4.0 5.2 4.8 0.8
Source: UNCTAD secretariat calculations, based on data in 1990 dollars.a) Annual average; b) Estimated
-2.8 per cent for Japan in 1998. In other words the expected growth profile of outputand trade as a result of the new trading regime under WTO have not been realized atall thus far.
It is also worth noting that the period 1996-98 has experienced significantdeterioration in the terms of trade of many developing countries. Table 13 brings outthe magnitude of the deterioration for a number of the developing countries in Asiaand Latin America during 1996-1998. The terms of trade of the Republic of Koreahave declined by 12.4 per cent in 1996 and 11.3 per cent in 1997. Those of Indonesiaand Malaysia have also declined for 1996 and there has not been any significantchange in them in 1997 and 1998. The terms of trade of Singapore, Indonesia,Malaysia, Brazil and Mexico have all declined in 1996 and there has not been anysignificant change in 1997 and 1998. The terms of trade of India have declined by5.3 per cent in 1997 but there has been a marginal improvement in 1997 and anincrease of 3.2 per cent in 1998. Philippines and Nicaragua also experienced asignificant decline in the terms of trade in 1996.

Asia-Pacific Development Journal Vol. 7, No. 2, December 2000
25
Table 13. Terms of trade of selected developing Asian andLatin American economies, 1997 and 1998
(percentage change over previous year)
Economy 1996 1997 1998
Hong Kong, China 0.9 -0.8 1.5Republic of Korea -12.4 -11.3 0.2Singapore -0.8 0.4 0.9Taiwan Province of China 2.0 3.9 -0.6Indonesia -0.7 -0.5 0.0Malaysia -0.7 1.1 1.7Philippines -3.5 -0.4 4.5Thailand 1.1 -1.6 5.2India -5.3 0.7 3.2China 3.6 2.9 2.1Argentina 8.8 1.0 -4.5Brazil -1.8 5.8 0.0Chile -17.0 5.8 -10.5Colombia 0.8 7.3 -6.2Mexico -0.9 -1.5 -2.8Nicaragua -7.6 7.7 6.3Venezuela 18.6 -2.0 -22.7
Source: UNCTAD, Trade and Development Report, 1999.
The analysis suggests out that the growth dynamism in output and trade andalso fairer distribution of the benefits from trade expected in the new world tradingsystem have not been realized in the manner anticipated and projected during theUruguay Round of trade negotiations.
Even though part of the collapse in world trade growth is attributable to theunexpected Asian crisis, there is no evidence as yet that trade liberalization envisagedunder the WTO regime would bring about any radical expansion in world trade ingeneral and in the export trade of the developing countries in particular. Thisphenomenon combined with sluggish recovery in Europe and in Japan could continueto dampen the world trading environment for some considerable time.
Asymmetry in implementation
While the developing countries have been implementing their WTOcommitments in an effective manner, the developed countries have not been showingthe same kind of enthusiasm in honouring their commitments. Agricultural subsidiesin the EU have either not been reduced in their explicit form or are being substitutedby varieties of implicit instruments. A number of green box measures such as,

Asia-Pacific Development Journal Vol. 7, No. 2, December 2000
26
decoupled income support, R&D expenditure on agriculture, and also the continuedhuge investment in the agriculture infrastructure adopted in the developed countrieshave frustrated the expected advantages of market access in the developed countriesfor the products of the developing countries.
Existence of high peak tariffs
Trade liberalization and market access commitments by the developingcountries have been much greater than those made by the developed countries.A critical analysis of market access offers brings out that the developed countrieshave maintained high tariff rate peak and also specific duties whose ad volermequivalence is very high for many products of export interest to the developingcountries. By this definition, one finds that 881 tariff lines at the six digit level aresubject to peak tariffs in the case of the EU, while the number of items with peaktariffs is 751 for Japan and 986 for the United States. One finds that the peak tariffsin the case of footwear and leather apparels are as high as 160 per cent in the case ofJapan and 42 per cent in USA. It is interesting to note that China has been maintainingvery high tariff rate peaks on its imports from the rest of the world. Table 14 bringsout this anomaly in a striking manner. Thus, even though the average tariff rates ofthe developed countries come out to be very small, the tariff rates faced by the productsof export interest of the developing countries remain quite high. These hiddenasymmetries in market access result in making the developing countries open up theirmarkets to the products of the developed countries to a much greater extent than whatthey have received on a reciprocal basis as market access in the developed countries.This could mean that the adverse balance of trade situation faced by the developingcountries would be further worsened thereby generating ripple effects on the pace ofdevelopment and speed of employment generation.
Trade not an engine of growth
Much of the literature on trade that originated in the 1970s and the 1980shad advocated, on the basis of both analytical and empirical studies, that trade is, ingeneral, an engine of growth and that, in particular, the developed countries play therole of propelling this growth by offering market access and by transferring resourcesand technology to the developing world. It is true that this paradigm of trade, growthand technology transfer seems to have worked well for more than two decades in thepost-world war period until 1973 when the first oil price shock shook the worldeconomy. It was also the beginning of the collapse of the Bretton Woods system andthe emergence of a highly volatile exchange rate regime. Chart 3 shows that theaverage growth rate of GDP of the G-7 countries for the period 1960-73 was around4.9 per cent, while it was around 2.5 per cent in the period from 1973-1993. Chart 4brings out that this slowing down of the G-7 countries is expected to persist even

Asia-Pacific Development Journal Vol. 7, No. 2, December 2000
27
Chart 4. Persistent differences in long-term growth rates(average annual per cent growth in GNP)
Forcast
1974-1990 1991-1993 1974-1993 1994-2003
The G-7 countries 3.2 1.2 2.9 2.7
All non-industrial countries 3.4 0.9 3.0 4.8
Sub-Saharan Africa 2.1 1.7 2.0 3.9
Middle East and North Africa 0.9 3.0 1.2 3.8
Europe and Central Asia 3.1 -9.8 1.1 2.7
South Asia 5.0 3.5 4.8 5.3
East Asia 7.3 8.3 7.5 7.6
Latin America and the Caribbean 2.5 3.2 2.6 3.4
Source: Global Economic Prospects and the Developing Countries, (Washington DC, The World
Bank, 1997).
Chart 3. The drop in G-7 country growth rates(average annual per cent change in GNP)
Source: IMF International Financial Statistics.

Asia-Pacific Development Journal Vol. 7, No. 2, December 2000
28
Table 14. Peak tariff* of different countries:a summary result for 1998
Number of lines** with peak tariff
Country TR • 12 statistical formula
TR • M + SD
Australia 8811 253(12-587)
EU 8612 1 456(12-86.1)
Japan 7513 106(12-800)
United States of America 9864 884(12-58.8)
India5 4 064 2(15-180)
Republic of Korea6 21 15(17-821)
Malaysia7 74 10(12-829)
Source: Mehta, Rajesh and S.K. Mohanty (1999), WTO and Industrial Tariffs – An Empirical Analysis
for India, Research and Information System for the Non-Aligned and Other DevelopingCountries, New Delhi, India.
Notes: 1 includes 16 commodities with specific duties.2 includes 23 commodities with specific duties.3 includes 84 commodities with specific duties.4 includes 260 commodities with specific duties.5 for the year 19996 for the year 19967 for the year 1997* HS 25-97** National lines
during the period 1994-2003 while the growth prospects of the non-industrial countriesare expected to be better than those of the developed countries.
It is observed that the share of the developed countries in the total exports ofthe developing countries has been declining in recent years. The East Asian economieswere expected to be alternative engines of growth in the late 1980s and the early1990s. However, their sudden collapse in the late 1990s has belied this expectation.While export orientation is, by and large, accepted as a useful strategy for theimprovement of efficiency and of growth prospects in the developing world, it is

Asia-Pacific Development Journal Vol. 7, No. 2, December 2000
29
feared that in the absence of dynamic partners to absorb the increasing volumes oftrade, the limited size of markets may result in what is now being called the “fallacyof composition” in the literature on trade. If the developing countries clamour for anexpansion of their market penetration for the same or similar goods in the limitedmarket space, they may end up in competing with each other and may force some sortof fall in export prices and hence deterioration in their terms of trade. In order tokeep the volume of trade expanding, the exporting countries will have to undertakevery rapid shifts in the commodity composition and in the geographical pattern oftheir trade. This would also imply significant changes in the technological basis ofthe production and in the marketing activities and hence in the overall structure ofemployment. This subtle aspect of the emerging trading system without the emergenceof new engines of growth could imply the frustration of the well-established linkagesbetween trade, technology, development and employment.
VI. SUMMING UP
This paper has presented some situations of what may be called paradoxes oranomalies of recent vintage. The purpose in this illustrative tour of recent economicphenomena is to bring out that there is increasing contradiction between the expectationsderived from the received models and strategies and the ground realities of economicphenomena. A critical appraisal of economic history reveals that whenever suchcontradictions between expectations and realities are recognized by thinking minds,there is a creation of new models, theories and policy prescriptions. We have alsolearnt from economic history that paradoxes and anomalies have been fertile groundfor intensive quantitative research and new perceptive analysis. However, it isparadoxical to find that the recent phenomena of anomalies and paradoxes do notseem to have stimulated much analytical work and quantitative studies aimed atexamining the issues involved in them and for deriving suitable policy guidelines.We hope that the issues raised in this paper would inspire both theoreticians andpractitioners to reflect afresh upon the development paradigm and developmentstrategies that are currently being pursued in different countries of the world.

Asia-Pacific Development Journal Vol. 7, No. 2, December 2000
30
REFERENCES
Aizenman, J. and N.P. Marion, 1993. “Policy uncertainity, persistence and growth”, Review of InternationalEconomics 1, pp. 145-63.
Alesina, A. and A. Drazen, 1991. “Why are stabilizations delayed?”, American Economic Review 81(5),December, pp. 1170-88.
Bhattacharya, B.B., R.B. Barman and A.K. Nag, 1994. “Stabilization policy options: a macroeconomicsnalysis”, Development Research Group, RBI, Study 8, Mumbai.
Bleaney, Michael and David Fielding, 1999. Exchange rate regimes, inflation and output volatility indeveloping countries, University of Nottingham, UK, Centre for Research in EconomicDevelopment and International Trade, Research Paper, No. 99/4.
Bleaney, Michael, Norman Gemmell and David Greenaway, 1995. “Tax revenue instability, with particularreference to Sub-Saharan Africa”, The Journal of Development Studies, vol. 31, No. 6, August1995, pp. 883-902, London, Frank Cass.
Bretton Woods Commission 1994: Looking to the Future (Commission Report, Staff Review, BackgroundPapers).
Dewachter, Hans, 1995. “Divergence indicators and the volatility smoothness in semi-fixed exchangerate regimes”, Welwirtschaftliches Archiv Review of World Economics, Band 131, Heft 2,pp. 695-707, Germany, Kiel Institute of World Economics.
Eatwell, John, Murray Milgate, and Peter Newman eds., 1988. The New Palgrave: A Dictionary ofEconomics, volume 3 K to P (London, The Macmillan Press Limited).
Gavin, M.R. Hausmann and L. Leiderman, 1995. “The macroeconomics of capital flows to LatinAmerica: experience and policy issues”, Inter-American Development Bank Working Paper,Washington DC.
Garbel, Ilene, 1995. “Assessing the impact of financial liberalization on stock market volatility in selecteddeveloping countries”, The Journal of Development Studies, vol. 31, No. 6, August 1995,pp. 903-917, London, Frank Cass.
Hausmann, R., 1955. “En camino hacia una mayor integraction con el Norte”, in M. Aparicio andW. Easterly. Eds., Crecimiento economico: teoria, instituciones experiencia internacional,Bogota, Banco de la Republica and the World Bank.
Hausmann, R., M. Gavin and others, 1995., “Overcoming volatility in Latin America”, in Report onEconomic and Social Progress in Latin America (Washington DC, Inter American DevelopmentBank).
Hausmann, Ricardo and Helmut Reisen. eds., 1996. Securing Stability and Growth in Latin America:Policy Issues and Propsects for Shock-Prone Economies (Paris, Organisation for EconomicCooperation and Development Centre).
Mishkin, Frederic. S., 1999. “Global financial instability: framework, events, issues”, Journal of EconomicPerspectives, vol. 13, No. 4.
Mehta, Rajesh and S.K. Mohanty, 1999. WTO and Industrial Tariffs – An Empirical Analysis for India,New Delhi, Research and Information System for the Non-Aligned and Other DevelopingCountries.
Panchamukhi, V.R., 1997. “Globalization, competition and economic stability”, Fifth Dr D.T. LakdawalaMemorial Lecture, Bhavnagar, Ahmedabad, 22 February 1997.

Asia-Pacific Development Journal Vol. 7, No. 2, December 2000
31
_______ 1999. “Trade, technology and employment – a profile of systemic dilemmas and paradoxes”,Keynote Paper presented at the 41st Annual Conference of the Indian Society of LabourEconomics, Mumbai, 18-20 November 1999, unpublished.
Ramey, G. and V.A. Ramey, 1994. “Cross-country evidence on the link between volatility and growth”,Working Paper 4959 (Cambridge, Massachusetts, National Bureau of Economic Research).
Rao, M.J. Manohar, 1993. “Excessive exchange rate volatility: a possible explanation using chaos theory”,Journal of Foreign Exchange and International Finance, vol. VII, No. 3, April-June 1993,pp. 279-30.
Rao, M.J. Manohar and Balwant Singh, 1995. Analytical foundations of financial programming andgrowth oriented adjustment, Development Research Group, Mumbai, Reserve Bank of India.
World Bank, 1998. East Asia: The Road to Recovery (Washington DC, The World Bank).
(32 blank)