fishstatj manual - version 4.00.0, december 2019 · 2020-03-31 · fishstatj manual version 4.00.0...
TRANSCRIPT
FishStatJ Manual
Version 4.00.0 December 2019
Food and Agriculture Organization of the United Nations


FishStatJ Manual
Version 4.00.0 – December 2019
FOOD AND AGRICULTURE ORGANIZATION OF THE UNITED NATIONS Rome, 2019

Required citation: FAO. 2019. FishStatJ Manual. Version 4.00.0, December 2019. Rome.
The designations employed and the presentation of material in this information product do not imply the expression of any opinion whatsoever on the part of the Food and Agriculture Organization of the United Nations (FAO) concerning the legal or development status of any country, territory, city or area or of its authorities, or concerning the delimitation of its frontiers or boundaries. The mention of specific companies or products of manufacturers, whether or not these have been patented, does not imply that these have been endorsed or recommended by FAO in preference to others of a similar nature that are not mentioned.
The views expressed in this information product are those of the author(s) and do not necessarily reflect the views or policies of FAO.
ISBN 978-92-5-131993-2 © FAO, 2019
Some rights reserved. This work is made available under the Creative Commons Attribution-NonCommercial-ShareAlike 3.0 IGO licence (CC BY-NC-SA 3.0 IGO; https://creativecommons.org/licenses/by-nc-sa/3.0/igo/legalcode).
Under the terms of this licence, this work may be copied, redistributed and adapted for non-commercial purposes, provided that the work is appropriately cited. In any use of this work, there should be no suggestion that FAO endorses any specific organization, products or services. The use of the FAO logo is not permitted. If the work is adapted, then it must be licensed under the same or equivalent Creative Commons licence. If a translation of this work is created, it must include the following disclaimer along with the required citation: “This translation was not created by the Food and Agriculture Organization of the United Nations (FAO). FAO is not responsible for the content or accuracy of this translation. The original [Language] edition shall be the authoritative edition.”
Disputes arising under the licence that cannot be settled amicably will be resolved by mediation and arbitration as described in Article 8 of the licence except as otherwise provided herein. The applicable mediation rules will be the mediation rules of the World Intellectual Property Organization http://www.wipo.int/amc/en/mediation/rules and any arbitration will be conducted in accordance with the Arbitration Rules of the United Nations Commission on International Trade Law (UNCITRAL).
Third-party materials. Users wishing to reuse material from this work that is attributed to a third party, such as tables, figures or images, are responsible for determining whether permission is needed for that reuse and for obtaining permission from the copyright holder. The risk of claims resulting from infringement of any third-party-owned component in the work rests solely with the user.
Sales, rights and licensing. FAO information products are available on the FAO website (www.fao.org/publications) and can be purchased through [email protected]. Requests for commercial use should be submitted via: www.fao.org/contact-us/licence-request. Queries regarding rights and licensing should be submitted to: [email protected].
iii
CONTENTS
1. About FishStatJ .................................................................................................... 1 2. Installation ............................................................................................................ 2
2.1. Installing on Windows ...................................................................................... 2 2.2. Windows troubleshooting ................................................................................. 7 2.3. Installing on macOS ....................................................................................... 10 2.4. macOS troubleshooting ................................................................................. 12 2.5. Workspaces (statistical data) ......................................................................... 14
3. File menu ............................................................................................................ 16 3.1. Manage workspaces ...................................................................................... 16 3.2. Open dataset... .............................................................................................. 27 3.3. Close workspace ........................................................................................... 30 3.4. Export selection (CSV file)... .......................................................................... 31 3.5. Exit ................................................................................................................. 32
4. Edit menu ............................................................................................................ 33 4.1. Select all ........................................................................................................ 33 4.2. Select none .................................................................................................... 34 4.3. Copy selection ............................................................................................... 35 4.4. Preferences ................................................................................................... 36
5. Data menu ........................................................................................................... 44 5.1. Filter... ............................................................................................................ 44 5.2. Aggregate ...................................................................................................... 49 5.3. Columns... ..................................................................................................... 52 5.4. Sort... ............................................................................................................. 56 5.5. Top/Other....................................................................................................... 58 5.6. Custom groups .............................................................................................. 61 5.8. Calculated columns... .................................................................................... 64
6. Format menu ...................................................................................................... 69 6.1. Column width ................................................................................................. 69 6.2. Number formatting ......................................................................................... 69 6.3. Symbols and colors ....................................................................................... 69
7. View menu .......................................................................................................... 70 7.1. Show details .................................................................................................. 70 7.2. Grand totals ................................................................................................... 73
8. Metadata menu ................................................................................................... 75 8.1. Show metadata... ........................................................................................... 75 8.2. Show notes… ................................................................................................ 77 8.3. Show citation… .............................................................................................. 79 8.4. Show map… .................................................................................................. 81
9. Help menu ........................................................................................................... 83 9.1. Getting started ............................................................................................... 83 9.2. User manual .................................................................................................. 83 9.3. About FishStatJ ............................................................................................. 84
10. Frequently asked questions (FAQ) ................................................................. 85 10.1. How to export data? ..................................................................................... 85 10.2. What does that symbol mean? .................................................................... 85 10.3. Why am I getting different numbers than those from the FAO Yearbook of Fishery and Aquaculture Statistics/SOFIA? ...................................................... 85

iv
10.4. Some historical data figures have changed. Why? ...................................... 87 10.5. Where to find detailed notes for each dataset?............................................ 87 10.6. Can I use FishStatJ offline? ......................................................................... 88 10.7. How often is the data/application updated? ................................................. 89 10.8. FishStatJ is being flagged as a virus threat ................................................. 89 10.9. How does FAO assign nationality to catches? ............................................. 90
11. More on FishStatJ ............................................................................................ 90 11.1. FishStatJ legal specifications ....................................................................... 90 11.2. Bibliographic citation .................................................................................... 90 11.3. Data versioning and Data revisions ............................................................. 90 11.4. FishStatJ workspace folder .......................................................................... 91 11.5. Un-installing FishStatJ ................................................................................. 92 11.6. FishStatJ update notification ........................................................................ 92

1
1. About FishStatJ FishStatJ is a desktop application designed to disseminate FAO fishery statistical data to the world. FishStatJ’s primary aim is to display, refine and export data. However, unlike a spreadsheet software it cannot modify the data, create graphs or perform advanced data analysis. One of FishStatJ’s greatest strength is that it can display species according to several authoritative classifications, such as the International Standard Statistical Classification of Aquatic Animals and Plants (ISSCAAP) or the UN’s Central Product Classification (CPC); and show the scientific name.
At the 23rd CWP meeting (2010), the prototype of FishStatJ was endorsed for full development and the first release of FishStatJ was delivered in 2011. FishStatJ is built using the Eclipse Rich Client Platform (Eclipse-RCP) tools. As such, it is a Java application, and requires that Java is installed on the computer. RCP allows to develop general purpose applications, which run on Windows and macOS.
FishStatJ build and improves on the features of FishStatPlus (its predecessor):
all Fishery reference data is available (all FAO code lists with all attributes); all hierarchies are available (for view, and for filtering/aggregation); calculated columns of FishStatPlus are included; the software is cross-platform (Windows, Macintosh, LINUX); data (workspaces) of dimensions can be defined as needed (flexible); and any data with fixed dimensions and yearly resolution can be loaded.
For the creation of workspace files (database files), a separate software called “FishStatJ Console” was developed.
In order to use the statistical data, the user has to download and install the FishStatJ application on his computer (more details follow).
2
2. Installation 2.1. Installing on Windows
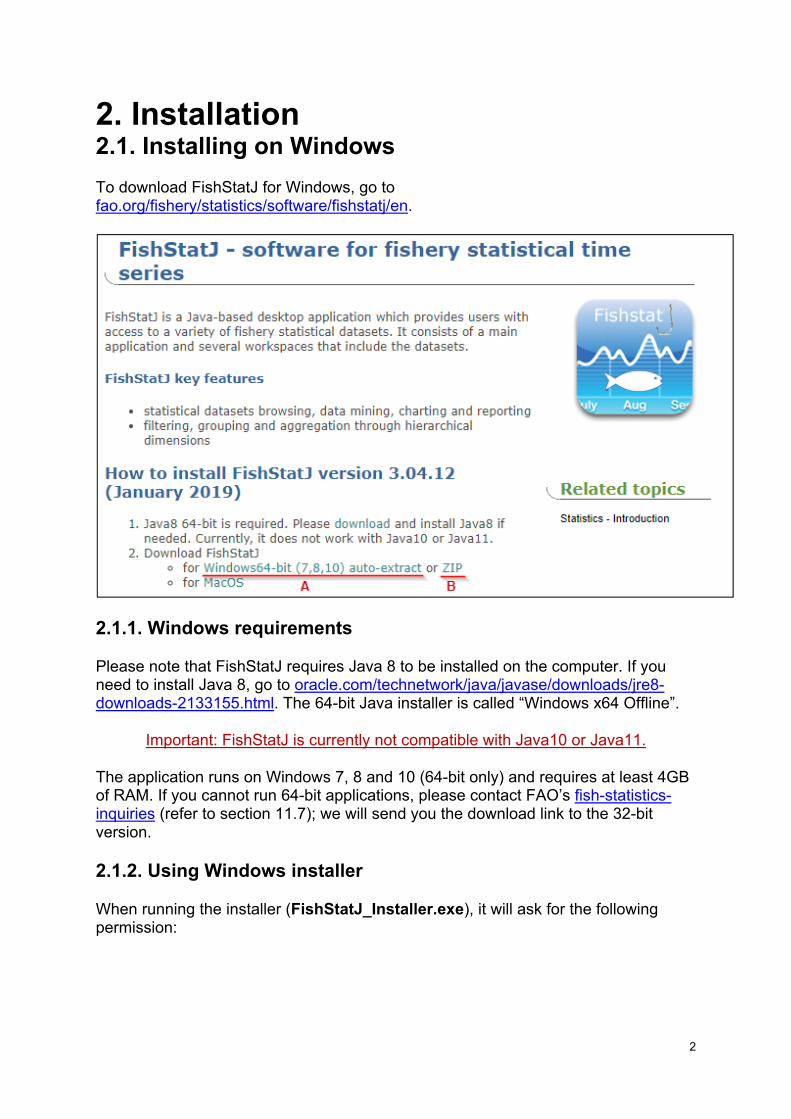
To download FishStatJ for Windows, go to fao.org/fishery/statistics/software/fishstatj/en.
2.1.1. Windows requirements
Please note that FishStatJ requires Java 8 to be installed on the computer. If you need to install Java 8, go to oracle.com/technetwork/java/javase/downloads/jre8-downloads-2133155.html. The 64-bit Java installer is called “Windows x64 Offline”.
Important: FishStatJ is currently not compatible with Java10 or Java11.
The application runs on Windows 7, 8 and 10 (64-bit only) and requires at least 4GB of RAM. If you cannot run 64-bit applications, please contact FAO’s fish-statistics-inquiries (refer to section 11.7); we will send you the download link to the 32-bit version.
2.1.2. Using Windows installer
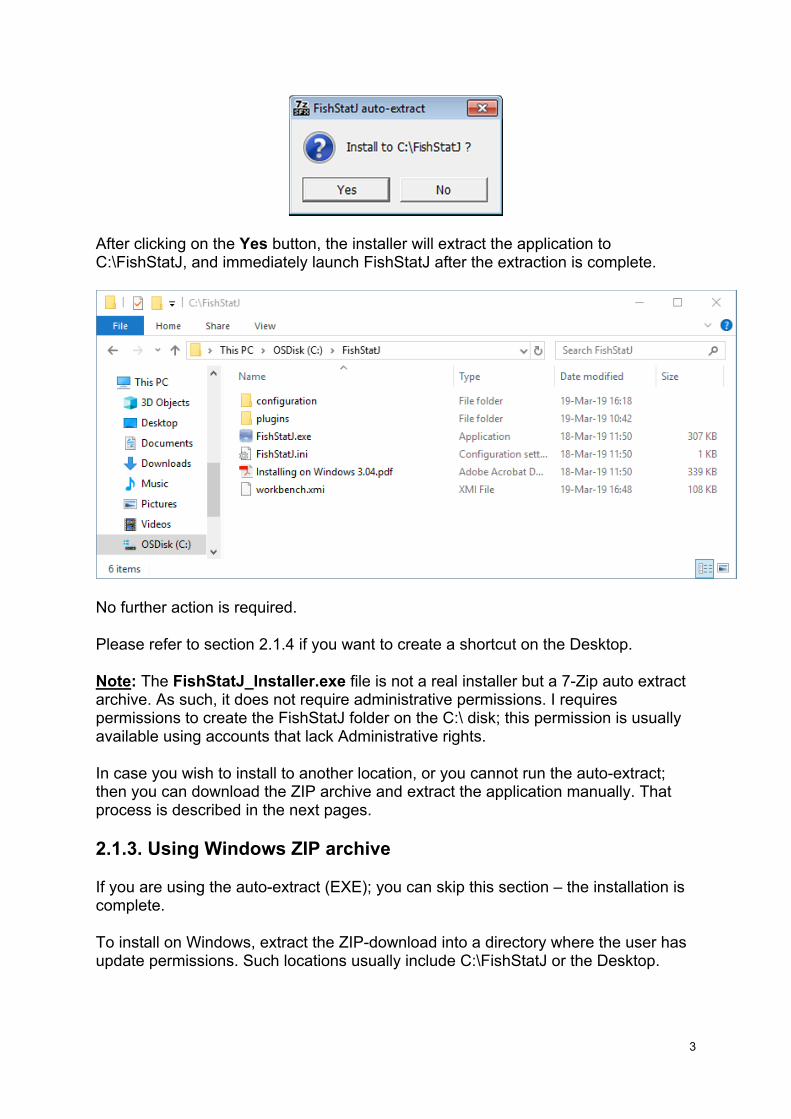
When running the installer (FishStatJ_Installer.exe), it will ask for the following permission:
3
After clicking on the Yes button, the installer will extract the application to C:\FishStatJ, and immediately launch FishStatJ after the extraction is complete.
No further action is required.
Please refer to section 2.1.4 if you want to create a shortcut on the Desktop.
Note: The FishStatJ_Installer.exe file is not a real installer but a 7-Zip auto extract archive. As such, it does not require administrative permissions. I requires permissions to create the FishStatJ folder on the C:\ disk; this permission is usually available using accounts that lack Administrative rights.
In case you wish to install to another location, or you cannot run the auto-extract; then you can download the ZIP archive and extract the application manually. That process is described in the next pages.
2.1.3. Using Windows ZIP archive
If you are using the auto-extract (EXE); you can skip this section – the installation is complete.
To install on Windows, extract the ZIP-download into a directory where the user has update permissions. Such locations usually include C:\FishStatJ or the Desktop.

4
Please note that it is very important when extracting to maintain the zipped file structure with all the required FishStatJ subdirectories!
The first step is to extract the content of ZIP file into the root folder of the C: disk, or onto the Desktop:
Note: Extracting files into C:\Program Files\ usually requires Administrator permissions.
5
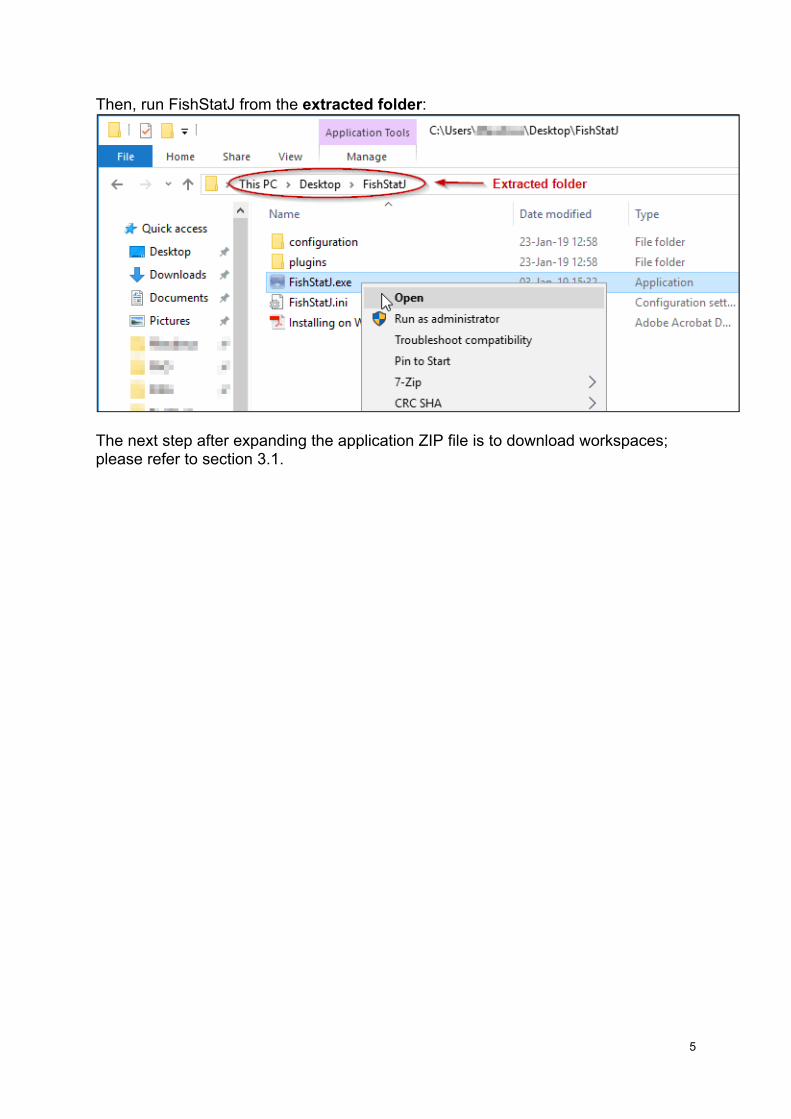
Then, run FishStatJ from the extracted folder:
The next step after expanding the application ZIP file is to download workspaces; please refer to section 3.1.
6
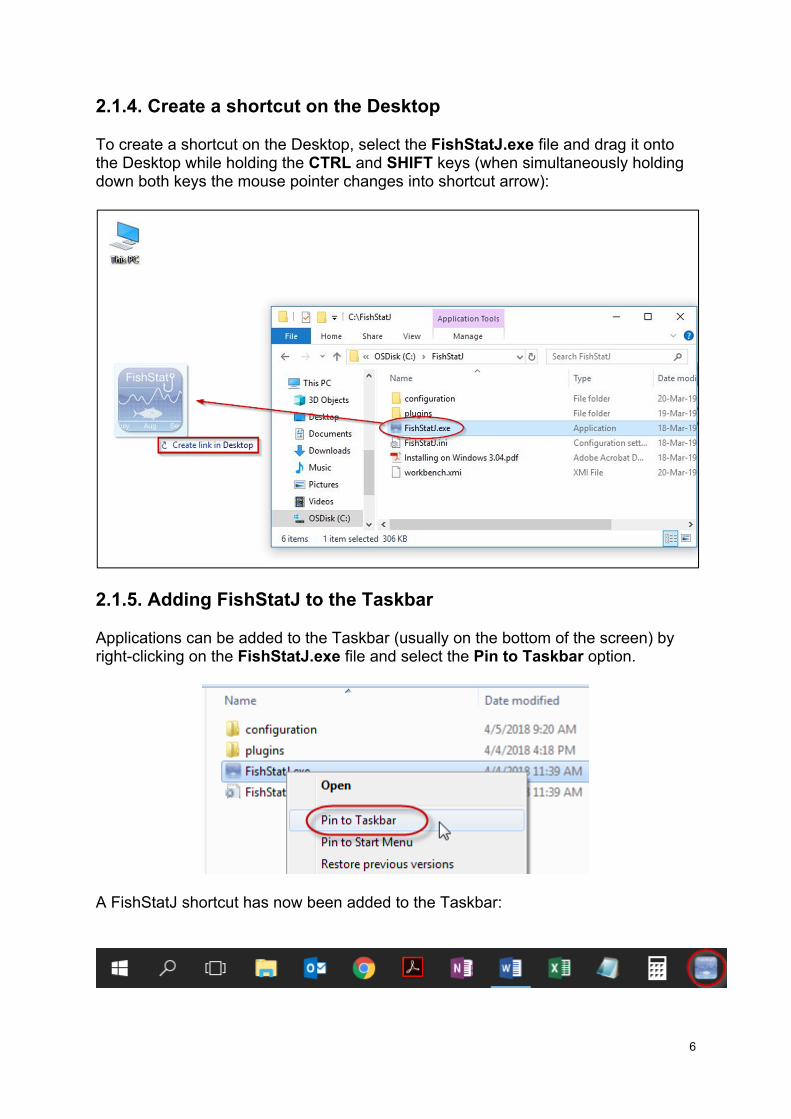
2.1.4. Create a shortcut on the Desktop
To create a shortcut on the Desktop, select the FishStatJ.exe file and drag it onto the Desktop while holding the CTRL and SHIFT keys (when simultaneously holding down both keys the mouse pointer changes into shortcut arrow):
2.1.5. Adding FishStatJ to the Taskbar
Applications can be added to the Taskbar (usually on the bottom of the screen) by right-clicking on the FishStatJ.exe file and select the Pin to Taskbar option.
A FishStatJ shortcut has now been added to the Taskbar:

7
2.2. Windows troubleshooting
2.2.1. Installation issues
Before launching the EXE Auto-Extract to install a new version, exit any open instance of FishStatJ (File → Exit) so that the files of the new version can be copied.
If you encounter problems while using FishStatJ, a clean install can be performed easily:
o Make sure that FishStatJ is not running (File → Exit). o Open the Windows File Browser and delete the C:/FishStatJ folder and
all its content. o Run the FishStatJ_Install.exe program to extract a new copy to
C:/FishStatJ.
2.2.2. Issues with Java
The majority of issues are related to the Java installation requirement. FishStatJ is a Java-based application, and cannot not run if Java8 64-bit is not installed and active.
FishStatJ is a 64-bit application, and therefore requires Java8 64-bit: Java8 32-bit will not work. You can download the Version 1.8 JRE 64-bit from: oracle.com/technetwork/java/javase/downloads/jre8-downloads-2133155.html The 64-bit version is called “jre-8u201-windows-x64.exe”.
To check the java version active on your computer; use this tool: github.com/bergertom/JavaVersion/releases/tag/v1.00.
To un-install a previous version of Java, follow these instructions: java.com/en/download/help/uninstall_java.xml.
To verify the currently active Java version: o Use the Windows+R shortcut to open the Run window. o Type “cmd” and then click “OK” to open the Command Prompt. o Type “java –version” in the Command Prompt and press Enter.
Troubleshooting Tip: The java version used by FishStatJ is visible in the log file. The log file location is described in section 11.4.2.
2.2.3. How to check if your computer supports 64-bit
FishStatJ is a 64-bit software, and therefore requires Java8 64-bit. While it is possible to install Java8 32-bit and run FishStatJ 32bit on a 64-bit computer, we do not recommend or support this. The reason for this 64-bit requirement relates to the limitation of the memory handling for data: the Fisheries Commodities Production and Trade and Food balance sheets of fish and fishery products datasets will run out of memory on Windows 32-bit.
8
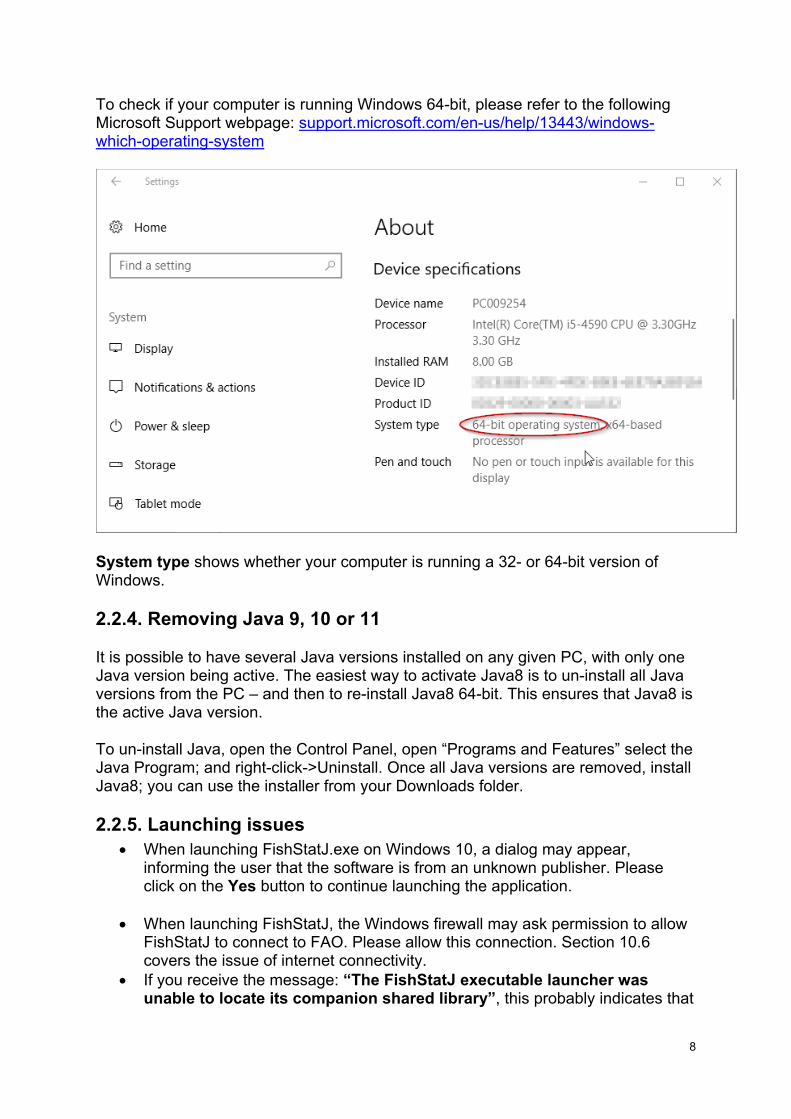
To check if your computer is running Windows 64-bit, please refer to the following Microsoft Support webpage: support.microsoft.com/en-us/help/13443/windows-which-operating-system
System type shows whether your computer is running a 32- or 64-bit version of Windows.
2.2.4. Removing Java 9, 10 or 11
It is possible to have several Java versions installed on any given PC, with only one Java version being active. The easiest way to activate Java8 is to un-install all Java versions from the PC – and then to re-install Java8 64-bit. This ensures that Java8 is the active Java version.
To un-install Java, open the Control Panel, open “Programs and Features” select the Java Program; and right-click->Uninstall. Once all Java versions are removed, install Java8; you can use the installer from your Downloads folder.
2.2.5. Launching issues When launching FishStatJ.exe on Windows 10, a dialog may appear,
informing the user that the software is from an unknown publisher. Please click on the Yes button to continue launching the application.
When launching FishStatJ, the Windows firewall may ask permission to allow FishStatJ to connect to FAO. Please allow this connection. Section 10.6 covers the issue of internet connectivity.
If you receive the message: “The FishStatJ executable launcher was unable to locate its companion shared library”, this probably indicates that
9
FishStatJ was run from inside the compressed (ZIP) file. The solution is to extract the ZIP file content as described in section 2.1.3 above.
FishStatJ gives error -1 on start-up; this happens when Java 6 or 7 is active. FishStatJ will start to launch, and then stop; this happens with Java 11 for
example (the Java version is shown in the log-file).
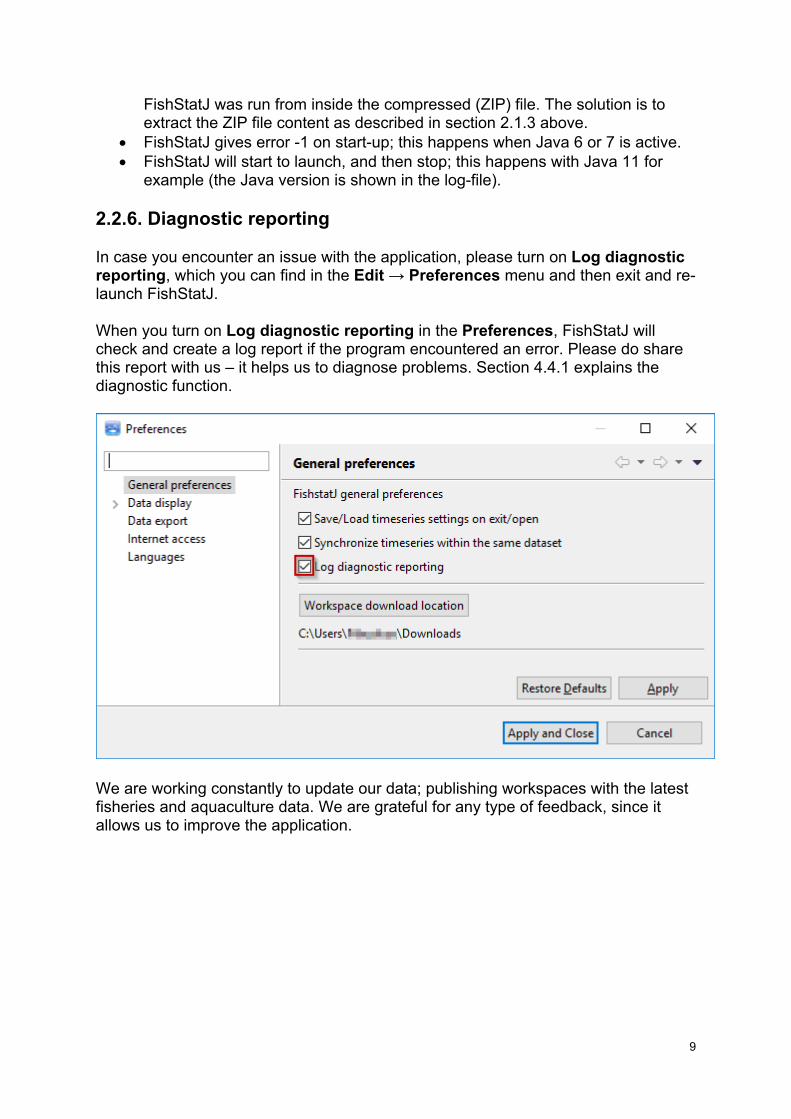
2.2.6. Diagnostic reporting
In case you encounter an issue with the application, please turn on Log diagnostic reporting, which you can find in the Edit → Preferences menu and then exit and re-launch FishStatJ.
When you turn on Log diagnostic reporting in the Preferences, FishStatJ will check and create a log report if the program encountered an error. Please do share this report with us – it helps us to diagnose problems. Section 4.4.1 explains the diagnostic function.
We are working constantly to update our data; publishing workspaces with the latest fisheries and aquaculture data. We are grateful for any type of feedback, since it allows us to improve the application.

10
2.3. Installing on macOS
To download the FishStatJ for macOS, please go to fao.org/fishery/statistics/software/fishstatj/en.
2.3.1. macOS requirements
The FishStatJ application requires Java 8 to be installed on the computer. If you need to install Java 8 JRE, go to oracle.com/technetwork/java/javase/downloads/jre8-downloads-2133155.html.
Important: FishStatJ is currently not compatible with Java10 or Java11.
FishStatJ runs on macOS 10.9 or later, and requires at least 4GB of RAM.
2.3.2. Installation
After the FishStatJ application is extracted from the ZIP file, it can be launched directly run from the Desktop, or moved to the Applications folder.
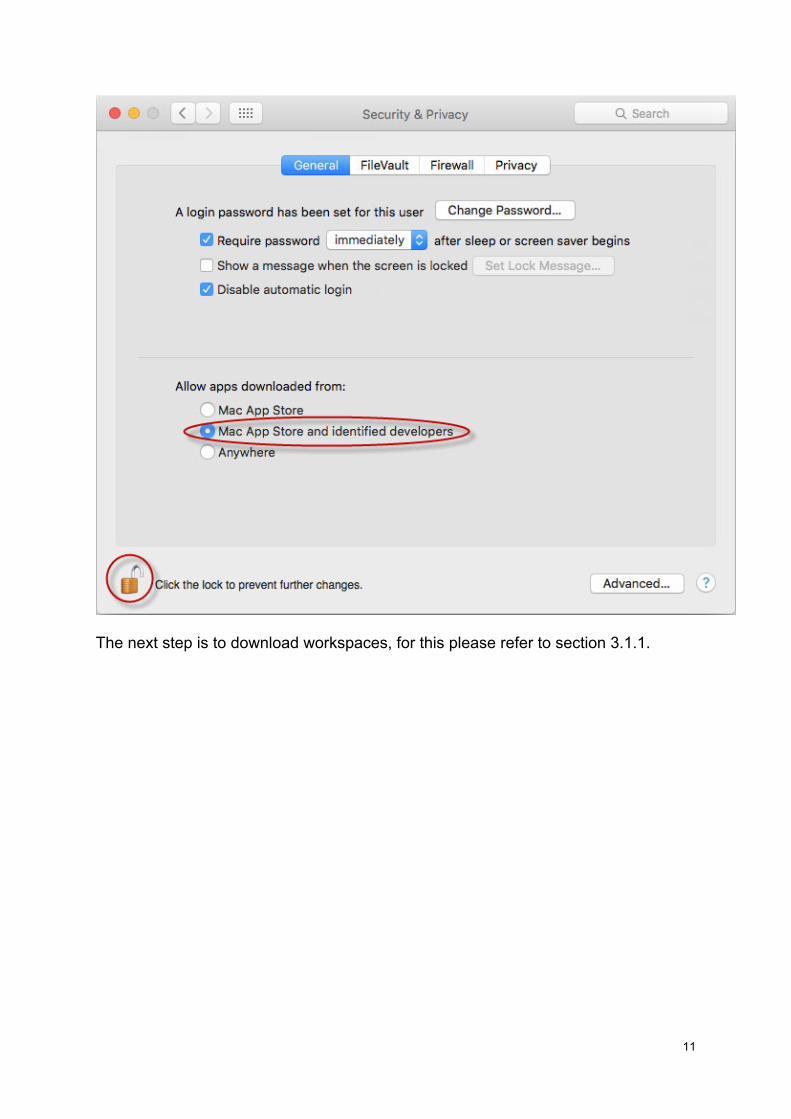
Since FishStatJ is an application that is downloaded from the FAO website, macOS security settings need to be adjusted in System Preferences → Security & Privacy in order to allow applications from identified developers; to change settings the Preferences Panel must be unlocked.
11
The next step is to download workspaces, for this please refer to section 3.1.1.
12
2.4. macOS troubleshooting
2.4.1. Error launching FishStatJ
If you receive a Java error message when launching FishStatJ, the most likely explanation is that the computer does not have Java8 installed and activated. We found that computers having Java 1.6 installed previously will not activate the Java8 correctly; and as a result, FishStatJ fails to start
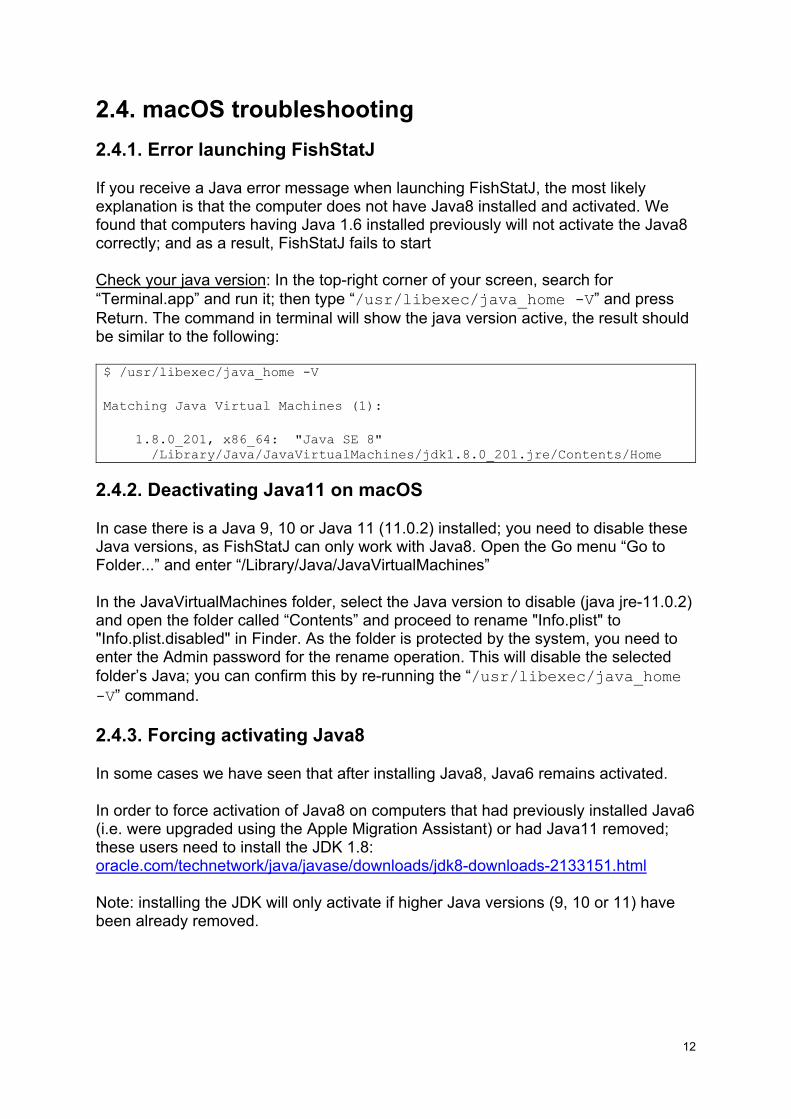
Check your java version: In the top-right corner of your screen, search for “Terminal.app” and run it; then type “/usr/libexec/java_home -V” and press Return. The command in terminal will show the java version active, the result should be similar to the following:
$ /usr/libexec/java_home -V
Matching Java Virtual Machines (1):
1.8.0_201, x86_64: "Java SE 8" /Library/Java/JavaVirtualMachines/jdk1.8.0_201.jre/Contents/Home
2.4.2. Deactivating Java11 on macOS
In case there is a Java 9, 10 or Java 11 (11.0.2) installed; you need to disable these Java versions, as FishStatJ can only work with Java8. Open the Go menu “Go to Folder...” and enter “/Library/Java/JavaVirtualMachines”
In the JavaVirtualMachines folder, select the Java version to disable (java jre-11.0.2) and open the folder called “Contents” and proceed to rename "Info.plist" to "Info.plist.disabled" in Finder. As the folder is protected by the system, you need to enter the Admin password for the rename operation. This will disable the selected folder’s Java; you can confirm this by re-running the “/usr/libexec/java_home -V” command.
2.4.3. Forcing activating Java8
In some cases we have seen that after installing Java8, Java6 remains activated.
In order to force activation of Java8 on computers that had previously installed Java6 (i.e. were upgraded using the Apple Migration Assistant) or had Java11 removed; these users need to install the JDK 1.8: oracle.com/technetwork/java/javase/downloads/jdk8-downloads-2133151.html
Note: installing the JDK will only activate if higher Java versions (9, 10 or 11) have been already removed.
13
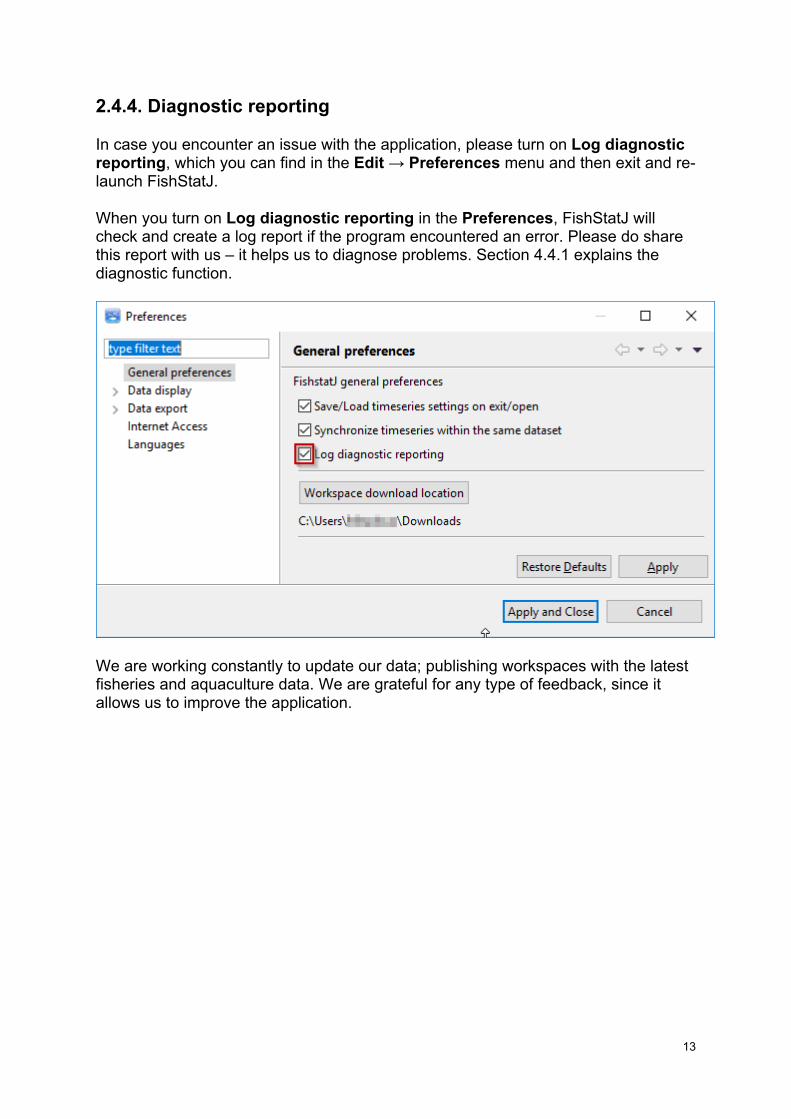
2.4.4. Diagnostic reporting
In case you encounter an issue with the application, please turn on Log diagnostic reporting, which you can find in the Edit → Preferences menu and then exit and re-launch FishStatJ.
When you turn on Log diagnostic reporting in the Preferences, FishStatJ will check and create a log report if the program encountered an error. Please do share this report with us – it helps us to diagnose problems. Section 4.4.1 explains the diagnostic function.
We are working constantly to update our data; publishing workspaces with the latest fisheries and aquaculture data. We are grateful for any type of feedback, since it allows us to improve the application.
14
2.5. Workspaces (statistical data)
Workspace files carry the statistical data. You can install an unlimited number of workspaces on a computer. However, FishStatJ can only work with one workspace at a time.
A workspace can contain one or more datasets. For the dissemination of data, workspaces are compressed into workspace files (.wks extension). FishStatJ downloads and extracts/installs workspaces automatically.

15
We currently offers several different workspaces files, which contain the following datasets:
the Global Production workspace which contains: o Global Production o Capture Production o Aquaculture Production
the Regional workspace with contains: o CECAF (Eastern Central Atlantic) o GFCM (Mediterranean and Black Sea) o RECOFI capture production o SEATL Southeast Atlantic Capture Production
the Food Balance workspace which contains: o Food Balance Sheet o Population data
the Commodities workspace which contains: o Fisheries Commodities Production and Trade
Please refer to section 3.1 for importing workspaces into FishStatJ.
16
3. File menu 3.1. Manage workspaces
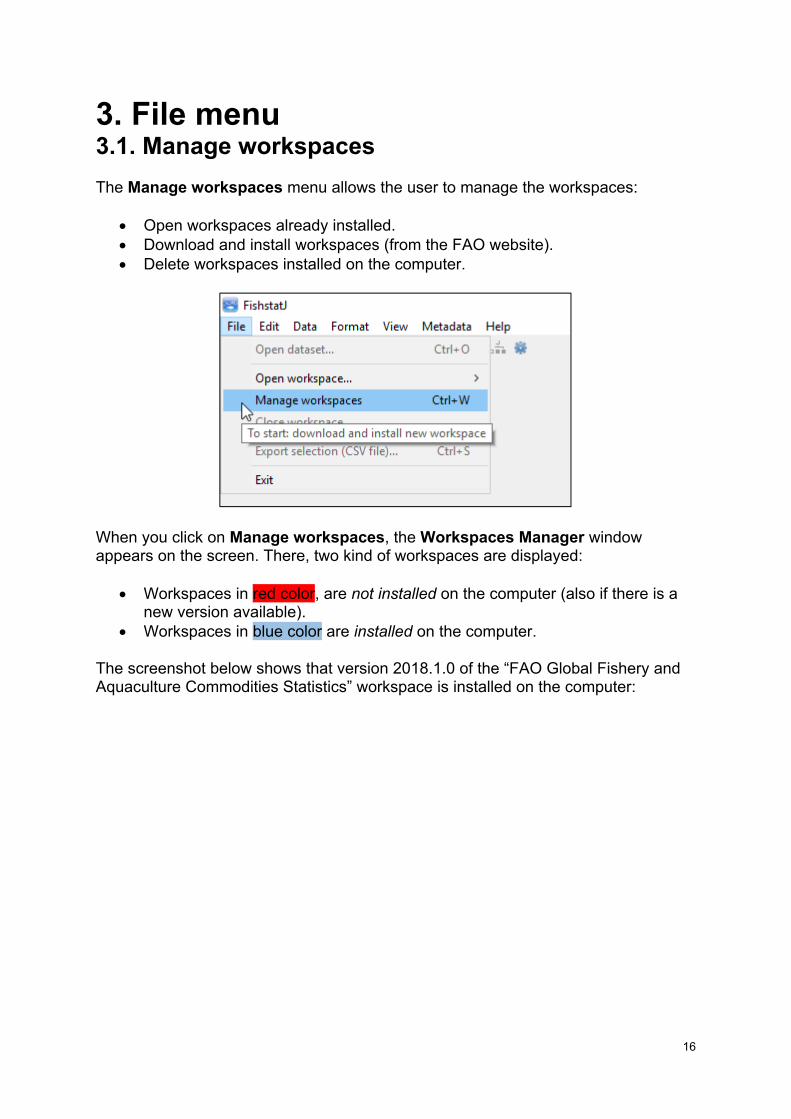
The Manage workspaces menu allows the user to manage the workspaces:
Open workspaces already installed. Download and install workspaces (from the FAO website). Delete workspaces installed on the computer.
When you click on Manage workspaces, the Workspaces Manager window appears on the screen. There, two kind of workspaces are displayed:
Workspaces in red color, are not installed on the computer (also if there is a new version available).
Workspaces in blue color are installed on the computer.
The screenshot below shows that version 2018.1.0 of the “FAO Global Fishery and Aquaculture Commodities Statistics” workspace is installed on the computer:

17
Workspaces already installed on the local disk can be Opened for viewing the data, or Deleted from the computer.
Manually downloaded workspaces can be imported using the Import button.
Workspaces that are already installed are not shown as available for download.

18
3.1.1. Installing a new workspace (download)
To install a new workspace, select an uninstalled (in red) workspace and click on the Download… button.
19
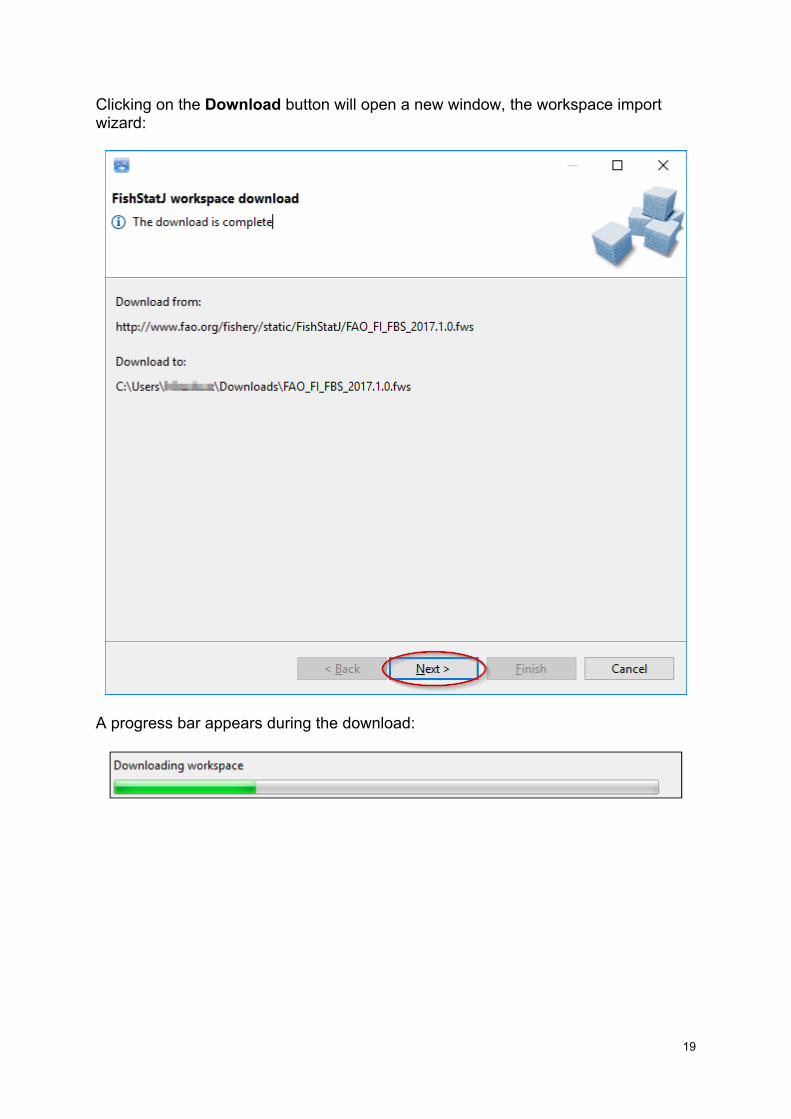
Clicking on the Download button will open a new window, the workspace import wizard:
A progress bar appears during the download:
20
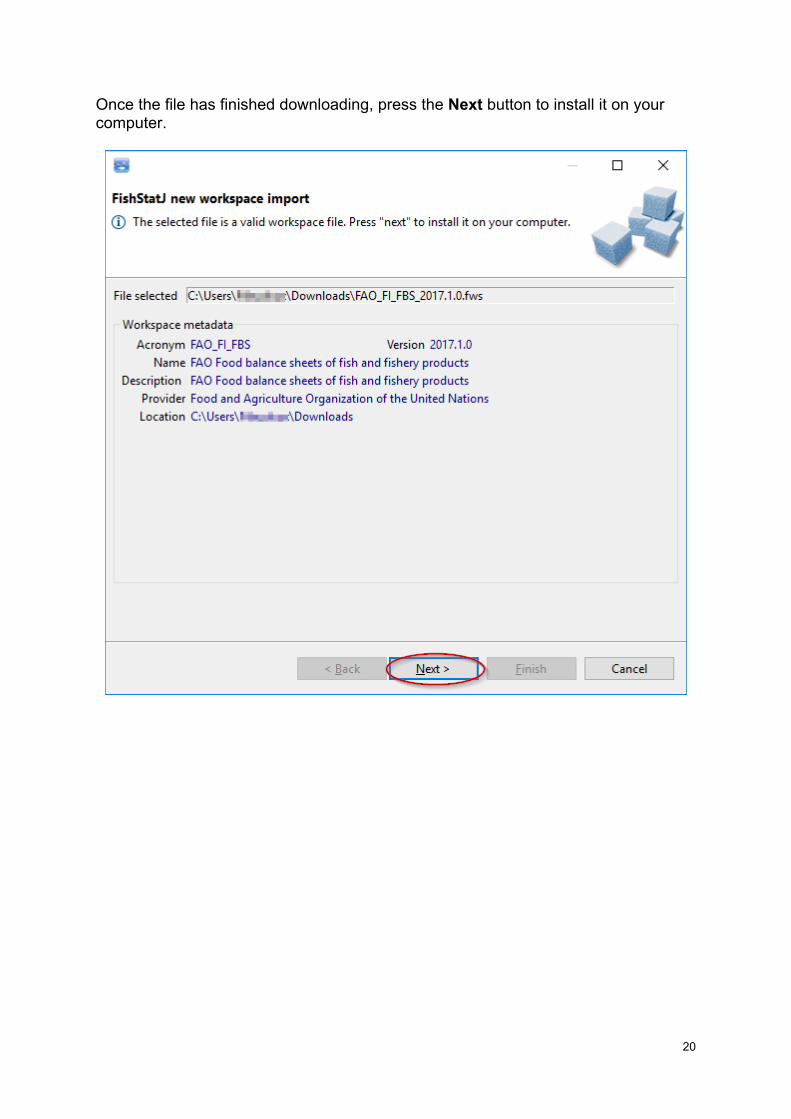
Once the file has finished downloading, press the Next button to install it on your computer.
21
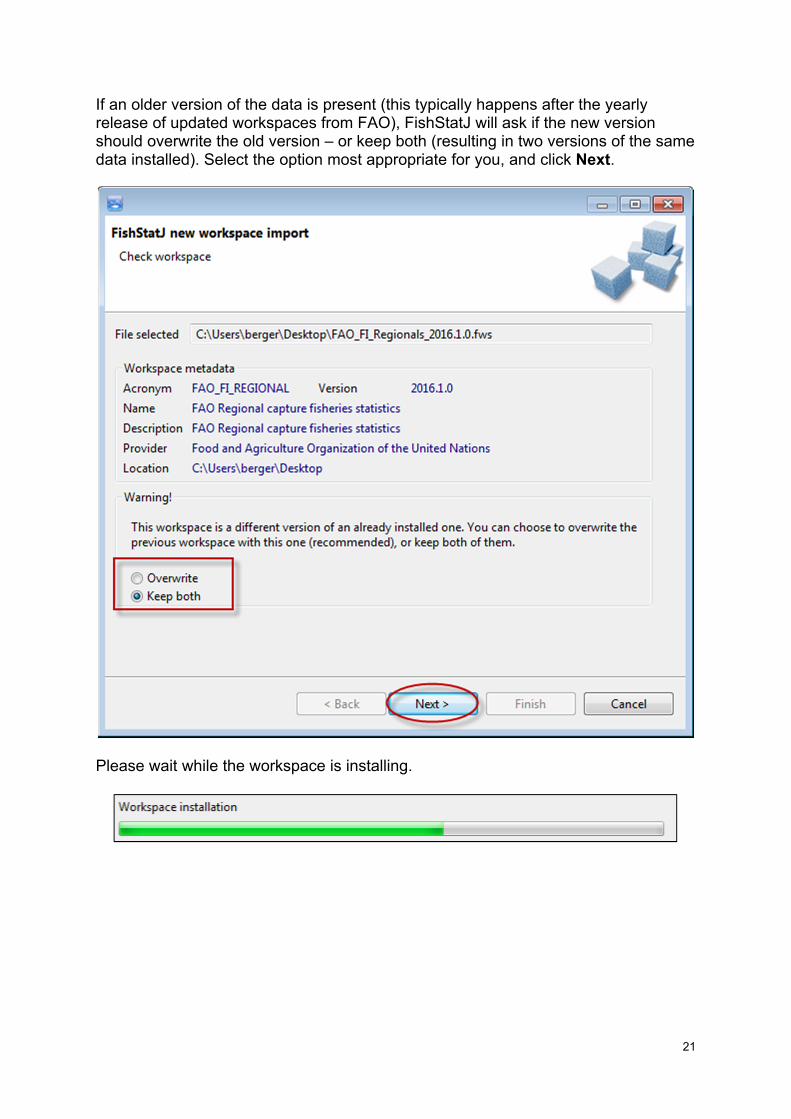
If an older version of the data is present (this typically happens after the yearly release of updated workspaces from FAO), FishStatJ will ask if the new version should overwrite the old version – or keep both (resulting in two versions of the same data installed). Select the option most appropriate for you, and click Next.
Please wait while the workspace is installing.
22
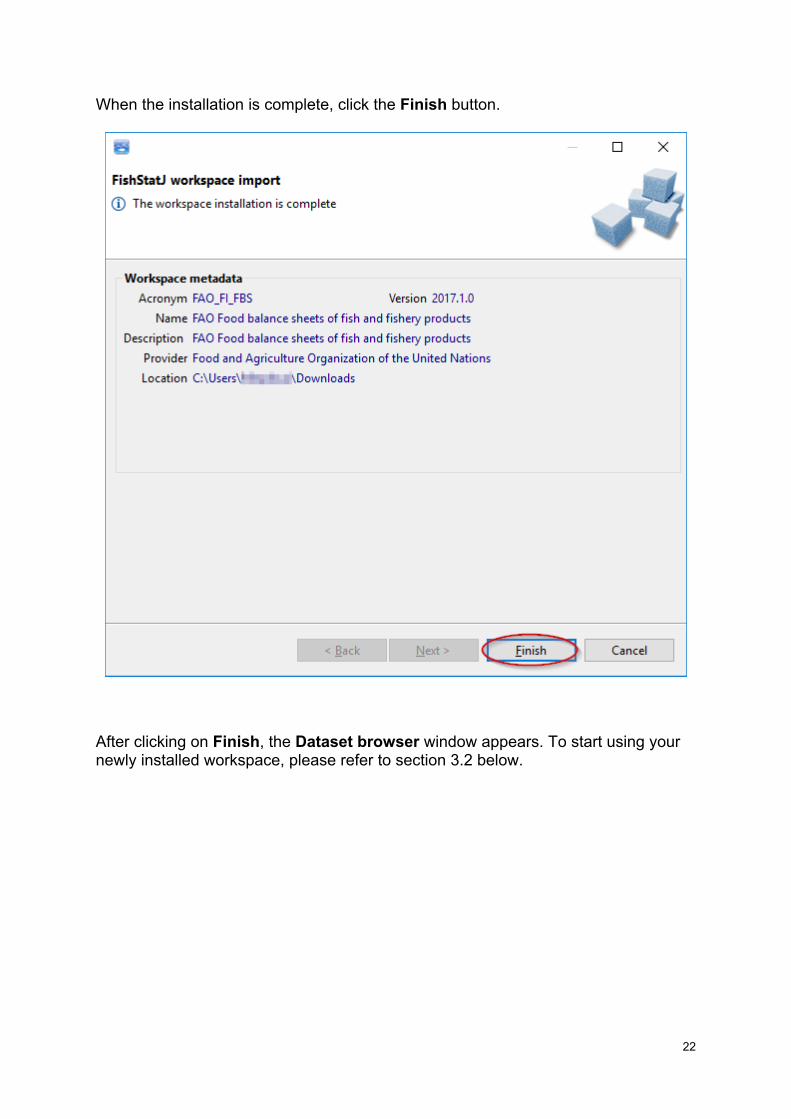
When the installation is complete, click the Finish button.
After clicking on Finish, the Dataset browser window appears. To start using your newly installed workspace, please refer to section 3.2 below.
23
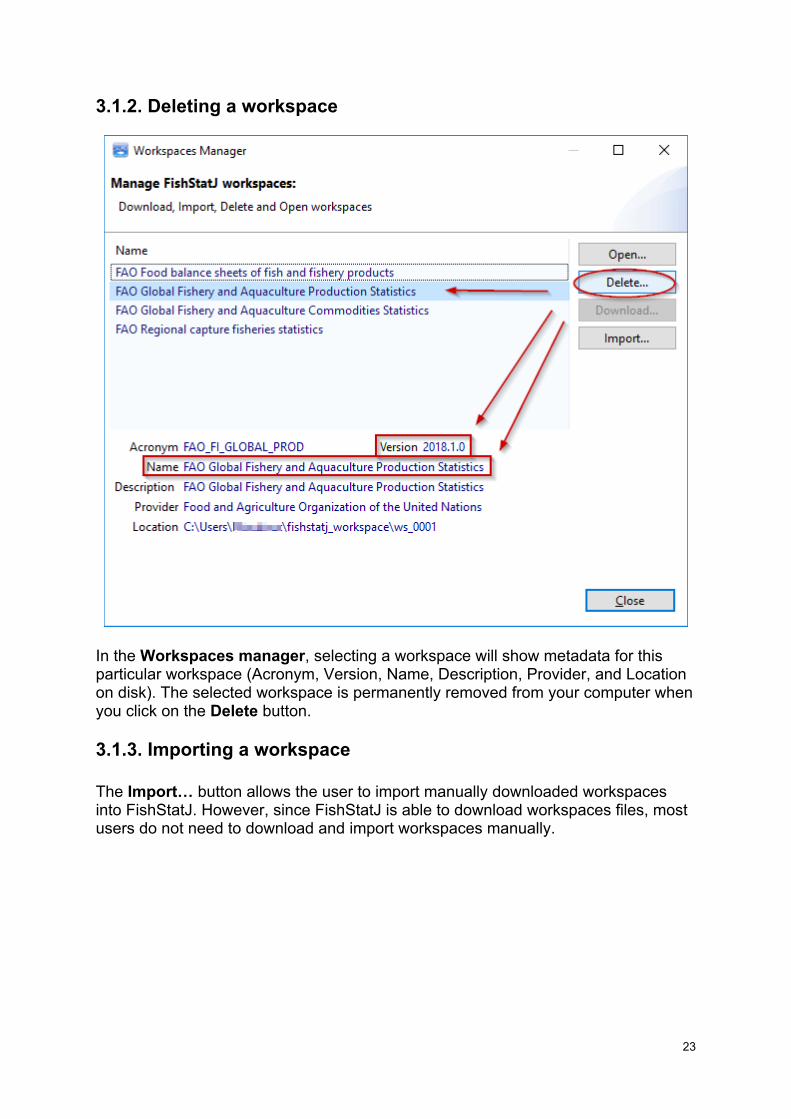
3.1.2. Deleting a workspace
In the Workspaces manager, selecting a workspace will show metadata for this particular workspace (Acronym, Version, Name, Description, Provider, and Location on disk). The selected workspace is permanently removed from your computer when you click on the Delete button.
3.1.3. Importing a workspace The Import… button allows the user to import manually downloaded workspaces into FishStatJ. However, since FishStatJ is able to download workspaces files, most users do not need to download and import workspaces manually.
24
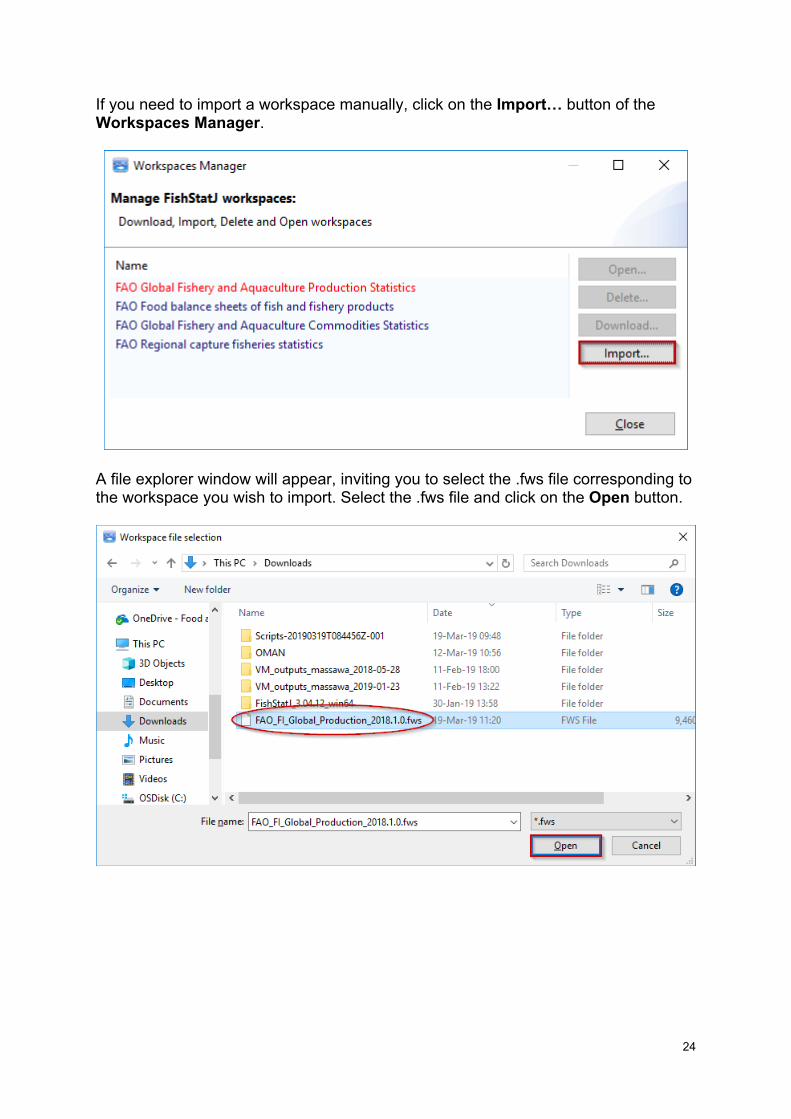
If you need to import a workspace manually, click on the Import… button of the Workspaces Manager.
A file explorer window will appear, inviting you to select the .fws file corresponding to the workspace you wish to import. Select the .fws file and click on the Open button.
25
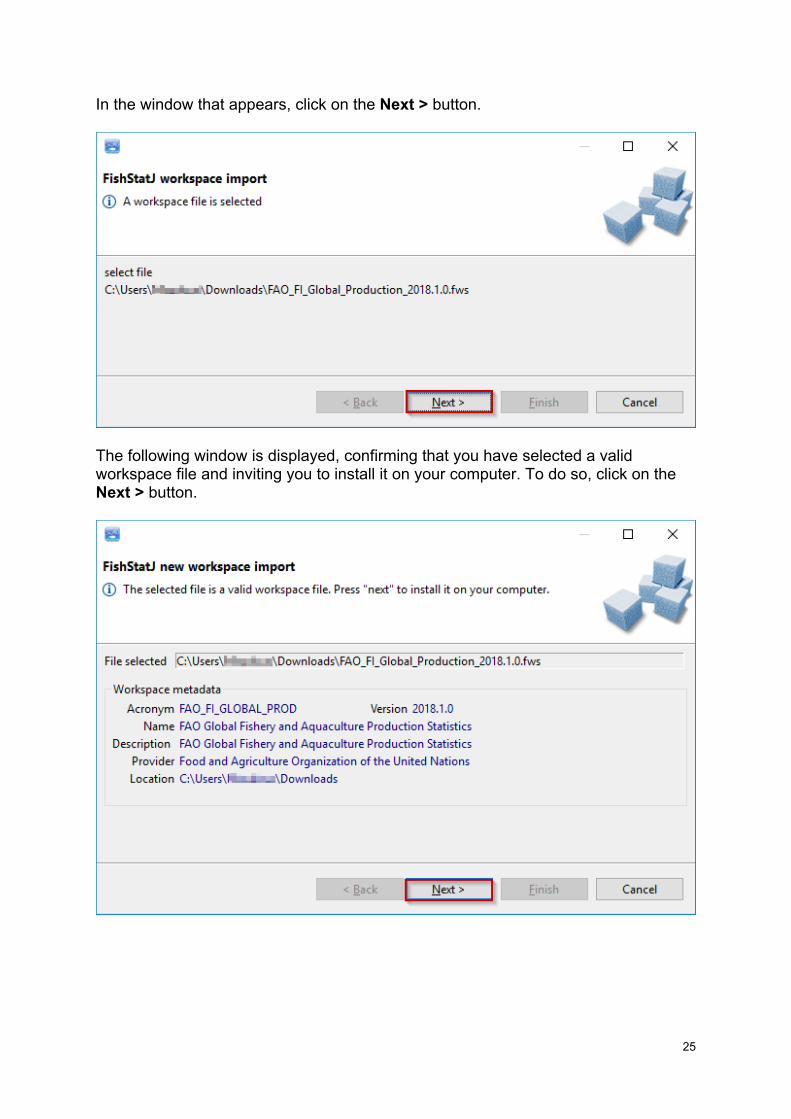
In the window that appears, click on the Next > button.
The following window is displayed, confirming that you have selected a valid workspace file and inviting you to install it on your computer. To do so, click on the Next > button.
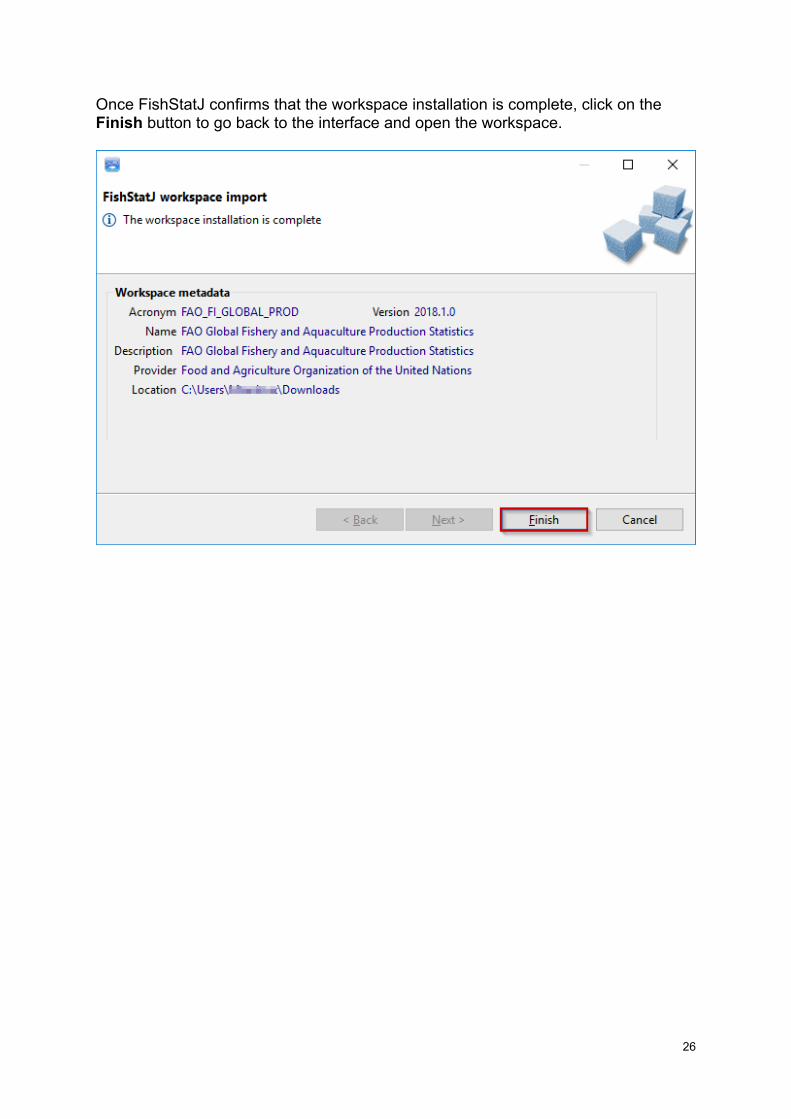
26
Once FishStatJ confirms that the workspace installation is complete, click on the Finish button to go back to the interface and open the workspace.

27
3.2. Open dataset...
Note: This option is only available when a workspace is currently open in FishStatJ.
Selecting this option will present the Dataset browser window, where datasets may be opened and brought into FishStatJ for viewing.
Once you have opened a dataset, the Manage workspaces item under the File menu is disabled (or dimmed); until you close the active workspace by clicking on the Close workspace item.
Selecting a dataset by clicking on the items listed on the left-side of the window will present the associated metadata on the right-side of the window. Select a dataset and click on the OK button to open the dataset content.
28
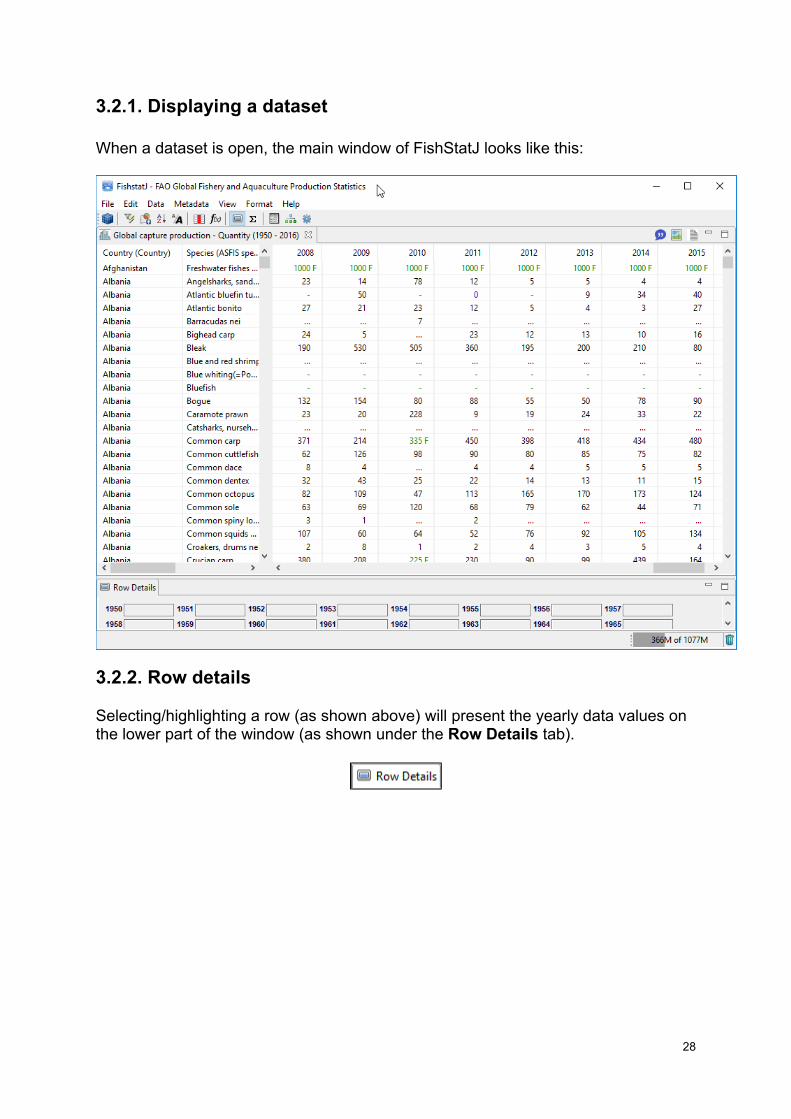
3.2.1. Displaying a dataset When a dataset is open, the main window of FishStatJ looks like this:
3.2.2. Row details
Selecting/highlighting a row (as shown above) will present the yearly data values on the lower part of the window (as shown under the Row Details tab).
29
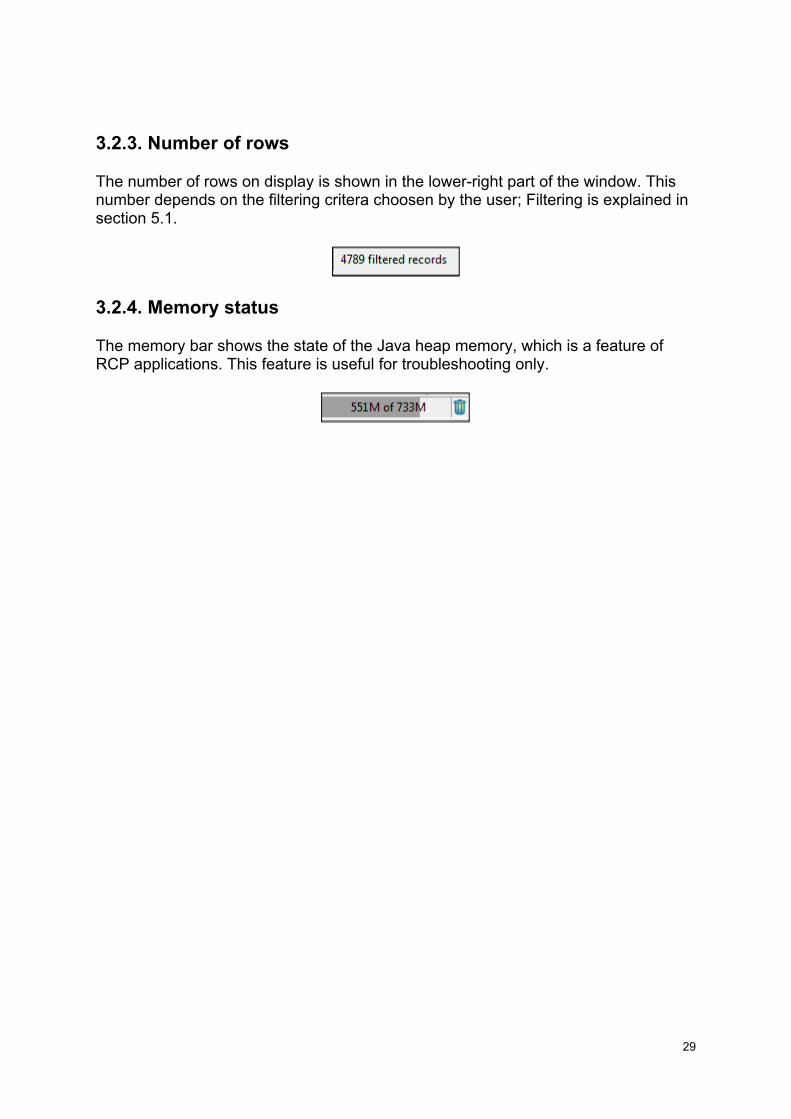
3.2.3. Number of rows
The number of rows on display is shown in the lower-right part of the window. This number depends on the filtering critera choosen by the user; Filtering is explained in section 5.1.
3.2.4. Memory status
The memory bar shows the state of the Java heap memory, which is a feature of RCP applications. This feature is useful for troubleshooting only.
30
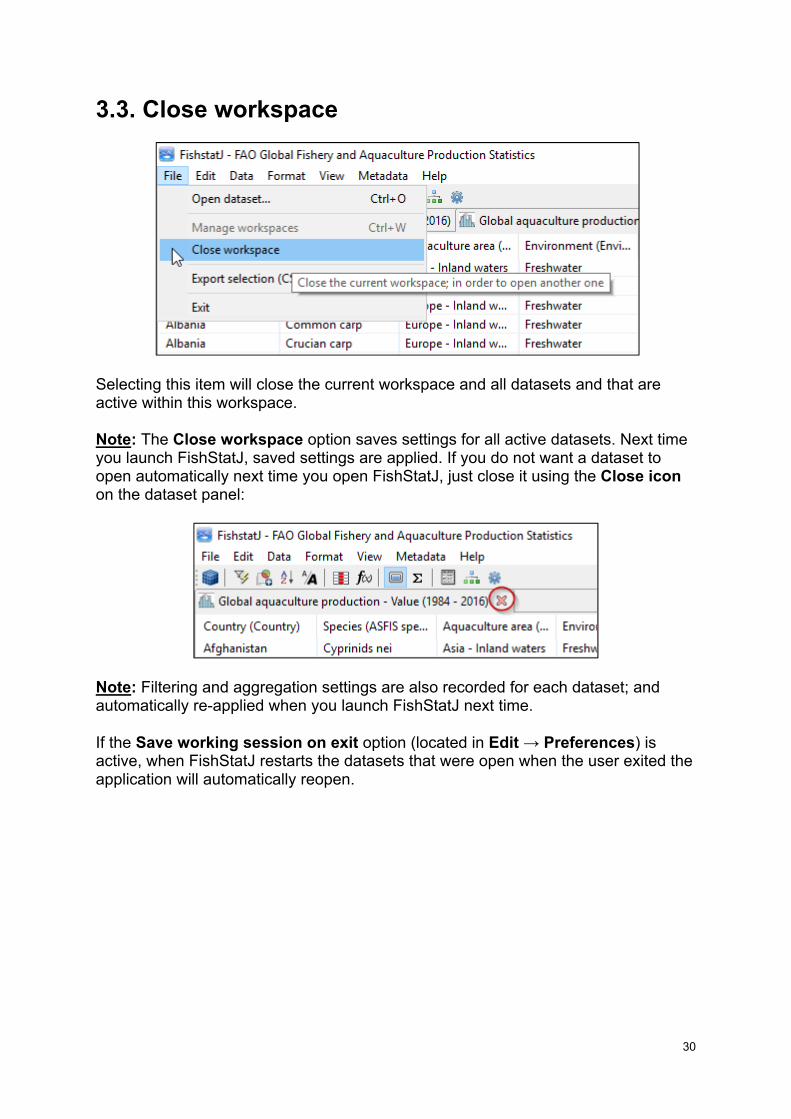
3.3. Close workspace
Selecting this item will close the current workspace and all datasets and that are active within this workspace. Note: The Close workspace option saves settings for all active datasets. Next time you launch FishStatJ, saved settings are applied. If you do not want a dataset to open automatically next time you open FishStatJ, just close it using the Close icon on the dataset panel:
Note: Filtering and aggregation settings are also recorded for each dataset; and automatically re-applied when you launch FishStatJ next time.
If the Save working session on exit option (located in Edit → Preferences) is active, when FishStatJ restarts the datasets that were open when the user exited the application will automatically reopen.
31
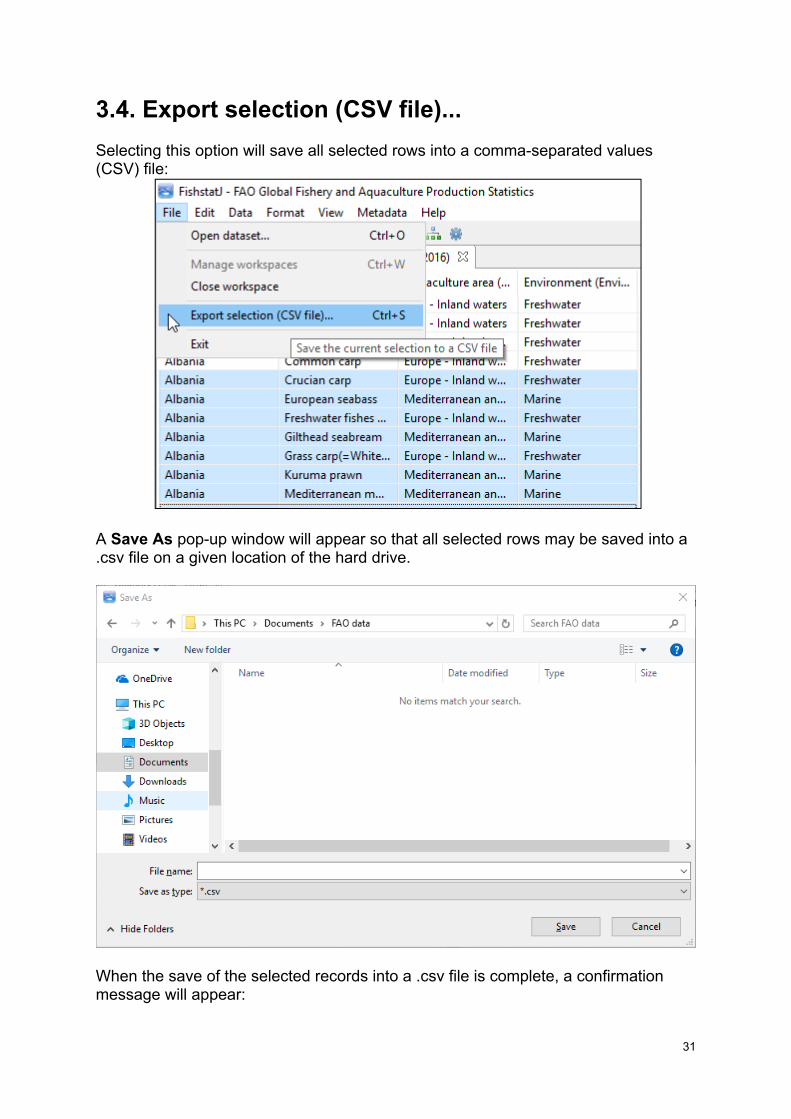
3.4. Export selection (CSV file)...
Selecting this option will save all selected rows into a comma-separated values (CSV) file:
A Save As pop-up window will appear so that all selected rows may be saved into a .csv file on a given location of the hard drive.
When the save of the selected records into a .csv file is complete, a confirmation message will appear:

32
Settings for export of CSV files are managed in Edit → Preferences → Data Export. See section 4.4.5 for more information.
3.5. Exit
Selecting this option will close the FishStatJ program.
33
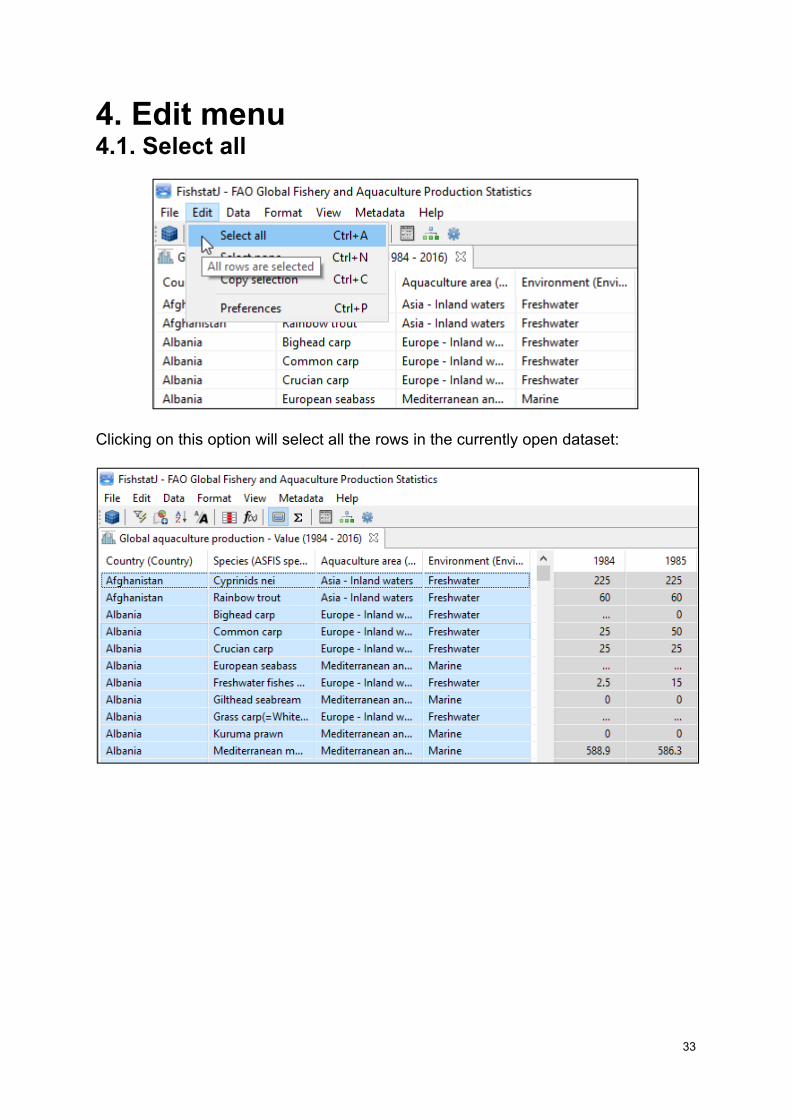
4. Edit menu 4.1. Select all
Clicking on this option will select all the rows in the currently open dataset:
34
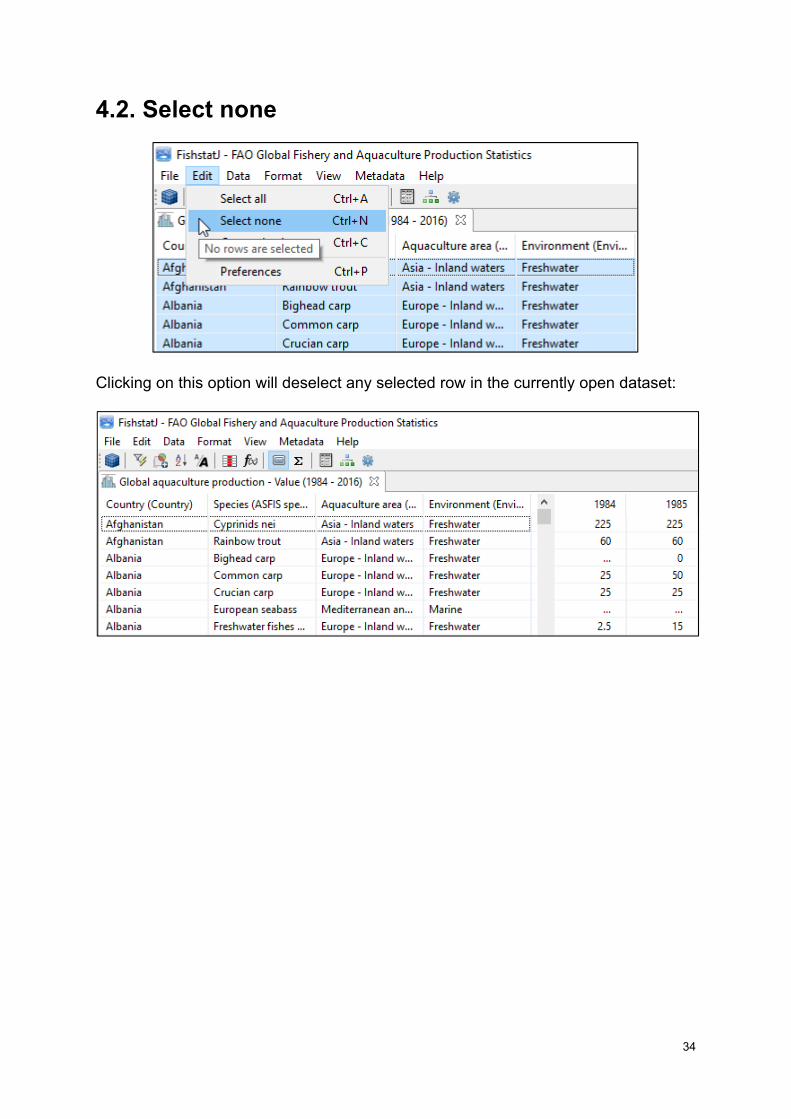
4.2. Select none
Clicking on this option will deselect any selected row in the currently open dataset:
35
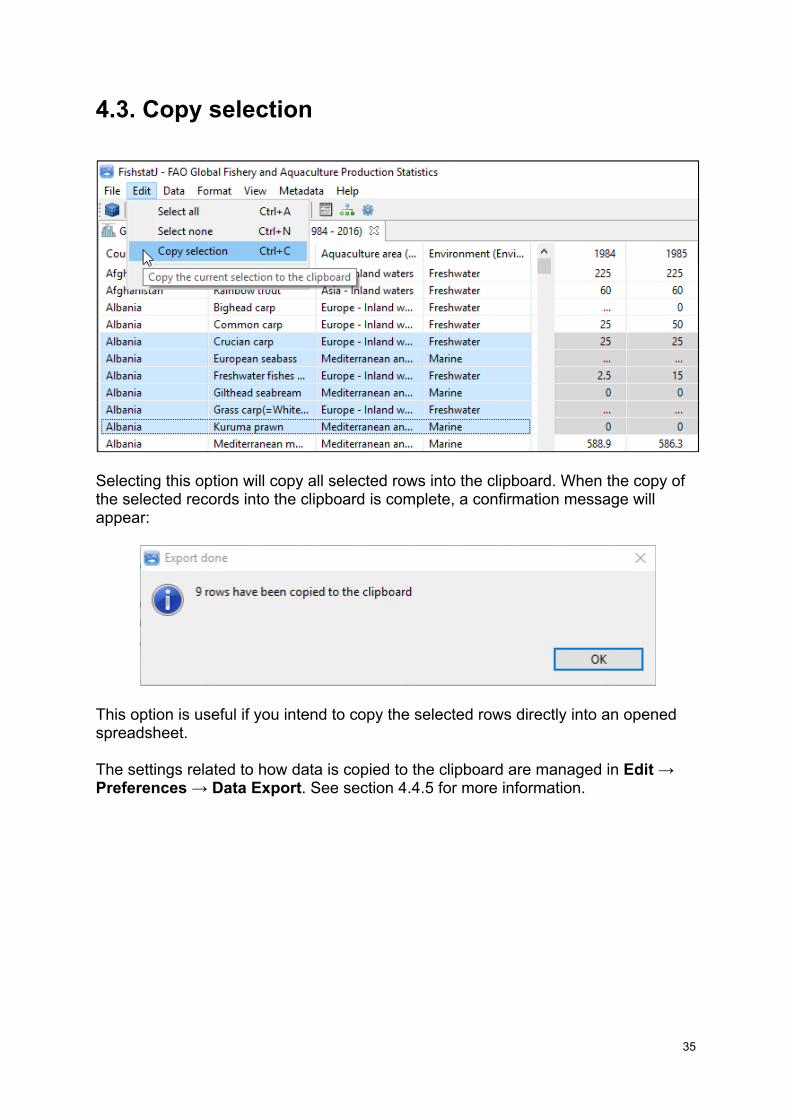
4.3. Copy selection
Selecting this option will copy all selected rows into the clipboard. When the copy of the selected records into the clipboard is complete, a confirmation message will appear:
This option is useful if you intend to copy the selected rows directly into an opened spreadsheet. The settings related to how data is copied to the clipboard are managed in Edit → Preferences → Data Export. See section 4.4.5 for more information.

36
4.4. Preferences
FishStatJ’s Preferences include a range of settings that can be modified by the user. They can be accessed (i) from the Edit menu…
… and (ii) from the toolbar by clicking on the Preferences icon.
The Preferences window is presented below. Preferences are grouped in five categories, which are listed on the left side of the window. Specific options for each Preferences category are listed on the right side of the window.

37
4.4.1. General preferences
The General preferences options are the following:
Save/Load timeseries settings on exit/open controls if the time series settings (like filtering, aggregation, column settings) are automatically saved (when exiting FishStatJ) and loaded (when launching the application).
Synchronize timeseries within the same dataset: This is useful for Aquaculture data, to keep the time series of Quantity and Value in sync. Any filtering/aggregation settings will be applied to both time series.
If Log diagnostic reporting is enabled, FishStatJ will read the log-file and check for any errors every time the application starts. In case the logs contain any program errors, it copies the last two months of logs into a file called mail.txt and ask the user to send this file to us for analysis. If the Outlook software on Windows is installed, FishStatJ automatically prepares the e-mail message. This option is disabled by default.
Note: FishStatJ does not automatically submit any log information. You can check the content of the text file before sending, and you have to (manually) send the file to FAO (refer to section 11.7).
In case of problems, the log analysis is useful to understand the cause of the problem. This helps us to fix the problem for the user reporting the problem– and to improve the quality for all users.
Workspace download location allows to set the location where FishStatJ downloads workspaces before they are installed. We added this setting because some users reported that the Downloads folder does not exist on their PC.

38
Refer to section 11.4 for details on the log location, and FishStatJ workspaces.
4.4.2. Data display The Data display preferences allows the user to specify:
Whether the dataset panel automatically centers on the last column of the data each time it a dataset is loaded.
Whether the width of the columns that contain values is automatically adjusted, or if fixed (and determined by the user).
Note: If the column width display is set too small so that the observations are not readable, an easy solution is to set a column width of 60.

39
4.4.3. Data display – Number formatting
Number formatting options control how values are shown (i.e. set the number of digits before and after decimals; use point or comma as decimal separator; use decimal or scientific notation). It is important to note that these formatting preferences are used for display and when exporting data.
40
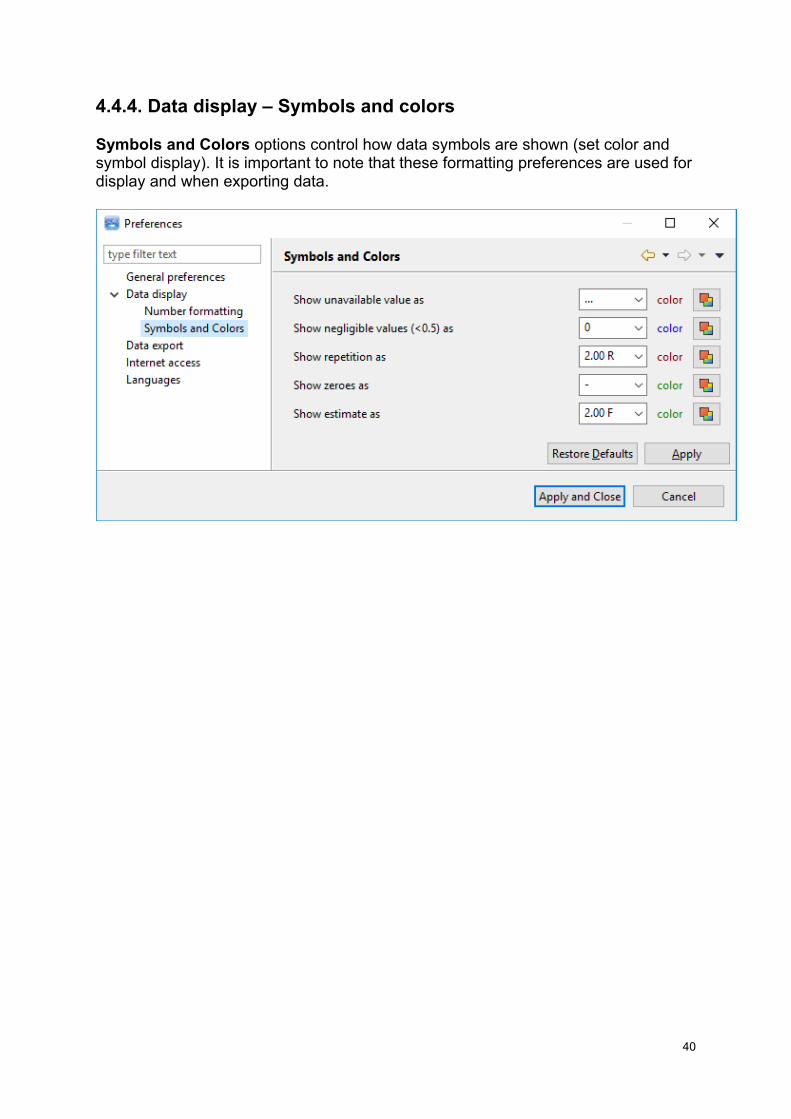
4.4.4. Data display – Symbols and colors
Symbols and Colors options control how data symbols are shown (set color and symbol display). It is important to note that these formatting preferences are used for display and when exporting data.

41
4.4.5. Data export This menu includes several options that set the modalities of data exports.
Export tables headers: when selected, headers are exported. Split values and symbols in two columns. This is to avoid issues when
analyzing the data after exporting it. Indeed, mixing symbols and figures within the same cells in a spreadsheet can make data analysis impossible, notably because the spreadsheet software will not recognize cells as numbers if these contain non-numerical characters.
Export selection criteria: will add the filtering/aggregation settings to the export.
Don’t export symbols. This is to avoid issues when analyzing the data after exporting it. Indeed, mixing symbols and figures within the same cells in a spreadsheet can make data analysis impossible, notably because the spreadsheet software will not recognize cells as numbers if these contain non-numerical characters.
Export with totals on selected rows. Export citation. See section 8.3. Re-adjust the preferences on each export: selecting this will show a dialog
window before each export operation, to make sure that the proper export settings are selected before each data export.
42
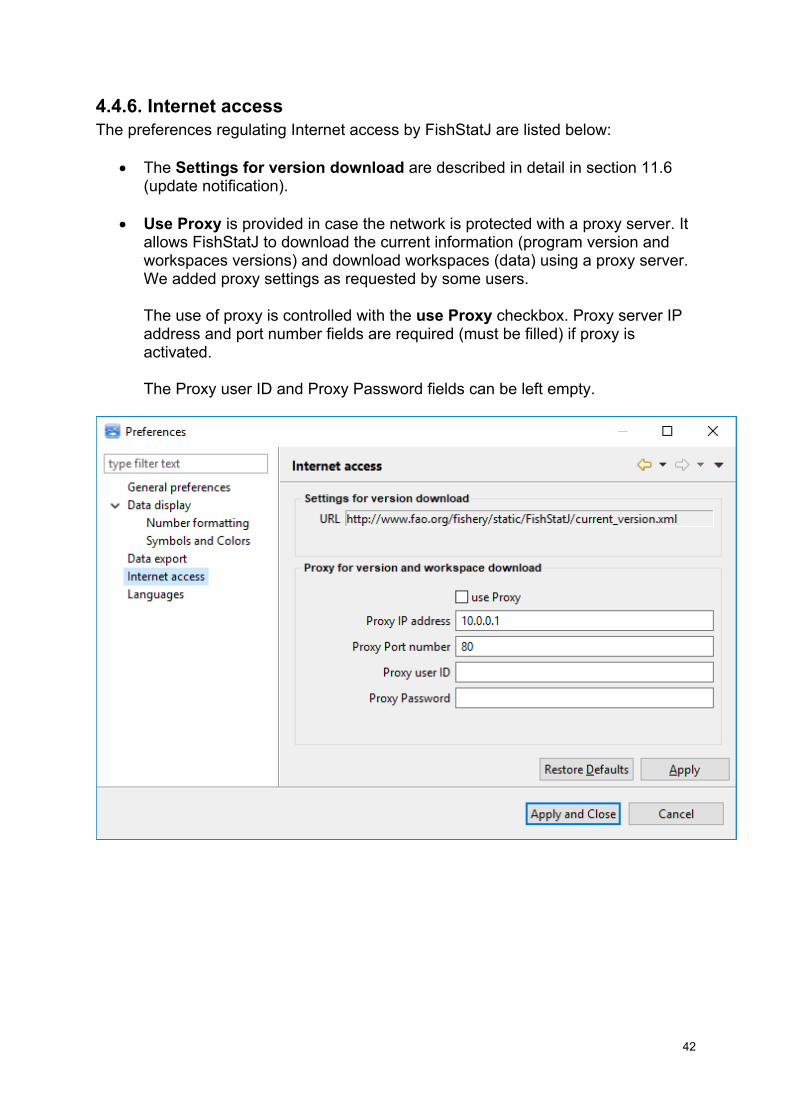
4.4.6. Internet access The preferences regulating Internet access by FishStatJ are listed below:
The Settings for version download are described in detail in section 11.6 (update notification).
Use Proxy is provided in case the network is protected with a proxy server. It
allows FishStatJ to download the current information (program version and workspaces versions) and download workspaces (data) using a proxy server. We added proxy settings as requested by some users.
The use of proxy is controlled with the use Proxy checkbox. Proxy server IP address and port number fields are required (must be filled) if proxy is activated. The Proxy user ID and Proxy Password fields can be left empty.
43
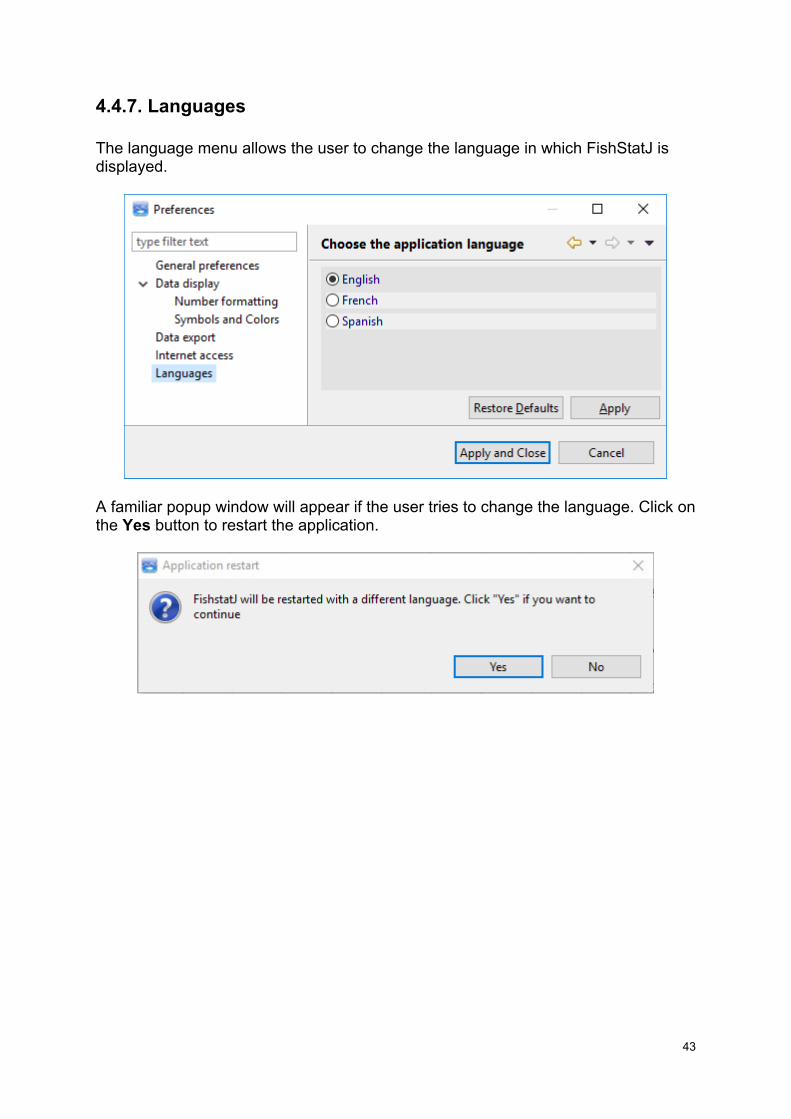
4.4.7. Languages The language menu allows the user to change the language in which FishStatJ is displayed.
A familiar popup window will appear if the user tries to change the language. Click on the Yes button to restart the application.
44
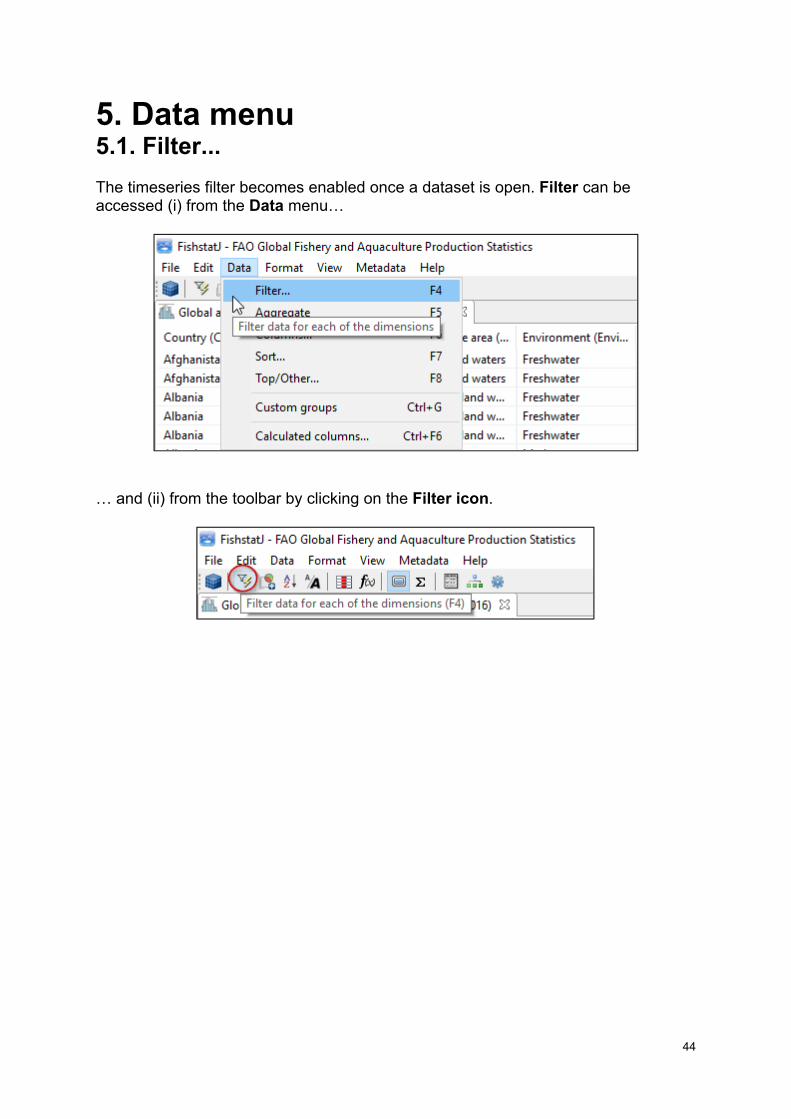
5. Data menu 5.1. Filter...
The timeseries filter becomes enabled once a dataset is open. Filter can be accessed (i) from the Data menu…
… and (ii) from the toolbar by clicking on the Filter icon.
45
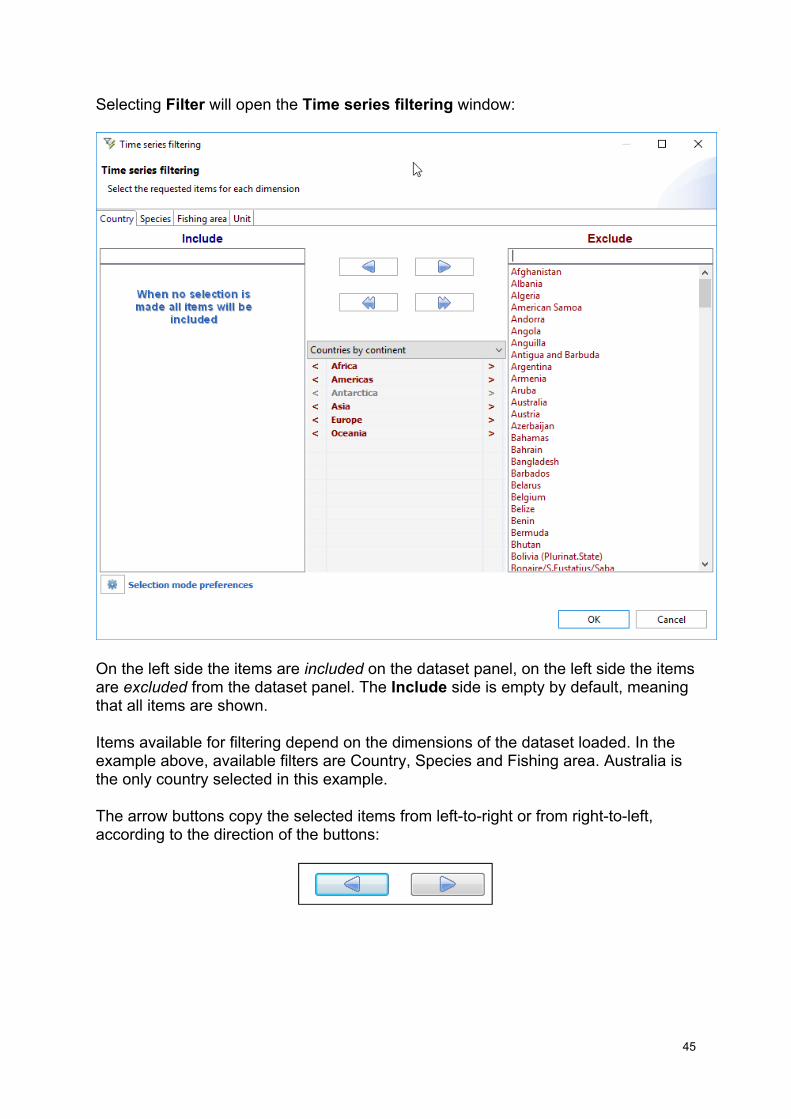
Selecting Filter will open the Time series filtering window:
On the left side the items are included on the dataset panel, on the left side the items are excluded from the dataset panel. The Include side is empty by default, meaning that all items are shown.
Items available for filtering depend on the dimensions of the dataset loaded. In the example above, available filters are Country, Species and Fishing area. Australia is the only country selected in this example.
The arrow buttons copy the selected items from left-to-right or from right-to-left, according to the direction of the buttons:
46
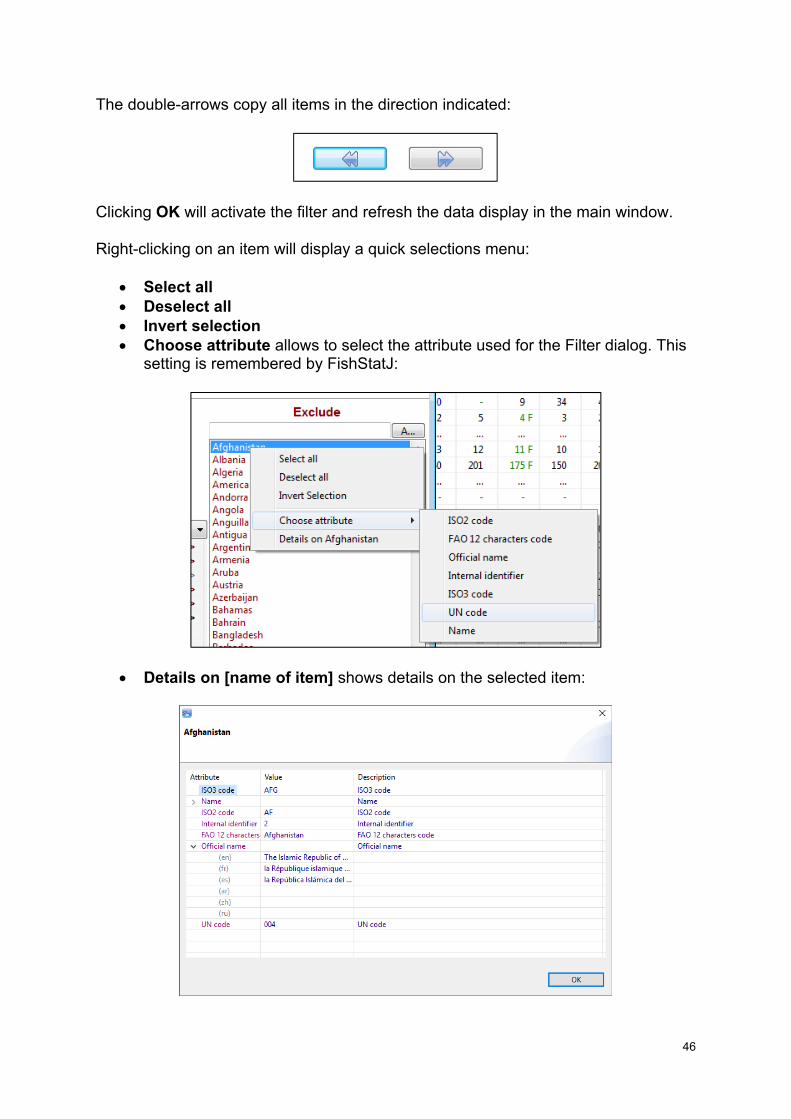
The double-arrows copy all items in the direction indicated:
Clicking OK will activate the filter and refresh the data display in the main window.
Right-clicking on an item will display a quick selections menu:
Select all Deselect all Invert selection Choose attribute allows to select the attribute used for the Filter dialog. This
setting is remembered by FishStatJ:
Details on [name of item] shows details on the selected item:

47
5.1.1. Selection mode preferences
The Time series filtering window includes a button to open the Selection mode preferences:
48
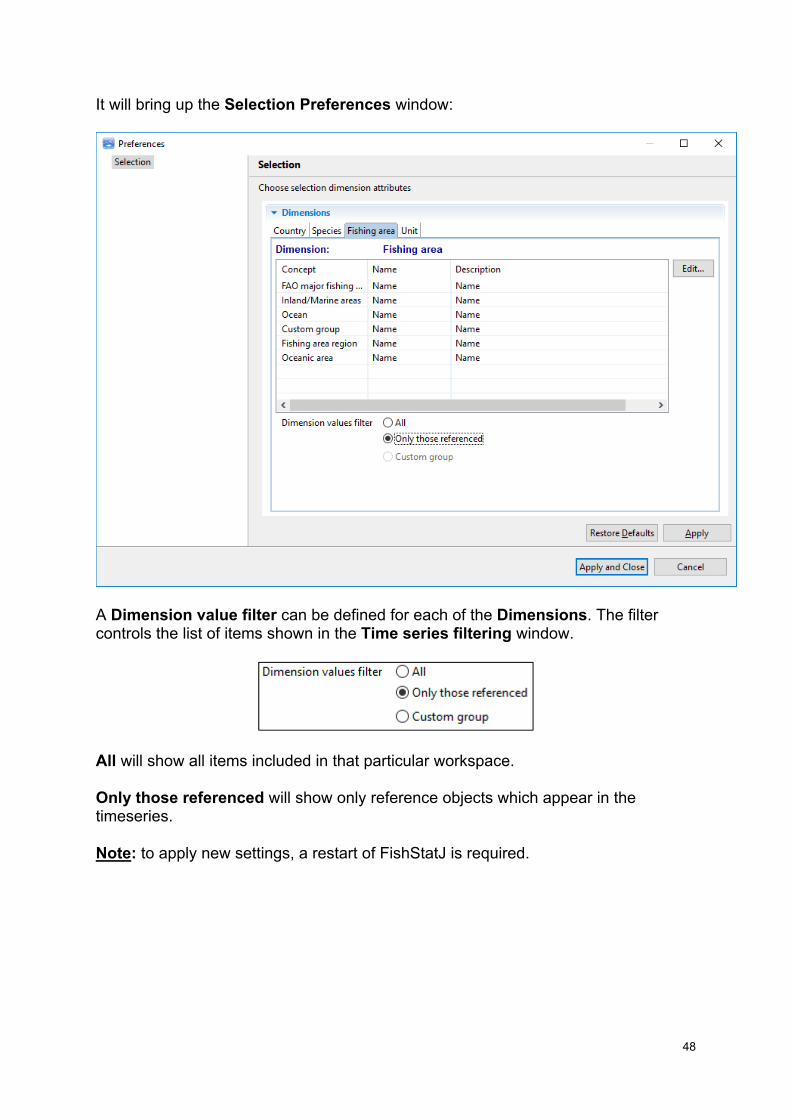
It will bring up the Selection Preferences window:
A Dimension value filter can be defined for each of the Dimensions. The filter controls the list of items shown in the Time series filtering window.
All will show all items included in that particular workspace.
Only those referenced will show only reference objects which appear in the timeseries.
Note: to apply new settings, a restart of FishStatJ is required.
49
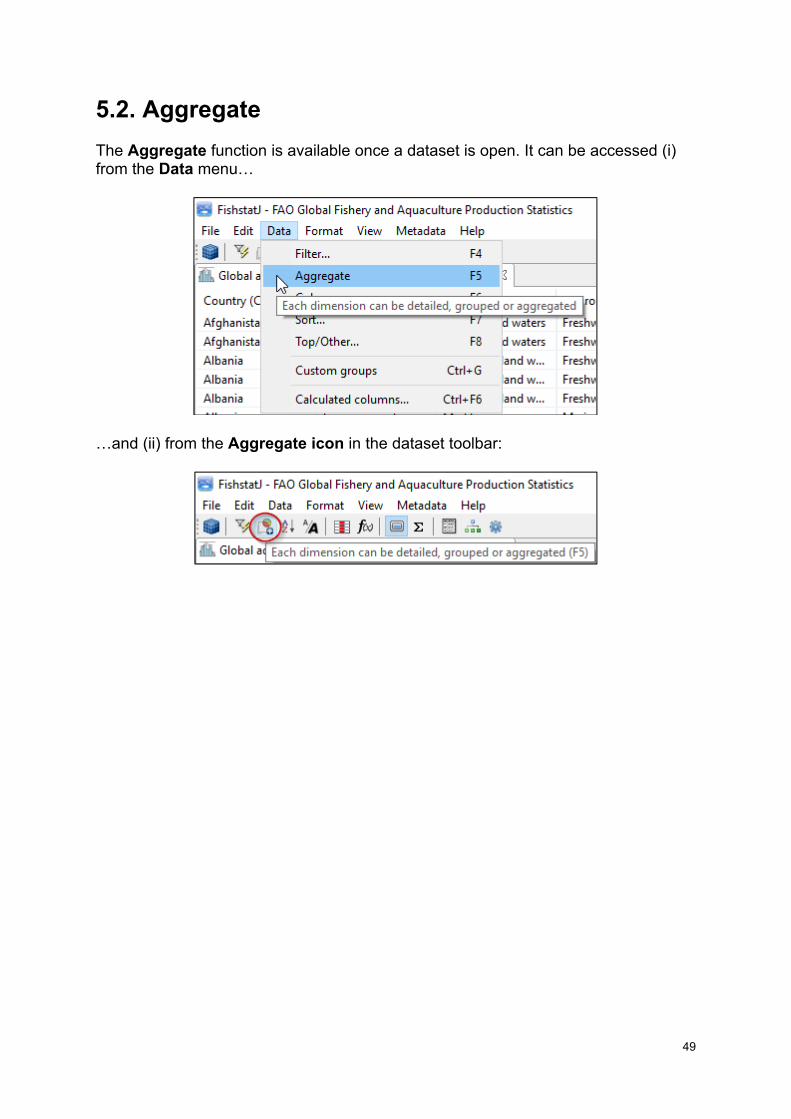
5.2. Aggregate
The Aggregate function is available once a dataset is open. It can be accessed (i) from the Data menu…
…and (ii) from the Aggregate icon in the dataset toolbar:
50
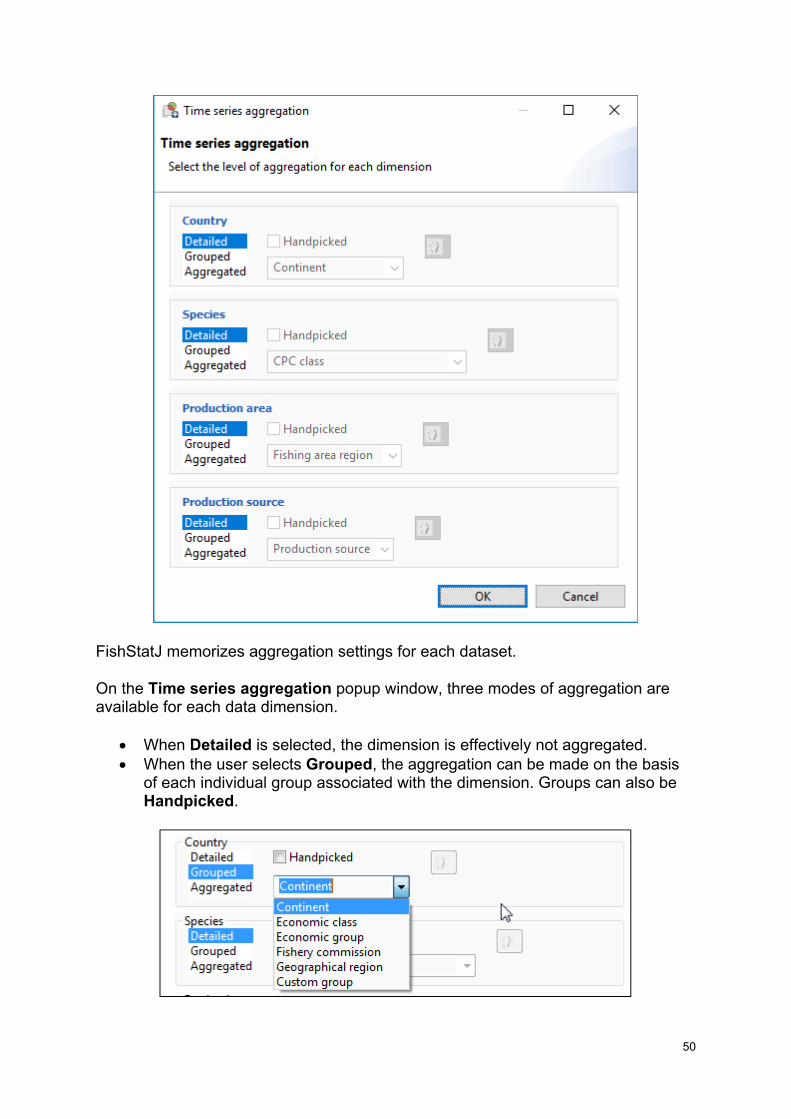
FishStatJ memorizes aggregation settings for each dataset.
On the Time series aggregation popup window, three modes of aggregation are available for each data dimension.
When Detailed is selected, the dimension is effectively not aggregated. When the user selects Grouped, the aggregation can be made on the basis
of each individual group associated with the dimension. Groups can also be Handpicked.
51
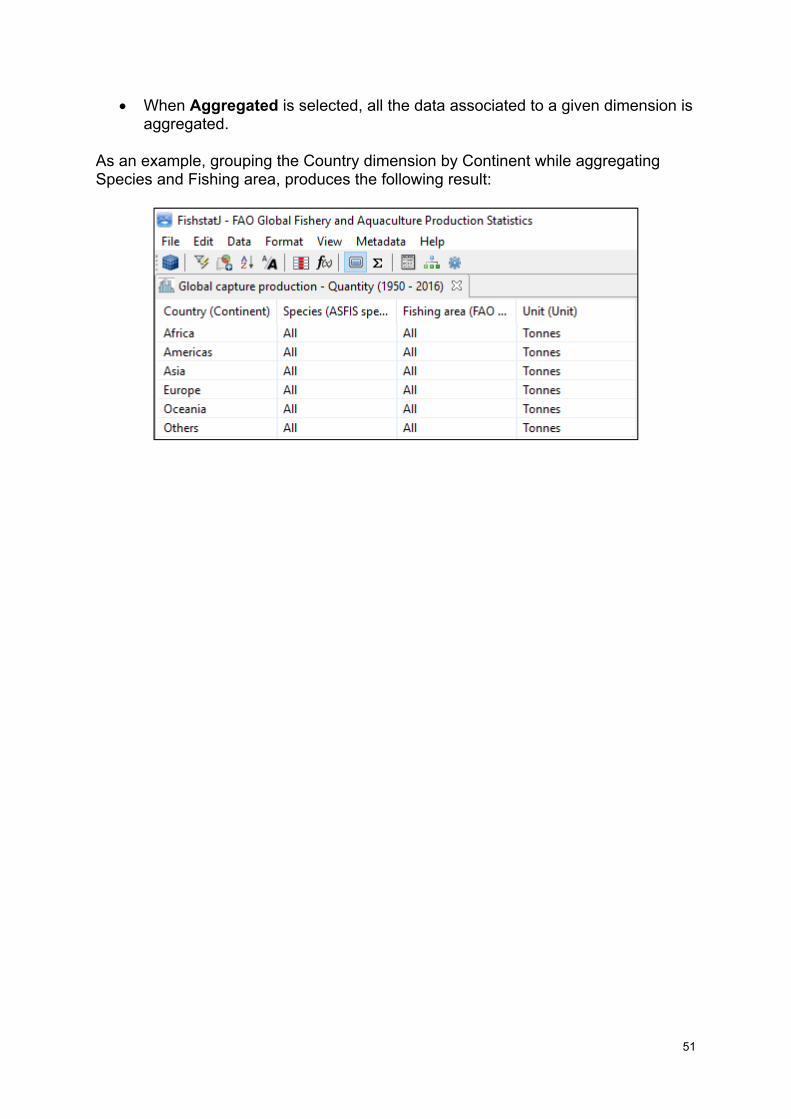
When Aggregated is selected, all the data associated to a given dimension is aggregated.
As an example, grouping the Country dimension by Continent while aggregating Species and Fishing area, produces the following result:

52
5.3. Columns...
This function allows the user to change the columns (attributes) that are used to view the dataset. A Preferences panel is used, because the settings are remembered.
The Columns function can be accessed (i) from the Data menu…
… and (ii) from the toolbar by clicking on the Columns icon.
53
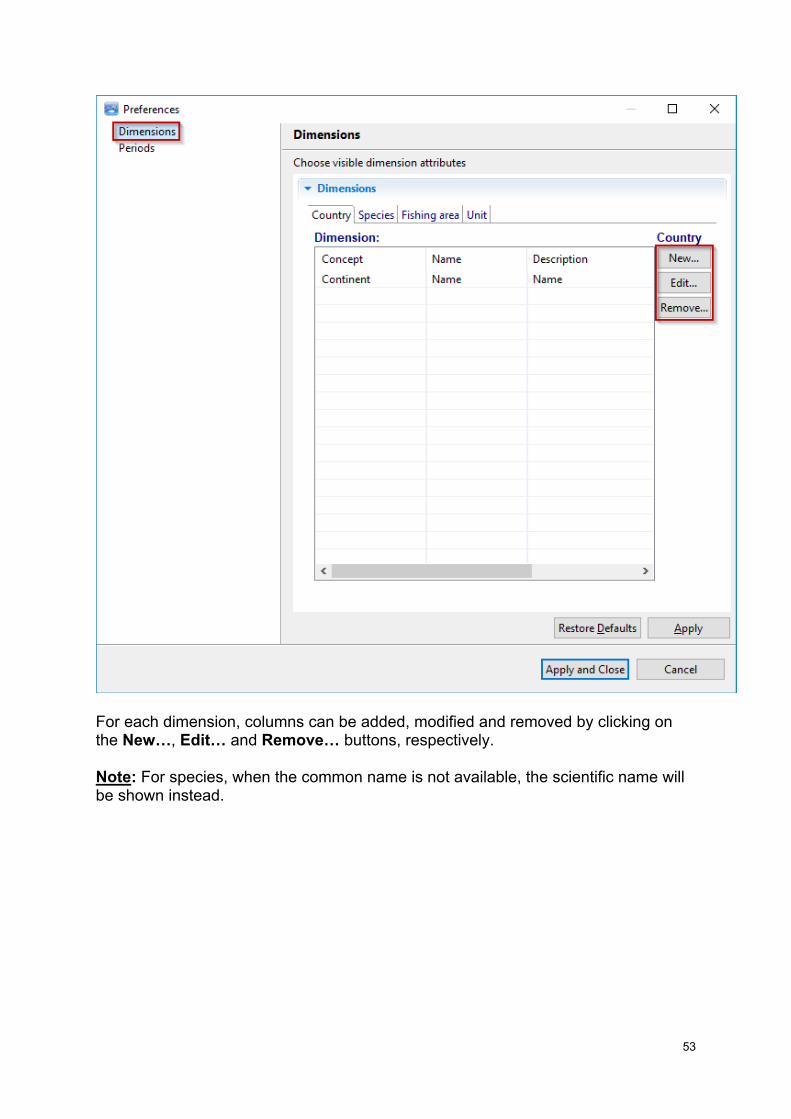
For each dimension, columns can be added, modified and removed by clicking on the New…, Edit… and Remove… buttons, respectively.
Note: For species, when the common name is not available, the scientific name will be shown instead.

54
When creating a new column or modifying an existing one, the Concept used to display a given Dimension can be changed by selecting Concept:
For each Concept, the Attribute can be selected:

55
Example: for the Species dimension, the common names used to display species can be replaced with the corresponding scientific names by selecting the Scientific name attribute.
Periods are the years on display, which may be changed, as shown below:

56
5.4. Sort...
The Sort function can be accessed (i) from the Data menu…
… and (ii) from the toolbar by clicking on the Sort icon.
57
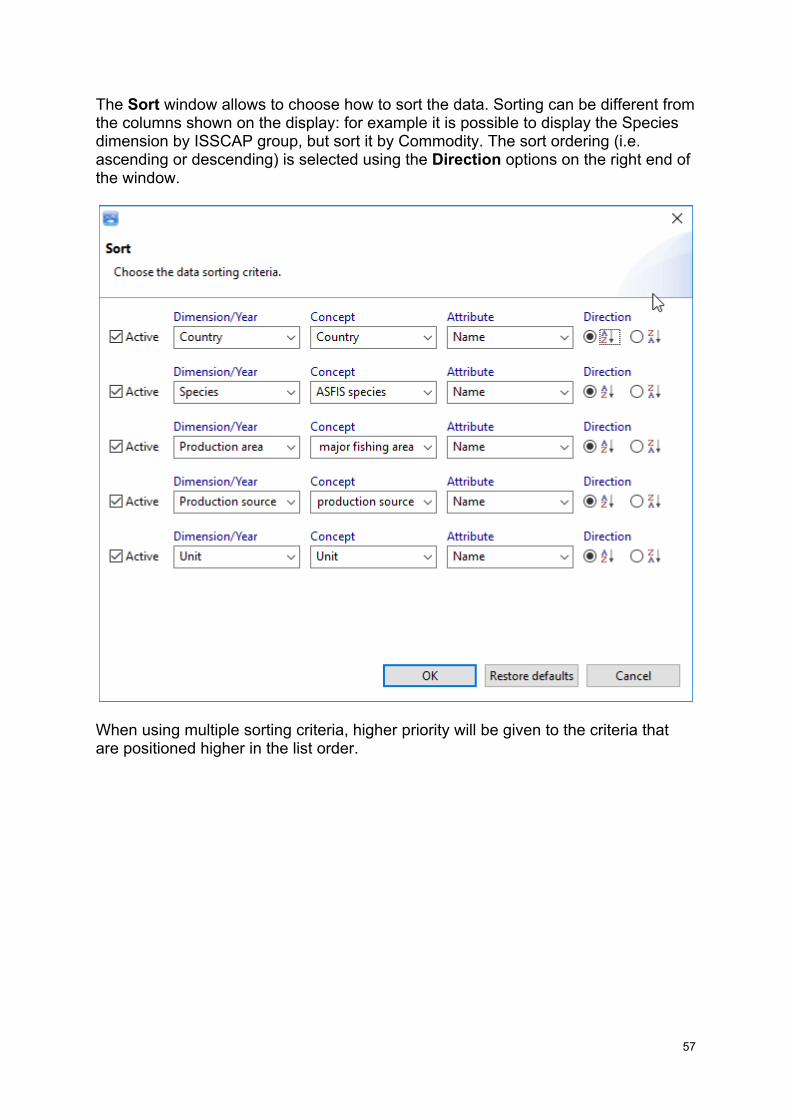
The Sort window allows to choose how to sort the data. Sorting can be different from the columns shown on the display: for example it is possible to display the Species dimension by ISSCAP group, but sort it by Commodity. The sort ordering (i.e. ascending or descending) is selected using the Direction options on the right end of the window.
When using multiple sorting criteria, higher priority will be given to the criteria that are positioned higher in the list order.

58
5.5. Top/Other...
The Top/Other function can be accessed (i) from the Data menu…
… and (ii) from the toolbar by clicking on the Top/Other icon.

59
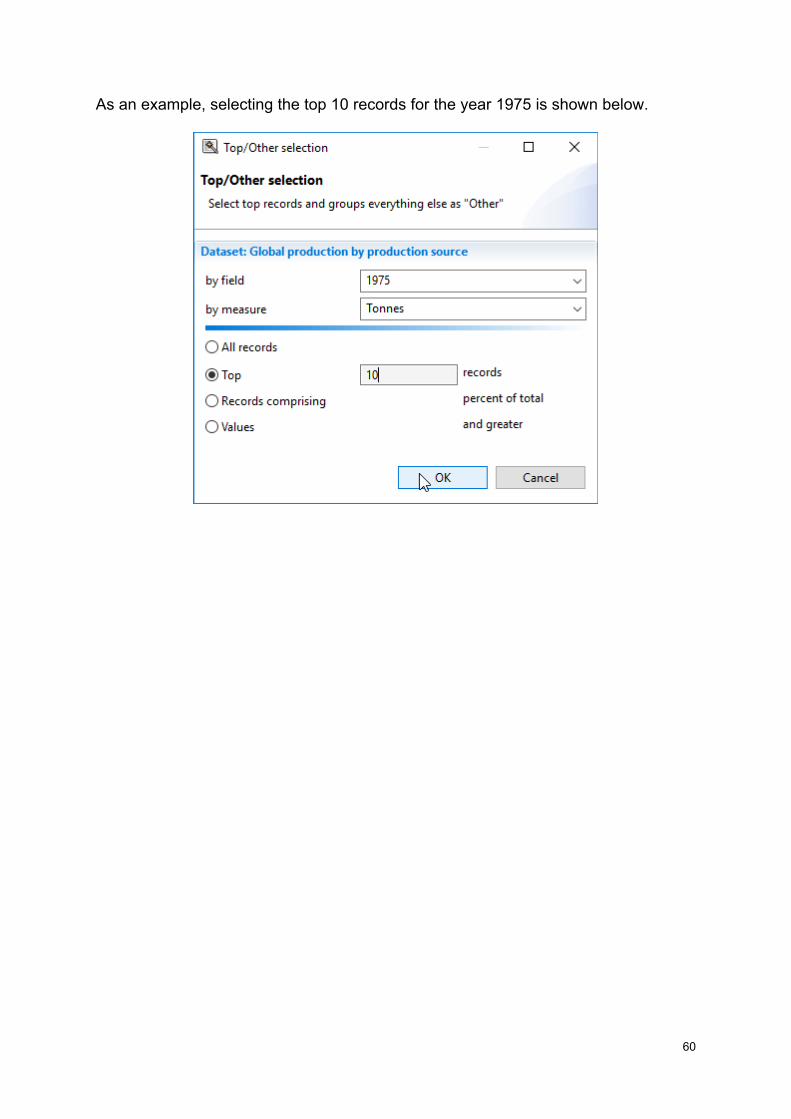
The Top/Other menu allows selecting records by the following criteria: Top [number] of records; Top [percentage] of records; or records greater than [cut-off value].
You can enter selection value (number of records/percent of records/value greater). All records that do not meet the criteria are aggregated into others, this is why the function is called Top/Other.
60
As an example, selecting the top 10 records for the year 1975 is shown below.

61
5.6. Custom groups
The Custom groups function allows the user to define specific groups of countries, species, fishing areas, and measures. Typically, such groups are created by users to avoid repeated filtering for groups that are part of common workflows.
Custom groups can be accessed (i) from the Data menu…
… and (ii) from the toolbar by clicking on the Custom groups icon.
Note: The Custom groups menu item is only available when a dataset is open.

62
A number of custom groups are predefined for some time series elements. The above screen shows the custom groups for the Country dimension, while the image below shows custom groups that already defined for the Species dimension.
When a new custom group is to be created with the New... button, the New custom group definition window appears on the screen.

63
When an existing custom group requires editing with the Edit... button, the New custom group definition popup is presented with the existing group members listed in the Include field.
A Custom group name and Custom group description can be entered in the lower part of the window. As a minimum the English field should be filled.
64
5.8. Calculated columns...
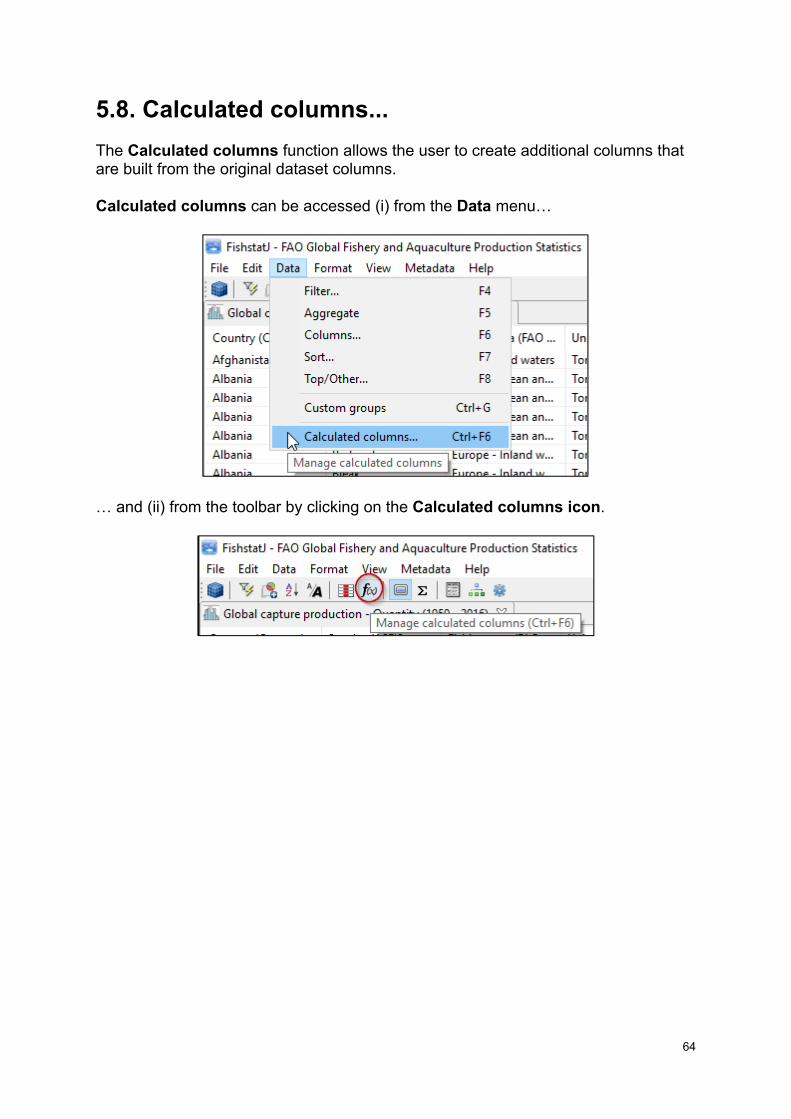
The Calculated columns function allows the user to create additional columns that are built from the original dataset columns.
Calculated columns can be accessed (i) from the Data menu…
… and (ii) from the toolbar by clicking on the Calculated columns icon.

65
When this function is accessed, a Calculated columns Preferences window appears, where the user can create or edit calculated columns is displayed as shown below:

66
Calculated columns may be created (New...) or edited (Edit...) by clicking on the corresponding buttons. This opens the Calculated columns definition popup window.
67
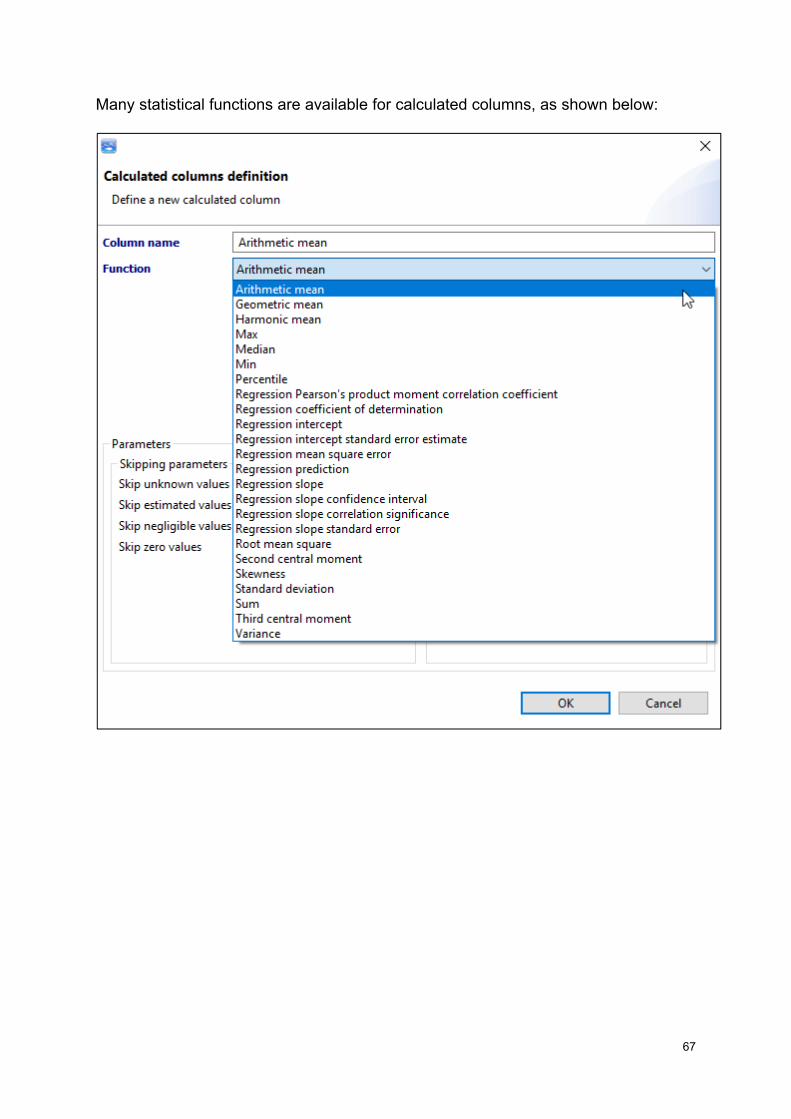
Many statistical functions are available for calculated columns, as shown below:

68
When a calculated column is created, it is shown on the right side of the dataset panel:

69
6. Format menu 6.1. Column width
Selecting Column width will take the user to the Data display tab of the Preferences window. See section 4.4.2 for more information.
6.2. Number formatting
Selecting Number formatting will take the user to the Data display tab of the Preferences window. See section 4.4.3 for more information.
6.3. Symbols and colors
Selecting Symbols and Colors width will take the user to the Data display tab of the Preferences window. See section 4.4.4 for more information.

70
7. View menu The View menu is only enabled when a dataset is open, otherwise it is dimmed (not available).
7.1. Show details
Selecting or deselecting this option will turn on or off the detailed information that is displayed at the bottom of the FishStatJ main display.
The Show details option can be toggled on and off (i) from the View menu…
… and (ii) from the toolbar by clicking on the Show details icon.

71
Turning on this option will reduce the number of time series records on display. On the image below, the Row Details tab is turned on.
72
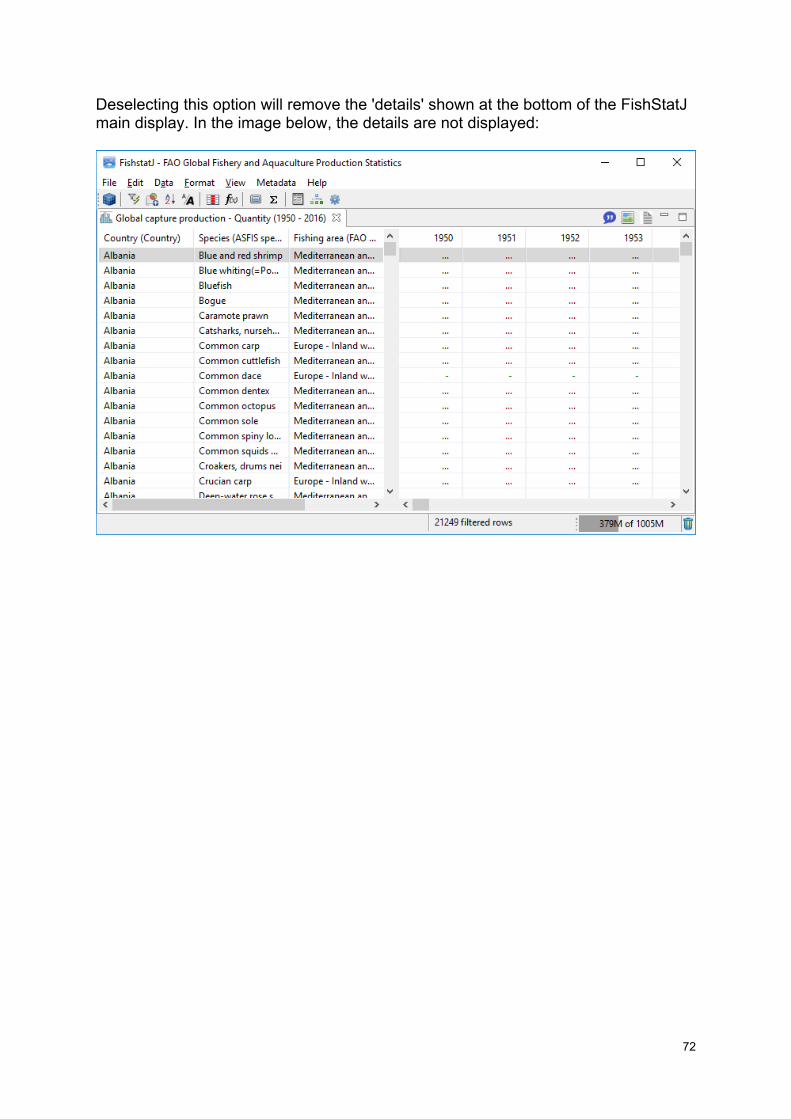
Deselecting this option will remove the 'details' shown at the bottom of the FishStatJ main display. In the image below, the details are not displayed:

73
7.2. Grand totals
Activating Grand totals will create one or two (depending on the dataset) additional tabs in the FishStatJ display that show grand totals for the time-series.
The Grand totals option can be toggled on and off (i) from the View menu…
… and (ii) from the toolbar by clicking on the Grand totals icon.
74
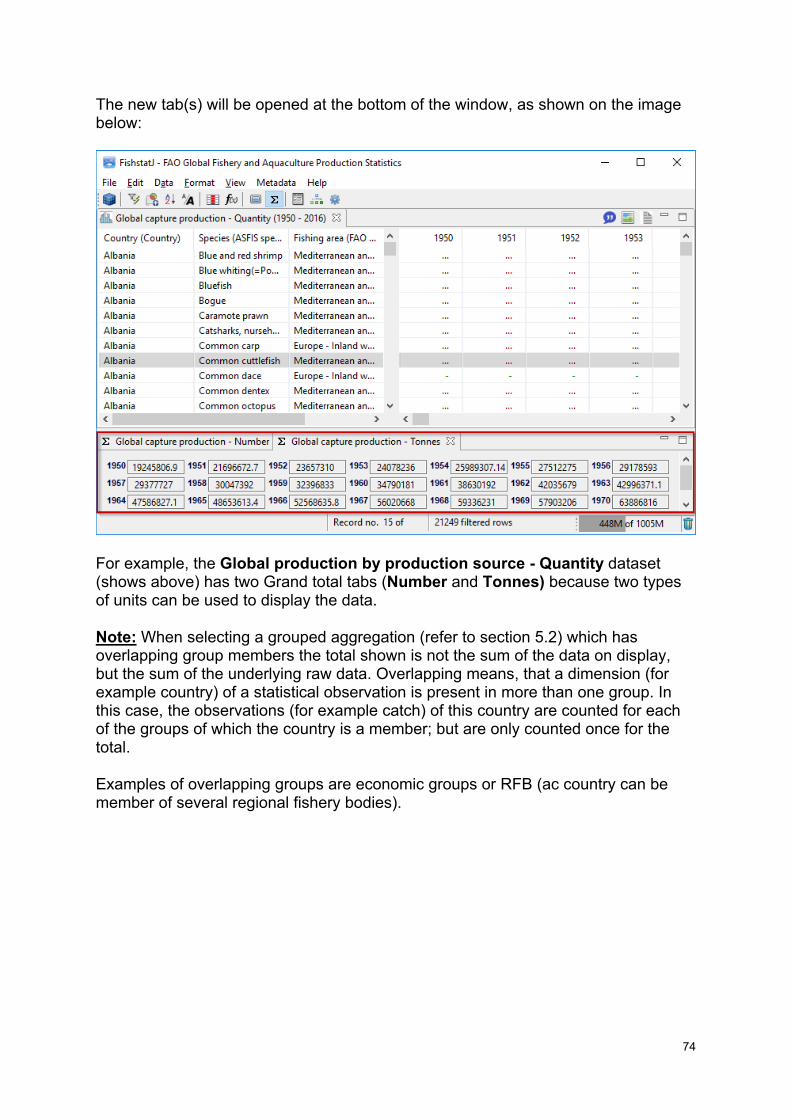
The new tab(s) will be opened at the bottom of the window, as shown on the image below:
For example, the Global production by production source - Quantity dataset (shows above) has two Grand total tabs (Number and Tonnes) because two types of units can be used to display the data.
Note: When selecting a grouped aggregation (refer to section 5.2) which has overlapping group members the total shown is not the sum of the data on display, but the sum of the underlying raw data. Overlapping means, that a dimension (for example country) of a statistical observation is present in more than one group. In this case, the observations (for example catch) of this country are counted for each of the groups of which the country is a member; but are only counted once for the total.
Examples of overlapping groups are economic groups or RFB (ac country can be member of several regional fishery bodies).
75
8. Metadata menu The Show notes…, Show citation… and Show map… items are enabled depending on the attachments that are available for the current dataset.
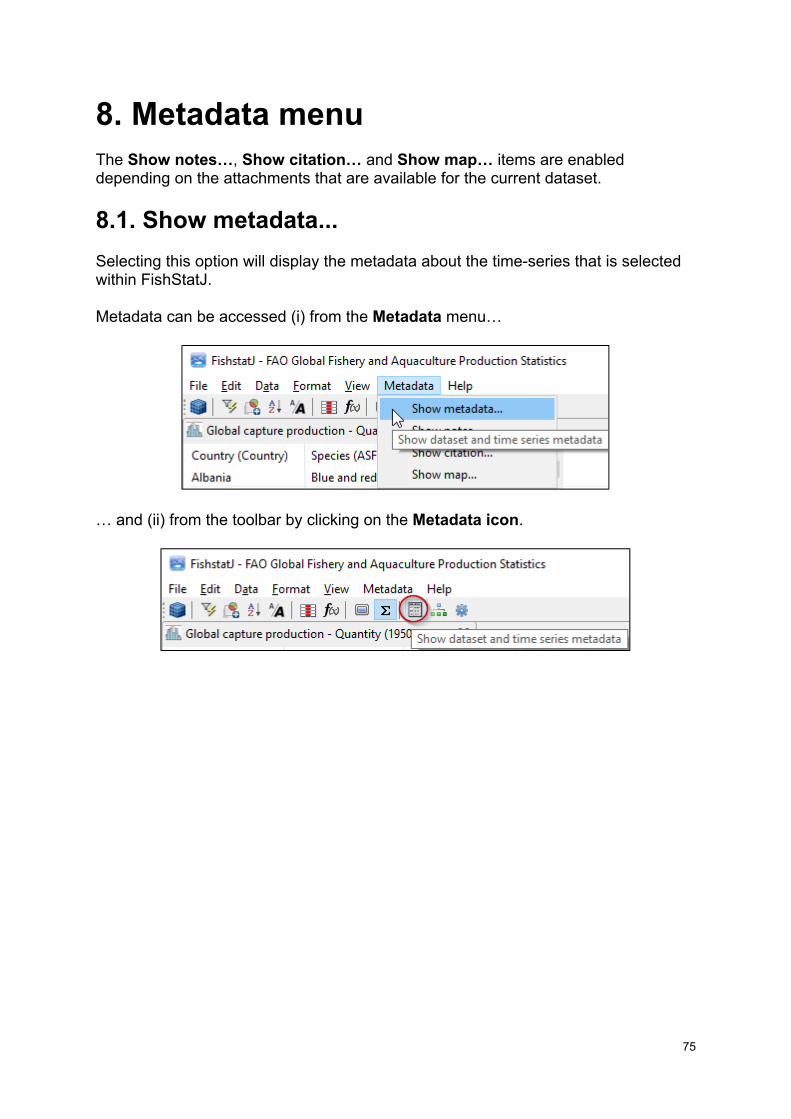
8.1. Show metadata...
Selecting this option will display the metadata about the time-series that is selected within FishStatJ.
Metadata can be accessed (i) from the Metadata menu…
… and (ii) from the toolbar by clicking on the Metadata icon.

76
An example of the window showing metadata is shown below:
77
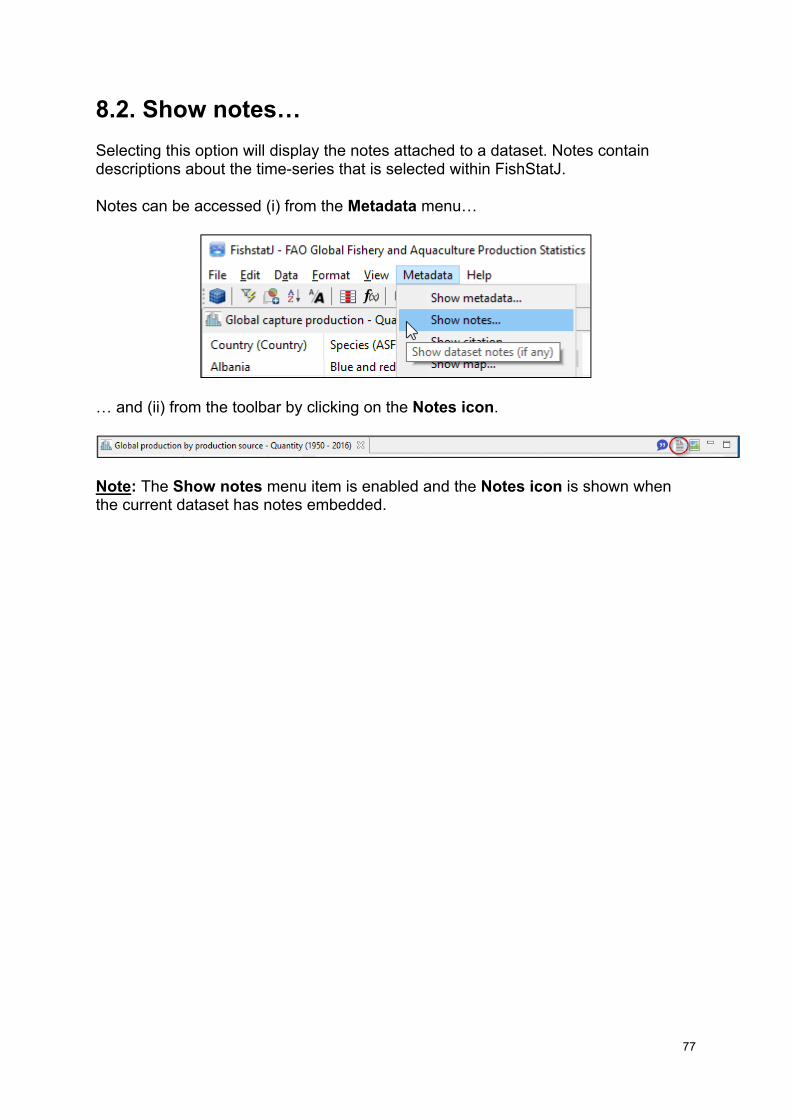
8.2. Show notes…
Selecting this option will display the notes attached to a dataset. Notes contain descriptions about the time-series that is selected within FishStatJ.
Notes can be accessed (i) from the Metadata menu…
… and (ii) from the toolbar by clicking on the Notes icon.
Note: The Show notes menu item is enabled and the Notes icon is shown when the current dataset has notes embedded.

78
An example of the Notes window is displayed below:
79
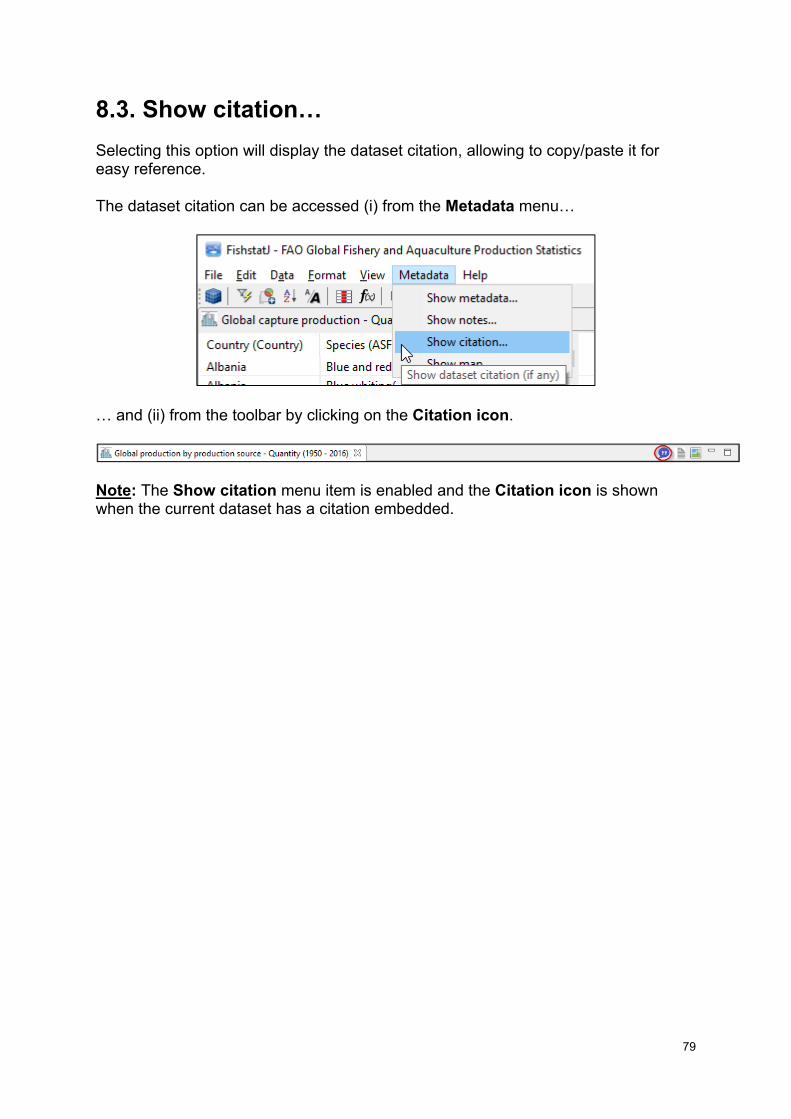
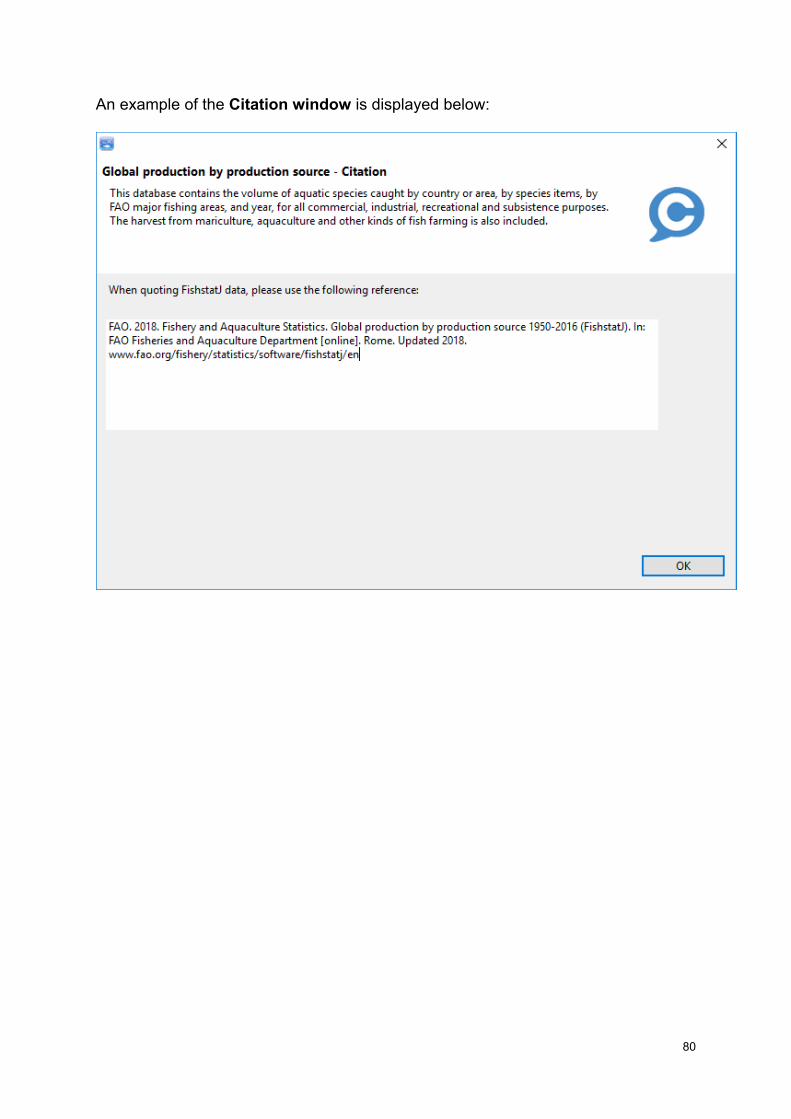
8.3. Show citation…
Selecting this option will display the dataset citation, allowing to copy/paste it for easy reference.
The dataset citation can be accessed (i) from the Metadata menu…
… and (ii) from the toolbar by clicking on the Citation icon.
Note: The Show citation menu item is enabled and the Citation icon is shown when the current dataset has a citation embedded.
80
An example of the Citation window is displayed below:
81
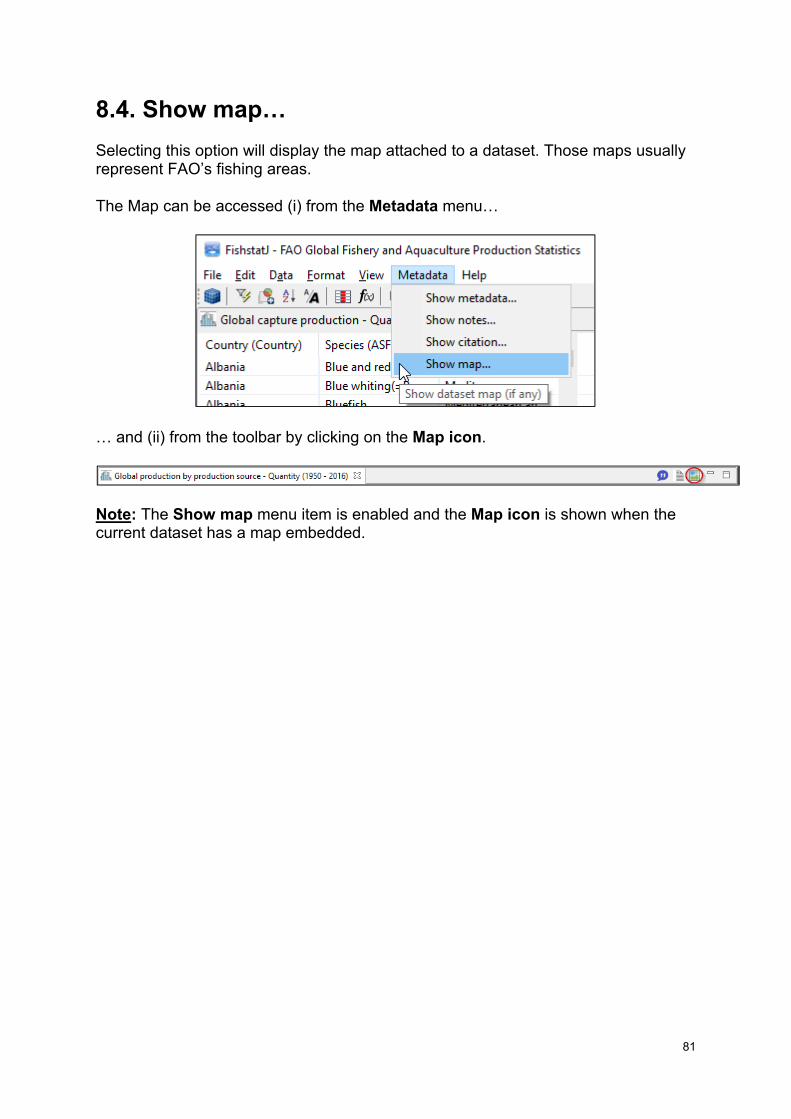
8.4. Show map…
Selecting this option will display the map attached to a dataset. Those maps usually represent FAO’s fishing areas.
The Map can be accessed (i) from the Metadata menu…
… and (ii) from the toolbar by clicking on the Map icon.
Note: The Show map menu item is enabled and the Map icon is shown when the current dataset has a map embedded.

82
An example of the Map window is displayed below:
83
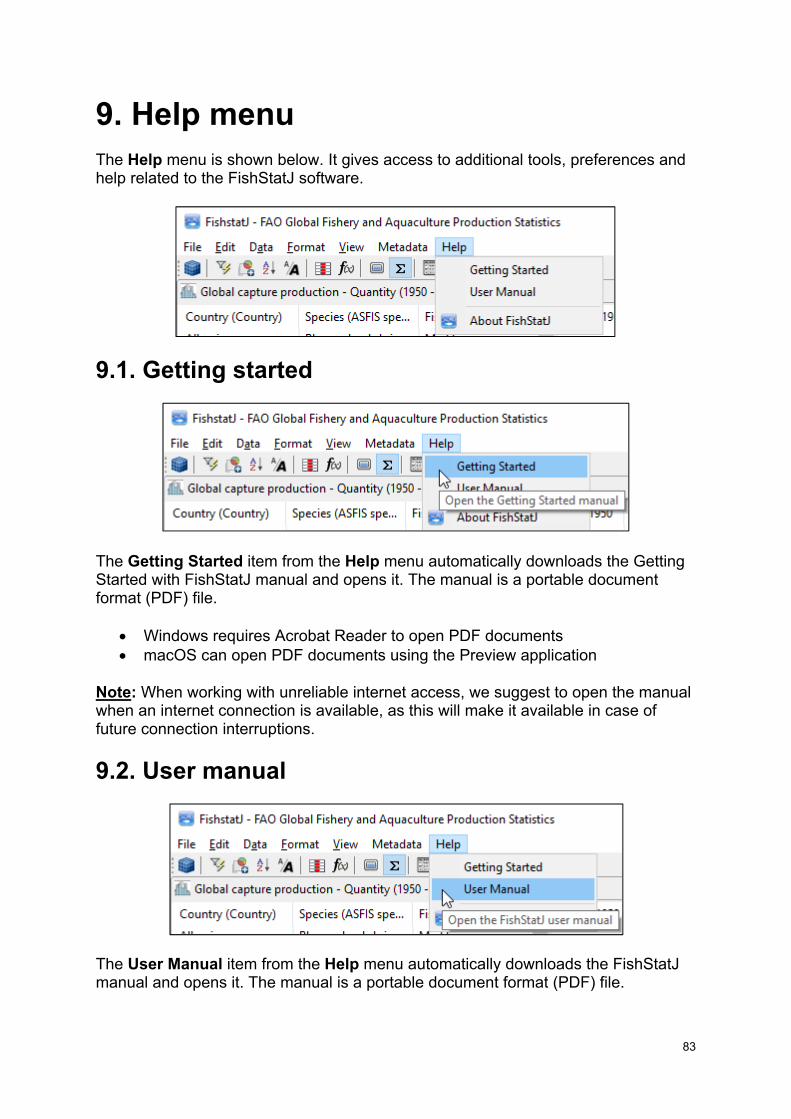
9. Help menu The Help menu is shown below. It gives access to additional tools, preferences and help related to the FishStatJ software.
9.1. Getting started
The Getting Started item from the Help menu automatically downloads the Getting Started with FishStatJ manual and opens it. The manual is a portable document format (PDF) file.
Windows requires Acrobat Reader to open PDF documents macOS can open PDF documents using the Preview application
Note: When working with unreliable internet access, we suggest to open the manual when an internet connection is available, as this will make it available in case of future connection interruptions.
9.2. User manual
The User Manual item from the Help menu automatically downloads the FishStatJ manual and opens it. The manual is a portable document format (PDF) file.

84
Windows requires Acrobat Reader to open PDF documents macOS can open PDF documents using the Preview application
Note: When working with unreliable internet access, we suggest to open the manual when an internet connection is available, as this will make it available in case of future connection interruptions.
9.3. About FishStatJ
This item presents FishStatJ information about the program version, legal use, and contacts for assistance. The About FishStatJ window is shown below:

85
10. Frequently asked questions (FAQ) 10.1. How to export data?
You can export data from FishStatJ in two different ways (for more information, refer to section 4):
You can simply copy a selection of rows and paste it on an Excel file (with the right button menu or with the CTRL + C shortcut).
Or you can go to File → Export selection (CSV file)… You can configure how data and symbols are exported (or not exported) in Edit → Preferences → Data export (refer to section 4.4.5)
10.2. What does that symbol mean?
FishStatJ uses the following symbols for statistical data: ... Data not available; unobtainable; Data not separately available but included
in another category - Nil or zero 0 More than zero but less than half the unit used F FAO estimate from available sources of information nei Not elsewhere included
In FishStatJ, you can configure the color of the symbols in the panel: Edit → Preferences → Data Display → Symbols and Colors (refer to section 4.4.4). As for data and symbol export to Excel, please be informed that you can configure how data and symbols are exported (or not exported) in: Edit → Preferences → Data export. Don’t export symbols is one of the options you can select (refer to section 4.4.5).
10.3. Why am I getting different numbers than those from the FAO Yearbook of Fishery and Aquaculture Statistics/SOFIA?
Trying to cover all products derived from fisheries activities, in both inland and marine waters, the FAO Fishery production datasets (capture and aquaculture), include some products which are not (or not directly) destined to food consumption, such as marine mammals, crocodiles, corals, pearls, mother-of-pearl, sponges and aquatic plants. Those products are excluded from the all country, regional and world totals presented in FAO Yearbooks of Fishery Statistics as well as other FAO publications. When viewing time-series data in FishStatJ, in order to obtain the same aggregates you must first filter the dataset using a Custom Group:
86
1. Open the Time series filtering window (Data → Filter or F4) 2. Click the Species tab 3. Click the Groups combo box and select Custom Group 4. Click Fish, crustaceans, molluscs, etc. 5. Click the single left arrow in order to move all selected species belonging to Fish, crustaceans, molluscs, etc. under the Include panel on the left. 6. Click on the OK button. The program will return you to FishStatJ’s main window. The aggregation grouping for capture and aquaculture datasets is mentioned in the dataset notes where applicable. Access to dataset notes is explained in section 8.2.

87
10.4. Some historical data figures have changed. Why?
Refer to section 11.3 for a discussion on data revisions.
10.5. Where to find detailed notes for each dataset?
Additional information about the statistics presented in each dataset collection are available in the General notes, accessible in Metadata → Show metadata → Attachments (or by clicking on top right button of data panel). Refer to section 8.2 and 8.3 for viewing dataset notes and data citation.

88
10.6. Can I use FishStatJ offline?
When the download of the auto-update information fails, FishStatJ produces the following warning:
If there is no internet connection possible, FishStatJ will run but the following functions will not be available:
The notification of a new program version is not available (Refer to section 11.6 for a detailed description of the auto-update notification, and a description of data download from the internet).
No workspaces are shown for automatic download: the Manage workspaces dialog only shows workspaces already downloaded/installed (refer to section 3.1)
Download of the user manual is not possible (refer to section 9.29.1)
Section 4.4.6 explains Internet access proxy configuration.
89
10.7. How often is the data/application updated?
We publish new data as soon as we receive the complete set from member countries and have completed our verification. Usually, datasets are updated once per year. The release time for Global Capture and Aquaculture Production is in the second quarter every year. New or updated datasets will automatically show in the Manage workspaces menu; refer to section 3.1 for a detailed explanation. When the FishStatJ application is launched, it will also check for updates – and inform you if there is a new version available for download; refer to section 11.6 for the auto-update notification. Data update/revisions are explained in section 11.3; internet access is discussed in section 4.4.6.
10.8. FishStatJ is being flagged as a virus threat
We have received various reports indicating that the FishStatJ software has been falsely identified as being a virus threat. Indeed, we work hard for FishStatJ to be the best product possible, and we would not knowingly distribute an infected version. Wikipedia defines a false-positive as a false alarm: wikipedia.org/wiki/False_positives_and_false_negatives. If you receive such alert from your antivirus software, we suggest the following actions, in the following order:
Please send us an e-mail ([email protected]), describing the antivirus software used, and the alert message received (this way we can double-check your download, and also warn other users).
Please inform you virus software vendor and notify them of the ‘false positive’ indication. The vendor can then quickly investigate (check our download) and release an update to their virus definitions (definitions are patterns to detect infected software).
If you think FishStatJ is corrupted, the best is to re-download and expand a fresh copy.
NEVER consider deactivating your virus protection - that would be irresponsible in
this digital age!

90
10.9. How does FAO assign nationality to catches?
As established by the United Nations Statistical Commission in 1954, catches are assigned to the country of the flag flown by the fishing vessel. The flag State is also responsible for the provision of the relevant data to FAO and other organizations such as Regional Fishery Bodies (RFBs).
11. More on FishStatJ 11.1. FishStatJ legal specifications
The FishStatJ software is provided free of charge to member countries of the Food and Agriculture Organization (FAO). It may be installed on personal or company computers without restriction or license. The statistics contained in this package may be used and published freely provided that the source is cited as FAO.
11.2. Bibliographic citation
FAO encourages the use, reproduction and dissemination of material in this information product. Except where otherwise indicated, material may be copied, downloaded and printed for private study, research and teaching purposes, or for use in non-commercial products or services, provided that appropriate acknowledgement of FAO as the source and copyright holder is given and that FAO’s endorsement of users’ views, products or services is not implied in any way.
All requests for translation and adaptation rights, and for resale and other commercial use rights should be made via fao.org/contact-us/licence-request or addressed to [email protected].
When quoting FishStatJ data, please use the reference that you can find in the General Notes attached to each dataset (Metadata → Show metadata → Attachments).
The citation for each dataset is available in the Metadata → Show citation menu.
The bibliographic citation for FishStatJ is as following:
FAO Fisheries and Aquaculture Department, Statistics and Information Service. FishStatJ: Universal software for fishery statistical time series. Copyright 2019.
11.3. Data versioning and Data revisions
Where necessary, the data published in the previous releases of the dataset(s) of fishery and aquaculture statistics are revised. Where figures in this release differ from those previously published, the amended data represent the most recent version. Some statistics provided to FAO by national

91
offices, in particular those for most recent year, are provisional and may be amended in future editions. The version and revision of the data installed, and version/revision of data available for download are visible in the Manage workspaces menu; refer to section 3.1. An example of the version of FishStatJ is “2017.1.0”
Major version: is the year when the data was released (2017) Minor version: is the release (1) and revision number (0)
Occasionally, we find errors, or we receive data from member countries after the release of the FishStatJ workspace. In these rare cases, we release a new revision of the data by increasing the revision number. This way, the new version is automatically visible in the Workspaces Manager as a new download. In this case, we would also include an explanation in the dataset notes. Refer to section 8.2 how to view dataset notes.
11.4. FishStatJ workspace folder
FishStatJ stores imported workspaces (and application files) in the user home directory:
For Windows, use the Windows + R shortcut to open the Run command, enter %USERPROFILE%\fishstatj_workspace and click OK
For macOS Finder enter ~/fishstatj_workspace in Go → Go to Folder menu
The information inside workspace folder is described in detail below. Refer to section 11.5 how to remove (un-install) FishStatJ.
11.4.1. FishStatJ workspaces Workspaces are stored in the FishStatJ workspace folder. They contain the time-series data, including the reference data (dimensions), and attachments (maps, dataset notes). There is one folder for each workspace installed. Workspaces can be deleted permanently from disk, by opening the Manage workspaces menu and by using the Delete button.
11.4.2. Workspace metadata folder The FishStatJ application’s log and preferences are stored in the workspace folder, in a sub-folder called “.metadata”. The FishStatJ application log is called “.log”. FishStatJ application preferences are saved in this location: .metadata/.plugins/org.eclipse.core.runtime/.settings
92
Note: on macOS files and folders starting with a dot an invisible. To open the folder enter ~/fishstatj_workspace/.metadata in Go → Go to Folder menu.
11.4.3. Workspace manual folder The FishStatJ manual is downloaded and opened from the manual folder inside the fishstat_workspace. Refer to section 9.2 for more details on the manual.
11.5. Un-installing FishStatJ
FishStatJ can be un-installed by deleting the FishStatJ application folder (macOS: the application icon). The Windows application is usually located at: C:\FishStatJ.
FishStatJ stores imported workspaces (data) in the user home directory; these can be deleted as well:
For Windows enter %USERPROFILE%\fishstatj_workspace in the Run menu
For macOS Finder enter ~/fishstatj_workspace in Go → Go to Folder menu
FishStatJ is a cross-platform application and therefore does not use the Windows-registry, it stores all data and settings in the application and user home directory, as described above.
11.6. FishStatJ update notification
Starting with version 3.01 FishStatJ has automatic update capability built in. At program launch a very small XML file (~1KB) is downloaded from the FAO web-site. If the download of this file fails, FishStatJ will show a warning message (refer to section 10.6– No internet connection) and will continue to work with the data downloaded locally.
The URL download location of the XML file is shown in preferences, refer to section 4.4.6 - Internet Access.
The XML file enables the following 3 functions in FishStatJ, which are described below.

93
11.6.1. Automatic update notification
When we release a new version of FishStatJ, Windows users will see the following message at program startup; macOS users receive the program update notification shown in 11.6.2:
Clicking the Start update button will start the download of the auto-extract file:
Once the download is complete, FishStatJ quits, and the extraction dialog appears:
Clicking the Yes button will expand the software, and launch the new version of FishStatJ.
If no internet connection is available at start-up, a message appears (section 10.6– No internet connection).

94
11.6.2. Update notification
When we release a new version of FishStatJ, you will see the following message at program startup:
Clicking the Yes button will open the FAO FishStatJ web-page in a web browser. On this page, you find the latest FishStatJ application for download.
Note: The user has to perform the download of the application program, and install it on the PC. There is no auto-download or auto-update of the application.
If no internet connection is available at start-up, a message appears (section 10.6– No internet connection).
11.6.3. Workspace download
FishStatJ will show new or updated workspaces in the Manage workspaces dialog. Using this dialog, the user can choose which workspace to download and install on the PC.
For a description of the workspace management; please refer to section 3.1-Manage workspaces.
Refer to section 11.3 for an explanation of workspace/data versioning.
Available workspaces, their version and download location are contained in the XML file; if no internet connection is available then only workspaces downloaded and installed previously are shown.
11.6.4. FishStatJ manual download
The first time the manual is opened, or when a new version is available, the PDF manual is downloaded. The version of the manual and download location of the manual is contained in the XML file.
Refer to section 9.2 (User Manual) for how to open the FishStatJ manual.
The FishStatJ manuals are downloaded to the workspace folder. Refer to section 11.4.3 (FishStatJ manual folder).

95
When running offline, the manual can only be opened if it was previously downloaded.

CA7131EN/1/12.19
ISBN 978-92-5-131993-2
9 7 8 9 2 5 1 3 1 9 9 3 2
Assistance and contact
On the FishStatJ web-page (fao.org/fishery/statistics/software/fishstatj/en) you can find:
New program versions for download A quick-start guide for installing the program The download link to this manual The e-mail contact for support ([email protected])