fish monitoring on the spiegel grove artificial reef
TRANSCRIPT

Spiegel Grove Monitoring – 2002 – 2007, Final Report. Submitted by the Reef Environmental Education Foundation, page 1
Fish Monitoring on the Spiegel Grove Artificial Reef April 2002 – August 2007
Final Report
Prepared by the Reef Environmental Education Foundation (REEF)
November 28, 2007
Background
The Spiegel Grove is a 510’ Navy Landing Ship Dock that was intentionally sunk off Key Largo, Florida, on June 10, 2002, to serve as a recreational diving and fishing artificial reef (Figure 1). The ship lies in 130’ of water; at its broadest point the deck is 84’ wide, creating a wall-like habitat from 45’ to the sandy bottom. Since the Spiegel Grove was righted by Hurricane Dennis (2005), the top deck now lies in approximately 85’ depth. At the time of its sinking, the Spiegel Grove was the largest vessel intentionally sunk. Monroe County, the Upper Keys Artificial Reef Foundation (UKARF) and the Florida Keys National Marine Sanctuary (FKNMS) worked closely to obtain, clean, scuttle and sink the vessel, as well as raise funds for the effort. Prior to the sinking, the Reef Environmental Education Foundation (REEF) was contracted by Monroe County to conduct a study with pre- and post-deployment monitoring on the fish assemblages of the Spiegel Grove and adjacent reef areas for a period of 5 years. This document summarizes that effort. A separate study was conducted recently to assess the relative socioeconomic benefits of the Spiegel Grove that is not part of REEF’s work but has important results for reader consideration as a companion to this biological study (Leeworthy et al. 2006) REEF is an international non-profit marine conservation organization that runs hands-on grassroots activities designed to educate and engage local communities in conservation-focused activities. REEF is based in Key Largo, Florida, with a Pacific office in Seattle, Washington. The mission of REEF is to conserve marine ecosystems for their recreational, commercial, and intrinsic value by educating, enlisting and enabling SCUBA divers and other marine enthusiasts to become active stewards and citizen scientists. REEF links the diving community with scientists, resource managers and conservationists through marine-life data collection and related activities. REEF coordinates the Volunteer Survey Project, which has trained and involved over 10,000 divers and snorkelers in marine life identification and the collection of useful population and distribution data. This citizen science program has generated one of the largest marine life databases in the world, with over 100,000 surveys conducted to date. It was anticipated that with the sinking of the Spiegel Grove, a change in fish community structure on the sinking site and potentially on nearby reefs would take place. In 2002, REEF implemented a 5-year monitoring plan to document fish species presence/absence, sighting frequency and estimated abundance over time at the Spiegel Grove site and at 7 nearby natural and artificial reef sites. The primary goal of the monitoring was to document fish recruitment to the Spiegel Grove site, detect changes over time in the assemblage and compare patterns between sites.

Spiegel Grove Monitoring – 2002 – 2007, Final Report. Submitted by the Reef Environmental Education Foundation, page 2
Method and Sampling Design
Surveys were conducted using the Roving Diver Technique (RDT; Schmitt & Sullivan 1996). The RDT is a non-point visual survey method specifically designed to generate a comprehensive species list and sighting frequency and relative abundance estimates. During RDT surveys, divers swim freely throughout a dive site and record every observed fish species. During each survey, divers assign each recorded species one of four log10 abundance categories [single (1); few (2-10), many (11-100), and abundant (>100)]. Following the dive, each surveyor records the species data along with survey time, depth, temperature, and other environmental information on a REEF scansheet. The scansheets are returned to REEF, the data are error-checked, scanned and digitized, and scansheets are error-checked once more using quality control programs. Data are then uploaded into the REEF database. Once entered into the REEF database, summary data are displayed on the Internet at REEF’s homepage (http://www.REEF.org) by geographic location, including a complete species list, sighting frequency of each species, and density score for each species, where
Sighting Frequency (%SF) = number of surveys reporting species / total number of surveys at that site, and Density Score (DEN)= [(nSx1)+(nFx2)+(nMx3)+(nAx4)] / (nS + nF + nM + nA), where n is the number of times each abundance category was assigned).
Using these two metrics, a weighted measure of abundance, Abundance Score, can be calculated as %SF * DEN. The RDT method does not include size estimates and therefore documenting changes in size structure will not be possible from this dataset. It is recommended that this study be used as a complement to other monitoring studies. The survey team is made up of 6 REEF Advanced Assessment Team (AAT) members. The AAT is comprised of REEF surveyors who have achieved Level 4 or 5 REEF experience level (Expert rating) through testing and a requisite number of diving surveys and have considerable experience and expertise in surveying local fish populations. Eight sites are surveyed during each monitoring event, including the Spiegel Grove sinking site, 6 adjacent natural reefs and 1 artificial reef (Table 1, Figure 2). Surveying was conducted once prior to deployment in April 2002. Post-deployment monitoring was conducted monthly for the first 3 months, quarterly for the following 3 quarters and annually thereafter for 4 years. This scheme represents a total of 11 monitoring events.
Site Descriptions
The location of the Spiegel Grove site is a barren, level sand bottom with a depth of approximately 130’. The 7 comparison sites were selected by FKNMS staff and represent a broad range of nearby natural and artificial structure (Figure 2). The closest structure to this site is a small patch of hard coral substrate (~30 ft2) located approximately 0.2 miles from the sinking location in a depth of approximately 125’ (called “Rocks next to Spiegel Grove”). The nearest substantial reef structures are

Spiegel Grove Monitoring – 2002 – 2007, Final Report. Submitted by the Reef Environmental Education Foundation, page 3
the natural reef edges at Dixie Ledge and the Red Can Ledges, approximately .4 miles shoreward of the sinking site. These reefs are sloping drop-offs and feature low profile hardbottom with sparse coverings of small hard corals, soft corals such as gorgonians, and sponges. Located approximately .7 miles inshore from the sinking site are Dixie Shoals and the Red Can Shallows. These two hardbottom areas are of moderate rugosity with low profile structure and moderate hard and soft coral cover. Dixie Shoals Shallows and the Red Can Shallows represent the nearest shallow water coral reef communities to the sinking site. More than one mile to the south is the wreck of the Norwegian freighter, the Benwood, which was sunk in 1942. This is the closest artificial reef to the Spiegel Grove sinking site and harbors a large diversity and abundance of fishes. Benwood Ledge is the deep reef area adjacent to the Benwood site and is similar in structure to the two Ledge sites.
Results and Discussion
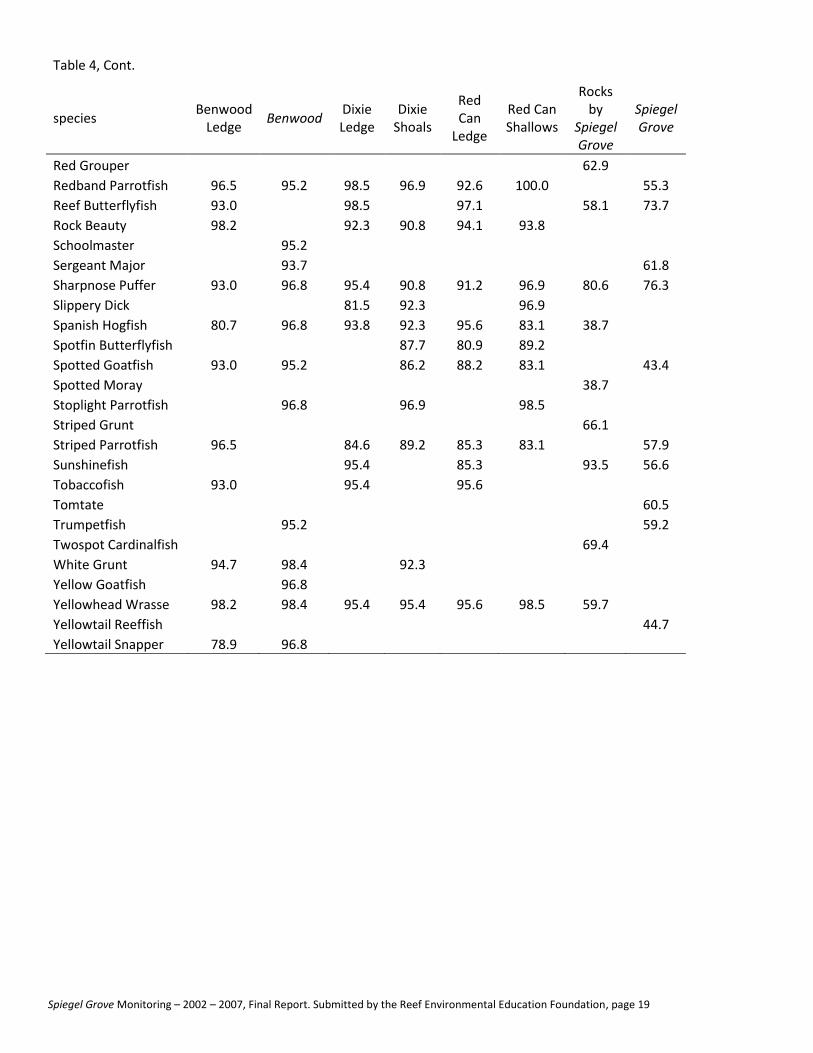
Between 6 and 8 RDT surveys were conducted at each site during each monitoring period (weather prevented effort at Benwood Ledge during the March 2003 event and only 4 surveys were conducted at the Rocks by Spiegel Grove in December 2002) (Table 2). The number of fish species reported at each site during each monitoring event is shown in Figure 3. Fish species rapidly colonized the Spiegel Grove following deployment. Forty-six species were documented on the wreck less than a month after it was deployed. By August 2002, the number of species recorded approached 66 species, which was the average richness per monitoring event for the next 2 years. Beginning in July 2004, average species richness increased to 76, with a high of 81 species documented in August 2005. However, during the last monitoring event in August 2007, the lowest species richness since a month after deployment was recorded (55 species). The Benwood wreck and Red Can Ledge had the highest overall species richness during the study period with 196 and 194 species, respectively, and the Rocks by the Spiegel Grove was the lowest with 118 species reported (Figure 3). A comprehensive list of fish species recorded on the Spiegel Grove during REEF surveys (both during the coordinated monitoring events and during individual REEF volunteer efforts) is given in Table 3. A total of 191 species have been documented (including a few species that are either grouped together or recorded as juveniles separately due to identification limitations). Of these 191 species, 41 species were not documented during the monitoring events, but rather, were documented during many REEF members’ individual survey efforts throughout each year. The Spiegel Grove is a popular dive site not only for the diving public, but for REEF members as well and over the past 5 years, REEF members have added 138 additional Spiegel Grove surveys to the targeted monitoring efforts The top 25 most frequently sighted species at the Spiegel Grove and 7 reference sites are listed in Table 4. Species that were among the most frequently sighted at the reference sites that were also on the list for the Spiegel Grove, including Bicolor Damselfish, Blue Tang, Bluehead Wrasse, Ocean Surgeonfish, Redband Parrotfish and Sharpnose Puffer. Species frequently sighted at the reference sites but absent or significantly less frequent at the Spiegel Grove through the monitoring study included Blue Chromis, Foureye Butterflyfish, Spanish Hogfish, and Yellowhead Wrasse. Species that were frequently sighted only at the Spiegel Grove site included Creole Wrasse, Great Barracuda, Tomtate and Yellowtail Reeffish.

Spiegel Grove Monitoring – 2002 – 2007, Final Report. Submitted by the Reef Environmental Education Foundation, page 4
The pre-deployment survey at the Spiegel Grove site (prior to the sinking in April 2002) was conducted in the general vicinity of the actual location of the wreck and included a wider area than just the barren sand where the ship eventually landed. The majority of the 26 species documented during that first survey were seen in and around the rocks scattered in the area as well as a few pelagic species. The persistence in species present at the Spiegel Grove (e.g. which species were seen during each monitoring event) as measured by the Jaccard Coefficient (J’), gradually increased through time (Figure 4). Relatively low J’ values between the first few monitoring events reflect the early colonization of the artificial reef. Beginning in September 2002, the similarity in species present from one monitoring event to the next leveled out at approximately 0.50 (indicating overlap of 50% in species present from one time period to the next, which is lower than most of the reference sites; Table 5). However, approximately 3 years after the ship was deployed (August 2005), persistence in species composition at the Spiegel Grove site through time has increased to levels closer to those of the surrounding natural reefs (Figure 4, Table 5). To evaluate the persistence in species composition (incorporating both species presence and abundance), Spearman Similarity Coefficient values were calculated based on the rank abundance scores of species seen in at least 90% of surveys at each site (Table 6). The similarity in species composition was again lowest for the Rocks by the Spiegel Grove and the Spiegel Grove and highest at the Benwood Wreck site The Rocks by the Spiegel Grove represents a relatively small survey area, approximately 50 square feet at a depth of 125’, so it is not surprising that there would be low species composition here compared to larger, shallower reef areas nearby. The Spiegel Grove site itself is a newly established artificial reef compared to the surrounding natural reefs and the well established Benwood Wreck (almost 65 years since sinking). To compare the species composition of the Spiegel Grove to the other sites, Spearman Coefficients were calculated for each of the monitoring time pairs between each site and the Spiegel Grove using the rank abundance scores of species seen in at least 90% of surveys at each site. The species composition of the Spiegel Grove was least similar to the shallow reference site, including the Dixie Shoals, Red Can Shallows, and the well-established Benwood artificial reef (Figure 5). This is likely due to the fact that these sites support a high number of species and are in shallow water surrounded by productive reef and seagrass habitat. The species composition of the Spiegel Grove is approaching that of the deeper, natural reefs such as Dixie Ledge, Benwood Ledge and Red Can Ledges. Changes through time in the Abundance Score of selected species at the Spiegel Grove between deployment in June 2002 and August 2007 are shown in Figures 6a-c. Very few seabass (serranid) species were documented on the site. Black Grouper and Graysby were among the few serranids consistently seen during most or all monitoring events. The decreasing trend exhibited by Black Grouper at the Spiegel Grove in the last two years of the monitoring program (2005 and 2006; Figure 6a) was similarly seen at all of the reference sites. Some of this trend might be linked to targeted fishing on this species, especially on sites where serranid species are likely to aggregate such as the high profile Spiegel Grove wreck. Another possible factor in a decreasing trend in Black Grouper for 2005 could well be that the Spiegel Grove itself shifted from its original starboard lying position to a fully upright position as mentioned above with Hurricane Dean on July 8, 2005. The next AAT event originally slated for July was rescheduled for Aug. 11, 2005, just 4 weeks after Hurricane Dennis righted the Spiegel Grove. The righting of the Spiegel Grove is a noteworthy event in looking at the next monitoring event data 4 weeks later for all species of fish since the Spiegel Grove shifted position dramatically.

Spiegel Grove Monitoring – 2002 – 2007, Final Report. Submitted by the Reef Environmental Education Foundation, page 5
Other notable grouper sightings included Goliath Grouper during 3 of the monitoring events (August 2002, December 2002, and August 2005), and only one sighting of a single Nassau grouper during the December 2002 monitoring event. Since 1 year following deployment, 3 species of snapper have been consistently documented on the Spiegel Grove, Gray Snapper, Yellowtail Snapper and Blackfin Snapper (Figure 6b). Two species of grunt, Striped Grunt and Tomtate, colonized the Spiegel Grove immediately after deployment, but have since decreased in abundance through time (Figure 6c).
Conclusion
REEF monitored the fish assemblages of the Spiegel Grove and 7 nearby natural and artificial reefs in Key Largo, Florida, from when the ship was intentionally sunk in June 2002 through summer 2007. In the 12 months following deployment, fishes began to take residence on the Spiegel Grove. The total number of species present has increased over time, with 46 species documented on the wreck less than a month after it was sunk to an average of 76 species during later monitoring events, and a total of 191 species were documented during the report period. Some of the more common reef fish species frequently found on the reference sites include butterflyfish, angelfish and most species of parrotfish and grunt. Notable species such as Blackcap Basslet were seen on 4 separate occasions on the Spiegel Grove. Confirmed sightings of Blackcap Basslet are rare in the Florida Keys and it is noteworthy that of the 10 confirmed sightings of this species in the Keys by expert REEF surveyors, 4 occurred on the Spiegel Grove wreck and 1 on the Duane wreck, suggesting a possible habitat preference for a species that is otherwise absent in the Keys. The overall persistence in species presence on the wreck was relatively low between early monitoring events just following deployment, with a mean overlap of 41% in species present from one event to the next. However, approximately 3 years after the ship was sunk, persistence in species composition increased to levels closer to those of the surrounding natural reefs. Currently, the species composition of the Spiegel Grove just 5 years after deployment appears similar to that of the deeper, natural reefs such as Dixie Ledge and Red Can Ledges, and is least similar to that of the shallow reference sites including Benwood Wreck, Dixie Shoals, and red Can Shallows.
Recommendations for Future Assessments After completing the Spiegel Grove 5-year assessment, REEF offers 3 recommendations for continuation of this monitoring program:
Incorporate biannual monitoring to account for seasonal patterns. Seasonal trends in fish abundance and distribution are likely overlooked when there is a single, annual monitoring event at the same time each year.
Increase survey effort on the artificial reef structure itself. Due to the large size of the Spiegel Grove (510’) and the depth (~100-110’ survey area), it is often impossible to survey the entire deck structure with a 6-person team on one dive. Sea conditions, currents, mooring buoy availability, and visibility also conspire to make a single assessment dive that covers the entire

Spiegel Grove Monitoring – 2002 – 2007, Final Report. Submitted by the Reef Environmental Education Foundation, page 6
wreck untenable. It is recommended that survey effort be doubled on the Spiegel Grove, covering half the ship on each dive.
Based on the results presented in this report, the number and configuration of reference sites may be altered and/or reduced.
In addition to continuing ongoing monitoring of the fish assemblages using RDT surveys with REEF Advanced Assessment Teams, suggestions for future research on not only the Spiegel Grove site but other planned artificial reef deployments for large derelict ships include:
Incorporate biomass and density assessments using a point count method such as the Rapid Visual Count (Bohnsack & Bannerot, 1986; Arena P.T. et al, 2007; Kadison E. et al, 2002).
Incorporate a visual tagging study that assesses movement of targeted fish species over the short-term and long-term from sites surrounding a newly deployed artificial reef. One argument against deployment of large derelict vessels as artificial reefs is that they may attract fishes from surrounding sites without increasing the overall species richness and/or biomass for the area. It is assumed that the addition of large structure such as the Spiegel Grove to an otherwise species-depauperate site in the sand/muck will increase the species richness and biomass of not only the deployment site but surrounding sites. Few studies have compared fish community structure on vessel-type reefs to surrounding natural reefs. Success of a long-term visual tagging study would require cooperation between academia and multiple government agencies and NGO’s.
Invertebrate assessments would assist in evaluating the changes seen through time in the fish communities. Derelict ships deployed as artificial reefs add 3-dimensional structure immediately to where there was none. However, the gradual recruitment of motile and sessile invertebrates to the superstructure of the ship encourages the formation of a more complex community structure that will accommodate a greater number of fish species.
References
Arena, P.T. , Jordan L.K.B., Spieler, R.E., 2007. Fish assemblages on sunken vessels and natural reefs in southeast Florida, USA. Hydrobiolgia 580: 157-171.
Bohnsack, J.A. & S.P. Bannerot, 1986. A stationary visual census technique for quantitatively assessing
community structure of coral reef fishes. U.S. Dept. of Commerce, NOAA Technical Report NMFS 41: 1-15.
Kadison, E., Addison, C., Dunmire, T., Covocoresses, J., 2002. A versatile and inexpensive method for
training and testing observers conducting underwater visual censuses requiring size estimates. GCFI: 53.
Leeworthy, V.R., Maher, T., and Stone, E.A., 2006. Can artificial reefs alter user pressure on adjacent natural reefs? Bulletin of Marine Science, 78(1): 29-37.
Schmitt, R.F. and K. M. Sullivan. 1996. Analysis of a volunteer method for collecting fish presence and
abundance data in the Florida Keys. Bulletin of Marine Science 59(2): 404-416.

Spiegel Grove Monitoring – 2002 – 2007, Final Report. Submitted by the Reef Environmental Education Foundation, page 7
Figures 1b and 1c. REEF volunteers conducting a fish survey on the Spiegel Grove a few weeks after the ship was deployed as an artificial reef.
Figure 1a. The Spiegel Grove during its service years. Photo courtesy of the US Naval Institute, photo #90125.
Figure 1d. A school of Blackfin Snapper on the Spiegel Grove (taken in October 2006). Photo
courtesy of Mike Ryan/Horizon Divers.
Figure 1e. A closeup of the benthic community that is encrusting the Spiegel Grove. Photo
courtesy of Mike Ryan/Horizon Divers.

Spiegel Grove Monitoring – 2002 – 2007, Final Report. Submitted by the Reef Environmental Education Foundation, page 8
Miami
Key Largo
Figure 2. Location of the Spiegel Grove and seven reference sites surveyed during the monitoring events.

Spiegel Grove Monitoring – 2002 – 2007, Final Report. Submitted by the Reef Environmental Education Foundation, page 9
0
20
40
60
80
100
120
140
Apr 02 Jul 02 Aug 02 Sep 02 Dec 02 Mar 03 Jun 03 Jul 04 Aug 05 Jul 06 Jul 07
Nu
mb
er
of
Spe
cie
s
Event
Fish Species Richness
Benwood Ledge (154) Benwood (196)
Dixie Ledge (162) Dixie Shoals (179)
Red Can Ledge (194) Red Can Shallows (184)
Rocks by Spiegel Grove (118) Spiegel Grove (149)
Figure 3. Change in fish species richnes at the Spiegel Grove and seven reference sites through time, as recorded during REEF monitoring events. Total species richness given in the legend.
0
0.2
0.4
0.6
0.8
Aug 02 Sep 02 Dec 02 Mar 03 Jun 03 Jul 04 Aug 05 Jul 06 Jul 07
Jacc
ard
Co
eff
icie
nt
Event
Change in Species Composition at the Spiegel Grove Since Deployment
Figure 4. Change in fish species composition at the Spiegel Grove through time, as measured by the Jaccard Coefficient of each monitoring event compared with species recorded during the previous monitoring event.

Spiegel Grove Monitoring – 2002 – 2007, Final Report. Submitted by the Reef Environmental Education Foundation, page 10
0
0.1
0.2
0.3
0.4
0.5
0.6
Jul 02 Aug 02 Sep 02 Dec 02Mar 03 Jun 03 Jul 04 Aug 05 Jul 06 Jul 07
Spe
arm
an C
orr
ela
tio
n C
oe
ffic
ien
t
Event
Spiegel Grove Species Assemblage Similarity
Benwood Ledge
Benwood Wreck
Dixie Ledge
Dixie Shoals
Red Can Ledge
Red Can Shallows
Rocks by Spiegel Grove
Figure 5. Similarity in species composition between the Spiegel Grove and the reference sites. Values are mean Spearman similarity coefficients for monitoring events 1-10 (pre-deployment monitoring not included), based on rank abundance scores. Species seen in at least 90% of surveys at each site were included in the analysis.
0
0.2
0.4
0.6
0.8
1
1.2
1.4
1.6
1.8
Jul 02 Aug 02 Sep 02 Dec 02 Mar 03 Jun 03 Jul 04 Aug 05 Jul 06 Jul 07
Ab
un
dan
ce S
core
Spiegel Grove
Black Grouper Graysby
Figure 6a. Change in abundance score at the Spiegel Grove following deployment in June 2002.

Spiegel Grove Monitoring – 2002 – 2007, Final Report. Submitted by the Reef Environmental Education Foundation, page 11
0
0.5
1
1.5
2
2.5
3
3.5
Jul 02 Aug 02 Sep 02 Dec 02 Mar 03 Jun 03 Jul 04 Aug 05 Jul 06 Jul 07
Ab
un
dan
ce S
core
Spiegel Grove
Gray Snapper Yellowtail Snapper Blackfin Snapper
Figure 6b. Change in abundance score at the Spiegel Grove following deployment in June 2002.
0
0.5
1
1.5
2
2.5
3
3.5
4
Jul 02 Aug 02 Sep 02 Dec 02 Mar 03 Jun 03 Jul 04 Aug 05 Jul 06 Jul 07
Ab
un
dan
ce S
core
Spiegel Grove
Striped Grunt Tomtate
Figure 6c. Change in abundance score at the Spiegel Grove following deployment in June 2002.

Spiegel Grove Monitoring – 2002 – 2007, Final Report. Submitted by the Reef Environmental Education Foundation, page 12
Table 1. Monitoring sites.
Site (surveying depth in feet) Latitude / Longitude
Benwood Ledge (60-100') 25 03.155 N / 80 19.970 W
Benwood Wreck (30') 25 03.160 N / 80 20.020 W
Dixie Ledge (60-100') 25 04.213 N / 80 18.971 W
Dixie Shoals (20’) 25 04.145 N / 80 19.315 W
Red Can Ledge (60-100') 25 04.308 N / 80 18.909 W
Red Can Shallows (25’) 25 04.610 N / 80 18.935 W
Rocks next to Spiegel Grove (125') 25 04.180' N / 80 18.730 W
Spiegel Grove (130') 25 04.000 N / 80 18.650 W
Table 2. RDT Survey Effort during 5 years of REEF Monitoring.
Event Benwood
Ledge Benwood Dixie Ledge
Dixie Shoals
Shallow Red Can
Ledge Red Can Shallows
Rocks by Spiegel Grove
Spiegel Grove
Apr 02 6 6 7 6 7 6 6 6
Jul 02 7 7 7 7 7 7 7 7
Jul 07 6 6 6 6 8 6 6 6
Aug 02 7 6 7 7 7 7 7 8
Sep 02 7 7 7 7 7 7 7 7
Dec 02 6 7 7 7 7 6 4 7
Mar 03 0 6 7 7 7 7 6 7
Jun 03 7 7 7 7 7 7 7 7
Jul 04 6 6 6 7 7 7 7 6
Aug 05 7 7 7 7 7 8 8 7
Jul 06 7 8 7 7 7 7 7 8
Total 57 63 65 65 68 65 62 76

Spiegel Grove Monitoring – 2002 – 2007, Final Report. Submitted by the Reef Environmental Education Foundation, page 13
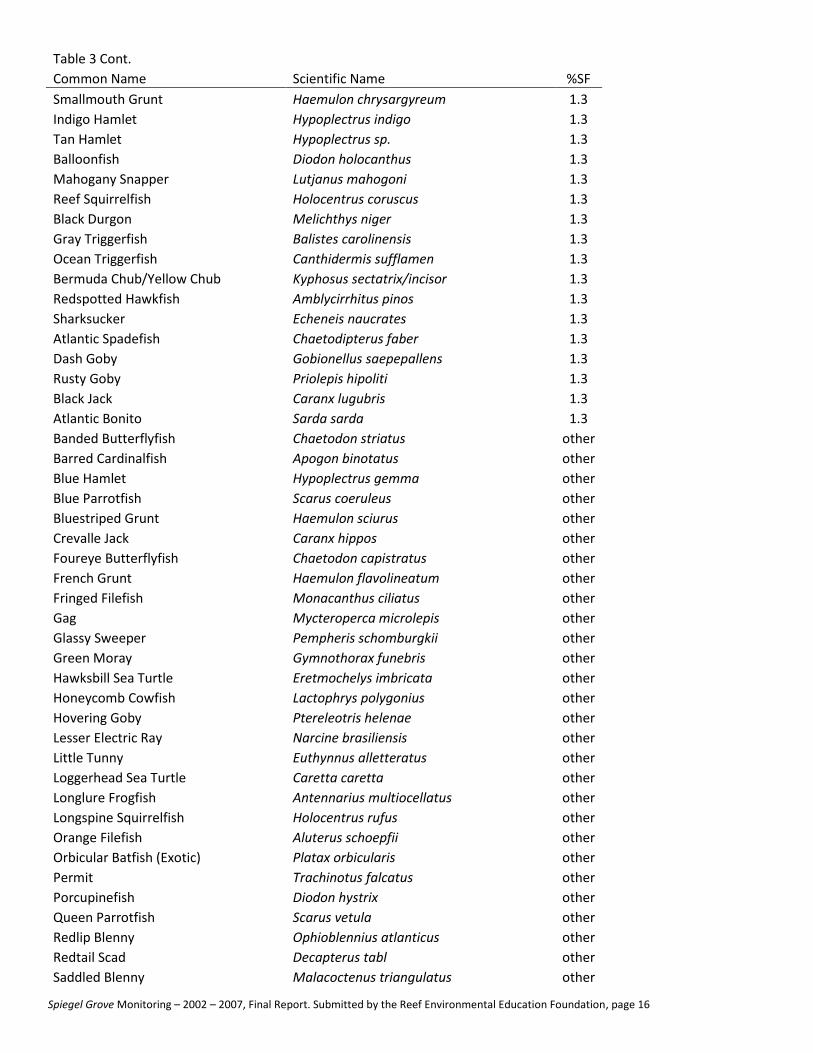
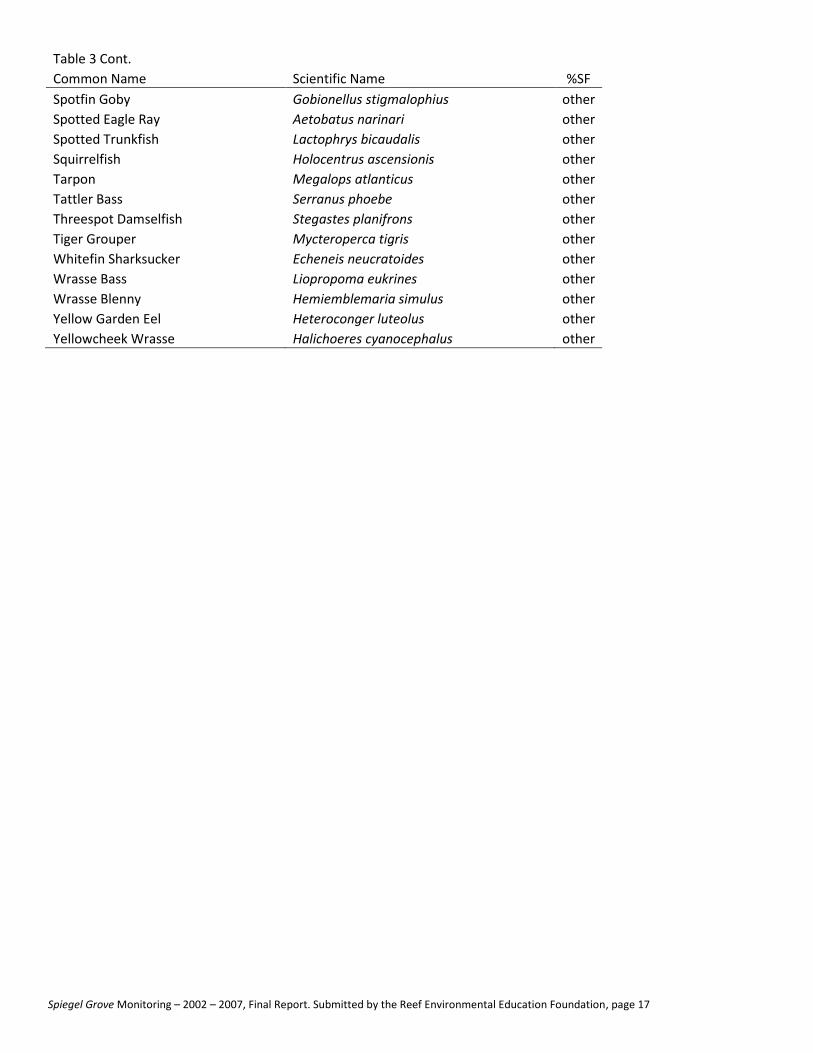
Table 3. Comprehensive list of fish species documented during REEF Roving Diver Technique Surveys at the Spiegel Grove. Sighting frequency (%) is given for species seen during monitoring events between April 2002 and July 2007. Species documented during
other times by REEF surveyors are listed at the end of the table ("other").
Common Name Scientific Name %SF
Bluehead Thalassoma bifasciatum 78.9
Sharpnose Puffer Canthigaster rostrata 76.3
Blue Tang Acanthurus coeruleus 75.0
Reef Butterflyfish Chaetodon sedentarius 73.7
Bicolor Damselfish Stegastes partitus 73.7
Creole Wrasse Clepticus parrae 67.1
Ocean Surgeonfish Acanthurus bahianus 65.8
Bar Jack Caranx ruber 63.2
Sergeant Major Abudefduf saxatilis 61.8
Purple Reeffish Chromis scotti 60.5
Tomtate Haemulon aurolineatum 60.5
Trumpetfish Aulostomus maculatus 59.2
Striped Parrotfish Scarus iseri 57.9
Sunshinefish Chromis insolata 56.6
Redband Parrotfish Sparisoma aurofrenatum 55.3
Hogfish Lachnolaimus maximus 53.9
Blue Runner Caranx crysos 53.9
Great Barracuda Sphyraena barracuda 50.0
Black Grouper Mycteroperca bonaci 48.7
Greenblotch Parrotfish Sparisoma atomarium 48.7
Blackfin Snapper Lutjanus buccanella 48.7
Harlequin Bass Serranus tigrinus 47.4
Yellowtail Reeffish Chromis enchrysura 44.7
Brown Chromis Chromis multilineata 43.4
Spotted Goatfish Pseudupeneus maculatus 43.4
Round Scad Decapterus punctatus 39.5
Bluelip Parrotfish Cryptotomus roseus 38.2
Doctorfish Acanthurus chirurgus 38.2
Rock Beauty Holacanthus tricolor 34.2
Butter Hamlet Hypoplectrus unicolor 34.2
Blue Chromis Chromis cyanea 32.9
Scrawled Filefish Aluterus scriptus 32.9
Orangespotted Filefish Cantherhines pullus 31.6
Striped Grunt Haemulon striatum 31.6
Goldspot Goby Gnatholepis thompsoni 30.3
Gray Angelfish Pomacanthus arcuatus 28.9
Graysby Cephalopholis cruentata 28.9
Queen Angelfish Holacanthus ciliaris 27.6
Masked Goby/Glass Goby Coryphopterus personatus/hyalinus 27.6
Gray Snapper Lutjanus griseus 27.6
Cottonwick Haemulon melanurum 25.0
Redtail Parrotfish Sparisoma chrysopterum 25.0

Spiegel Grove Monitoring – 2002 – 2007, Final Report. Submitted by the Reef Environmental Education Foundation, page 14
Table 3 Cont. Common Name Scientific Name %SF
Porkfish Anisotremus virginicus 23.7
Yellow Jack Caranx bartholomaei 23.7
Mackerel Scad Decapterus macarellus 23.7
Spotfin Hogfish Bodianus pulchellus 22.4
Chalk Bass Serranus tortugarum 22.4
Scamp Mycteroperca phenax 21.1
Spanish Hogfish Bodianus rufus 21.1
Spotfin Butterflyfish Chaetodon ocellatus 19.7
Bridled Goby Coryphopterus glaucofraenum 19.7
Yellowtail Snapper Ocyurus chrysurus 18.4
Red Grouper Epinephelus morio 17.1
White Grunt Haemulon plumieri 17.1
Bandtail Puffer Sphoeroides spengleri 17.1
Cocoa Damselfish Stegastes variabilis 15.8
Princess Parrotfish Scarus taeniopterus 15.8
Yellowhead Wrasse Halichoeres garnoti 15.8
French Angelfish Pomacanthus paru 14.5
Boga Inermia vittata 14.5
Greater Amberjack Seriola dumerili 14.5
Planehead Filefish Stephanolepis hispidus 14.5
Almaco Jack Seriola rivoliana 14.5
Slender Filefish Monacanthus tuckeri 13.2
Rainbow Runner Elagatis bipinnulata 13.2
Yellowtail (Redfin) Parrotfish Sparisoma rubripinne 13.2
Seaweed Blenny Parablennius marmoreus 11.8
Cero Scomberomorus regalis 11.8
Tobaccofish Serranus tabacarius 11.8
Barred Hamlet Hypoplectrus puella 10.5
Horse-Eye Jack Caranx latus 10.5
Midnight Parrotfish Scarus coelestinus 10.5
Mutton Snapper Lutjanus analis 10.5
Lancer Dragonet Paradiplogrammus bairdi 10.5
Goliath Grouper (Jewfish) Epinephelus itajara 9.2
Yellowmouth Grouper Mycteroperca interstitialis 9.2
Stoplight Parrotfish Sparisoma viride 9.2
Cubera Snapper Lutjanus cyanopterus 9.2
Cherubfish Centropyge argi 7.9
Coney Cephalopholis fulva 7.9
Black Margate Anisotremus surinamensis 7.9
Blue Angelfish Holacanthus bermudensis 6.6
Spotted Drum Equetus punctatus 6.6
Black Hamlet Hypoplectrus nigricans 6.6
Lane Snapper Lutjanus synagris 6.6
Silversides, Herrings, Anchovies
6.6
School Bass Schultzea beta 6.6

Spiegel Grove Monitoring – 2002 – 2007, Final Report. Submitted by the Reef Environmental Education Foundation, page 15
Table 3 Cont. Common Name Scientific Name %SF
Vermillion Snapper Rhomboplites aurorubens 6.6
Beaugregory Stegastes leucostictus 5.3
Dusky Damselfish Stegastes adustus 5.3
Blue Goby Ptereleotris calliurus 5.3
Sailors Choice Haemulon parra 5.3
Green Razorfish Xyrichtys splendens 5.3
Lantern Bass Serranus baldwini 5.3
Schoolmaster Lutjanus apodus 5.3
Clown Wrasse Halichoeres maculipinna 5.3
Slippery Dick Halichoeres bivittatus 5.3
Blackcap Basslet Gramma melacara 3.9
Twospot Cardinalfish Apogon pseudomaculatus 3.9
Eyed Flounder Bothus ocellatus 3.9
Sand Perch Diplectrum formosum 3.9
Nurse Shark Ginglymostoma cirratum 3.9
Sand Tilefish Malacanthus plumieri 3.9
Longfin Damselfish Stegastes diencaeus 2.6
Yellowtail Damselfish Microspathodon chrysurus 2.6
Spotted Moray Gymnothorax moringa 2.6
Whitespotted Filefish Cantherhines macrocerus 2.6
White Margate Haemulon album 2.6
Bucktooth Parrotfish Sparisoma radians 2.6
Rainbow Parrotfish Scarus guacamaia 2.6
Spotted Scorpionfish Scorpaena plumieri plumieri 2.6
Creole-fish Paranthias furcifer 2.6
Dog Snapper Lutjanus jocu 2.6
Puddingwife Halichoeres radiatus 2.6
Bigtooth Cardinalfish Apogon affinis 2.6
Pygmy Filefish Monacanthus setifer 2.6
Unicorn Filefish Aluterus monoceros 2.6
Orangespotted Goby Nes longus 2.6
Juvenile Grunt Haemulon sp. 2.6
Hamlet - Juvenile Hypoplectrus sp. 2.6
Bonnetmouth Emmelichthyops atlanticus 1.3
Scrawled Cowfish Lactophrys quadricornis 1.3
Flamefish Apogon maculatus 1.3
Reef Croaker Odontoscion dentex 1.3
Sharptail Eel Myrichthys breviceps 1.3
Yellow Goatfish Mulloidichthys martinicus 1.3
Colon Goby Coryphopterus dicrus 1.3
Pallid Goby Coryphopterus eidolon 1.3
Nassau Grouper Epinephelus striatus 1.3
Red Hind Epinephelus guttatus 1.3
Yellowfin Grouper Mycteroperca venenosa 1.3
Caesar Grunt Haemulon carbonarium 1.3
Spiegel Grove Monitoring – 2002 – 2007, Final Report. Submitted by the Reef Environmental Education Foundation, page 16
Table 3 Cont. Common Name Scientific Name %SF
Smallmouth Grunt Haemulon chrysargyreum 1.3
Indigo Hamlet Hypoplectrus indigo 1.3
Tan Hamlet Hypoplectrus sp. 1.3
Balloonfish Diodon holocanthus 1.3
Mahogany Snapper Lutjanus mahogoni 1.3
Reef Squirrelfish Holocentrus coruscus 1.3
Black Durgon Melichthys niger 1.3
Gray Triggerfish Balistes carolinensis 1.3
Ocean Triggerfish Canthidermis sufflamen 1.3
Bermuda Chub/Yellow Chub Kyphosus sectatrix/incisor 1.3
Redspotted Hawkfish Amblycirrhitus pinos 1.3
Sharksucker Echeneis naucrates 1.3
Atlantic Spadefish Chaetodipterus faber 1.3
Dash Goby Gobionellus saepepallens 1.3
Rusty Goby Priolepis hipoliti 1.3
Black Jack Caranx lugubris 1.3
Atlantic Bonito Sarda sarda 1.3
Banded Butterflyfish Chaetodon striatus other
Barred Cardinalfish Apogon binotatus other
Blue Hamlet Hypoplectrus gemma other
Blue Parrotfish Scarus coeruleus other
Bluestriped Grunt Haemulon sciurus other
Crevalle Jack Caranx hippos other
Foureye Butterflyfish Chaetodon capistratus other
French Grunt Haemulon flavolineatum other
Fringed Filefish Monacanthus ciliatus other
Gag Mycteroperca microlepis other
Glassy Sweeper Pempheris schomburgkii other
Green Moray Gymnothorax funebris other
Hawksbill Sea Turtle Eretmochelys imbricata other
Honeycomb Cowfish Lactophrys polygonius other
Hovering Goby Ptereleotris helenae other
Lesser Electric Ray Narcine brasiliensis other
Little Tunny Euthynnus alletteratus other
Loggerhead Sea Turtle Caretta caretta other
Longlure Frogfish Antennarius multiocellatus other
Longspine Squirrelfish Holocentrus rufus other
Orange Filefish Aluterus schoepfii other
Orbicular Batfish (Exotic) Platax orbicularis other
Permit Trachinotus falcatus other
Porcupinefish Diodon hystrix other
Queen Parrotfish Scarus vetula other
Redlip Blenny Ophioblennius atlanticus other
Redtail Scad Decapterus tabl other
Saddled Blenny Malacoctenus triangulatus other
Spiegel Grove Monitoring – 2002 – 2007, Final Report. Submitted by the Reef Environmental Education Foundation, page 17
Table 3 Cont. Common Name Scientific Name %SF
Spotfin Goby Gobionellus stigmalophius other
Spotted Eagle Ray Aetobatus narinari other
Spotted Trunkfish Lactophrys bicaudalis other
Squirrelfish Holocentrus ascensionis other
Tarpon Megalops atlanticus other
Tattler Bass Serranus phoebe other
Threespot Damselfish Stegastes planifrons other
Tiger Grouper Mycteroperca tigris other
Whitefin Sharksucker Echeneis neucratoides other
Wrasse Bass Liopropoma eukrines other
Wrasse Blenny Hemiemblemaria simulus other
Yellow Garden Eel Heteroconger luteolus other
Yellowcheek Wrasse Halichoeres cyanocephalus other

Spiegel Grove Monitoring – 2002 – 2007, Final Report. Submitted by the Reef Environmental Education Foundation, page 18
Table 4. Top 25 most frequently sighted species at the Spiegel Grove and seven reference sites. Values given are Sighting Frequency (%SF). If a value is not given, the species was not one of the 25 most
frequently sighted species at that site.
species Benwood
Ledge Benwood
Dixie Ledge
Dixie Shoals
Red Can
Ledge
Red Can Shallows
Rocks by
Spiegel Grove
Spiegel Grove
Balloonfish
41.9 Banded Butterflyfish
87.7
98.5
Bar Jack
96.8
87.7
63.2 Bermuda/Yellow Chub
95.2
Bicolor Damselfish 94.7 96.8 96.9 95.4 94.1 98.5 87.1 73.7
Bigtooth Cardinalfish
58.1 Black Grouper
79.4
48.7
Blackfin Snapper
67.7 48.7
Blue Chromis 96.5
95.4 90.8 89.7 95.4 43.5 Blue Runner
53.9
Blue Tang 87.7 96.8 93.8 96.9 94.1 100.0 69.4 75.0
Bluehead 96.5 98.4 96.9 96.9 97.1 98.5 88.7 78.9
Bluestriped Grunt
96.8 Bridled Goby
84.6 89.2
92.3 56.5
Brown Chromis
98.4 87.7 87.7
43.4
Butter Hamlet 93.0
80.0
83.8 Clown Wrasse
95.4 79.4 98.5
Cocoa Damselfish
87.7
87.7 Coney 78.9
Creole Wrasse
67.1
Doctorfish
61.3 Foureye Butterflyfish 89.5 93.7 80.0 89.2 83.8 86.2
French Grunt
98.4 Gray Angelfish 80.7
Graysby 82.5
87.7
85.3
66.1 Great Barracuda
50.0
Green Razorfish
89.2
93.8 Greenblotch
Parrotfish 75.4
84.6
48.7
Harlequin Bass 86.0
93.8 98.5 92.6 100.0 51.6 47.4
Hogfish 80.7
93.8 83.8 95.4 67.7 53.9
Mahogany Snapper
93.7 Masked/Glass Goby 91.2
96.9
97.1
59.7
Mutton Snapper
86.8
56.5 Ocean Surgeonfish 87.7 98.4 90.8 92.3 89.7 96.9
65.8
Porkfish
96.8 Purple Reeffish
81.5
85.5 60.5
Queen Angelfish
83.1
87.7 50.0 Queen Parrotfish
93.7
Spiegel Grove Monitoring – 2002 – 2007, Final Report. Submitted by the Reef Environmental Education Foundation, page 19
Table 4, Cont.
species Benwood
Ledge Benwood
Dixie Ledge
Dixie Shoals
Red Can
Ledge
Red Can Shallows
Rocks by
Spiegel Grove
Spiegel Grove
Red Grouper
62.9 Redband Parrotfish 96.5 95.2 98.5 96.9 92.6 100.0
55.3
Reef Butterflyfish 93.0
98.5
97.1
58.1 73.7
Rock Beauty 98.2
92.3 90.8 94.1 93.8 Schoolmaster
95.2
Sergeant Major
93.7
61.8
Sharpnose Puffer 93.0 96.8 95.4 90.8 91.2 96.9 80.6 76.3
Slippery Dick
81.5 92.3
96.9 Spanish Hogfish 80.7 96.8 93.8 92.3 95.6 83.1 38.7
Spotfin Butterflyfish
87.7 80.9 89.2 Spotted Goatfish 93.0 95.2
86.2 88.2 83.1
43.4
Spotted Moray
38.7 Stoplight Parrotfish
96.8
96.9
98.5
Striped Grunt
66.1 Striped Parrotfish 96.5
84.6 89.2 85.3 83.1
57.9
Sunshinefish
95.4
85.3
93.5 56.6
Tobaccofish 93.0
95.4
95.6 Tomtate
60.5
Trumpetfish
95.2
59.2
Twospot Cardinalfish
69.4 White Grunt 94.7 98.4
92.3
Yellow Goatfish
96.8 Yellowhead Wrasse 98.2 98.4 95.4 95.4 95.6 98.5 59.7
Yellowtail Reeffish
44.7
Yellowtail Snapper 78.9 96.8

Spiegel Grove Monitoring – 2002 – 2007, Final Report. Submitted by the Reef Environmental Education Foundation, page 20
Table 5. Similarity in species present among monitoring events, measured by percent overlap in species present. Values given are mean Jaccard Coefficient (J') values for
monitoring times 1-10 (pre-deployment monitoring in April 2002 not included).
Site J'
Benwood Ledge 0.58
Benwood 0.68
Dixie Ledge 0.59
Dixie Shoals Shallow 0.65
Red Can Ledge 0.57
Red Can Shallows 0.60
Rocks by Spiegel Grove 0.42
Spiegel Grove 0.48
Table 6. Similarity in species composition among monitoring events, measured by Spearman correlation. Values given are mean Spearman Coefficient values for monitoring times 1-10
(pre-deployment monitoring not included), based on rank abundance scores. Species seen in at least 90% of surveys at
each site were included in the analysis.
Site Mean Spearman Coefficient
Benwood Ledge 0.73
Benwood 0.82
Dixie Ledge 0.75
Dixie Shoals Shallow 0.75
Red Can Ledge 0.70
Red Can Shallows 0.71
Rocks by Spiegel Grove 0.59
Spiegel Grove 0.57