fish foot prints: morphology and energetics of the - the journal of
TRANSCRIPT

2893The Journal of Experimental Biology 200, 2893–2906 (1997)Printed in Great Britain © The Company of Biologists Limited 1997JEB0904
FISH FOOT PRINTS: MORPHOLOGY AND ENERGETICS OF THE WAKE BEHIND ACONTINUOUSLY SWIMMING MULLET ( CHELON LABROSUSRISSO)
U. K. MÜLLER*, B. L. E. VAN DEN HEUVEL, E. J. STAMHUIS AND J. J. VIDELERDepartment of Marine Biology, University of Groningen, The Netherlands
Accepted 18 August 1997
,
The structure of the wake behind a continuouslyswimming mullet was analysed qualitatively andquantitatively by applying two-dimensional particle imagevelocimetry. A detailed analysis of the flow pattern and ofthe swimming movements of the fish allowed us to derive akinematic explanation of the flow pattern as well as anestimate of the relative contributions of the body and thetail to thrust production. During active propulsion, theundulatory swimming fish shed a wake consisting in themedio-frontal plane of a rearward, zigzagging jet flowbetween alternating vortices. The fish shed one vortex per
half tailbeat when the tail reached its most lateral position.Part of the circulation shed in the vortices had beengenerated previously on the body by the transverse bodywave travelling down the body. This undulatory pumpmechanism accounted for less than half of the energy shedin the wake. The remainder was generated by the tail. Thevortex spacing matched the tailbeat amplitude and thestride length.
Key words: swimming, locomotion, flow field, wake structureparticle image velocimetry, mullet, Chelon labrosus.
Summary
ray toeel
ofsted
seio
tio
lughofexvidiveut
e-r aaly,
A swimming fish produces thrust by adding momentumthe water. Many species accelerate water along their body waves of lateral undulations running from head to tail. Theundulating movements are initiated by alternating wavescontraction of muscles arranged in myotomes on the left right sides of the body. The phase relationship between waves of muscle activation and the actual wave of the boddetermined by the timing and speed of the waves of muscontraction and by the reactive forces from the water on fish (Hess and Videler, 1984). The effect of the reactive fordepends largely on the shape of the body and the mechaproperties of the body and tail. During steady swimming, tinteraction between fish and water varies among swimmmodes of fish species with different body forms, followingconsistent pattern with several distinguishable kinemamodes (Wardle et al.1995). One of these is represented by fisuch as saithe Pollachius virensand mackerel Scomberscombrus, in which, during steady swimming, the amplituof the lateral movements increases sharply over the postethird of the body. A combination of kinematic and dynamanalyses of steady swimming in these species suggeststhrust is generated in discrete pulses at the tail blade (Vidand Hess, 1984; Hess and Videler, 1984). Proof that actually happens should come from quantitative flovisualisation.
Several attempts have been made to visualise the wake
Introduction
*Present address: Department of Zoology, Cambridge University
towithse
ofandthey isclethecesnicalheing aticsh
derioric thatelerthisw
s of
fish, and a variety of techniques have been employed. G(1968) and Hertel (1966) added small particles to the watershow the patterns caused by a continuously swimming (Anguilla anguilla) and a water snake (Natrix natrix). Bothanimals shed a wake consisting of two alternating rows vortices with a zigzagging jet between them. The firexperiments on saithe- and mackerel-type swimmers usstreak flow visualisation. Rosen (1959) used milk to visualithe flow directly under a continuously swimming pearl danBrachydanio albolineatus. McCutchen (1977) made use of thedifferent diffraction indices of water layers with differentemperatures to visualise the wake of a zebra danBrachydanio rerio. Aleyev (1977) injected dye into the oracavity of several fish species. The blue dye escaped throthe gill clefts together with the expired water into the wake the fish. Rosen (1959) found indications of a regular vortpattern behind continuously swimming fish, as did Aleye(1977). McCutchen (1977), studying unsteady swimming, dnot observe such a wake pattern. The first quantitatmeasurements in the wake of an undulatory swimming troOncorhynchus mykisswere made by Blickhan et al. (1992)using two-dimensional particle image velocimetry (PIV). Fromtwo-dimensional recordings, they reconstructed a thredimensional impression of the wake and found evidence fochain of alternating, almost circular, vortex rings and zigzagging, caudal jet flow through the rings. Independent
, Downing Street, Cambridge, CB2 3EJ, UK (e-mail: [email protected]).

2894
er
stestorrn inthesegswe
theld to
s)
l
-upnlys.ed forre,ht
isehehene.edge
tad theed.eatousf
et a
at
to of
U. K. MÜLLER AND OTHERS
Videler (1993) predicted a similar pattern on the basis of tavailable data and hydrodynamic principles: vertical standivortices, left behind at the turning points of the tail strokes, aconnected by the dorsal and ventral tail tip vortices to fovortex rings. Consecutive vortex rings share the verticvortices to form a chain of vortices.
Particle image velocimetry (PIV) techniques were used quantify the wake of flying birds (Spedding et al. 1984;Spedding, 1986, 1987). Spedding et al. (1984) developed amethod with which to calculate thrust from the vortestructures shed by a bird. The formalism is applicable to aregular vortex ring structure conforming to the assumptioand geometrical restrictions of the model. The model assumthat all the energy shed by the flying or swimming animalcontained in circular vortex rings and uses the size and circulation of the rings to assess thrust and waste energyderives these estimates from two-dimensional cross sectithrough the wake. The cross-sectional view through a vorring consists of two vortices of opposite rotational sensAssumptions are made that the distance between consecutive vortices is the diameter of the vortex ring and tthe circulation in the cross-sectional plane of the vortrepresents the circulation of the entire vortex ring.
We have developed a two-dimensional PIV system visualise the flow generated by animal movements (Stamhand Videler, 1995). Applying these quantitative PIVtechniques to undulatory swimmers will yield velocity vectofields in one plane as primary data sets. Derived data divergence, vorticity and vortex circulation allow estimates the costs of swimming from the momentum shed in the wa
Materials and methodsExperimental animals
The experiments were performed on a thick-lipped mulChelon labrosusRisso. Mullet are planktivorous cruisers thaswim by undulating their body. The juvenile mullet used in thstudy (age 2 years, body length 0.12 m) was bred in captivand held in a 40 l tank containing artificial sea water (salin30 %) at 22±1 °C.
Flow visualisation
We used two-dimensional particle image velocimetry (PIVto visualise the water movements induced by the swimmfish (Stamhuis and Videler, 1995). The water (salinity 30 ‰temperature 22 °C) in the test aquarium (1.5 m×0.3 m×0.5 m)was seeded with unexpanded polystyrene particles (VF 6BASF, diameter 0.2–0.4 mm). Polystyrene has a slightly highdensity than water of 30 ‰ salinity at 22 °C. The sinking speof the particles could be neglected because it was lcompared with the flow velocities in the flow patterns studieThe difference in density caused a small time lag in tresponse of the particle to the fish-generated curre(Merzkirch, 1974); we ignored this effect. The particles weilluminated in a horizontal plane by a laser light sheet (krypt
hengre
rmal
to
xnynses
isthe. Itonstexe.
twohatex
touis
ron
ofke.
lettisity
ity
)ing
,
54,eredowd.hentsreon
laser, beam 1 mm thick, wavelength 647 nm, maximum pow0.8 W).
Experiments were performed with one individual in the teaquarium and lasted 2 h. The fish was placed into the taquarium 1 day prior to the experiments. We did not train stimulate the fish in any way. All swimming behaviouobserved was spontaneous. The fish cruised up and dowthe middle of the aquarium. When passing the light sheet, fish kept its eyes above or below the light level, but otherwiseemed undisturbed in its swimming behaviour. Recordinwere made when the fish was swimming in the field of vieof the camera. Immediately prior to the experiments, wreduced the water level to a depth of 10 cm to increase chance of the fish swimming through the light sheet. In the fieof view, the water surface was covered with a Perspex raftavoid surface waves distorting the image.
The camera (CCD camera: Adimec MX-12, 50 mm lenwas mounted to record top-view images of 512×512 pixels ata frequency of 25 images s−1. With a field of view of195 mm×195 mm, this yields a spatial resolution of 1 pixerepresenting a space of 0.4 mm×0.4 mm. The gain of thecamera was set to achieve maximal contrast between the litparticles and a dark background. The shutter opened for o8 ms for each frame to avoid motion blur of the particleRecorded images were digitised in real time and storuncompressed on computer hard disk. Sequences usedfurther analysis were selected from the stored raw data. Hewe report on sequences in which the fish swam in the ligsheet at a constant speed along a straight path.
Kinematic analysis
We programmed applications within an image-analysenvironment (TIM, DIFA measuring systems) to obtain thmidline and several kinematic parameters of the fish. Tcontour of the fish in each image was digitised manually. Tclosed contour was filled and then eroded to obtain the midliThe positions of the head and the tail tip had to be indicatmanually to anchor the erosion and avoid artificial shrinkinof the fish. This procedure yielded a description of the midlinconsisting of up to 300 x,y-coordinate pairs.
The body length L of the fish was assumed to be equivalento the number of pixels representing the midline. The hecoordinates in subsequent pictures were used to calculatemean path of motion and the instantaneous swimming speThe mean path of motion was calculated over complete tailbcycles using standard linear regression. The instantaneswimming speed U was calculated from the displacement othe head between frames. If the mean value of U over onecomplete tailbeat cycle did not change significantly from oncycle to the next, the fish was assumed to be swimming aconstant speed.
All pixel coordinates of the midline were transformed so ththe mean path of motion ran along the x-axis. The midline wassmoothed using a weighted 11-point running average remove the high-frequency noise caused by the pixel nature

2895Flow field of a mullet
irslyitychis
tyheinewenal
ldof
. or
lltornalorty:
;der;
ler,
IVlonghe
esity
ith
iveld
nheey
e of
he
een
the midline coordinates. We also calculated the position of inflection points on the midline. These are points where tcurvature of the midline changes from concave to convexvice versa. Inflection points were calculated numerically bfinding the extremes in the slope of the smoothed midline consecutive pixels.
The kinematics of an undulatory swimmer can be describin terms of a body wave and a propulsive wave (Gray, 193The fish body shows a lateral wave in a fish-related framereference with a posteriorly increasing amplitude Ab and awave length λb travelling along the body in the caudal directioat a speed V. Every point on the body describes a wave in aearth-bound frame of reference with an amplitude As and awavelength λs travelling forward at a speed U identical to themean swimming speed of the fish.
The wavelength λb of the body wave was calculated atwice the distance between the zero crossings of the bowave, i.e. the points where one particular midline crosses path of motion. The amplitude Ab of the body wave wascalculated from the unsmoothed midlines as half ttransverse distance between the points of maximum lateexcursion of a particular body segment. The wave speedValong the body was calculated from the displacement of zero crossing along the body midline. The length λs, theamplitude As and the phase pb of the propulsive wave werecalculated from the x and y displacements of the wave cresin an earth-bound frame of reference. The length λs of thepropulsive wave was calculated as twice the distance betwzero crossings of a particular point on the midline. Thamplitude As of a particular body segment is identical to thbody wave amplitude Ab at this particular segment along thebody.
Hydrodynamic analysis
Data processing
Particle image velocimetry (PIV). Flow velocity vectorswere obtained by conducting a subimage cross-correlationtwo successive images (Chen et al. 1993; Stamhuis andVideler, 1995). The cross-correlation routine finds the moprobable average particle displacement in a particular regof the flow by calculating the correlation between twsubimages from the same location in two consecutive framWe used a subimage size of 39 pixels × 39 pixels to ensurea minimum seeding of 10 particles per subimage (Keane aAdrian, 1991). With consecutive subimages overlapping 50 % for maximum spatial resolution without overinterpreting the data (Hinsch, 1993), this yielded a vectfield of, at best, 26×26 equally spaced vectors, if allsubimages contained sufficient information for croscorrelation.
Particle tracking velocimetry (PTV). The correlationroutine only calculates reliable velocity vectors for subimagwith at least 10 particles, a mean particle displacement of lthan 25 % of the subimage diameter and a mainly translatioflow component (Keane and Adrian, 1991). Areas with a loseeding, strong rotational flow or high flow velocities had
thehe oryfor
ed3). of
nn
sdy
the
heral
the
t
eene
e
on
stionoes.
ndby-or
s-
esessnalwto
be analysed by marking corresponding particle pamanually. This applied in particular to the wake immediateafter shedding. The position and the magnitude of the velocvectors were obtained from the centres of mass of eaindicated particle pair (Stamhuis and Videler, 1995). Thyielded a subpixel spatial resolution for the PTV velocivector field. Comparing PTV and PIV data shows that taveraging process internal to the cross-correlation routdoes not greatly affect the value of the maximum flovelocities: the maximum displacement of a particle betwetwo consecutive frames as measured from the originrecordings by PTV was 16 pixels or 6.0 mm. The flow fieresulting from PIV showed a maximum displacement 5.7 mm, an underestimation of the peak flow velocity of 5 %The mean displacement of a particle was 2.8±2.6 pixels1.1±1.0 mm (mean ±S.D., N=982) between consecutiveframes.
Post-processing.The original flow velocity vectors werefitted into a user-defined grid of either 26 cells × 26 cells(vector fields based on PIV) or 40 cells × 40 cells (vector fieldsresulting from a combination of PIV and PTV data). Avectors in one grid cell were averaged, the resulting vecwas evaluated using an error routine, and a two-dimensiospline routine interpolated vectors to fill gaps in the vectfield (Stamhuis and Videler, 1995). From the flow velocivector field, we derived the following flow parametersvorticity ω describing the angular velocity in the fluiddivergence θ, a parameter that in a two-dimensional flow fielgives an indication of the out-of-plane movement of the watand the discriminant for complex eigenvalues d, which wasused to locate the centre of vortices (Stamhuis and Vide1995).
Wake morphology parameters were calculated from Pdata after post-processing: the distance between vortices aand perpendicular to the path of motion as well as tmomentum angle ϕ (Fig. 1) of a vortex pair were calculatedfrom the position of the vortex centres in the flow field; thangle α between the jet flow and the path of motion waobtained as a mean value from the angles of the velocvectors in the jet. All mean values in the text are given wstandard deviations (S.D.).
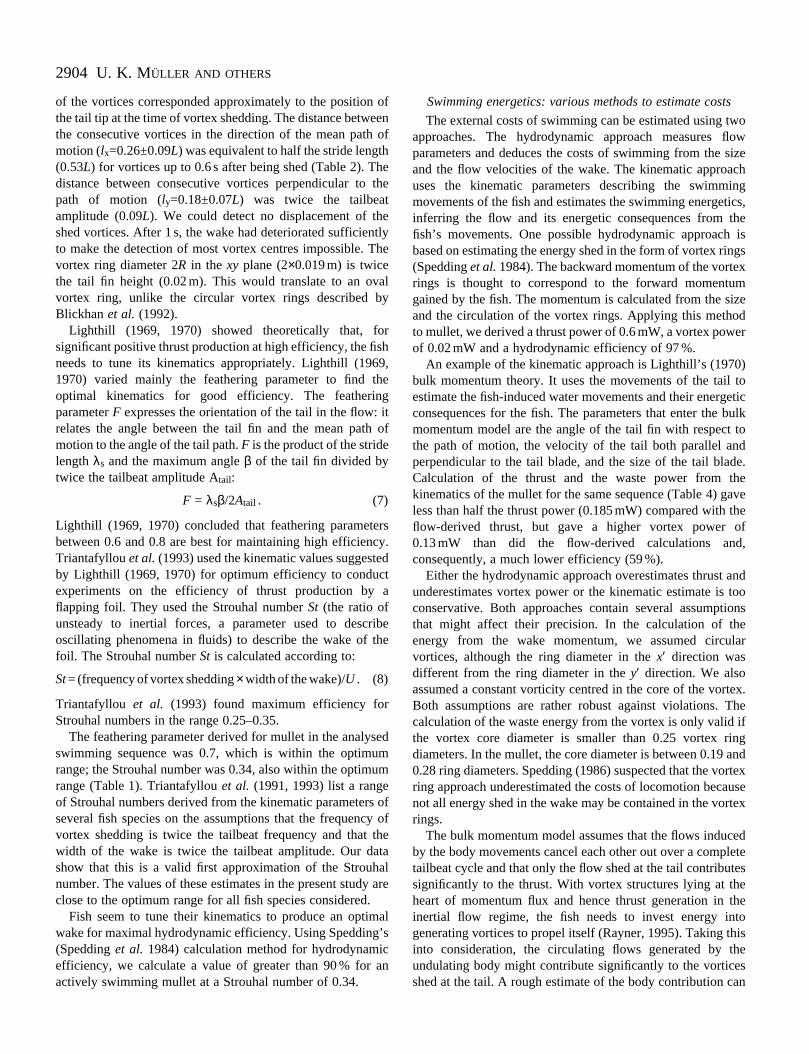
Five image pairs were analysed by the more labour-intensPTV method to obtain a more detailed picture of the flow fiein the vicinity of the fish’s body and of the velocity distributiowithin the vortices. Vortex parameters were derived from toriginal PTV data to retain the high spatial resolution of thoriginal PTV data set. We calculated the flow velocitcomponent u parallel to the line x′ connecting two adjacentvortices and the flow velocity component v perpendicular tothe line y′ connecting two adjacent vortex centres (Fig. 1). Thprofiles were described by the radii of the vortex cores andthe vortex rings. The core radius R0 was calculated as half thedistance between the extremes in the velocity profile of tvelocity component u (Fig. 2A). The ring radius Rbetween twoadjacent vortices was calculated as half the distance betwthe outer extremes in the v velocity profile minus the core
2896
ingt
eetedind inon
:
x
ng
U. K. MÜLLER AND OTHERS
yx
x
y
ϕA2
A1
α
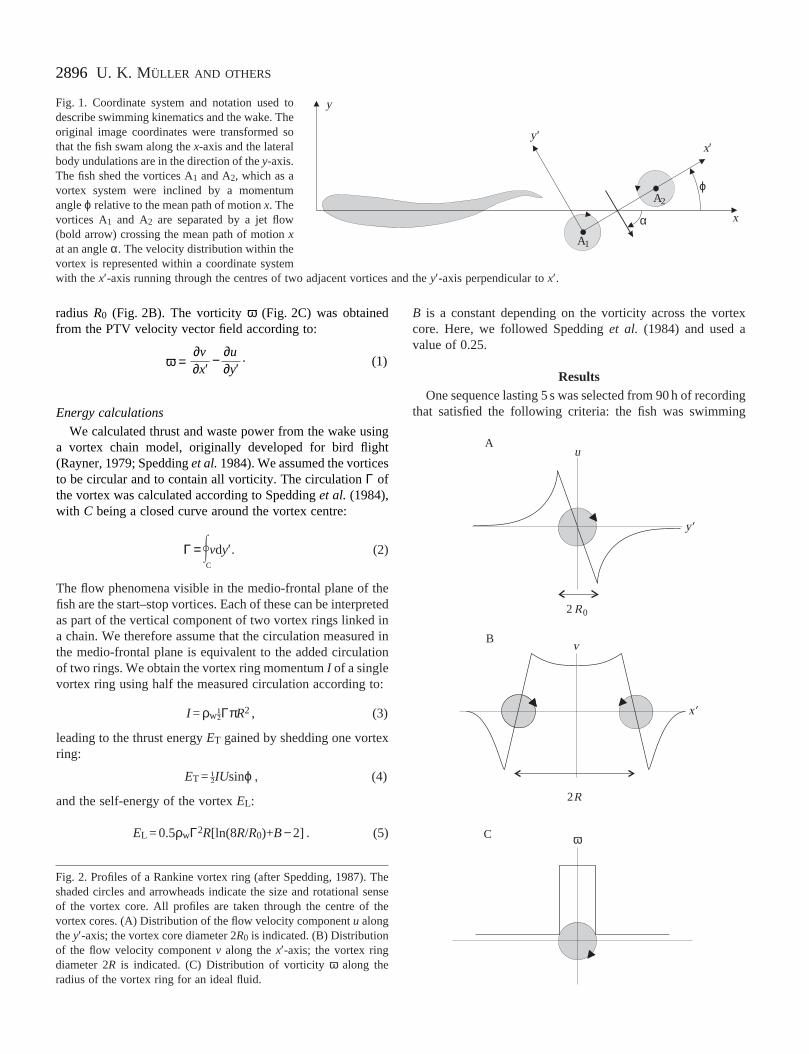
Fig. 1. Coordinate system and notation used todescribe swimming kinematics and the wake. Theoriginal image coordinates were transformed sothat the fish swam along the x-axis and the lateralbody undulations are in the direction of the y-axis.The fish shed the vortices A1 and A2, which as avortex system were inclined by a momentumangle ϕ relative to the mean path of motion x. Thevortices A1 and A2 are separated by a jet flow(bold arrow) crossing the mean path of motion xat an angle α. The velocity distribution within thevortex is represented within a coordinate systemwith the x′-axis running through the centres of two adjacent vortices and the y′-axis perpendicular to x′.
v
x′
B
2R
u
y′
A
2 R
ωC
0
radius R0 (Fig. 2B). The vorticity ω (Fig. 2C) was obtainedfrom the PTV velocity vector field according to:
Energy calculations
We calculated thrust and waste power from the wake usa vortex chain model, originally developed for bird fligh(Rayner, 1979; Spedding et al.1984). We assumed the vorticesto be circular and to contain all vorticity. The circulation Γ ofthe vortex was calculated according to Spedding et al. (1984),with C being a closed curve around the vortex centre:
Γ = $vdy′. (2)C
The flow phenomena visible in the medio-frontal plane of thfish are the start–stop vortices. Each of these can be interpras part of the vertical component of two vortex rings linked a chain. We therefore assume that the circulation measurethe medio-frontal plane is equivalent to the added circulatiof two rings. We obtain the vortex ring momentum I of a singlevortex ring using half the measured circulation according to
I =ρwGΓπR2 , (3)
leading to the thrust energy ET gained by shedding one vortexring:
ET = GIUsinϕ , (4)
and the self-energy of the vortex EL:
EL = 0.5ρwΓ2R[ln(8R/R0)+B−2] . (5)
(1)∂v∂x′
∂u∂y′
.−ω =
Fig. 2. Profiles of a Rankine vortex ring (after Spedding, 1987). Tshaded circles and arrowheads indicate the size and rotational sof the vortex core. All profiles are taken through the centre of tvortex cores. (A) Distribution of the flow velocity component u alongthe y′-axis; the vortex core diameter 2R0 is indicated. (B) Distributionof the flow velocity component v along the x′-axis; the vortex ringdiameter 2Ris indicated. (C) Distribution of vorticity ω along theradius of the vortex ring for an ideal fluid.
B is a constant depending on the vorticity across the vortecore. Here, we followed Spedding et al. (1984) and used avalue of 0.25.
ResultsOne sequence lasting 5 s was selected from 90 h of recordi
that satisfied the following criteria: the fish was swimming
heensehe

2897Flow field of a mullet
inram
fter
er
ecle ofandioning
to
. In
sterheis
f
wevelak’s
le.th
Table 1.Mean morphological and kinematic parameters forone sequence of straight swimming at constant speed by
Chelon labrosus
Parameter Units Mean S.D. N
Body length L m 0.126 0.006 7Swimming speed U m s−1 0.175 0.041 27
L s−1 1.4 0.3Maximum angle of attack degrees 31Tailbeat frequency f s−1 3.86 0.24 4Tailbeat amplitude Atail L 0.09 0.01 5Stride length λs L 0.53 0.05 17Body wavelength λb L 1.11 0.02 7Slip U/V 0.7 0.1 8Strouhal number St 0.34
V, propulsive wave speed.
0
0.2
0.4
0.6
0.8
1
1.2
0 0.2 0.4 0.6 0.8 1 1.2Normalised body length (L)
Nor
mal
ised
pha
se ( T
)
0
0.2
0.4
0.6
0.8
1
1.2
0 0.2 0.4 0.6 0.8 1 1.2Normalised body length (L)
Nor
mal
ised
am
plitu
de (
L)
A
B
Fig. 3. Amplitude and phase of the body wave of a steadily swimmingmullet. The unit of time is the duration Tof the tailbeat. The instantwhen the tail crosses the path of motion was arbitrarily chosen to beat T=0. (A) Lateral deflection along the fish’s body. (B) Phase of themaximum lateral deflection as a function of the position along thefish’s body.
horizontally in the light sheet at a constant swimming speeda straight line shedding a wake within full view of the came(Table 1). Forty image pairs were analysed fully, ranging frothe moment when the fish entered the field of view to 1 s athe fish left the camera range.
Swimming kinematics
The fish swam continuously from the lower right to the uppleft of the image at a speed Uof 0.175±0.041 m s−1
(1.4±0.3L s−1) (N=27) using 2.5 tailbeats to complete thcrossing. The swimming speed varied during the tailbeat cybetween 0.160 m s−1 when the tail has crossed the mean pathmotion and was approaching a lateral extreme position 0.220 m s−1 when the tail had passed the lateral extreme positand was approaching the mean path of motion. The swimmkinematics is characterised by the body wave of wavelengthλb
and the propulsive wave of wavelength λs. The amplitude ofthe body wave decreased from the head to the pivot poin0.3Land then increased curvilinearly from the pivot point to ttail (Fig. 3A). The tailbeat amplitude was 0.011±0.001(0.09±0.01L) (N=5). The phase pb of the body wave increasedlinearly from head to tail (Fig. 3B). This agrees with the typicbody wave of a saithe- or mackerel-type swimmer (Wardleetal. 1995). The body wavelength was 1.11±0.02L(N=7). Thepropulsive wavelength was 0.53±0.05L (N=17). The ratio of theswimming speed U to the propulsive wave speed V was 0.7±0.1(N=8), indicating that the fish was producing thrust (Gra1933). The duration of one tailbeat cycle T was 0.26±0.016 s(N=4). The angle of the tail with respect to the path of motivaried between 0 ° when the tail was at its most lateral posito 49 ° when the tail was crossing the path of motion (T=0). Thelateral velocity of the tail tip varied out of phase with thswimming speed U between 0 m s−1 when the tail was in itsmost lateral position and 0.26±0.06 m s−1 (N=5) when the tailwas approaching the mean path of motion.
Flow field in the vicinity of the fish
Fig. 4 shows the flow in the vicinity of the fish’s body. Onparticle displacements in the xyplane at the level of the medio
t athem
al
y,
ontion
e
ly-
frontal plane of the fish are visible. The fish casts a shadowits left, obscuring the flow pattern in the bottom part of the flowfield.
Near the head, the water is pushed away and acceleratedour two-dimensional images of the xy plane, the waterdisplacement in the z-direction can be traced by calculating thedivergence of the flow (Stamhuis and Videler, 1995). Thiparameter peaks in front of the head, indicating that the wais thrust to the side as well as upwards and downwards. Tpeak in the flow speed due to this effect of the head 18±4 mm s−1 (N=14), averaged over two tailbeat cycles. Fig. 4also shows a stagnation point in the flow directly in front othe head.
The body undulations cause local speed maxima in the floadjacent to the fish’s body (Fig. 4). As the undulatory wavpasses down the body, the pressure and suction flows tracaudally along with the concave and convex bends. The pespeeds adjacent to the maximal lateral excursion of the fishbody increase along the body from 20 mm s−1 at 0.2L to50 mm s−1 or more when the wave crest reaches the peduncIn the tail region, the pressure and suction flows combine wi

2898 U. K. MÜLLER AND OTHERS
Fig. 4. Flow velocities in the vicinity of the fishwhen the tail has reached a lateral extreme position(field of view 0.195 m×0.175 m). The vectorinformation was obtained by combining PIV andPTV data. The colour code indicates themagnitude of the flow velocity; the arrowsrepresent the flow velocity in mm s−1. (A) Velocityvector field on the concave side of the fish’s bodyas the tail reaches a lateral extreme position to theright. (B) Velocity vector field on the convex sideof the body as the tail reaches a lateral extremeposition to the left. (C) Velocity vector field on theconcave side of the fish’s body as the tailapproaches the mean path of motion. The flowfield in C is based on PIV data alone.

2899Flow field of a mullet
epee.e of a
nitye
of).es
mn
d,eid
x
using
the circulatory flow around the tail into a vortex that is shwhen it is at its most lateral position. Peak flow speeds ofto 100 mm s−1 occur at the tail when the tail is crossing thmean path of motion (Fig. 4C). Peak flow speeds are aminimum of approximately 50 mm s−1 when the tail is at itsmost lateral position and is changing direction. Averaged otwo tailbeat cycles, the peak flow at the tail has a speed74±34 mm s−1 (N=34) and points away from the fish at an angof 44±14 ° (N=34) to the mean path of motion.
Flow in the wake of the fish
Wake morphology
Fig. 5 shows the flow in the xy plane as the fish leaves thfield of view (Fig. 5). When the tail reaches its maximulateral excursion and changes direction, a vortex is shed atail tip. Vortices shed to the left-hand side of the animal rotclockwise, vortices shed to the right-hand side rotate counclockwise. The distance ly between two consecutive vorticein the ydirection is 0.18±0.07L (N=47), this distance lx in thex direction is 0.26±0.09L (N=49) (Table 2).
Between two consecutive vortices, a jet flow is visibpointing obliquely sideways and away from the fish. The changes direction with every new vortex being shed, giving jet flow an undulating shape. The angle α between the directionof the jet flow and the mean path of motion is 44.5±7.(N=61).
ed upet a
ver ofle
emt theateter-s
lejetthe
5 °
Vortex morphology
The velocity and vorticity profiles of the vortices in the wak(Fig. 6) resemble the main characteristcs of a Rankine-tyvortex (Fig. 2). A Rankine vortex is a hypothetical structurIt has a core in solid-body rotation with zero velocity at thcentre and the velocity increasing linearly towards the edgethe vortex core; the core entrains the surrounding fluid topotential flow region, with the flow velocity decreasing iinverse proportion to the distance from the core. The vorticin the core is non-zero and constant; the vorticity in thpotential flow is zero. The u/y′ profiles of the vortices in thewake show two sharp velocity extremes close to the centrethe vortex marking the outer rim of the vortex core (Fig. 6ABeyond these extremes, the flow velocity decreascurvilinearly, indicating the potential flow region. The vorticityprofile of a vortex in a real fluid has no sharp transition froa finite constant vorticity value in the core to zero vorticity ithe potential flow region, but viscous effects induce a more S-shaped profile (Maxworthy, 1977). In all image pairs analysethe maxima in the vorticity vector fields coincide with thminima of dor are situated in a grid cell adjacent to the grcell with the minima of d, supporting the evidence from theω/R graph (Fig. 6C) that the vorticity is centred in the vortecore.
Over a period of 0.6 s after shedding, the vortex ring radiRstays constant (Table 3). The core at the moment of shedd

2900
he of
z
sulttheodyept
mpesil.
ake
theendy
rnsA,utesrd theral
erale
duetour7B).ardsnghe the insde
U. K. MÜLLER AND OTHERS
Table 2.Wake morphology parameters obtained from theflow fields after post-processing, averaged over 0.6 s
Wake parameter Units Mean S.D. N
Apparent ring radius R m 0.019 0.004 16Vortex spacing in y direction, ly L 0.18 0.07 47Vortex spacing in x direction, lx L 0.26 0.09 49Ring momentum angle ϕ degrees 40 10 55Jet angle α degrees 44.5 7.5 61Jet velocity m s−1 0.091 0.032 16Core velocity m s−1 0.067 0.016 16
Table 4.Energy calculations based on the wake momentumand the fish kinematic data
Hydro* Grid cell† Kine-Parameter Units dynamics precision matics
Circulation Γ m2 s−1 7.6×10⁻⁴ 1×10⁻⁵
Thrust energy ET mJ 0.073 0.004Vortex energy EL mJ 0.002 4×10⁻⁴
Efficiency η 0.971 0.001 0.586Thrust power PT mW 0.563 0.016 0.185Vortex power PL mW 0.017 0.001 0.131
*The hydrodynamic estimate is based on the flow field of a vortexring shed 0.08 s ago. We used the mean value of the vortex ringdiameter in the x′ and y′ directions to obtain the wake momentum.
†The grid cell precision gives the maximum error of the value dueto the finite size of the grid and the averaging procedure of the post-processing.
has a radius R0 of 6–8 mm. After 0.6 s, the core radius R0 hasdoubled. The peak flow velocity in the jet is 0.091±0.032 m s−1
(N=16) (Table 2); it does not decrease significantly over t0.6 s time interval considered. The peak velocity at the rimthe vortex core reaches values of 0.067±0.016 m s−1 (N=16).This gives the vortex core a rotation frequency of 1.0±0.5 H(N=16).
Energy in the wake
Since the fish sheds two vortex rings per tailbeat cycle, obtained thrust power PT from thrust energy ET and tailbeatfrequency f according to:
PT =ET2f . (6)
For a fish swimming continuously at 1.4L s−1, we obtained avortex circulation of 7.6×10⁻⁴m2s−1, resulting in a thrustenergy of 0.07 mJ and a thrust power of 0.56 mW (Table 4)vortex power of 0.02 mW and a hydrodynamic efficiency 97 % for a vortex approximately 0.1 s after being shed. Oveperiod of 0.6 s, the thrust energy and thrust power calculafor one particular vortex decreased to 0.01 mJ and 0.1 mrespectively. The precision of the energy calculation is limitby the grid resolution of the velocity vector field (Table 4).
DiscussionLinking kinematics and hydrodynamics
Several hypotheses have been put forward regarding generation of a chain of vortex rings. Rosen (1959) aBlickhan et al. (1992) suggested mechanisms that hold tbody responsible for a considerable part of wake generatLighthill (1969), Ahlborn et al. (1991) and Videler (1993)described a mechanism in which the vortex wake is generaexclusively by the tail.
Wake generation and body kinematics
Rosen (1959) suggested that the vortices he observed in
eachk
aker
me
Table 3.Vortex parameters obtained directly from the PTVdata, averaged over 0.24 s
Parameter Units Mean S.D. N
Ring radius R m 0.019 0.004 16Core radius R0 m 0.012 0.004 16Core radius/ring radius R/R0 0.69 0.34 16
we
, aofr atedW,ed
thendheion.
ted
his
two-dimensional horizontal impressions of the wake were a reof the separation effects of a rolling-up boundary layer along fish’s body. We did not observe the attached vortices on the bdescribed by Rosen (1959). Our flow fields support the concof circulation generated on the body by the undulatory pumechanism and of bound vortices at the tail, both typcombining into a single free vortex upon being shed at the ta
The undulating pump mechanism generating the vortex wwas first proposed by Blickhan et al. (1992): the alternatingsuction and pressure flows form a circulating flow around inflection points of the body; this circulating flow is shed whthe inflection point reaches the tail. Our results on the bokinematics together with the development of the flow pattearound a swimming mullet support this hypothesis. In Fig. 7the superimposed body contours show that the head contribmost significantly to the initial outward lateral watedisplacement. The contours on the convex side barely exceehead contours, even in the tail region where the latedisplacement of the body reaches its maximum. The latmovement of the body adds very little to the water volumdisplaced laterally. The largest lateral water displacements to the body occur on the concave side where the body conrecedes considerably compared with the head contour (Fig.This receding movement generates strong suction flows towthe body of the fish. The flow velocities increase slowly alothe first two-thirds of the body. The peak flow velocities on tconcave side of the body do not exceed the velocities onconvex side for the first two-thirds of the body; peak valuesthe fluid adjacent to the body are between 0.02 and 0.03m−1.In the last third of the body, where the body wave amplituincreases considerably, the peak velocities in suction zones rvalues of up to 0.10ms−1 in the tail region, whereas the peavelocities on the pressure side remain as low as 0.03ms−1. Thelateral movements of the body create strong suction and wepressure flows in the posterior third of the body.
These maxima in the flow velocity at the points of maximulateral excursion alternate with flow velocity minima at th

2901F
low
field
of a
mu
llet
Fig. 5. The wake of a continuously swimming mullet (field of view 0.195 m×0.175 m);vector information was obtained by combining PIV and PTV data. The arrows representthe flow velocity in mm s−1; the colour code represents vorticity in A–C, with bright shadesindicating clockwise vorticity and dark shades indicating counter-clockwise vorticity; the
colour code represents the discriminant for complex eigenvalues in D. (A) Vorticity ω attime 0 s. (B) Vorticity ω at time 0.16 s. The vortices are numbered from just shed (1) toolder (2–4) vortices. (C) Vorticity ω at time 0.32 s. (D) Discriminant for complexeigenvalues d at time 0.32 s; d is at its most negative (red) in the centre of the vortices.

2902 U. K. MÜLLER AND OTHERS
A
−125
−75
−25
25
75
125
−150 −100 −50 0 50 100
Flow
com
pone
nt u
(m
m s
−1)
B
−150
−50
50
150
−100 −50 0 50 150
Flow
com
pone
nt v
(m
m s
−1)
y0−y (mm)
C
−5
0
5
10
15
20
25
0 10 20 30 40 50 60
Vortex radius (mm)
Vor
ticity
(s−
1 )
100
x0−x
Fig. 6. Velocity and vorticity profiles of vortices fromFig. 5B. The transect runs through the core of thevortex; the width of the transect is 10 % of the vortexring diameter. (A) uvelocity profiles through vortex1 from Fig. 5B. (B) v velocity profile through thevortex system formed by vortices 1 and 2 fromFig. 5B. (C) Vorticity ω profile of vortex 1 fromFig. 5B.

2903Flow field of a mullet
heitthealoponeerx
a
t,tse),
ry
eakes
transition between suction and pressure zones. This transcoincides with a small peak in vorticity and occurs near tcharacteristic points of the body wave. One is the inflectpoint of the body wave, and the other is the crossing pobetween two consecutive midlines (Fig. 7C). The close vicinof those two points constitutes the heart of the undulatpump: the body appears to rotate around a point in spaceto entrain the surrounding fluid to follow its rotatinmovement. The rotation centre travels down the body witspeed similar to the speed V of the body wave: both inflectionpoint and crossing point travel backwards (0.6±0.8V, N=36,and 0.8±1.0V, N=30, respectively) and away from the meapath of motion (0.1±0.3V, N=36, and 0.1±0.2V, N=30,respectively) in an earth-bound frame of reference at spenot significantly different from the propulsive wave speed V.As the inflection and the crossing point – along with the suctand pressure zones – travel down the body, the flow velocin the suction and pressure zones increase.
Wake morphologyversuskinematic tail parameters:maximising efficiency of thrust production
The hypotheses of Lighthill (1969), Ahlborn et al. (1991)
A
B
C
10 mm
P
Fig. 7. Linking kinematics andhydrodynamics in a continuouslyswimming mullet. The contour andthe midline of the fish shown inFig. 4A are indicated in red. Thehorizontal scale applies to all partsof the figure. (A) Superimposedbody contours of a swimmingmullet for 1.5 tailbeat cycles.(B) Schematic drawing of theflow pattern in the vicinity of aswimming mullet. S, a suctionzone adjacent to a concave bendin the body; P, a pressure zoneadjacent to a convex bend in thebody; arrows indicate the mainflow directions. (C) Midlines of aswimming mullet for one tailbeatcycle. The circles on the midlinesindicate inflection points. Thevertical scale is enlarged withrespect to the horizontal scale toemphasise the movements of theinflection point and the body wave.
itionwoionintityory andgh a
n
eds
ionities
and Videler (1993) interpret the vortex wake as a result of ttail kinematics. A bound vortex is built up around the tail as sweeps from one side to the other during one tailbeat. As tail changes direction when it reaches its most laterdisplacement, this circulating flow is shed as a start–stvortex and a new bound vortex is generated. Since there is tip vortex at the upper tip and another tip vortex at the lowtip of the tail, two consecutive start–stop vortices form a vortering.
The wake of a continuously swimming mullet exhibits aflow pattern that is consistent with the assumption of suchthree-dimensional vortex chain. In our two-dimensional viewof the wake, only sections through the vertical ring componeni.e. start–stop vortices, are visible together with transecthrough the jet flow. We can thus support the evidencpresented by Rosen (1959), Hertel (1966), Gray (1968Aleyev (1977) and Blickhan et al.(1992) that such a vortexchain is characteristic of the wake behind a cruising undulatoswimmer.
The hypothesis of the tail-induced wake predicts somcorrespondence between tailbeat cycle, tail shape and wmorphology. In the continuously swimming mullet, the centre
50 mm
P
PS
S
2904
s
woow
sizechingtics,the isngsxmizeder
) toeticbulk tod
de.heavetheofd,
andtooionselar
tex.he
ifngandrtexuse
rtex
cedletetesethetohishesan
U. K. MÜLLER AND OTHERS
of the vortices corresponded approximately to the positionthe tail tip at the time of vortex shedding. The distance betwthe consecutive vortices in the direction of the mean pathmotion (lx=0.26±0.09L) was equivalent to half the stride leng(0.53L) for vortices up to 0.6 s after being shed (Table 2). Tdistance between consecutive vortices perpendicular to path of motion (ly=0.18±0.07L) was twice the tailbeaamplitude (0.09L). We could detect no displacement of thshed vortices. After 1 s, the wake had deteriorated sufficiento make the detection of most vortex centres impossible. Tvortex ring diameter 2R in the xy plane (2×0.019 m) is twicethe tail fin height (0.02 m). This would translate to an ovvortex ring, unlike the circular vortex rings described bBlickhan et al. (1992).
Lighthill (1969, 1970) showed theoretically that, fosignificant positive thrust production at high efficiency, the fineeds to tune its kinematics appropriately. Lighthill (1961970) varied mainly the feathering parameter to find toptimal kinematics for good efficiency. The featherinparameter F expresses the orientation of the tail in the flow:relates the angle between the tail fin and the mean pathmotion to the angle of the tail path. F is the product of the stridelength λs and the maximum angle β of the tail fin divided bytwice the tailbeat amplitude Atail:
F = λsβ/2Atail . (7)
Lighthill (1969, 1970) concluded that feathering parametebetween 0.6 and 0.8 are best for maintaining high efficienTriantafyllou et al.(1993) used the kinematic values suggestby Lighthill (1969, 1970) for optimum efficiency to conducexperiments on the efficiency of thrust production by flapping foil. They used the Strouhal number St (the ratio ofunsteady to inertial forces, a parameter used to descoscillating phenomena in fluids) to describe the wake of foil. The Strouhal number St is calculated according to:
St= (frequency of vortex shedding×width of the wake)/U . (8)
Triantafyllou et al. (1993) found maximum efficiency forStrouhal numbers in the range 0.25–0.35.
The feathering parameter derived for mullet in the analysswimming sequence was 0.7, which is within the optimurange; the Strouhal number was 0.34, also within the optimrange (Table 1). Triantafyllou et al. (1991, 1993) list a rangeof Strouhal numbers derived from the kinematic parametersseveral fish species on the assumptions that the frequencvortex shedding is twice the tailbeat frequency and that width of the wake is twice the tailbeat amplitude. Our dashow that this is a valid first approximation of the Strouhnumber. The values of these estimates in the present studclose to the optimum range for all fish species considered.
Fish seem to tune their kinematics to produce an optimwake for maximal hydrodynamic efficiency. Using Spedding(Spedding et al. 1984) calculation method for hydrodynamiefficiency, we calculate a value of greater than 90 % for actively swimming mullet at a Strouhal number of 0.34.
ofeen ofthhethe
tetlyhe
aly
rsh9,heg it of
rscy.edta
ribethe
edmum
ofy ofthetaal
y are
al’scan
Swimming energetics: various methods to estimate cost
The external costs of swimming can be estimated using tapproaches. The hydrodynamic approach measures flparameters and deduces the costs of swimming from the and the flow velocities of the wake. The kinematic approauses the kinematic parameters describing the swimmmovements of the fish and estimates the swimming energeinferring the flow and its energetic consequences from fish’s movements. One possible hydrodynamic approachbased on estimating the energy shed in the form of vortex ri(Spedding et al.1984). The backward momentum of the vorterings is thought to correspond to the forward momentugained by the fish. The momentum is calculated from the sand the circulation of the vortex rings. Applying this methoto mullet, we derived a thrust power of 0.6 mW, a vortex powof 0.02 mW and a hydrodynamic efficiency of 97 %.
An example of the kinematic approach is Lighthill’s (1970bulk momentum theory. It uses the movements of the tailestimate the fish-induced water movements and their energconsequences for the fish. The parameters that enter the momentum model are the angle of the tail fin with respectthe path of motion, the velocity of the tail both parallel anperpendicular to the tail blade, and the size of the tail blaCalculation of the thrust and the waste power from tkinematics of the mullet for the same sequence (Table 4) gless than half the thrust power (0.185 mW) compared with flow-derived thrust, but gave a higher vortex power 0.13 mW than did the flow-derived calculations anconsequently, a much lower efficiency (59 %).
Either the hydrodynamic approach overestimates thrust underestimates vortex power or the kinematic estimate is conservative. Both approaches contain several assumptthat might affect their precision. In the calculation of thenergy from the wake momentum, we assumed circuvortices, although the ring diameter in the x′ direction wasdifferent from the ring diameter in the y′ direction. We alsoassumed a constant vorticity centred in the core of the vorBoth assumptions are rather robust against violations. Tcalculation of the waste energy from the vortex is only validthe vortex core diameter is smaller than 0.25 vortex ridiameters. In the mullet, the core diameter is between 0.19 0.28 ring diameters. Spedding (1986) suspected that the voring approach underestimated the costs of locomotion becanot all energy shed in the wake may be contained in the vorings.
The bulk momentum model assumes that the flows induby the body movements cancel each other out over a comptailbeat cycle and that only the flow shed at the tail contribusignificantly to the thrust. With vortex structures lying at thheart of momentum flux and hence thrust generation in inertial flow regime, the fish needs to invest energy ingenerating vortices to propel itself (Rayner, 1995). Taking tinto consideration, the circulating flows generated by tundulating body might contribute significantly to the vorticeshed at the tail. A rough estimate of the body contribution c

2905Flow field of a mullet
th
n
rgheo
ry
of
f
l
Inn
be obtained from the changes in the flow speed adjacent tofish’s body. Along the body, water is accelerated to pespeeds of 30–50 mm s−1 in the pressure and suction zones. the tail region, the water is accelerated further to peak speof 100 mm s−1. The water is accelerated along the first twthirds of the body to almost half its final speed, while thposterior third of the body accounts for the acceleration to flow final speed. With the body wave travelling at a constaspeed along the body, the acceleration along the anterior of the body takes place over twice the distance and thus twthe time as the acceleration along the posterior third of body. This would mean that the acceleration along the antetwo-thirds of the body is half the acceleration along tposterior third of the body. Consequently, the anterior bocontributes roughly a third of the total energy added to twater, with the tail region adding the remainder.
The present analysis of a two-dimensional view of the wabehind a swimming mullet is consistent with the thredimensional chain of vortex rings postulated on theoretigrounds (Lighthill, 1975; Videler, 1993) and observed fseveral fish species (Rosen, 1959; Aleyev, 1977; Blickhanetal. 1992). The tail sheds two start–stop vortices per tailbcycle, forming a wake of alternating vortices in the medifrontal plane of the fish. The power values derived from twake using the vortex ring model (Spedding et al.1984) yieldthrust values of less than 1 mW with a hydrodynamefficiency greater than 90 %. Expressing the thrust energythe costs of moving the fish’s body mass one body length yie0.02 J N−1m−1. This external cost of transport for a mulleswimming steadily at a speed close to its maximum ranspeed (Tucker, 1970) is an order of magnitude smaller thantotal cost of transport for undulatory swimmers at optimswimming speed (Videler, 1993).
List of symbolsAb amplitude of the body waveAs amplitude of the propulsive waveAtail amplitude of the body wave at the tailB a constant depending on the vorticity profile of a
vortex, equivalent to A– of Spedding et al. (1984)and Aof Lamb (1932)
d discriminant for complex eigenvaluesET thrust energyEL self-energy of the vortex ringf tailbeat frequencyF feathering parameterI momentum of the vortex ringL body length of the fishlx distance between consecutive vortices in the x
directionly distance between consecutive vortices in the y
directionp phase of the body wavePL vortex power
theakIneds
o-e
thentpartice
theriorhedyhe
kee-calor
eato-he
ic asldstge theal
PT thrust powerR radius of the vortex ringR0 radius of the vortex coreSt Strouhal numberT duration of the tailbeat cycleU swimming speed of the fishu flow velocity component parallel to the x′-axisV speed of the propulsive wave parallel to the y′-axisv flow velocity componentx mean path of motion of the fishy direction of the lateral displacement of the tailα momentum angle of the jet flowβ maximum angle between the tail blade and the pa
of motionΓ circulation of the vortexη efficiencyϕ momentum angle of the vortex ringλb body wavelengthλs propulsive wavelength (stride length)θ divergenceρw density of water (=1021 kg m3)ω vorticity
We would like to thank the Sea Life Centre in Scheveningefor the mullet and BASF for providing the polystyreneparticles. U.K.M. would like to thank Thomas Weber focomments on the manuscript and R. Blickhan for inspirinmany of the ideas presented here on fish hydrodynamics. Tmanuscript was greatly improved by the kind comments of twanonymous referees.
ReferencesAHLBORN, B., HARPER, D. G., BLAKE, R. W., AHLBORN, D. AND CAM,
M. (1991). Fish without footprints. J. theor. Biol. 148, 521–533.ALEYEV, Y. G. (1977). Nekton. The Hague: Dr W. Junk. 435pp.BLICKHAN , R., KRICK, C., ZEHREN, D. AND NACHTIGALL , W. (1992).
Generation of a vortex chain in the wake of a subundulatoswimmer. Naturwissenschaften79, 220–221.
CHEN, C. J., KIM, Y. G. AND WALTER, J. A. (1993). Progress inquantitative flow visualisation and imaging process. In Atlas ofVisualisation, pp. 279–296. Oxford: Pergamon Press.
GRAY, J. (1933). Studies in animal locomotion. I. The movement fish with special reference to the eel. J. exp. Biol. 10, 88–104.
GRAY, J. (1968). Animal Locomotion. London: Weidenfeld andNicholsen.
HERTEL, H. (1966). Structure, Form, Movement. New York: ReinholdPublishing Corp. 251pp.
HESS, F. AND VIDELER, J. J. (1984). Fast continuous swimming osaithe (Pollachius virens): a dynamic analysis of bending momentsand muscle power. J. exp. Biol.109, 229–251.
HINSCH, K. D. (1993). Particle image velocimetry. In SpeckleMetrology (ed. R. S. Sirohi), pp. 235–324. New York: MarceDekker Inc.
KEANE, R. D. AND ADRIAN, R. J. (1991). Optimization of particleimage velocimeters with multiple-pulsed systems. Paper 12.4. Proceedings of the Fifth International Symposium on Applicatio

2906
ge
ls.
.
rel
d
U. K. MÜLLER AND OTHERS
of Laser Techniques to Fluid Mechanics, Lisbon, Portugal. Lisbon:Ladoan Instituto Superior Tecnico.
LAMB, H. (1932). Hydrodynamics. 6th edition. Cambridge:Cambridge University Press. 738pp.
LIGHTHILL , M. J. (1969). Hydromechanics of aquatic animalocomotion. A. Rev. Fluid Mech. 1, 413–446.
LIGHTHILL , M. J. (1970). Aquatic propulsion of high hydrodynamiefficiency. J. Fluid Mech.44, 265–301.
MAXWORTHY, T. (1977). Some experimental studies of vortex ringJ. Fluid Mech.81, 465–495.
MCCUTCHEN, C. W. (1977). Froude propulsive efficiency of a smafish, measured by wake visualisation. In Scale Effects in AnimalLocomotion(ed. T. J. Pedley), pp. 339–363. London: AcademPress.
MERZKIRCH, W. (1974). Flow Visualisation. New York: AcademicPress.
RAYNER, J. M. V. (1979). A vortex theory of animal flight mechanicsJ. Fluid Mech.91, 731–763.
RAYNER, J. M. V. (1995). Vortex wakes of vertebrates. In BiologicalFluid Dynamics(ed. C. P. Ellington and T. J. Pedley), pp. 131–15Cambridge: The Company of Biologist Ltd.
ROSEN, M. W. (1959). Water Flow About a Swimming Fish. ChinLake, CA: US Naval Ordnance Test Station TP 2298. 96pp.
SPEDDING, G. R. (1986). The wake of a jackdaw (Corvus monedula)in slow flight. J. exp. Biol.125, 287–307.
l
c
s.
ll
ic
.
5.
a
SPEDDING, G. R. (1987). The wake of a kestrel (Falco tinnunculus) inflapping flight. J. exp. Biol.127, 59–78.
SPEDDING, G. R., RAYNER, J. M. V. AND PENNYCUICK, C. J. (1984).Momentum and energy in the wake of a pigeon (Columbia livia)in slow flight. J. exp. Biol. 111, 81–102.
STAMHUIS, E. J. AND VIDELER, J. J. (1995). Quantitative flow analysisaround aquatic animals using laser sheet particle imavelocimetry. J. exp. Biol.198, 283–294.
TRIANTAFYLLOU , M. S., TRIANTAFYLLOU , G. S. AND GOPALKRISHNAN,R. (1991). Wake mechanics for thrust generation in oscillating foiPhys. Fluids A 3, 2835–2837.
TRIANTAFYLLOU , M. S., TRIANTAFYLLOU , G. S. AND GROSENBAUGH, M.A. (1993). Optimal thrust development in oscillating foils withapplication to fish propulsion. J. Fluid & Structures7, 205–224.
TUCKER, V. A. (1970). Energetic cost of locomotion in animalsComp. Biochem. Physiol.34, 841–846.
VIDELER, J. J. (1993). Fish Swimming. London: Chapman & Hall.260pp.
VIDELER, J. J. AND HESS, F. (1984). Fast continuous swimming of twopelagic predators, saithe (Pollachius virens) and macke(Scomber scombrus): a kinematic analysis. J. exp. Biol. 109,209–228.
WARDLE, C. S., VIDELER, J. J. AND ALTRINGHAM, J. D. (1995). Tuningin to fish swimming waves: body form, swimming mode anmuscle function. J. exp. Biol.198, 1629–1636.