fish community surveys of twin cities metropolitan...
TRANSCRIPT
1
Minnesota Department of Natural ResourcesSpecial Publication 156, October 2001
Fish Community Surveys of Twin Cities Metropolitan Area Streams
Konrad Schmidt and Philip Talmage
Minnesota Department of Natural Resources500 Lafayette RoadSt. Paul, MN 55155
Abstract.--One hundred thirty-three Twin Cities Metropolitan area stream stations weresampled during 1998-2000. Our goal was to gain knowledge of fish communities in these rarelystudied urban streams and to document their status. Seventy-two species from 18 families werecollected during the survey. Fathead minnows, central mudminnows, and green sunfish were themost frequently occurring species. Trout were collected from 26 of the 133 stations. Brook troutwere present at 16 stations, while brown trout were collected from 15 stations, and rainbow troutfrom one station. Several warmwater game fish species were also collected. Index of bioticintegrity scores of warmwater streams ranged from 0 (very poor) to 60 (good), with a medianof 20 (poor). Coldwater biotic integrity scores reflected conditions more similar to referenceconditions. Coldwater scores ranged from 20 (poor) to 115 (excellent), with a median of 103(excellent). No endangered, threatened, or special concern species were sampled during thisstudy. However, 10 species collected during this survey are rarely reported from the Twin CitiesMetropolitan area. Future studies should focus on the geographical and hydrological diversity ofthese streams in a manner that would allow for monitoring of resource integrity over time.
Introduction
The Twin Cities Metropolitan Area(TCMA) includes portions of four major riverbasins: Minnesota, Upper and LowerMississippi, and St. Croix rivers. This areaencompasses approximately 1,903,435 acres and1,897 miles of stream, and includes 7 counties(Anoka, Carver, Dakota, Hennepin, Ramsey,Scott, and Washington). Although agriculturepersists on the periphery, this is the mosturbanized and densely populated area of thestate. Common impacts to streams includeincreased frequencies of flash flooding, severebank erosion, desiccation during low andsometimes base flows, rapid and extremetemperature fluctuations, chemical spills andnutrient enrichment from streets and lawns, and
internment (e.g., Bassett Creek where the last2 miles of stream is piped under Minneapolis).
Urban streams often have alteredhydrology, chemistry, habitat, and streammorphology that impacts their fish communities.Large areas of impervious surfaces in thewatershed have resulted in flashy hydrographswhich can alter stream habitat quality (Boothand Reinelt 1993). Urban streams tend to bewider and shallower than their unimpacted ruralcounterparts (Klein 1979). Ion concentrations(e.g., sodium and chloride) have been shown tobe correlated to reductions in species richnessand diversity (Talmage et al. 1999). Theoccurrence of sodium and chloride exemplify theoften overlooked effects of nonpoint sourcepollution. Point and nonpoint source pollutantsmay impair water quality of otherwise goodhabitat stream reaches and cause consequent
2
impairment of the biotic communities. A studyby Talmage et al. (1999) found that habitat inTCMA streams has been reduced, and thisreduction in habitat was largely attributed tohuman disturbance. These disturbances, alongwith others, act together to impact the bioticcommunities, including the fish that inhabitTCMA streams.
The need for a TCMA wide survey wasfirst proposed by Dr. Jay Hatch, AssociateCurator of the University of Minnesota's JamesFord Bell Museum of Natural History fishcollection. For years, he received an increasingnumber of requests, from a variety of interests,for information concerning fish composition inTCMA streams. However, he discovered therewas very little coverage of TCMA streams inthe fish collection's holdings. This study wasintended to be an initial investigation of streamresources in the TCMA. Potential applicationsof this information include environmentalplanning and review, watershed planning, andfisheries management (i.e., trout).
Methods and Materials
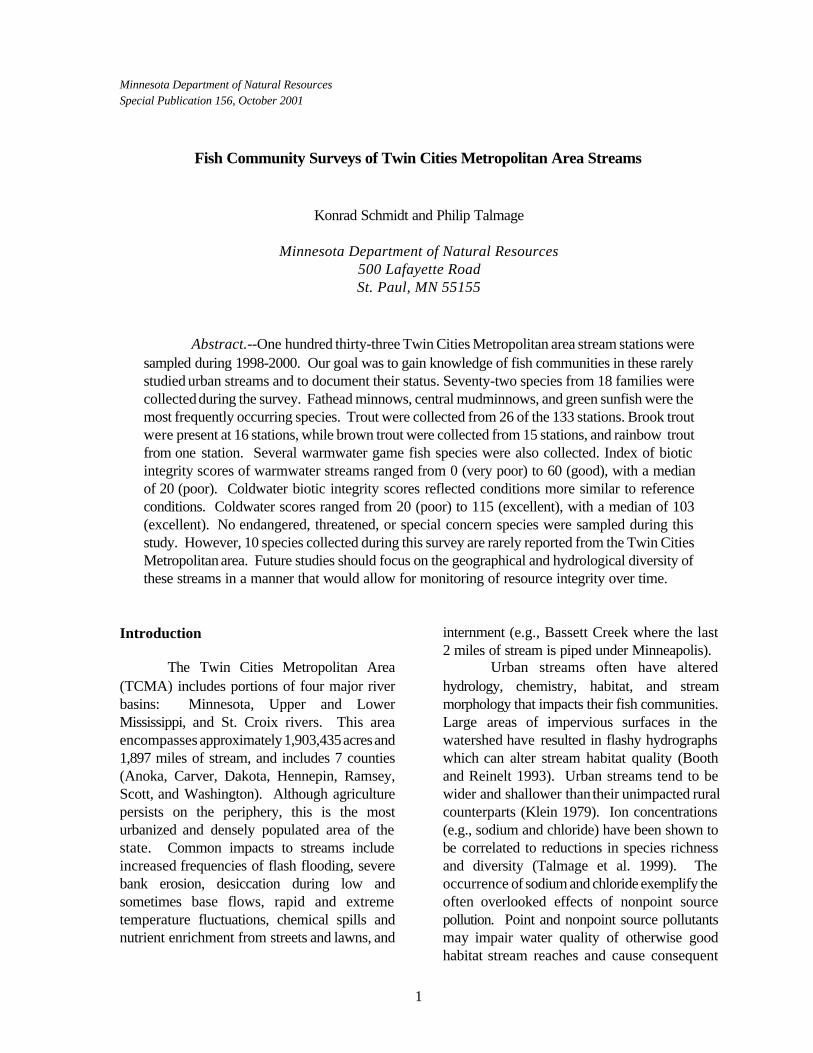
One hundred thirty-three sites weresampled beginning with five in the fall of 1998,80 in 1999, and 48 in 2000 (Figure 1).Twenty-seven additional stations were notsampled, primarily in the western TCMA, due todrought conditions in 2000. All sampled streamswere located within or near the TCMA.
Station selection was restricted towadeable, permanent flow sites. Generally, onsmall streams, one station was established in thelower watershed. On impacted and largerstreams, multiple stations were establishedabove and below barriers or waste watertreatment plants. Sites were selected torepresent the TCMA, this was not a full surveyof the entire TCMA.
Stream survey stations wereinvestigated twice. On the first site visit,streams were examined to determine access,flow, reach length, and appropriate samplinggear. Station lengths were a minimum of 35times the average stream width with a minimum
of 150 meters (m) for streams 3 m or less inwidth, and a maximum of 500 m for streamsmore than 14 m wide. A Garmin 12 channelglobal positioning system (GPS) recordedlatitude/longitude coordinates at the station'smidpoint. Stations were marked with flagging atthe downstream, middle, and upstream points.At each stream, a camcorder was used torecord instream and riparian habitat condition ata minimum of the three points, or every bend insinuous streams.
On the second visit, data were collectedon water chemistry, fish communities, andhabitat. On-site water chemistry analysesincluded transparency recorded in centimeters(cm, using a transparency tube), turbidity innephelometric turbidity units (ntu), pH, dissolvedoxygen in milligrams/liter (mg/l), temperature indegrees centigrade (?C), and conductivity in?mhos@25?C. Additional water samples werecollected for analyses of ammonia, nitrates, andnitrites by the Minnesota Department of Health.In 1998 and 2000, total phosphorous and totalsuspended solids were also analyzed. Waterchemistry results were compiled into STORETwhich is a national database maintained by theEnvironmental Protection Agency.
Fish sampling was restricted toelectrofishing gears. A 12 volt Smith-Root TypeVII electrofisher was used in small streams anda custom stream electrofisher (tow barge)equipped with Coffelt VVP-15 unit was used formid-size streams. All collected fish wereidentified, sorted by species, tallied, batchweighed in grams (g), smallest and largestspecimens measured for a total length range inmillimeters (mm), and examined for anomaliessuch as deformities and lesions. Up to 10specimens of each species were preserved informalin for later verification and final depositionin the fish collection at the James Ford BellMuseum of Natural History, University ofMinnesota, St. Paul. Effort was

3
##
###
##
#
#
#
##
#
##
##
#
#
#
#
##
##
#
#
# ###
##
#
#
#
###
#
#
##
#
#
#
#
##
#
##
## ##
#
#
#
##
#
#
# #
#
## #
#
## #
#
#
##
##
#
#
##
#
##
#
##
#
##
##
##
##
#
#
###
#
#
#####
#
#
###
#
#
#
###
#
#
#
# ##
#
#
#
#
##
#
HennepinRamsey
Anoka
Washington
Dakota
Scott
Carver
Chisago
0 10 20 Miles
Figure 1. Metro stream survey stations.
N

4
recorded in seconds to determine catch pereffort (CPE) which is a relative abundancevalue of species at each station, and expressedas fish sampled per hour (fish/hr).
Finally, habitat features weredocumented. These features included substrate,instream cover, channel morphology, riparianzone, bank erosion, pool/riffle/run quality, andgradient.
At the completion of the field work, asummary report, raw data including all fieldforms, and VHS video tape of stations wereprovided to Scott Niemela in the MinnesotaPollution Control Agency (MPCA),Environmental Outcomes Division in St. Paul.
The index of biotic integrity (IBI) wasused to evaluate the status of the fishcommunities in these TCMA streams. The IBIevaluates various attributes (metrics) of the fishcommunity and then scores them based oncomparisons to the most pristine sites in theregion. An IBI approach provides theframework to bring together the cumulativeeffects of various disturbances impactingstreams (Karr and Chu 1999). TCMA streamswith higher scores are more similar to pristineconditions, while streams with low scores havebeen severely impacted.
Using an IBI requires a modificationspecific to regional conditions (Fausch et al.1984; Steedman 1988). The TCMA does nothave a regionally developed IBI specific to theentire area. Therefore, two IBI versions wereconsidered for rating TCMA warmwaterstreams because their development was done inor near the TCMA: one developed forwadeable warmwater streams of Wisconsin(Lyons 1992); and the other developed forcoolwater streams of the St. Croix River basin(Niemela and Feist 2000). Each IBI was usedto score the entire warmwater data set. Thenindividual sites and metrics were compared.The Wisconsin Department of NaturalResources (WDNR) version (Lyons 1992) wasconsistently able to account for and adequatelyscore the uncharacteristic conditions found inthe numerous headwater sites in this study.Both modifications gave scores that were similarfor non-headwater streams, however, the St.
Croix River IBI (Niemela and Feist 2000) wasconsistently higher. The St. Croix River IBIhigher scoring at non-headwater streams waslikely due to differential scoring of the“abundance” and “health condition” metrics.The St. Croix River IBI scores a positive 20points as long as enough fish are present and notdemonstrating high percentages of deformities,regardless of species, while the Wisconsinversion deducts from the IBI score only if fishquantities and percentage of deformities aresub-standard.
For the assessment of warmwaterstreams, the IBI developed by the WDNR wasemployed (Lyons 1992). This IBI evaluates 10metrics, has total scores ranging from 0 to 100,and rates fish communities from very poor toexcellent (Table 1). Because this modificationof the IBI was not specifically developed for useon TCMA streams, there are caveats to its use.First, the WDNR IBI was developed for use onmoderate sized wadeable streams, not“headwater” streams that are common in theTCMA. However, while many of the sitessampled in this survey are considered“headwater” streams, they do not function assuch. TCMA streams generally demonstratedspecies richness and composition of moderatesized streams. Additionally, TCMA streamstypically have a close proximity (within 1-2miles) to larger streams, rivers, and lakes. Insummary, this particular version of the IBI mayhave scored headwater streams low; however,when compared to other regional modificationsit provided the most accurate results. Second,although the WDNR IBI was developed forwarmwater streams of Wisconsin, fishcommunities in TCMA streams arezoogeographically similar to the streams ofcentral Wisconsin. Additionally, TCMA streamsare more geomorphologically and hydrologicallysimilar to central Wisconsin streams than to theSt. Croix River basin.
For the coldwater streams in theTCMA, we used an IBI developed by Mundahland Simon (1999) for Midwestern coldwaterstreams. This version of the IBI evaluates 12metrics, and scores range from 0 to 120 (Table2). Warmwater streams were common

5
Table 1. Guidelines for interpreting overall warmwater IBI scores (from Lyons 1992).
Overall IBIScore
Biotic integrityrating
Fish community attributes
100-65 Excellent Comparable to the best situations with minimal human disturbance; all regionallyexpected species for habitat and stream size, including the most intolerant forms, arepresent with a full array of age and size classes; balanced trophic structure.
64-50 Good Species richness somewhat below expectation, especially due to the loss ofintolerant forms; some species, especially top carnivores, are present with lessoptimal abundances or size/age distributions; trophic structure shows some signs ofimbalance.
49-30 Fair Signs of additional deterioration include decreased species richness, loss of intolerantforms, reduction in simple lithophils, increased abundance of tolerant species, and/orhighly skewed trophic structure (i.e., increasing frequency of omnivores anddecreased frequency of more specialized feeders); older age classes of topcarnivores rare and absent.
29-20 Poor Relatively few species; dominated by omnivores, tolerant forms, and habitatgeneralists; few or no top carnivores or simple lithophilous spawners; growth ratesand condition factors sometimes depressed; hybrids sometimes common.
19-0 Very Poor Very few species present, mostly exotics or tolerant forms or hybrids; few large orold fish; DELT fish (fish with deformities, eroded fins, lesions, or tumors) sometimescommon.
No score Very Poor Thorough sampling finds few or no fish; impossible to calculate IBI.
Table 2. Guidelines for interpreting overall coldwater IBI scores (from Mundahl and Simon 1999).
Overall IBIScore
Biotic IntegrityRating
Fish community attributes
105-120 Excellent Comparable to the best situations with little human disturbance; 3 or 4 coldwaterspecies present; dominated (>75%) by brook trout; exotic salmonids absent or limitedto few individuals; sculpin present; lampreys often present; white suckers absent;warmwater species absent or very uncommon.
70-100 Good Some impairment present; coldwater intolerant species (sculpin, brook trout) reducedin abundance; white suckers present in low numbers; often dominated by brown troutor other salmonids; higher species richness resulting from presence of more tolerantwarmwater minnows and darters.
35-65 Fair Moderate impairment; coldwater intolerant species rare or absent; brown trout andmore tolerant coldwater species (e.g., brook stickleback) may be common; relativelyhigh species richness; warmwater species relatively common.
10-30 Poor High impairment; more tolerant warmwater species usually dominant; white suckersoften abundant; salmonids very rare or absent; relatively high species richness.
0-5 Very Poor Severe impairment; coldwater fish absent; only warmwater species present.
No score No Score Too few fish (<25 individuals) to calculate IBI score.

6
throughout the entire TCMA, whilecoldwater/trout streams were located primarilyin the St. Croix River basin (WashingtonCounty). Some of these coldwater streams aremanaged for trout, while others have remnantpopulations from historic stocking. It wasevident that natural reproduction is also takingplace in many of these coldwater/trout streams.
Results and DiscussionThe three year study sampled over
50,000 fish representing 72 species in 18 families(Table 3). Overall, the emerald shiner was themost abundant species and comprised 28.8 % ofthe total catch but occurred at only 14.4% of thestations. Fathead minnows, centralmudminnows, and green sunfish were the mostfrequently occurring species which were presentat 61.6, 52.8, and 61.6 % of the stations,respectively. Mooneye, goldfish, silver chub,spottail shiner, mimic shiner, smallmouth buffalo,bigmouth buffalo, brown bullhead, rainbow trout,tiger trout (hybrid), brook silverside, mottledsculpin, slimy sculpin, white bass, rock bass,banded darter, and river darter were the rarestfishes which each comprised 0.1 % or less ofthe total catch and were present at only one ortwo stations (0.8 - 1.6 % occurrence).
Eighty-eight of the 133 stations exhibitedlow species richness. No fish were found at 9stations, 1-5 species at 49 stations, and 6-10species at 30 stations. Species diversity washigher at other stations with 11 to 14 species at23 stations, 16 to 20 species at 15 stations, andmore than 20 species at 7 stations. The greatestspecies richness occurred in moderate to largestreams which include Bevens and Carvercreeks (Carver County), Chub Creek andVermillion River (Dakota County), CannonRiver (Goodhue County), and Credit River andSand Creek (Scott County) at 28, 31, 29, 31, 22,23, 29 species, respectively. Several smallerstreams also had diverse communities, butgenerally were in close proximity to a lake orriver which provided access for species nottypically found in streams of this size on apermanent basis. However, Seelye Brook(Anoka County) was one exception where 19species were sampled.
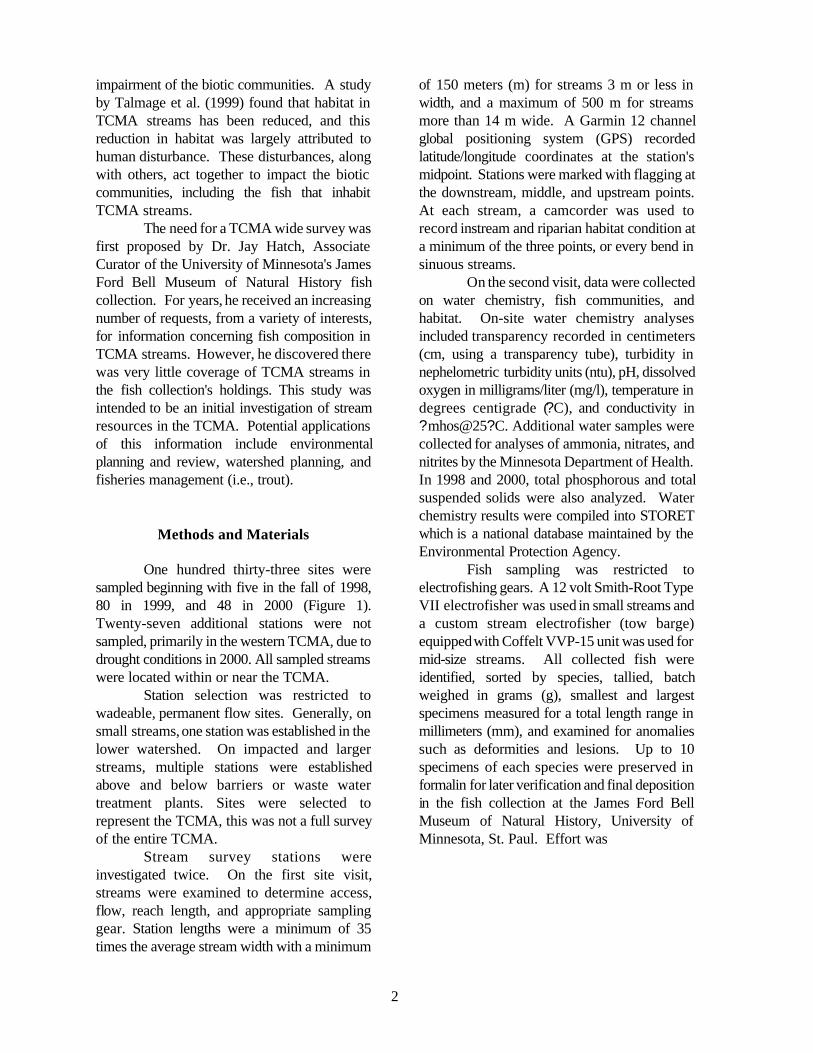
Trout StreamsTrout species were sampled at 26
stations on 20 streams (Table 4 and Figure 2).Brook trout were present at 16 stations, browntrout at 15 stations, and rainbow trout at onestation. However, brook and brown trout weresampled together at only five stations. One tigertrout, which is a hybrid between a brown andbrook trout, was collected at station 99TC025 inValley Branch (Washington County). Brooktrout are the only native stream trout inMinnesota and require near pristine conditionsfor survival. With the exception of Trout Brookin the Cannon River watershed, all streamswhich had brook trout were in the St. CroixRiver drainage in Chisago and Washingtoncounties. Stream sampling stations with thehighest CPE rates include Falls Creek,Gilbertson Creek, Lawrence Creek, Old MillStream, two unnamed tributaries to the St. CroixRiver (99TC066 and 00TC059), and SpringCreek. Catch rates at these stations rangedfrom 237 to 747 brook trout per hour. However,most of these populations were dominated byyoung of the year and juvenile fish. Notableexceptions include Falls Creek, GilbertsonCreek, Lawrence Creek, Old Mill Stream, andWillow Creek which had numbers in catchablesize classes that would attract anglers, but canlikely support only a very limited or catch andrelease fishery. Two stations on Trout Brook(Dakota County) in the Cannon River watershedhad CPE rates ranging from 152 to 274 brooktrout per hour, and size classes which also wouldsupport a limited sport fishery.
Brown trout are native to Europe andcan tolerate warmer water temperatures andpoorer water quality than brook trout. Thisspecies was most abundant in Pine Creek(Dakota County) and Valley Branch(Washington County) where CPE rates rangedfrom 199 to 330 fish/hr with size classes insufficient numbers to support a sport fishery.Brown trout were also sampled in Eagle Creek(Scott County), which is the only western

7
Table 3. Catch data for TCMA streams, 1998-2000.
Common Name Scientific NameNo. survey
stations Total catch % Comp % Occur
LAMPREY PETROMYZONTIDAE
American brook lamprey Lampetra appendix 5 23 <0.1 4.0
BOWFIN AMIDAE
Bowfin Amia calva 3 3 <0.1 2.4
MOONEYE HIODONTIDAE
Mooneye Hiodon tergisus 1 1 <0.1 0.8
HERRING CLUPEIDAE
Gizzard shad Dorosoma cepedianum 3 29 <0.1 2.4
MINNOWS CYPRIDNIDAE
Central stoneroller Campostoma anomalum 21 873 1.7 16.8
Goldfish Carassius auratus 2 19 <0.1 1.6
Spotfin shiner Cyprinella spiloptera 29 2,975 5.9 23.2
Common carp Cyprinus carpio 33 792 1.6 26.4
Brassy minnow Hybognathus hankinsoni 25 303 0.6 20.0
Common shiner Luxilus comutus 14 295 0.6 11.2
Silver chub Macrhybopsis storeriana 1 1 <0.1 0.8
Pearl dace Margariscus margarita 6 223 0.4 4.8
Hornyhead chub Nocomis biguttatus 8 102 0.2 6.4
Golden shiner Notemigonus crysoleucas 13 113 0.2 10.4
Emerald shiner Notropis atherinoides 18 14,547 28.8 14.4
Bigmouth shiner Notropis dorsalis 31 498 1.0 24.8
Blackchin shiner Notropis heterodon 2 214 0.4 1.6
Blacknose shiner Notropis heterolepis 3 10 <0.1 2.4
Spottail shiner Notropis hudsonius 2 3 <0.1 1.6
Sand shiner Notropis stramineus 11 1,518 3.0 8.8
Mimic shiner Notropis volucellus 2 39 0.1 1.6
Northern redbelly dace Phoxinus eos 7 69 0.1 5.6
Bluntnose minnow Pimephales notatus 31 806 1.6 24.8
Fathead minnow Pimephales promelas 77 4,519 8.9 61.6

8
Table 3. Continued
Common Name Scientific Name No. SurveyStations
Total Catch % Comp % Occur
Blacknose dace Rhinichthys atratulus 36 1,583 3.1 28.8
Longnose dace Rhinichthys cataractae 7 120 0.2 5.6
Creek chub Semotilus atromaculatus 47 3,239 6.4 37.6
SUCKERS CATOSTOMIDAE
Quillback Carpiodes cyprinus 3 5 <0.1 2.4
White sucker Catostomus commersoni 53 3,398 6.7 42.4
Northern hog sucker Hypentelium nigricans 8 33 0.1 6.4
Smallmouth buffalo Ictiobus bubalus 2 26 0.1 1.6
Bigmouth buffalo Ictiobus cyprinellus 1 31 0.1 0.8
Silver redhorse Moxostoma anisurum 4 14 <0.1 3.2
Golden redhorse Moxostoma erythrurum 5 154 0.3 4.0
Shorthead redhorse Moxostoma macrolepidotum 8 140 0.3 6.4
BULLHEAD/CATFISH ICTALURIDAE
Black bullhead Ameiurus melas 43 281 0.6 34.4
Yellow bullhead Ameiurus natalis 16 77 0.2 12.8
Brown bullhead Ameiurus nebulosus 2 2 <0.1 1.6
Channel catfish Ictalurus punctatus 7 38 0.1 5.6
Stonecat Noturus flavus 5 30 0.1 4.0
Tadpole madtom Noturus gyrinus 8 65 0.1 6.4
PIKE ESOCIDAE
Northern pike Esox lucius 13 77 0.2 10.4
MUDMINNOW UMBRIDAE
Central mudminnow Umbra limi 66 3,059 6.1 52.8
TROUT SALMONIDAE
Rainbow trout Oncorhynchus mykiss 1 11 <0.1 0.8
Brown trout Salmo trutta 14 534 1.1 11.2
Brook trout Salvelinus fontinalis 16 1,341 2.7 12.8
Tiger trout S. trutta x S. fontinalis 1 1 <0.1 0.8

9
Table 3. Continued
Common Name Scientific Name No. SurveyStations
Total Catch % Comp % Occur
CODFISH GADIDAE
Burbot Lota lota 7 24 <0.1 5.6
SILVERSIDES ATHERINIDAE
Brook silverside Labidesthes sicculus 2 6 <0.1 1.6
STICKLEBACK GASTEROSTEIDAE
Brook stickleback Culaea inconstans 56 1,201 2.4 44.8
SCULPINS COTTIDAE
Mottled sculpin Cottus bairdi 1 1 <0.1 0.8
Slimy sculpin Cottus cognatus 1 56 0.1 0.8
TEMPERATE BASS PERCICHTHYIDAE
White bass Morone chrysops 2 2 <0.1 1.6
SUNFISH CENTRARCHIDAE
Rock bass Ambloplites rupestris 2 4 <0.1 1.6
Green sunfish Lepomis cyanellus 77 2,675 5.3 61.6
Pumpkinseed Lepomis gibbosus 41 432 0.9 32.8
Orangespotted sunfish Lepomis humilis 14 42 0.1 11.2
Bluegill Lepomis macrochirus 34 998 2.0 27.2
Sunfish (young of the year) Lepomis species 2 5 <0.1 1.6
Hybrid sunfish Lepomis sp. x Lepomis sp. 37 337 0.7 29.6
Smallmouth bass Micropterus dolomieu 6 27 0.1 4.8
Largemouth bass Micropterus salmoides 31 307 0.6 24.8
Black crappie Pomoxis nigromaculatus 21 66 0.1 16.8
PERCH PERCIDAE
Rainbow darter Etheostoma caeruleum 3 26 0.1 2.4
Iowa darter Etheostoma exile 25 290 0.6 20.0
Fantail darter Etheostoma flabellare 5 93 0.2 4.0
Johnny darter Etheostoma nigrum 49 1,285 2.5 39.2

10
Table 3. Continued
Common Name Scientific Name No. SurveyStations
Total Catch % Comp % Occur
Banded darter Etheostoma zonale 2 6 <0.1 1.6
Yellow perch Perca flavescens 24 100 0.2 19.2
Logperch Percina caprodes 8 28 0.1 6.4
Blackside darter Percina maculata 6 62 0.1 4.8
Slenderhead darter Percina phoxocephala 6 33 0.1 4.8
River darter Percina shumardi 1 10 <0.1 0.8
Walleye Stizostedion vitreum 9 30 0.1 7.2
DRUMS SCIAENIDAE
Freshwater drum Aplodinotus grunniens 6 13 <0.1 4.8
TOTALS 135 50,393 100.0

11
Table 4. Catch rate and lengths for TCMA Trout Stations, 1998-2000.
Station StreamBrook trout
No./CPELength
Range (mm)Brown trout
No./CPELength
Range (mm)Rainbow trout
No./CPELength
Range (mm)
99TC031* Assumption Creek
99TC015* Browns Creek 15/31 72-340
00TC030 Cannon River 1/1 250
99TC030* Eagle Creek 13/45 75-515
99TC056* Falls Creek 204/287 63-248
99TC053* Gilbertson Creek 120/385 62-240 2/6 269-273
99TC029* Harnack Creek
99TC019* Kennaley's Creek
00TC057* Lawrence Creek 252/747 45-260
99TC041* Old Mill Stream 91/400 70-219 1/4 280
99TC020* One Mile Creek
99TC020* One Mile Creek
00TC004* One Mile Creek trib
99TC017* Pine Creek 120/257 53-340
99TC035* Pine Creek 51/199 51-434
99TC057 St. Croix River trib 21/186 72-231
99TC062 St. Croix River trib 4/55 128-202
99TC066 St. Croix River trib 19/335 90-130
00TC059 St. Croix River trib 62/261 82-272
00TC053 Spring Creek 118/339 64-309
00TC054 Spring Creek 82/237 63-301
99TC014 Trout Brook 5-N/A 185-305
99TC018* Trout Brook 67/152 87-306 23/52 73-439
99TC033* Trout Brook 70/274 65-226
99TC034 Trout Brook trib 5/42 76-209
99TC025* Valley Branch 97/299 50-282
99TC027* Valley Branch 19/138 32-208 8/58 65-321
99TC026* Valley Branch trib 21/52 39-193 132/330 33-304 11/27 57-233
98RM001 Vermillion River 2/1 104-130
98RM003 Vermillion River 8/3 129-522
98RM004 Vermillion River 61/37 105-478
99TC044* Willow Brook 186/473 70-279
*Designated Trout Stream

12
SSS
S
B
B B
B
BBB
BB
B
BSB
BB
BBSS
S
B
A
AA
S
S
B¡¡¡ ¡¡
Ramsey
Anoka
Washington
Dakota
Scott
Carver
Chisago
Hennepin
Designated trout streams
Trout sampled, but not designated
Designated trout streams where no trout were sampled
#S
T N
0 6 Miles
¡
Sampled Trout Streams
Figure 2. Designated trout streams and streams where trout were sampled.
13
TCMA stream where the species is currentlyfound. Large adults comprised the small catch,but all appeared emaciated and only one youngof the year was sampled in the entire station.
Rainbow trout are native to the westernslope of the continental divide in North America.The only occurrence of this species was in atributary to Valley Branch (Washington County)where it was the least common of the threetrout species sampled.
The Minnesota Department of NaturalResources (MDNR) maintains a listing ofofficially designated trout waters. Thesedesignated streams are managed to provide arecreational fishery. However, due to theconnectivity of streams and historical stocking,many non-designated streams also contain troutpopulations. Brook trout were collected in sixnon-designated streams, including five streamsin the St. Croix River basin and one in theCannon River basin. Topographical maps showa possible 5-10 additional non-designatedstreams along the St. Croix that may hold smallpopulations, in southern Chisago and northernWashington counties. Brown trout were foundfor the first time in Trout Brook (WashingtonCounty) within the boundaries of Afton StatePark, and at three localities downstream of thedesignated trout water in the Vermillion River(Dakota County).
No trout were found in five designatedtrout streams in the western TCMA (Figure 2).MDNR Fisheries stream survey reports indicatethat the brook trout have not been sampled inOne Mile or Harnack creeks (Dakota County)since 1980. Brook trout were last reported fromKennaley's Creek in 1982, but the populationsurvived until 1990 when the stream wasdewatered during an expansion of the SenecaWastewater Treatment Plant. MDNR Fisheriesconducted a stream survey of AssumptionCreek (Carver County) in 1999 and also did notsample brook trout, but observed one adult in animpoundment upstream of Highway 212. Thereis no evidence that brook trout were indigenousto any part of the Minnesota River drainage(Underhill 1989), although MDNR stream filesfor Dakota County streams cite interviews with
landowners who reported stocking ponds andstreams on their property.
The historical occurrence of brook troutin TCMA streams can rarely be proven and isgenerally based on anecdotal accounts, butinclude: Golden Valley Creek (HennepinCounty), Vermillion River (Dakota County),Browns and Perro creeks (Washington County);and Trout Brook, Phalen Creek, and anunnamed tributary to the Mississippi Riverflowing through Town and Country Golf Course(Ramsey County). Brook trout reportedlyexisted in the headwaters of Browns Creek untilthe 1970s (landowner personal comm.) and intothe 1930s in the golf course stream (WilliamLarson - Grounds Superintendent personalcomm.). The trout population in Perro Creekwas eliminated soon after the state prison inStillwater constructed a dam on the stream tocreate a water supply for the facility (ScottNelson - Corrections Department personalcomm.).
Other Sport FishesEleven additional species which anglers
often pursue were sampled during the surveys.Although small warmwater streams rarelysupport large and harvestable populations of anygame species, these streams do play a vital rolein providing spawning habitat for adults andrearing habitat for young of the year andjuveniles. Overall, game fish were sampled at 74stations with the most diverse assemblagesoccurring in Clearwater Creek (Anoka County),Rice Creek (Ramsey County), and theVermillion River (Dakota County) at 7, 8, and 8species respectively.
Six species of the sunfish familycomprised the bulk of the game fish populationin the warmwater streams. Pumpkinseed,bluegill, and largemouth bass were the mostwidespread species occurring at 40, 33, and 31stations respectively.
The perch family included the yellowperch and walleye. Yellow perch werecollected at 24 stations with larger fish comingfrom a Gun Club Lake tributary (DakotaCounty) at 7.7 inches and Clearwater Creek

14
B"
CBB
BB
"
ABB
AB
B
C
A
B
B
$B
B
A
A
A
"CCB ""
"
A
A
C B
BA A
BC B
C
B
AA
AB
C
A
CB
C
AB
"
"
"
"CB
"C
"
A
" "A
"
B
Ramsey
Anoka
Washington
Dakota
Chisago
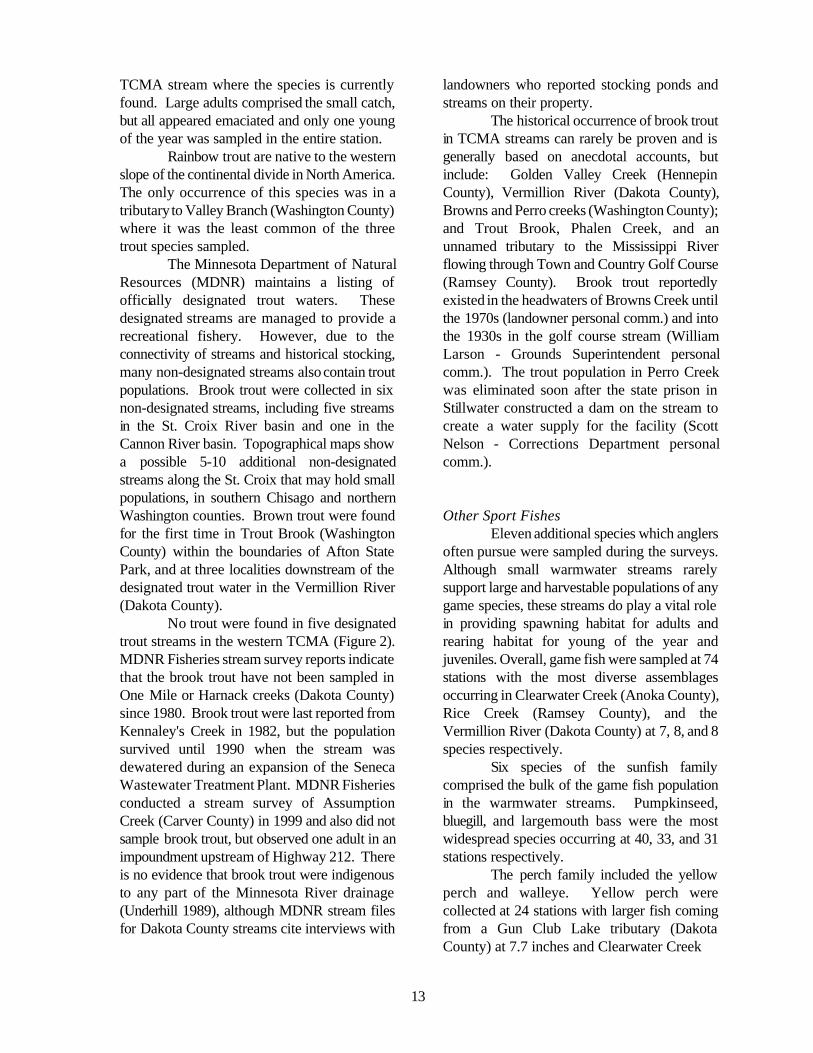
Figure 3. Anoka, Ramsey, Washington, and Dakota counties warmwater stream IBI scores.
0 10 Miles
N
%
$
#
%U
B
#S
100 - 65 Excellent
64 - 50 Good
49 - 30 Fair
29 - 20 Poor
19 - 0 Very Poor
ns - No Score
Warmwater IBI Scores
15
(Anoka County) at 6.7 inches. Walleye weresampled at 9 stations with the largest fishcoming from the Vermillion River (DakotaCounty) at 19.4 inches.
Several other game fish species werecaptured. Channel catfish were sampled at 7stations with the largest individuals in BevensCreek (Carver County), Vermillion River(Dakota County), and Sand Creek (ScottCounty) at 17.1, 17.8, and 27.7 inchesrespectively. Northern pike were present at 13stations and the largest fish came from ChubCreek (Dakota County) at 28.8 inches. Whitebass were found at two stations in Sand Creek(Scott County) where one juvenile was collectedat each location.
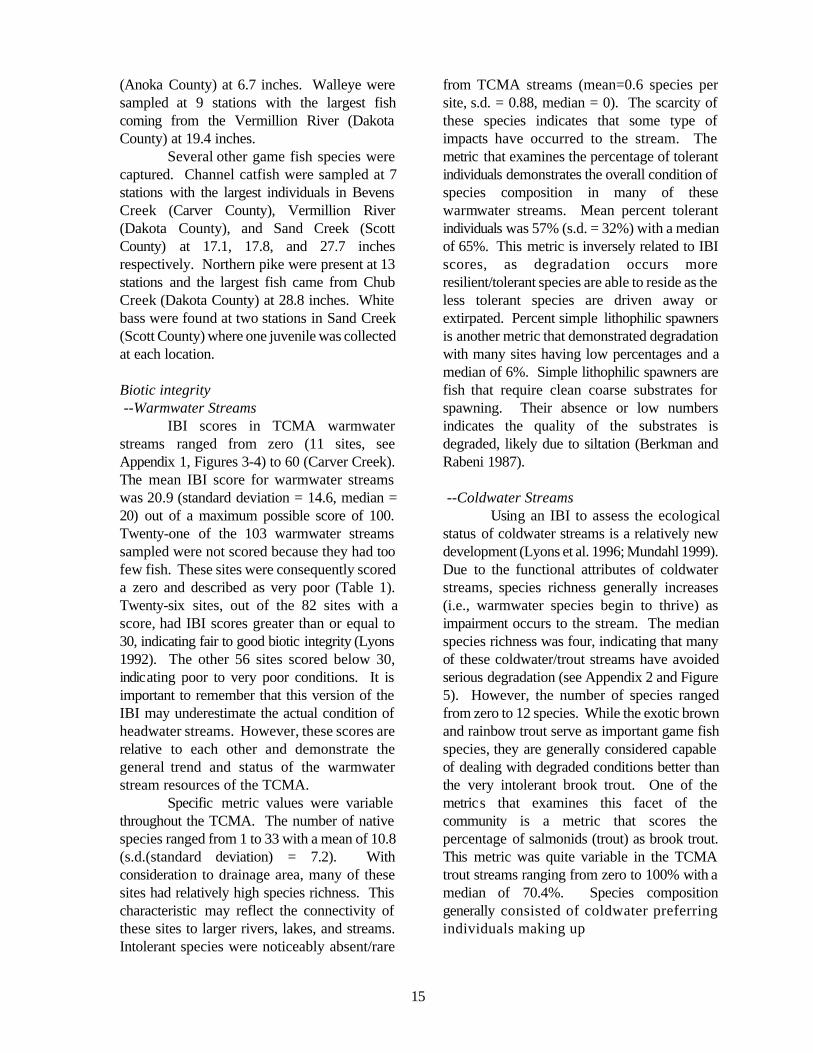
Biotic integrity --Warmwater Streams
IBI scores in TCMA warmwaterstreams ranged from zero (11 sites, seeAppendix 1, Figures 3-4) to 60 (Carver Creek).The mean IBI score for warmwater streamswas 20.9 (standard deviation = 14.6, median =20) out of a maximum possible score of 100.Twenty-one of the 103 warmwater streamssampled were not scored because they had toofew fish. These sites were consequently scoreda zero and described as very poor (Table 1).Twenty-six sites, out of the 82 sites with ascore, had IBI scores greater than or equal to30, indicating fair to good biotic integrity (Lyons1992). The other 56 sites scored below 30,indicating poor to very poor conditions. It isimportant to remember that this version of theIBI may underestimate the actual condition ofheadwater streams. However, these scores arerelative to each other and demonstrate thegeneral trend and status of the warmwaterstream resources of the TCMA.
Specific metric values were variablethroughout the TCMA. The number of nativespecies ranged from 1 to 33 with a mean of 10.8(s.d.(standard deviation) = 7.2). Withconsideration to drainage area, many of thesesites had relatively high species richness. Thischaracteristic may reflect the connectivity ofthese sites to larger rivers, lakes, and streams.Intolerant species were noticeably absent/rare
from TCMA streams (mean=0.6 species persite, s.d. = 0.88, median = 0). The scarcity ofthese species indicates that some type ofimpacts have occurred to the stream. Themetric that examines the percentage of tolerantindividuals demonstrates the overall condition ofspecies composition in many of thesewarmwater streams. Mean percent tolerantindividuals was 57% (s.d. = 32%) with a medianof 65%. This metric is inversely related to IBIscores, as degradation occurs moreresilient/tolerant species are able to reside as theless tolerant species are driven away orextirpated. Percent simple lithophilic spawnersis another metric that demonstrated degradationwith many sites having low percentages and amedian of 6%. Simple lithophilic spawners arefish that require clean coarse substrates forspawning. Their absence or low numbersindicates the quality of the substrates isdegraded, likely due to siltation (Berkman andRabeni 1987).
--Coldwater StreamsUsing an IBI to assess the ecological
status of coldwater streams is a relatively newdevelopment (Lyons et al. 1996; Mundahl 1999).Due to the functional attributes of coldwaterstreams, species richness generally increases(i.e., warmwater species begin to thrive) asimpairment occurs to the stream. The medianspecies richness was four, indicating that manyof these coldwater/trout streams have avoidedserious degradation (see Appendix 2 and Figure5). However, the number of species rangedfrom zero to 12 species. While the exotic brownand rainbow trout serve as important game fishspecies, they are generally considered capableof dealing with degraded conditions better thanthe very intolerant brook trout. One of themetrics that examines this facet of thecommunity is a metric that scores thepercentage of salmonids (trout) as brook trout.This metric was quite variable in the TCMAtrout streams ranging from zero to 100% with amedian of 70.4%. Species compositiongenerally consisted of coldwater preferringindividuals making up

16
CC
B
B
B
"
"
B
B
C
C
$ A
BB
B
"
CCB
"
B
"
"A"
B
"
B
A
A
B
C
$
Scott
Carver
Hennepin
Figure 4. Hennepin, Carver, and Scott counties warmwater stream IBI scores.
0 10 Miles
N
%
$
#
%U
B
#S
100 - 65 Excellent
64 - 50 Good
49 - 30 Fair
29 - 20 Poor
19 - 0 Very Poor
ns - No Score
Warmwater IBI Scores

17
A
U
$ %
#U
$$$
$
#
U
%A%
%
%
%
%A
A
A
A
A
%%
%
Ramsey
Anoka
Washington
Dakota
Scott
Carver
Chisago
Hennepin
0 10 Miles
N
%
$
#
%U
$T
#S
105 - 120 Excellent
70 - 100 Good
35 - 65 Fair
10 - 30 Poor
0 - 5 Very Poor
ns - No Score
Coldwater IBI Scores
Figure 5. Coldwater stream IBI scores.

18
nearly 75% of the community with warmwaterindividuals being less abundant or absent inmany streams. IBI scores ranged from 20 atAssumption Creek to a high of 115 at TroutBrook, Pine Creek, Gilbertson Creek, and FallsCreek (Figure 5). The average IBI score was87.4 while the median score was 103. Fifteenof the 20 streams scored were rated “good” to“excellent.” Seven streams had no or too fewfish to evaluate with an IBI (<25 individualcollected). Three streams rated as “poor”Browns Creek, One Mile Creek, andAssumption Creek. Overall, coldwater/troutstreams in the TCMA area were in relativelygood condition compared to their warmwatercounterparts. This may largely be attributed totheir protection associated with the highlyprotected St. Croix River and their designationas “trout streams” by the MinnesotaDepartment of Natural Resources.
Rare and Unusual Occurrences Reported inthe TCMA
Natural Heritage Program EORs(Element Occurrence Records) of TrackedFishes Reported in the TCMA and Rare,Intolerant, Exotic, and Range ExtensionsReported in the TCMA (Appendix 3 and 4)were compiled to serve as a guide and checklistfor biologists and resource managers to identifyand rank sites for future surveys and restorationefforts. It is also important that surveyspecimens are deposited in the Bell Museumfish collection for verification, particularly ifthese species are unusual, rare, or taxonomicallydifficult to identify.
The Minnesota Natural HeritageProgram tracks element occurrence records(EORs) for 1 threatened, 20 special concern,and 4 delisted fish species. Fourteen of thesespecies have been reported from the sevencounty TCMA (Appendix 3). Most have beenreported recently in area lakes and streams.However, the skipjack herring and pallid shinerhave been absent since the 1920s. The pugnoseshiner and least darter, which are bothextremely intolerant species, have not beenreported from eight localities for the shiner since
1926 - 1948 and two localities for the dartersince 1931 - 1935.
Thirty-eight additional species of notehave been listed in Appendix 4. These includespecies rarely reported in the TCMA, those thatare extremely intolerant and serve asenvironmental indicators, exotics, or those thatrepresent range extensions. Again, mostspecies have been reported recently at leastonce in the TCMA. Exceptions include: silveryminnow (1899), channel shiner (1947), and lakewhitefish (1967).
No endangered, threatened, or specialconcern species were sampled during the study.However, the American brook lamprey wasdelisted from special concern status in 1996.This non-parasitic species is frequently found introut streams. Lampreys were collected at fivestations including new localities in a MinnesotaRiver tributary (Scott County), AssumptionCreek (Carver County), and Trout Brook(Dakota County). The first two localities aresignificant because this lamprey had only beenreported once from the Minnesota Riverdrainage since the 1940s. Additional collectionswere made at two stations near historicallocalities in Valley Branch (Washington County),which is one of two streams the species inhabitsin the entire St. Croix River drainage.
Ten species collected during the surveysare rarely reported in the TCMA (Figures 6 and7). Most are on the periphery of their range inMinnesota and may have never been common.However, some are intolerant or indicatorspecies, which are the first to decline ordisappear when stream habitat and water qualitydegrade.
The silver chub was collected at onestation in the Cannon River and is more commonsouth of the Twin Cities in the Mississippi River,where it generally inhabits deep water during theday and is difficult to sample. However, basedon personal experience, the species appears toseek out shallower depths at night when seininghas been successful, while sampling the sameareas during the day has not.

19
U
%U
$$
A
A
#
#
#
Ramsey
Anoka
Washington
Dakota
Scott
Carver
Chisago
Hennepin
0 10 Miles
##S$
Blacknose Shiner
Blackchin Shiner
Spottail Shiner
Mot tled Sculpin
Slimy Sculpin
Rare Occurrences
N
%U%U
Figure 6. Metro stream survey locations where blacknose shiner, blackchin shiner, spottail shiner, mottled sculpin, and slimy sculpin were found.

20
UU
%U
%U
%U
B
$
AAAAA
A#
##
#
#
Ramsey
Anoka
Washington
Dakota
Scott
Carver
Chisago
Hennepin
0 7 Miles
##S$
American brook lamprey
Pearl Dace
Silver Chub
River Dart er
Rainbow Darter
Banded Darter
Rare Occurrences
N%U%U
Figure 7. Metro stream survey locations where American brook lamprey, pearl dace, silver chub, river darter, rainbow darter, and banded darter were found.
B

21
Pearl dace were collected at fivestations in the Vermillion River watershed andone new locality in the Cannon watershed, aditched tributary to Chub Creek (DakotaCounty). This species is often common in theUpper Mississippi and St. Croix river basinsnorth of the Twin Cities, but has a veryinfrequent distribution in southeasternMinnesota.
Blackchin shiners were sampled at twostations. A single specimen was collected fromthe outlet of Square Lake (Washington County)and an incredible 213 specimens fromMinnehaha Creek, a few miles downstream ofLake Minnetonka. This is an extremelyintolerant species which inhabits very clear lakesand streams with dense beds of submergedvegetation. This species and its preferredhabitat are much more prevalent in central andnorthern Minnesota. Blacknose shiners werecollected at three stations in Anoka County, atClearwater Creek, Mahoney Brook, and SeelyeBrook. This species is frequently associatedwith and similar to the blackchin shiner intolerance, habitat preference, and distribution.
Spottail shiners were collected at twostations in Rice Creek (Anoka County). Thisspecies prefers clear lakes and streams, but hasa wider distribution and is slightly more tolerantthan the blackchin and blacknose shiners.
The mottled sculpin was collected atone station in Cedar Creek (Anoka County)which is a new locality for this intolerant speciesoften associated with trout and coldwaterstreams. The slimy sculpin was collected at onestation in Valley Branch (Washington County).This population is isolated from others innorthern and southeastern Minnesota. Thisspecies is almost always associated with trout,is more intolerant, and requires coldertemperatures than the mottled sculpin.
Rainbow darters were collected at twostations in the St. Croix drainage from Gilbertsonand Spring creeks (Washington County), and asingle specimen from Chub Creek (DakotaCounty) in the Cannon River watershed. This isan intolerant species which appears to beexhibiting a serious decline in the Cannon Riverwatershed. It was formerly found in the
Cannon River and Belle Creek near Welch(Goodhue County). However, repeated fish killsin the Cannon River, from the operation andmaintenance of the Byllesby Dam, anddegrading conditions in Belle Creek may haveeliminated rainbow darters from the lowerportion of the watershed where it has not beenreported in several years. Upstream of Byllesbyreservoir, collections of the species have beenrestricted to Prairie (Goodhue County) and Chubcreeks (Dakota County).
Banded darters were collected at onlytwo stations in the Cannon River (Dakota andGoodhue counties). This species is at theperiphery of its range in the Cannon River andis more common in other southeasternMinnesota streams such as the Root, UpperIowa, and Zumbro rivers. There is also anisolated population in the Minnesota drainagewhere it inhabits the mainstem and lowerreaches of larger tributaries from approximatelySt. Peter to Appleton.
The river darter was collected at onestation in the Vermillion River (Dakota County).Like the silver chub, this species prefers largerivers, is more common south of the Twin Cites,and personal observations indicate it is morevulnerable to nocturnal than diurnal samplingefforts.
With the exception of brown trout,which is managed as a game species, andcommon carp, very few exotics were sampledin the TCMA. Goldfish, which are usually theresult of aquarium releases, were found at twostations: Phalen Creek and a Willow Creektributary (Ramsey County). Rainbow trout,another game species, were collected at onestation in a Valley Branch tributary (WashingtonCounty).
The TCMA surveys collected one rangeextension for channel catfish in Rice Creek(Ramsey County). This species was historicallyabsent from the Upper Mississippi Riverdrainage (St. Anthony Falls in Minneapolis toLake Itasca). However, around 1960navigational locks were added to the dams at St.Anthony Falls thus permitting fish passage fromthe lower Mississippi River to the dam at CoonRapids. Additionally, MDNR stocking efforts in

22
the Upper Mississippi River provided channelcatfish above the Coon Rapids dam. Sincethese two occurrences, channel catfish havebeen documented in the mainstem of theMississippi River and its larger tributaries up toBrainerd.
Recommendations
Stream surveys should continue in theTCMA to monitor changes in the fishcommunity, and voucher specimens should bedeposited in the fish collection at the BellMuseum. Through cooperation of the MDNR,University of Minnesota, and other interestedparties, all permanent streams should beinvestigated on a recurrent basis with variablesurvey intervals determined by streammanagement plans and impact assessment. Aselection of representative sites, that account forthe geographical and hydrological diversity ofthe TCMA, should be surveyed on a morefrequent basis to provide timely indicators ofenvironmental change. Through appropriateenvironmental review and application of waterand land use regulations, riparian zones andhistorical drainage patterns should be protectedand restored.
Dams, water control structures, androad culverts can impede or prevent theupstream movement of fish which can isolatepopulations and block access to spawning andrearing habitats. Proposals for new or modifiedstructures should be reviewed to mitigate anypotentially detrimental effects of roadmaintenance and water management practices.Opportunities for the removal of existingunnatural barriers must be scheduled andprioritized in order to restore the connectivity ofimportant aquatic habitat components in streamsof the TCMA.
References
Bailey, P.A., J.W. Enblom, S.R. Hanson, P.A.Renard, and K. Schmidt. 1993. A fishcommunity analysis of the MinnesotaRiver Basin. Minnesota Department ofNatural Resources, Division ofEcological Services, St. Paul.
Berkman, H.E., and C.F. Rabeni. 1987. Effectof siltation on stream fish communities.Environmental Biology of Fishes18:285-294.
Booth, D.B., and L.E. Reinelt. 1993.Consequences of urbanization onaquatic systems–measured effects,degradation thresholds, and correctivestrategies. Pages 545-550 inProceedings Watershed ’93, a NationalC o n f e r e n c e o n W a t e r s h e dManagement, Alexandria, VA.
Eddy, S., and J.C. Underhill. 1976. Northernfishes. Second Printing. University ofMinnesota Press. Minneapolis.
Fausch, K.D., J.R. Karr, P.R. Yant. 1984.Regional application of an index ofbiotic integrity based on stream fishcommunities. Transactions of theAmerican Fisheries Society 113:39-55.
Fausch, K.D. 1986. Development and use ofthe index of biotic integrity to monitorfish communities in the St. CroixNational Scenic Riverway. ColoradoState University, Department of Fisheryand Wildlife Biology, Ft. Collins.
Karr, J.R. 1981. Assessment of biotic integrityusing fish communities. Fisheries6:21-27.
Karr, J.R., and E.W. Chu. 1999. Restoring lifein running waters: better biologicalmonitoring. Island Press, Washington,D.C.
Klein, R.D. 1979. Urbanization and streamquality impairment. Water ResourcesBulletin 15:948-963.
Lyons, J. 1992. Using the index of bioticintegr i ty ( IBI) to measureenvironmental quality in warmwaterstreams of Wisconsin. USDA, GeneralTechnical Report NC-149, St. Paul.

23
Lyons, J., L. Wang, and T.D. Simonson. 1996.Development and validation of an indexof biotic integrity for coldwater streamsin Wisconsin. North American Journalof Fisheries Management 16:241-256.
Mundahl, N.D., and T.P. Simon. 1999.Development and application of anindex of biotic integrity for coldwaterstreams of the upper MidwesternUnited States. Pages 383-415 in T.P.Simon, ed., Assessing the sustainabilityand biological integrity of waterresources using fish communities. CRCPress, Washington, D.C.
Niemela, S., E. Pearson, T.P. Simon, R.M.Goldstein, and P.A. Bailey. 1998.Development of index of biotic integrityexpectations for the Lake Agassiz plainecoregion. Report Number: EPA905-R-96-005. US-EPA, Chicago, IL.
Niemela, S., and M. Feist. 2000. Index ofbiotic integrity (IBI) guidance forcoolwater rivers and streams of the St.Croix River basin in Minnesota.Minnesota Pollution Control AgencyBiological Monitoring Program, St.Paul.
Ohio Environmental Protection Agency. 1987.Biological criteria for the protection ofaquatic life: Volume II. Users manualfor biological field assessment of Ohiosurface waters. Division of WaterQuality Monitoring and Assessment,Surface Water Section, Columbus.
Steedman, R.J. 1988. Modification andassessment of an index of bioticintegrity to quantify stream quality insouthern Ontario. Canadian Journal ofFisheries and Aquatic Sciences 45:492-501.
Talmage, P.J., K.E. Lee, R.M. Goldstein, J.P.Anderson, and J.D. Fallon. 1999.Water quality, physical habitat, and fish-community composition in streams inthe Twin Cities Metropolitan Area,Minnesota 1997-98. U.S. GeologicalS u r v e y , W a t e r - R e s o u r c e sInvestigations Report 99-4247, St. Paul.
Underhill, J.C. 1989. The distribution ofMinnesota fishes and late Pleistoceneglaciation. Journal of the MinnesotaAcademy of Science 55: 32-37.

24
Appendix 1. Warmwater IBI summaries and scores.
Station Stream Name Totalnumber of
nativespecies
Numberof
darterspecies
Numberof
suckerspecies
Numberof
sunfishspecies
Numberof
intolerantspecies
Percenttolerantspecies
Percentomnivores
Percentinsectivores
Percent topcarnivores
Percentsimple
lithophils
IBIScore
98RM001 Vermillion River 17 2 1 1 1 80.3% 39.3% 10.2% 0.2% 30.9% 17 98RM002 Vermillion River trib 5 1 0 0 1 5.2% 0.0% 75.3% 0.0% 0.0% 30
98RM003 Vermillion River 17 2 1 2 1 89.4% 33.4% 6.5% 1.0% 34.8% 22 98RM004 Vermillion River 13 2 1 1 1 79.4% 45.9% 16.0% 7.5% 47.5% 7 98RM005 Vermillion River trib 14 1 1 2 1 51.8% 34.4% 44.1% 0.0% 33.3% 15
99TC001 Fish Creek 5 0 0 1 0 89.0% 84.3% 1.2% 0.0% 0.0% 0 99TC003 Willow Creek 9 1 1 2 1 70.1% 1.5% 8.2% 0.7% 1.5% 35
99TC005 Phalen Creek 2 0 0 0 0 100.0% 100.0% 0.0% 0.0% 0.0% no score99TC006 Elm Creek 14 1 1 2 0 75.2% 2.9% 5.1% 2.9% 8.8% 20 99TC007 Rush Creek 11 1 1 2 0 86.2% 0.7% 5.8% 1.4% 6.9% 20
99TC008 Diamond Creek 4 0 0 1 0 89.0% 7.9% 11.0% 0.0% 0.0% 10 99TC009 Battle Creek 13 0 1 4 0 60.0% 57.3% 25.8% 0.4% 25.4% 5
99TC010 Battle Creek 5 0 1 1 0 95.6% 93.3% 0.0% 0.0% 57.8% 0 99TC011 Valley Creek 7 0 0 3 0 15.4% 0.0% 53.8% 15.4% 0.0% no score99TC012 Valley Creek 7 0 0 2 0 77.6% 36.8% 18.4% 0.0% 30.3% 15
99TC016 Vermillion River (SB) 15 2 1 1 1 84.4% 62.8% 3.5% 0.0% 60.9% 7 99TC022 Porter Creek 14 1 1 2 0 76.0% 20.5% 12.3% 0.7% 22.6% 15
99TC023 Porter Creek 10 1 1 2 0 92.8% 16.5% 5.1% 0.4% 5.9% 17 99TC024 Pickerel Lake trib 7 0 0 3 0 32.8% 10.3% 1.7% 0.0% 0.0% 20 99TC028 Black Dog Creek 4 0 0 1 0 85.7% 42.9% 0.0% 14.3% 0.0% no score
99TC036 Mississippi River trib 6 0 1 1 0 90.2% 87.8% 7.3% 2.4% 2.4% 0 99TC037 Tanners Lake trib 7 0 0 2 0 89.7% 40.8% 7.4% 0.0% 0.0% 5
99TC038 Vermillion River 30 3 4 6 4 3.8% 3.0% 94.3% 0.5% 78.8% 55 99TC039 Vermillion River 16 2 1 2 1 74.4% 34.4% 4.9% 0.0% 40.1% 17 99TC040 Vermillion River 19 2 1 3 1 85.6% 42.9% 7.8% 0.3% 32.2% 12
99TC042 Silver Creek 4 0 0 2 0 66.7% 0.0% 66.7% 16.7% 0.0% no score99TC043 Perro Creek 1 0 0 1 0 100.0% 0.0% 100.0% 0.0% 0.0% no score
99TC045 Mississippi River trib 15 2 1 3 1 61.8% 50.9% 30.2% 0.0% 13.7% 31 99TC046 Mississippi River trib no fish99TC047 County Ditch 17 trib(A) 10 0 0 3 0 27.9% 14.7% 30.9% 0.0% 2.0% 30
99TC048 County Ditch 17 trib(B) 7 0 0 2 0 36.2% 13.5% 0.6% 0.0% 3.7% 25 99TC049 Rice Creek 20 1 1 4 1 33.5% 23.2% 21.2% 1.5% 1.1% 27
99TC050 Rice Creek 16 1 1 4 0 37.3% 26.8% 47.8% 0.6% 42.6% 15 Appendix 1. Continued

25
99TC051 Rice Creek trib 16 1 1 3 0 66.4% 58.5% 14.6% 0.0% 6.2% 30 99TC052 Rice Creek 33 2 2 8 1 33.5% 9.0% 48.0% 1.0% 0.6% 42
99TC054 Clearwater Creek 18 1 1 4 1 25.5% 6.6% 1.6% 2.5% 2.2% 30 99TC055 Hardwood Creek 5 1 1 0 0 56.7% 16.7% 0.0% 6.7% 16.7% no score99TC058 O'Conners Lake trib 1 0 0 0 0 0.0% 0.0% 0.0% 100.0% 0.0% no score
99TC060 Lake Jones outlet 7 0 0 4 0 93.2% 12.1% 0.4% 2.8% 0.0% 20 99TC061 Vadnais Lake trib 4 0 0 0 0 96.5% 20.0% 2.6% 0.9% 0.0% 7
99TC063 Square Lake outlet 9 1 0 2 1 45.2% 27.0% 34.4% 0.0% 0.0% 15 99TC064 Big Carnelian Lake trib 3 0 1 0 0 42.9% 14.3% 0.0% 0.0% 14.3% no score99TC065 St. Croix River trib no fish
99TC067 Little Lake Johanna trib 2 0 0 0 0 90.7% 90.7% 9.3% 0.0% 0.0% 0 99TC068 Gervais Lake trib 9 0 1 4 0 64.6% 2.9% 3.7% 8.6% 0.2% 20
99TC069 Willow Creek trib 9 0 1 2 0 89.2% 70.3% 0.9% 8.1% 2.7% 0 99TC070 Eagle Point Lake trib 7 1 0 2 1 64.7% 45.2% 0.0% 0.0% 0.0% 20 99TC071 Mississippi River trib 10 0 1 1 0 94.0% 91.0% 5.1% 0.0% 84.2% 2
99TC072 Mississippi River trib no fish99TC073 Mississippi River trib no fish
99TC074 McCarron's Lake trib 3 0 0 1 0 96.2% 65.4% 3.8% 0.0% 0.0% no score99TC075 Sarita Creek 1 0 0 0 0 100.0% 100.0% 0.0% 0.0% 0.0% 0 99TC076 Long Lake trib 13 1 1 3 0 56.0% 6.6% 2.3% 1.7% 6.2% 20
99TC077 Mississippi River trib 1 0 0 0 0 100.0% 0.0% 100.0% 0.0% 0.0% no score99TC078 Mississippi River trib 7 0 0 3 0 7.8% 5.6% 90.7% 0.0% 87.7% 25
99TC079 Mississippi River trib 1 0 0 0 0 100.0% 100.0% 0.0% 0.0% 0.0% 10 99TC080 Browns Creek trib 5 0 0 1 0 70.5% 28.1% 27.3% 0.0% 0.0% 25 99TC081 Wakefield Lake trib 3 0 0 2 0 28.6% 0.0% 57.1% 0.0% 0.0% no score
99TC082 Lake Elmo outlet 11 1 1 3 1 51.1% 37.8% 4.4% 11.1% 8.9% 0 99TO002 Fish Creek 4 0 0 1 0 69.6% 0.0% 10.9% 0.0% 0.0% 0
00TC001 Chub Creek 29 4 3 1 3 41.2% 21.6% 43.3% 1.0% 22.7% 37 00TC003 Black Dog Lake trib 2 7 1 0 1 0 81.8% 74.3% 14.3% 0.3% 0.0% 30 00TC006 Credit River 23 2 4 3 1 31.9% 12.1% 50.0% 0.7% 51.3% 42
00TC011 Nine Mile Creek (SF) 9 1 0 3 0 45.8% 0.0% 10.2% 5.1% 0.0% 10 00TC012 Nine Mile Creek 10 1 1 1 0 90.0% 13.9% 8.3% 0.0% 14.6% 12
00TC013 Purgatory Creek 10 2 0 1 0 10.1% 1.8% 80.9% 0.0% 73.0% 27 00TC014 Chaska Creek 15 2 1 2 1 52.4% 15.8% 46.5% 0.1% 62.6% 25 00TC015 Carver Creek 30 5 5 3 3 14.7% 6.8% 73.4% 2.8% 77.4% 60
00TC016 Minnesota River trib 5 0 0 0 0 40.9% 4.5% 59.1% 0.0% 54.5% no scoreAppendix 1. Continued
00TC017 Brewery Creek 8 1 1 0 0 76.7% 8.0% 6.9% 0.0% 6.4% 15

26
00TC018 Robert Creek 7 0 1 0 0 72.4% 0.4% 3.4% 0.0% 58.7% 15
00TC019 Riley Creek 5 0 0 0 0 91.3% 88.5% 0.0% 7.7% 1.0% 0 00TC021 Sand Creek 28 3 4 4 1 27.3% 21.2% 51.1% 2.6% 33.7% 45
00TC023 Bluff Creek 4 1 0 0 1 27.6% 27.6% 25.2% 0.0% 0.0% 20 00TC024 Bluff Creek 2 0 0 0 0 7.7% 7.7% 92.3% 0.0% 0.0% 20 00TC025 Chaska Creek 5 1 0 0 0 97.6% 0.0% 2.1% 0.0% 54.9% 10
00TC026 Bevens Creek 26 2 6 3 1 29.2% 4.3% 31.4% 1.2% 45.0% 42 00TC029 Cannon River 16 4 3 2 3 2.2% 0.1% 94.5% 0.8% 95.7% 47
00TC030 Cannon River 19 3 4 1 3 0.2% 0.2% 96.1% 0.3% 95.4% 45 00TC031 Cannon River 16 1 4 1 1 27.8% 25.6% 43.7% 0.2% 29.4% 20 00TC032 Chub Creek (NB) 10 1 1 1 0 73.3% 41.1% 5.0% 0.0% 32.2% 10 00TC034 Chub Creek trib 10 1 1 1 0 83.3% 54.2% 5.6% 0.0% 59.7% 30
00TC036 Chub Creek 15 2 2 1 0 41.2% 11.9% 39.1% 0.0% 23.9% 27 00TC039 Sand Creek 11 1 1 1 0 86.9% 14.4% 6.0% 0.0% 14.8% 15
00TC040 Sand Creek 14 1 0 3 1 8.2% 4.6% 87.0% 1.2% 85.3% 30 00TC042 Long Meadow L. outlet 19 1 0 5 1 13.2% 10.7% 59.9% 17.5% 28.4% 35 00TC044 Long Meadow Lake trib no fish
00TC045 Long Meadow Lake trib 11 1 0 2 1 30.2% 12.0% 16.1% 12.4% 0.0% 35 00TC048 Sunrise River (WB) 16 2 0 4 1 47.6% 5.1% 23.6% 2.3% 0.0% 32
00TC051 Minnehaha Creek 18 1 1 3 1 69.6% 58.2% 28.0% 0.0% 13.5% 10 00TC052 Minnehaha Creek 16 2 1 3 1 9.7% 9.5% 80.7% 5.7% 27.2% 32 00TC055 St. Croix River trib no fish
00TC067 Bass Creek 4 0 0 1 0 85.4% 82.2% 14.6% 0.0% 0.0% 0 00TC068 Cedar Creek 13 1 1 2 1 12.8% 6.1% 31.8% 0.6% 29.1% 30
00TC069 Mahoney Brook 13 2 1 0 2 26.2% 1.6% 64.3% 0.0% 66.7% 45 00TC070 Ford Brook 6 0 0 0 0 87.5% 0.0% 9.4% 0.0% 6.3% no score00TC071 Seelye Brook 18 2 1 2 4 37.6% 15.5% 23.2% 1.2% 30.9% 32
00TC072 Bassett Creek 5 0 0 1 0 28.6% 28.6% 33.3% 14.3% 0.0% no score00TC073 Minnesota River trib 2 1 0 0 1 0.0% 0.0% 96.3% 0.0% 0.0% no score
00TC074 Mattson Brook 5 0 0 1 0 81.6% 26.3% 18.4% 0.0% 0.0% 0 00TC075 Minnesota River trib 12 1 0 3 2 28.4% 0.0% 4.3% 9.5% 1.7% 25 00TC076 Blue Lake outlet 16 1 1 3 1 5.1% 4.7% 92.2% 0.2% 67.7% 55
00TC077 Gun Club Lake trib 9 0 0 4 0 86.6% 76.0% 2.4% 0.4% 0.0% 10

27
Appendix 2. Coldwater IBI summaries and scores.
Station Stream Name Totalnumber
ofspecies
Numberof
coldwaterspecies
Numberof
minnowspecies
Numberof
benthicspecies
Numberof
tolerantspecies
Percentsalmonids
asbrook trout
Percentintolerant
individuals
Percentcoldwaterindividuals
Percentwhite
suckers
Percent top
carnivores
Numberof
coldwaterindividuals
Numberof
warmwaterindividuals
IBIScore
99TC014 Trout Brook 4 2 0 2 1 0.0% 11.1% 77.8% 0.2% 11.1% 7 2 99TC015* Browns Creek 11 2 1 2 5 0.0% 5.1% 5.4% 0.0% 5.1% 16 278 30
99TC017* Pine Creek 3 1 0 1 1 0.0% 97.6% 97.6% 0.0% 97.6% 120 3 100 99TC018* Trout Brook 6 4 0 0 2 74.4% 89.1% 95.0% 0.0% 89.1% 96 5 105 99TC019* Kennaley's Creek 5 1 0 1 2 0.0% 2.6% 2.6% 0.0% 56.4% 1 38 50
99TC020* One Mile Creek 12 1 1 2 6 0.0% 0.0% 16.4% 0.0% 0.0% 45 229 25 99TC025* Valley Branch 4 3 0 0 0 0.0% 98.0% 99.0% 0.0% 98.0% 99 1 100
99TC026* Valley Branch trib 5 5 0 1 0 12.8% 74.2% 100.0% 0.0% 74.2% 221 0 100 99TC027* Valley Branch 4 2 0 0 0 70.4% 93.1% 93.1% 0.0% 93.1% 27 2 95 99TC029* Harnack Creek 2 1 0 0 1 0.0% 0.0% 86.2% 0.0% 0.0% 75 12 70
99TC030* Eagle Creek 5 2 0 1 2 0.0% 36.1% 86.1% 0.2% 36.1% 31 5 52 99TC031* Assumption Creek 11 1 0 3 5 0.0% 21.6% 16.5% 0.6% 21.6% 16 81 20
99TC033* Trout Brook 2 2 0 0 0 100.0% 92.1% 100.0% 0.0% 92.1% 76 0 115 99TC034 Trout Brook trib 2 2 0 0 0 100.0% 35.7% 100.0% 0.0% 35.7% 14 0 99TC035* Pine Creek 2 2 0 0 0 0.0% 81.0% 100.0% 0.0% 81.0% 63 0 115
99TC041* Old Mill Stream 3 2 0 0 1 98.9% 98.9% 98.9% 0.0% 98.9% 92 1 110 99TC044* Willow Brook 1 1 0 0 0 100.0% 100.0% 100.0% 0.0% 100.0% 186 0 110
99TC053* Gilbertson Creek 4 3 0 1 0 98.4% 99.2% 99.2% 0.0% 99.2% 127 1 115 99TC056* Falls Creek 2 2 0 0 0 100.0% 100.0% 100.0% 0.0% 100.0% 207 0 115 99TC057 St. Croix River trib 1 1 0 0 0 100.0% 100.0% 100.0% 0.0% 100.0% 21 0
99TC059 St. Croix River trib 0 0 0 0 0 0.0% 0.0% 0.0% 0.0% 0.0% 0 0 99TC062 St. Croix River trib 2 2 0 0 0 100.0% 100.0% 100.0% 0.0% 100.0% 5 0
99TC066 St. Croix River trib 1 1 0 0 0 100.0% 100.0% 100.0% 0.0% 100.0% 19 0 00TC004* One Mile Creek trib 1 0 0 0 0 0 0.0% 0.0% 0.0% 0.0% 0.0% 0 0 00TC053 Spring Creek 1 4 3 0 1 0 100.0% 80.0% 84.0% 0.0% 80.0% 126 24 105 00TC054 Spring Creek 2 3 3 0 0 0 100.0% 35.7% 100.0% 0.0% 35.7% 238 0 105
00TC057 Lawrence Creek 2 1 0 0 1 100.0% 97.3% 97.3% 0.0% 97.3% 252 7 110
*Designated trout stream

28
Appendix 3. Natural Heritage Program EORs of Tracked Fishes Reported in the TCMA.
Common Name Scientific Name MDNR Status Lake or Stream County LastReported
LAMPREY PETROMYZONTIDAE
Southern brook lamprey Ichthyomyzon gagei special concern St. Croix River Washington 1996
American brook lamprey Lampetra appendix delisted Assumption Creek Carver 2000
American brook lamprey Lampetra appendix delisted Trout Brook Dakota 2000
American brook lamprey Lampetra appendix delisted Credit River Scott 1935
American brook lamprey Lampetra appendix delisted Eagle Creek Scott 1994
American brook lamprey Lampetra appendix delisted Minnesota River trib Scott 2000
American brook lamprey Lampetra appendix delisted Valley Branch trib Washington 2000
STURGEON ACIPENSERIDAE
Lake sturgeon Acipenser fulvescens special concern St. Croix River Washington 1998
Shovelnose sturgeon Scaphirhynchus platorynchus delisted Minnesota River Carver 1999
Shovelnose sturgeon Scaphirhynchus platorynchus delisted Minnesota River Hennepin 1992
Shovelnose sturgeon Scaphirhynchus platorynchus delisted Minnesota River Ramsey 1980
PADDLEFISH POLYODONTIDAE
Paddlefish Polyodon spathula threatened Minnesota River Dakota 1993
Paddlefish Polyodon spathula threatened Mississippi River Ramsey 1990
Paddlefish Polyodon spathula threatened St. Croix River Washington 1996
HERRINGS CLUPEIDAE
Skipjack herring Alosa chrysochloris special concern Minnesota River Scott 1899
Skipjack herring Alosa chrysochloris special concern St. Croix River Washington 1928
MINNOWS CYPRINIDAE
Pallid shiner Notropis amnis special concern St. Croix River Washington 1926
Pugnose shiner Notropis anogenus special concern St. Croix River Washington 1926
Pugnose shiner Notropis anogenus special concern Lake Waconia Carver 1948
Pugnose shiner Notropis anogenus special concern Cedar Lake Hennepin 1941
Pugnose shiner Notropis anogenus special concern Christmas Lake Hennepin 1941
Pugnose shiner Notropis anogenus special concern Fish Lake Hennepin 1948
Pugnose shiner Notropis anogenus special concern Lake Harriet Hennepin 1948

29
Appendix 3. Continued
Common Name Scientific Name MDNR Status Lake or Stream County LastReported
Pugnose shiner Notropis anogenus special concern Lake Minnetonka Hennepin 1991
Pugnose shiner Notropis anogenus special concern McCarrons Lake Ramsey 1931
Pugnose shiner Notropis anogenus special concern Forest Lake Washington 1941
Ozark minnow Notropis nubilus special concern Trout Brook Dakota 1986
Pugnose minnow Opsopoeodus emiliae delisted Mississippi River Dakota 1995
Pugnose minnow Opsopoeodus emiliae delisted St. Croix River Washington 1996
SUCKERS CATOSTOMIDAE
Blue sucker Cycleptus elongatus special concern Minnesota River Carver 1996
Blue sucker Cycleptus elongatus special concern Mississippi River Dakota 1996
Blue sucker Cycleptus elongatus special concern Mississippi River Ramsey 2000
Blue sucker Cycleptus elongatus special concern St. Croix River Washington 2000
PERCH PERCIDAE
Crystal darter Crystallaria asprella special concern St. Croix River Washington 1982
Least darter Etheostoma microperca special concern Rum River Anoka 1935
Least darter Etheostoma microperca special concern Lake Minnewashta Carver 1962
Least darter Etheostoma microperca special concern Lake Zumbra Carver 1997
Least darter Etheostoma microperca special concern Christmas Lake Hennepin 1997
Least darter Etheostoma microperca special concern Crystal Lake Hennepin 1931
Least darter Etheostoma microperca special concern Lake Minnetonka Hennepin 1997
Gilt darter Percina evides special concern St. Croix River Washington 1998

30
Appendix 4. Rare, Intolerant, Exotic, and Range Extensions Reported in the TCMA.
Common Name Scientific Name Comments Lake or Stream County LastReported
MOONEYES HIODONTIDAE
Goldeye Hiodon alosoides endangered-WI Mississippi River Dakota 1996
Goldeneye Hiodon alosoides endangered-WI Mississippi River Ramsey 1958
Goldeneye Hiodon alosoides endangered-WI St. Croix River Washington 1968
EELS ANGUILLIDAE
American eel Anguilla rostrata special concern-WI Minnesota River Hennepin 1982
American eel Anguilla rostrata special concern-WI Minnesota River Dakota 1965
American eel Anguilla rostrata special concern-WI Mississippi River Ramsey 1976
American eel Anguilla rostrata special concern-WI Pleasant Lake Ramsey 1984
American eel Anguilla rostrata special concern-WI St. Croix River Washington 1983
MINNOWS CYPRINIDAE
Goldfish Carassius auratus exotic Bassett Creek trib Hennepin 2000
Goldfish Carassius auratus exotic Northwood Pond Hennepin 1993
Goldfish Carassius auratus exotic Kohlman Creek Ramsey 1997
Goldfish Carassius auratus exotic Phalen Creek Ramsey 1999
Goldfish Carassius auratus exotic Willow Creek trib Ramsey 1999
Redside dace Clinostomus elongatus extirpated-IA/ Trout Brook Dakota 1983
Redside dace Clinostomus elongatus special concern-WI
Silvery minnow Hybognathus nuchalis peripheral Minnesota River trib Scott 1899
Speckled chub Macrhybopsis aestivalis threatened-WI Minnesota River Carver 1999
Speckled chub Macrhybopsis aestivalis threatened-WI Vermillion River Dakota 1963
Speckled chub Macrhybopsis aestivalis threatened-WI Minnesota River Scott 1996
Speckled chub Macrhybopsis aestivalis threatened-WI Mississippi River Hennepin 1995
Speckled chub Macrhybopsis aestivalis threatened-WI Mississippi River Ramsey 2000
Silver chub Macrhybopsis storeriana special concern-WI Mississippi River Dakota 1997
Silver chub Macrhybopsis storeriana special concern-WI Mississippi River Hennepin 1989
Silver chub Macrhybopsis storeriana special concern-WI Mississippi River Ramsey 2000
Silver chub Macrhybopsis storeriana special concern-WI Minnesota River Scott 1899
Silver chub Macrhybopsis storeriana special concern-WI St. Croix River Washington 1968

31
Appendix 4. Continued
Common Name Scientific Name Comments Lake or Stream County LastReported
Pearl dace Margariscus margarita endangered-IA Credit River Scott 1954
Pearl dace Margariscus margarita endangered-IA Chub Creek trib Dakota 2000
Pearl dace Margariscus margarita endangered-IA Vermillion River Dakota 1999
River shiner Notropis blennius peripheral Minnesota River Carver 1954
River shiner Notropis blennius peripheral Mississippi River Dakota 1974
River shiner Notropis blennius peripheral Vermillion River Dakota 1954
River shiner Notropis blennius peripheral Mississippi River Ramsey 1995
River shiner Notropis blennius peripheral Credit River Scott 1994
River shiner Notropis blennius peripheral Sand Creek Scott 1954
Blackchin shiner Notropis heterodon intolerant Centerville Lake Anoka 1962
Blackchin shiner Notropis heterodon intolerant Lake George Anoka 1983
Blackchin shiner Notropis heterodon intolerant Lake Minnewashta Carver 1998
Blackchin shiner Notropis heterodon intolerant Pierson Lake Carver 1954
Blackchin shiner Notropis heterodon intolerant Christmas Lake Hennepin 1996
Blackchin shiner Notropis heterodon intolerant Crystal Lake Hennepin 1933
Blackchin shiner Notropis heterodon intolerant Lake Harriet Hennepin 1948
Blackchin shiner Notropis heterodon intolerant Lake Minnetonka Hennepin 1969
Blackchin shiner Notropis heterodon intolerant Minnehaha Creek Hennepin 2000
Blackchin shiner Notropis heterodon intolerant Minnesota River Scott? 1899
Blackchin shiner Notropis heterodon intolerant Big Carnelian Lake Washington 1993
Blackchin shiner Notropis heterodon intolerant Big Marine Lake Washington 1996
Blackchin shiner Notropis heterodon intolerant Forest Lake Washington 1994
Blackchin shiner Notropis heterodon intolerant Square Lake outlet Washington 1999
Blacknose shiner Notropis heterolepis intolerant Cedar Creek Anoka 1969
Blacknose shiner Notropis heterolepis intolerant Clearwater Creek Anoka 1999
Blacknose shiner Notropis heterolepis intolerant Ford Brook Anoka 1998
Blacknose shiner Notropis heterolepis intolerant Island Lake Anoka 1960
Blacknose shiner Notropis heterolepis intolerant Lake George Anoka 1983
Blacknose shiner Notropis heterolepis intolerant Mahoney Brook Anoka 2000
Blacknose shiner Notropis heterolepis intolerant Rum River trib Anoka 1999

32
Appendix 4. Continued
Common Name Scientific Name Comments Lake or Stream County LastReported
Banded killifish Fundulus diaphanus intolerant Big CarnelianLake
Washington 1997
Banded killifish Fundulus diaphanus intolerant Big Marine Lake Washington 1999
Banded killifish Fundulus diaphanus intolerant Bonny Lake Washington 1941
Banded killifish Fundulus diaphanus intolerant Forest Lake Washington 1994
Banded Killifish Fundulus diaphanus intolerant Square Lake Washington 1998
SCULPINS COTTIDAE
Mottled sculpin Cottus bairdi intolerant Coon Creek Anoka 2000
Mottled sculpin Cottus bairdi intolerant Cedar Creek Anoka 2000
Slimy sculpin Cottus cognatus intolerant Valley Branch Washington 2000
SUNFISH CENTRARCHIDAE
Orangespotted sunfish Lepomis humillis range extension MississippiRiver
Anoka 2000
Orangespotted sunfish Lepomis humillis range extension Crow River Carver 1999
Orangespotted sunfish Lepomis humillis range extension Crow River Hennepin 2000
Orangespotted sunfish Lepomis humillis range extension Elm Creek Hennepin 1995
Longear sunfish Lepomis megalotis threatened-WI McCarrons Lake Ramsey 1978
DARTERS PERCIDAE
Western sand darter Ammocrypta clara specialconcern- WI
Minnesota River Dakota 1980
Western sand darter Ammocrypta clara specialconcern-WI
St. Croix River Washington 1996
Mud Darter Etheostoma asprigene specialconcern-WI
St. Croix River Washington 1998
Rainbow darter Etheostoma caeruleum intolerant Chub Creek Dakota 2000
Rainbow darter Etheostoma caeruleum intolerant Credit River Scott 1956
Rainbow darter Etheostoma caeruleum intolerant Browns Creek Washington 1995
Rainbow darter Etheostoma caeruleum intolerant Old Mill Stream Washington 1999
Rainbow darter Etheostoma caeruleum intolerant St. Croix River Washington 1998
Rainbow darter Etheostoma caeruleum introduced? Phalen Lake Ramsey 2000
Banded darter Etheostoma zonale intolerant Cannon River Dakota 2000

Acknowledgments
We acknowledge the following individuals for their contributions to the study: Joan Galli(MDNR) funded the surveys through the Nongame Wildlife Program; Jack Enblom (MDNR)and Scott Niemela (MPCA) provided the field equipment; Louise Hotka (MPCA) funded thewater chemistry lab analyses; Andrew Simons (University of Minnesota) cataloged specimensinto the James Ford Bell Museum of Natural History fish collection; Nick Proulx (MDNR)produced the maps used in this report; and Steve Kittelson (MDNR) assisted in several surveys,and also recruited volunteers for the larger river stations. We also thank Charles Anderson, JackEnblom, John Lyons, Jason Moeckel, Neal Mundahl, and David Wright for comments andsuggestions that improved this report.
Edited by:Paul J. Wingate, Fisheries Research Manager