fish community structure and food web dynamics in low...
TRANSCRIPT

Fish Community Structure and Food Web Dynamics in Low Rainfall Mangrove and
Non-mangrove Ecosystems (Persian Gulf)
Maryam Shahraki

Fish Community Structure and Food Web Dynamics in Low Rainfall Mangrove and Non-mangrove
Ecosystems (Persian Gulf)
Dissertation submitted by Maryam Shahraki
In partial fulfillment of the requirements for the degree of Doctor of Natural Sciences
Faculty 2 (Biology & Chemistry) University of Bremen
Germany March 2015


This thesis has been accomplished at the Leibniz Center for Tropical Marine Ecology (ZMT) between November 2011 and March 2015.
The financial support was granted by the German National Merit Foundation Scholarship (Studienstiftung des deutschen Volkes), the Leibniz Center for Tropical Marine Ecology (ZMT) and Bremen International Graduate School for Marine Sciences (GLOMAR).
Advisory Committee: Reviewers: Prof. Dr. Ulrich Saint-Paul Leibniz Center for Tropical Marine Ecology (ZMT), Bremen, Germany Prof. Dr. Thomas Brey Alfred Wegener Institute Helmholtz Centre for Polar and Marine Research (AWI), Bremerhaven, Germany Examiners: Prof. Dr. Kai Bischof Faculty 2 (Biology & Chemistry), University of Bremen, Bremen, Germany Prof. Dr. Arzhang Khalili Max-Planck Institute for Marine Microbiology (MPI), Bremen, Germany Members: Andre Wizemann PhD Student at University of Bremen, Bremen, Germany Mariyam Ali Master Student at University of Bremen, Bremen, Germany
Date of Disputation: May 6, 2015


CONTENTS
Abstract 1
Zusammenfassung 3
Chapter I General introduction 7
Chapter II
Tidal induced changes in intertidal mangrove fish
assemblages (Qeshm Island-Persian Gulf)
Manuscript submitted
21
Chapter III Microphytobenthos sustain fish food webs in intertidal arid habitats: A comparison between mangrove-lined and un-vegetated creeks in the Persian Gulf Estuarine, Coastal and Shelf Science (2014) 149, 203-212
45
Chapter IV Seasonal fisheries changes in low-rainfall mangrove ecosystems Manuscript submitted
75
Chapter V Synoptic discussion and outlook 101
Annex 115
Acknowledgements
Erklärung
133
135
The references of this dissertation follow the formatting style of Estuaries and Coasts journal


Abstract
ABSTRACT
Mangroves are considered as an important source of nutrition to aquatic consumers,
which, in return, sustain the fish population. However, there is still controversy about
the importance of mangroves to fish communities, and furthermore, not all mangroves
fulfill every function ascribed to them. The Persian Gulf presents the northernmost
mangroves in the Indo-Pacific region, thriving under extreme environmental
conditions such as very low rainfall and high salinities. Very few studies have
addressed fish distribution patterns of mangroves in this arid region.
The main objective of this study is to describe and compare the fish community
structure and food web dynamics of mangrove and non-mangrove intertidal creeks in a
low-rainfall system in Qeshm Island, Persian Gulf, Northern Indian Ocean (26.8°N,
55.75°E). Therefore, this thesis addresses temporal changes in mangrove fish
assemblages related to the tidal and diel cycles in the meso-tidal mangrove of Qeshm
Island. Also, the food web’s dynamics were studied to determine the role of
mangroves in fish food webs. Moreover, due to the arid climate along the northern
Indian Ocean, many neighboring creeks are devoid of mangroves but still provide
habitat for fish. This provided the necessary conditions for a natural experiment to
compare fish assemblage structures and trophic diversity between creeks that are
mangrove lined, and creeks without mangroves across seasons. For that, fish were
collected with respect to the different combinations of tidal amplitude (and lunar
phase) and day light conditions as well as seasons (winter, summer). Also, various
potential food sources were collected for δ13C and δ15N measurements from both
habitats across seasons.
The findings show the impact of environmental variables (e.g. tide and
temperature) in structuring fish assemblages in Qeshm intertidal creeks. The
interaction between tide and time of day emerged as an important factor in organizing
mangrove fish assemblages in this meso-tidal arid region. The highest fish biomass,
abundance, and diversity were observed during spring tide night. High inundation
during spring tides coinciding with the darkness provided the most favorable
conditions for fish. When mangrove fish communities were compared with the non-
mangroves, seasonality appeared as a more important factor than habitat. Extreme
summer water temperatures (>33°C) likely limit the fish abundances and biomass. Fish
assemblages of mangrove and non-mangrove intertidal creeks were equally diverse
and dominated by the same fish families (e.g. Mugilidae). Small-sized fish dominated 1

Abstract
catches in both habitats. Also, there were no consistent differences in fish abundance
and biomass for mangrove vs. non-mangrove fish collections. Community trophic
diversity, measured with size-corrected standard ellipse areas (SEAc), also showed no
significant difference across habitats. Instead, strong seasonal patterns were observed
for the food sources and fish communities isotopic niche sizes. These findings
demonstrate that the structuring effect of seasonality is more important than habitat in
determining the fish distribution patterns in this region.
Mangrove-derived organic matter contributed to a maximum of 36% to the fish
tissue, whereas organic matter produced by microphytobenthos and plankton plays a
major role in the diets of the most abundant fish species, with contributions of 64 -
100%. Thus, the fish food web’s support of mangrove and non-mangrove intertidal
creeks seems to be energetically driven by pelagic and benthic food pathways in this
study area. Furthermore, the dominance of detritivores in both mangrove and non-
mangrove intertidal creeks suggests the importance of benthic food webs in the
intertidal creeks at Qeshm Island.
The outcomes of this dissertation contribute to the global understanding of the
importance of mangrove and non-mangrove intertidal creeks for fish food webs and
fisheries support in a low-rainfall coastal ecosystem. The findings imply some
potentially interesting consequences on habitat conservation and indicate that the
abundance of small fish is not always higher in complex vegetation. Like mangrove
creeks, the bare creeks are utilized by a wide variety of fish, suggesting greater
attention should be drawn to these habitats.
Keywords Fish community structure, rainfall, tidal and diel cycles, food webs, trophic
diversity, isotopic niche size, mangrove, non-mangrove, intertidal creeks, Qeshm
Island, Persian Gulf, Western Indian Ocean
2

Zusammenfassung
ZUSAMMENFASSUNG
Mangroven werden als wichtige Nahrungsquellen für aquatische Konsumenten
angesehen, welche ihrerseits als Nahrungsgrundlage für Fischpopulationen dienen. Die
Bedeutung von Mangroven für Fischpopulationen ist jedoch noch nicht abschließend
geklärt, und nicht jedes Mangrovensystem erfüllt alle Funktionen die ihm
zugeschrieben werden. Entlang der Küstengebiete des Persischen Golfes findet man
die am weitesten im Norden gelegenen Mangrovensysteme des Indo-Pazifiks, die dort
unter z.T. extremen Umweltbedingungen, wie z.B. geringem Niederschlag und hohen
Salzgehalten, gedeihen. Gerade für diese Gebiete mangelt es an Untersuchungen zur
Bedeutung von Mangrovensystemen für die lokalen Fischpopulationen.
Das Ziel dieser Arbeit ist die Beschreibung der Struktur und Dynamik von
Fischgemeinschaften und der lokalen Nahrungsnetze in Gezeitenprielen mit und ohne
Mangrovenbewuchs der durch ein arides Klima geprägten Insel Qeshm, Persischer
Golf, Nördlicher Indischer Ozean (26.8°N, 55.75°E). Ihr Fokus liegt auf der
Untersuchung der Einflüsse von Gezeiten- und Tag-Nacht-Zyklen auf die
Zusammensetzung von estuarinen Fischgemeinschaften. Des weiteren wurde die
Dynamik lokaler Nahrungsnetze untersucht, um die Rolle von Mangroven in
Nahrungsnetzen der Fische besser deuten zu können. Durch das aride Klima sind viele
der Gezeitenpriele ohne Vegetation, fungieren aber dennoch als Habitat für
verschiedene Fischarten. Das Vorkommen von Gezeitenprielen mit und ohne
Mangrovenbewuchs ermöglichte die Durchführung eines natürlichen Experimentes,
um den Einfluß der Vegetation auf die Struktur der Fischgemeinschaften und die
trophische Diversität während verschiedener Jahreszeiten zu untersuchen. Die
Probenahmen für δ13C- und δ15N-Messungen der Fische und ihrer potentiellen
Nahrungsquellen berücksichtigten mögliche Einflussfaktoren wie Gezeiten und
Tidenhub (und Mondphasen) sowie Tageslichtbedingungen und Jahreszeiten (Winter,
Sommer). Die Proben wurden aus den bewachsenen und unbewachsenen Habitaten
während der Winter- und Sommermonate genommen, um anschließend Nahrungsnetze
mittels der stabilen Isotopenverhältnisse zu ermitteln.
Die Ergebnisse der vorliegenden Studie zeigen den Einfluss von
Umweltfaktoren (z.B. Tide und Temperatur) auf die Strukturierung von
Fischgemeinschaften in Gezeitenprielen der Insel Qeshm. Insbesondere die
Wechselwirkung zwischen Tide und Tageszeitpunkt erwies sich als wichtiger Faktor
für die Zusammensetzung der mangrovenbewohnenden Fischgemeinschaften in dieser 3
Zusammenfassung
meso-tidalen, ariden Region. Die höchsten Werte an Biomasse, Abundanz und
Diversität von Fischen wurden während nächtlicher Springtiden festgestellt. Beim
Vergleich der Fischgemeinschaften erwies sich die Saisonalität als stärkerer
Einflussfaktor als die Unterscheidung der Gezeitenpriele mit und ohne
Mangrovenbewuchs. Extreme Wassertemperaturen im Sommer (> 33°) sind
wahrscheinlich ein limitierender Faktor für die Fischabundanz und -biomasse. Die
Artenvielfalt der Fischgemeinschaften war ähnlich in Gezeitenprielen mit und ohne
Mangrovenbewuchs und es dominierten jeweils Arten aus denselben taxonomischen
Familien (z.B. Mugilidae). Fische mit kleinen Körpergrößen dominierten die Fänge in
beiden Habitattypen. Auch bezüglich Fischabundanz und -biomasse zeigten sich keine
deutlichen Unterschiede zwischen beiden Habitaten. Die trophische Diversität der
Gemeinschaften, welche mittels größenkorrigierten Standardellipsenflächen (“standard
ellipse areas“, SEAc) ermittelt wurde, unterschied sich nicht signifikant zwischen
beiden Habitattypen. Allerdings wurden ausgeprägte saisonale Muster für
Fischgemeinschaften und Nahrungsquellen in ihren trophischen Nischen, basierend auf
Isotopenmessungen, sichtbar. Dies verdeutlicht, dass für die Strukturierung der
Físchgemeinschaften in dieser Region die Sasionalität der entscheidende Einfluss ist
und nicht die Unterscheidung der Habitate.
Organisches Material mit Ursprung aus Mangrovensystemen machte bis zu
36 % des Fischgewebes aus. Deutlich größer war jedoch der Anteil von organischem
Material, das sich auf Mikrophytobenthos und Plankton zurückführen ließ (64-100 %
desGewebes). Die Nahrungsnetze beider Habitattypen (mit und ohne Mangroven)
erscheinen somit energetisch durch pelagische und benthische Pfade bestimmt. Die
Dominanz detrivorer Fische in bewachsenen wie unbewachsenen Gezeitenprielen
unterstreicht die Wichtigkeit benthischer Nahrungsnetze in den Gezeitenprielen
entlang der Insel Qeshm.
Die Ergebnisse der vorliegenden Dissertation tragen zum globalen Verständnis
der Bedeutung mangrovenbewachsener und -unbewachsener Gezeitenpriele für
Fischgemeinschaften und ihre Nahrungsnetze in regenarmen küstennahen
Ökosystemen bei. Die Resultate lassen Rückschlüsse auf potentiell interessante
Konsequenzen in Bezug auf den Schutz natürlicher Lebensräume zu und zeigen auf,
dass die Abundanz kleiner Fische in Habitaten mit komplexer Vegetation nicht
zwangsläufig höher ist. Priele mit Mangrovenbeständen werden ebenso wie Priele
ohne Mangrovenbestände von einer Vielzahl verschiedener Fische genutzt. Dies legt 4

Zusammenfassung
nahe, dass letztgenannte Habitate verstärkt in den Fokus wissenschaftlicher
Untersuchungen gerückt werden sollten.
Stichwörter Struktur von Fischgemeinschaften, Niederschlag, Tidenzyklen,
Tagesgang, Nahrungsnetze, trophische Diversität, isotopische Nischengröße,
Mangroven, Gezeitenpriele, Insel Qeshm, Persischer Golf, westlicher Indischer Ozean
5

6

CHAPTER I
General Introduction
7

8

Chapter I
Mangroves function and distribution
Mangrove forests are predominantly intertidal habitats that occur along sheltered and
shallow water coastlines in the tropics and subtropics (FAO 2007), comprising a
worldwide area of 137,760 km2 in the year 2000 (Giri et al. 2011). Mangroves fulfill
important socio-economic and ecological functions such as aquaculture and protection
against shoreline erosion (Hogarth 1999; Walters et al. 2008). Mangroves are
considered to be highly productive ecosystems with high rate of primary production,
harboring high species diversity and thus complex food webs (Manson et al. 2005;
Nagelkerken et al. 2008; Alongi 2014). Observation of high abundances of juvenile
fish in mangrove have supported the idea that they are a valuable nursery habitat
(Robertson and Duke 1987; Laegdsgaard and Johnson 1995; Nagelkerken 2009).
Structural complexity, reduced predation pressures and abundant food have been
hypothesized to explain the high abundances of the fish in mangroves (Robertson and
Blaber 1992; Blaber 2000; Laegdsgaard and Johnson 2001). Over the past 50 years,
one-third of the world’s mangrove forests have been destroyed by human disturbance
through urban development, farming and pollution, and remain under threat for the
same reasons (Alongi 2002).
Mangrove species and forest structure vary with location and climate, ranging
from the extremely arid coast of the Persian Gulf to the cool-temperate coast of
southern Australia, to the wet equatorial coast of Asia, Africa and Latin America
(Robertson and Alongi 1992; Sheaves 2005). Mangroves are divided into two global
hemispheres: the Indo-West Pacific (IWP), with highest species diversity, and the
Atlantic East Pacific (AEP) with four times less mangrove species diversity compared
to IWP (Fig. 1) (Duke et al. 1998).
Figure 1 Distributions of mangrove forest (species); Modified from Duke et al. (1998) and Polidoro et al. (2010). Mangroves in the Persian Gulf are shown in circle.
9

General Introduction
The ecological role of mangroves is varied among regions and is constrained by
environmental variables, thereby not all mangrove types fulfill every function ascribed
to them (Ewel et al. 1998; Twilley and Day 1999; Faunce and Serafy 2006). Existing
knowledge on mangrove fish is mostly from Australia, North and Latin America and
South Asia and to a lesser extent from Africa (Faunce and Serafy 2006; Sheaves 2012;
Blaber 2013). IWP mangroves are a subset of three regions, highly variable in climate,
comprising East Africa, Indo-Malesia and Australasia (Duke et al. 1998). The Persian
Gulf region is located in the East African region (Fig. 1). It is the northern edge of
mangrove distribution in the Indian Ocean. Mangroves in the Gulf region are subject to
extreme conditions such as very low rainfall and high salinities (Al-Khayat and Jones
1999) which restrict the mangrove species in this area to one species, Avicennia
marina, although possibly one or two more species occur in some locations (Sheppard
et al. 2010). The harsh environment may influence the functionality of mangroves as a
fish habitat in this region. To date, little is known about mangrove habitat use by fish
in the meso-tidal coast of the Persian Gulf. There is scarcity of knowledge in this area
in terms of variables controlling for fish distribution patterns and food webs support in
mangrove ecosystems, indicating that there is a need to study the dynamics of fish
communities in relation to environmental variables and food sources in this low-
rainfall system at Qeshm Island, Iranian coast of the Persian Gulf (26.8°N, 55.75°E).
Drivers of structural changes in fish communities
Variations in fish communities in mangrove habitats have been shown to be dynamic
on a variety of temporal scales. Many variables such as abiotic parameters, prey
availability, and predation avoidance have been suggested to determine the structural
changes in fish assemblages (Blaber 2000; Laegdsgaard and Johnson 2001). However,
the importance of these factors to the fish population is variable among systems
(Blaber and Blaber 1980; Faunce and Serafy 2006).
On tidal coasts, fish have to deal with variations in habitat availability due to
tidal fluctuations (Quinn and Kojis 1987; Rooker and Dennis 1991). Mangrove fish of
tidal coasts regularly move between high water level foraging and low water level
resting sites and the interaction between tide and diel cycle may cause significant
changes in fish assemblage composition (Krumme 2009). In the Caribbean, where tidal
ranges are small, only a few fish species respond to changes in water level (Ellis and
Bell 2008) and the diel cycle is the major rhythm driving short-term changes in 10
Chapter I
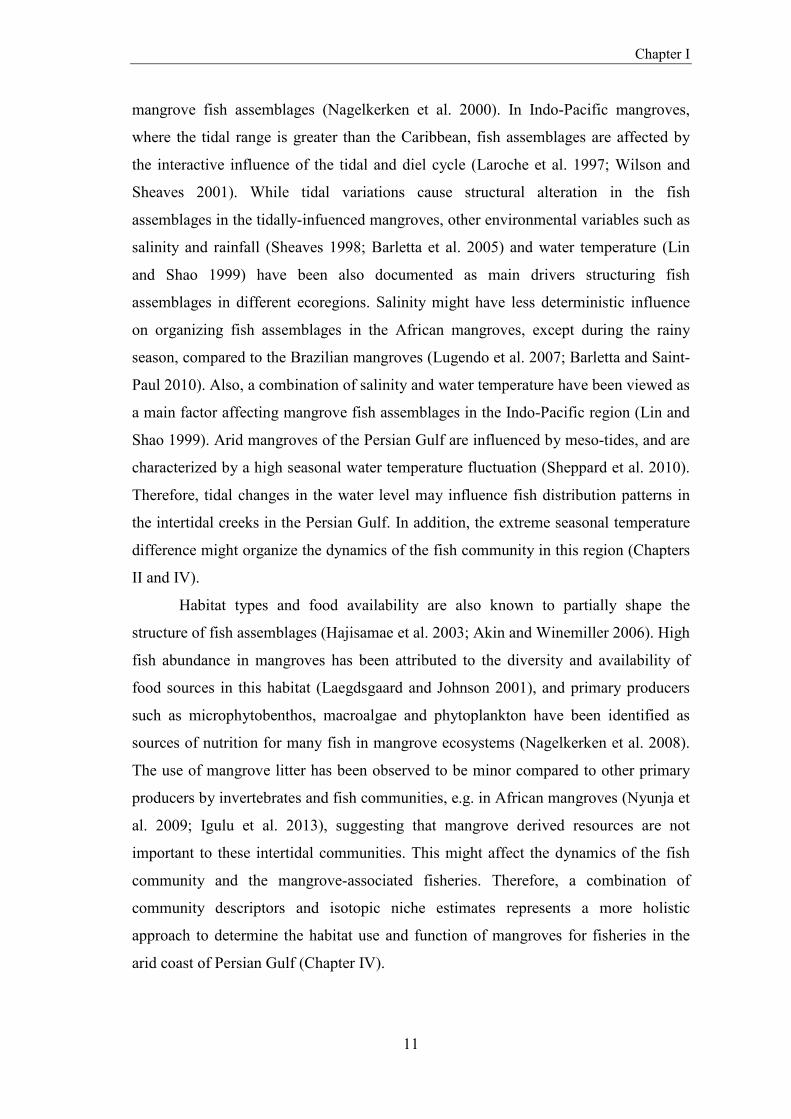
mangrove fish assemblages (Nagelkerken et al. 2000). In Indo-Pacific mangroves,
where the tidal range is greater than the Caribbean, fish assemblages are affected by
the interactive influence of the tidal and diel cycle (Laroche et al. 1997; Wilson and
Sheaves 2001). While tidal variations cause structural alteration in the fish
assemblages in the tidally-infuenced mangroves, other environmental variables such as
salinity and rainfall (Sheaves 1998; Barletta et al. 2005) and water temperature (Lin
and Shao 1999) have been also documented as main drivers structuring fish
assemblages in different ecoregions. Salinity might have less deterministic influence
on organizing fish assemblages in the African mangroves, except during the rainy
season, compared to the Brazilian mangroves (Lugendo et al. 2007; Barletta and Saint-
Paul 2010). Also, a combination of salinity and water temperature have been viewed as
a main factor affecting mangrove fish assemblages in the Indo-Pacific region (Lin and
Shao 1999). Arid mangroves of the Persian Gulf are influenced by meso-tides, and are
characterized by a high seasonal water temperature fluctuation (Sheppard et al. 2010).
Therefore, tidal changes in the water level may influence fish distribution patterns in
the intertidal creeks in the Persian Gulf. In addition, the extreme seasonal temperature
difference might organize the dynamics of the fish community in this region (Chapters
II and IV).
Habitat types and food availability are also known to partially shape the
structure of fish assemblages (Hajisamae et al. 2003; Akin and Winemiller 2006). High
fish abundance in mangroves has been attributed to the diversity and availability of
food sources in this habitat (Laegdsgaard and Johnson 2001), and primary producers
such as microphytobenthos, macroalgae and phytoplankton have been identified as
sources of nutrition for many fish in mangrove ecosystems (Nagelkerken et al. 2008).
The use of mangrove litter has been observed to be minor compared to other primary
producers by invertebrates and fish communities, e.g. in African mangroves (Nyunja et
al. 2009; Igulu et al. 2013), suggesting that mangrove derived resources are not
important to these intertidal communities. This might affect the dynamics of the fish
community and the mangrove-associated fisheries. Therefore, a combination of
community descriptors and isotopic niche estimates represents a more holistic
approach to determine the habitat use and function of mangroves for fisheries in the
arid coast of Persian Gulf (Chapter IV).
11
General Introduction
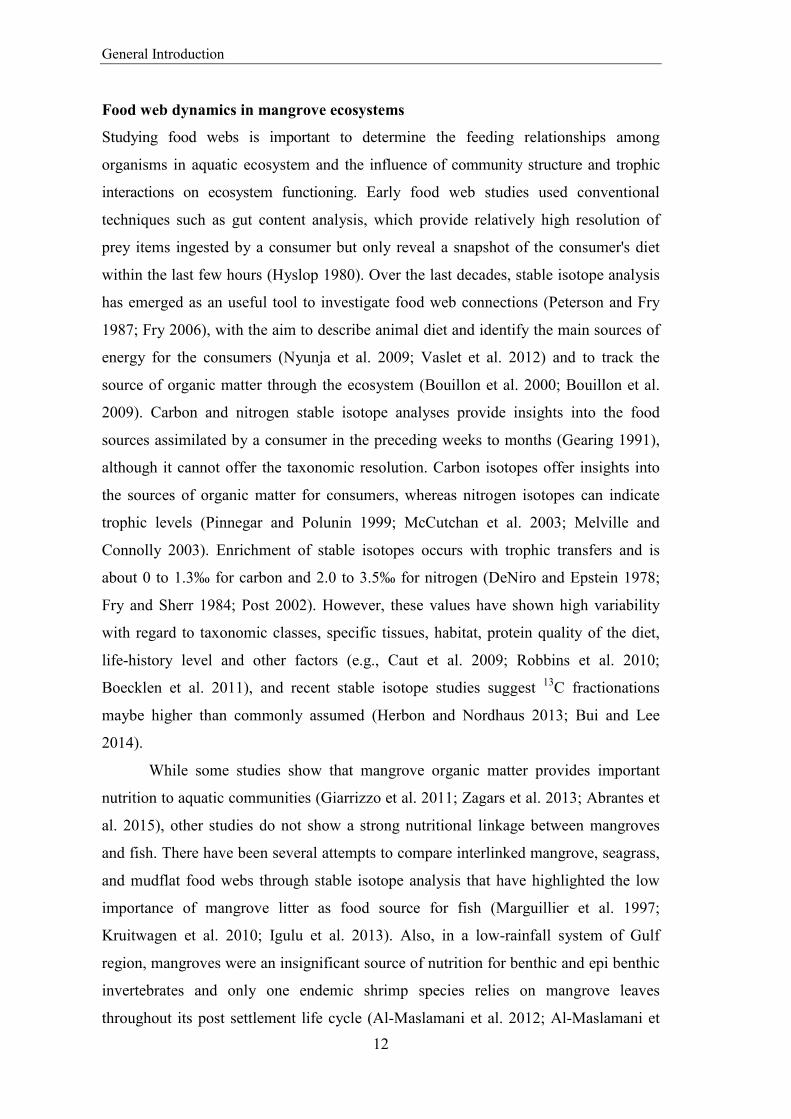
Food web dynamics in mangrove ecosystems
Studying food webs is important to determine the feeding relationships among
organisms in aquatic ecosystem and the influence of community structure and trophic
interactions on ecosystem functioning. Early food web studies used conventional
techniques such as gut content analysis, which provide relatively high resolution of
prey items ingested by a consumer but only reveal a snapshot of the consumer's diet
within the last few hours (Hyslop 1980). Over the last decades, stable isotope analysis
has emerged as an useful tool to investigate food web connections (Peterson and Fry
1987; Fry 2006), with the aim to describe animal diet and identify the main sources of
energy for the consumers (Nyunja et al. 2009; Vaslet et al. 2012) and to track the
source of organic matter through the ecosystem (Bouillon et al. 2000; Bouillon et al.
2009). Carbon and nitrogen stable isotope analyses provide insights into the food
sources assimilated by a consumer in the preceding weeks to months (Gearing 1991),
although it cannot offer the taxonomic resolution. Carbon isotopes offer insights into
the sources of organic matter for consumers, whereas nitrogen isotopes can indicate
trophic levels (Pinnegar and Polunin 1999; McCutchan et al. 2003; Melville and
Connolly 2003). Enrichment of stable isotopes occurs with trophic transfers and is
about 0 to 1.3‰ for carbon and 2.0 to 3.5‰ for nitrogen (DeNiro and Epstein 1978;
Fry and Sherr 1984; Post 2002). However, these values have shown high variability
with regard to taxonomic classes, specific tissues, habitat, protein quality of the diet,
life-history level and other factors (e.g., Caut et al. 2009; Robbins et al. 2010;
Boecklen et al. 2011), and recent stable isotope studies suggest 13C fractionations
maybe higher than commonly assumed (Herbon and Nordhaus 2013; Bui and Lee
2014).
While some studies show that mangrove organic matter provides important
nutrition to aquatic communities (Giarrizzo et al. 2011; Zagars et al. 2013; Abrantes et
al. 2015), other studies do not show a strong nutritional linkage between mangroves
and fish. There have been several attempts to compare interlinked mangrove, seagrass,
and mudflat food webs through stable isotope analysis that have highlighted the low
importance of mangrove litter as food source for fish (Marguillier et al. 1997;
Kruitwagen et al. 2010; Igulu et al. 2013). Also, in a low-rainfall system of Gulf
region, mangroves were an insignificant source of nutrition for benthic and epi benthic
invertebrates and only one endemic shrimp species relies on mangrove leaves
throughout its post settlement life cycle (Al-Maslamani et al. 2012; Al-Maslamani et 12
Chapter I
al. 2013), but fish food web dynamics has not been studied in the Iranian mangroves
(Chapter III).
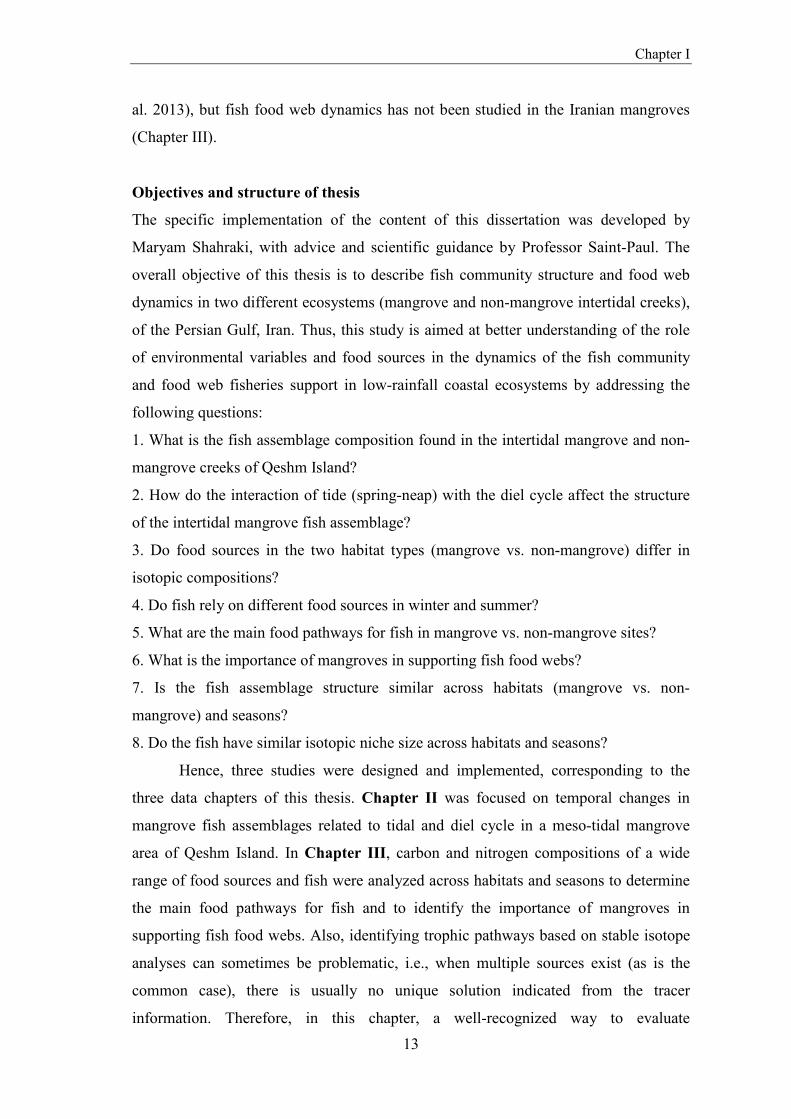
Objectives and structure of thesis
The specific implementation of the content of this dissertation was developed by
Maryam Shahraki, with advice and scientific guidance by Professor Saint-Paul. The
overall objective of this thesis is to describe fish community structure and food web
dynamics in two different ecosystems (mangrove and non-mangrove intertidal creeks),
of the Persian Gulf, Iran. Thus, this study is aimed at better understanding of the role
of environmental variables and food sources in the dynamics of the fish community
and food web fisheries support in low-rainfall coastal ecosystems by addressing the
following questions:
1. What is the fish assemblage composition found in the intertidal mangrove and non-
mangrove creeks of Qeshm Island?
2. How do the interaction of tide (spring-neap) with the diel cycle affect the structure
of the intertidal mangrove fish assemblage?
3. Do food sources in the two habitat types (mangrove vs. non-mangrove) differ in
isotopic compositions?
4. Do fish rely on different food sources in winter and summer?
5. What are the main food pathways for fish in mangrove vs. non-mangrove sites?
6. What is the importance of mangroves in supporting fish food webs?
7. Is the fish assemblage structure similar across habitats (mangrove vs. non-
mangrove) and seasons?
8. Do the fish have similar isotopic niche size across habitats and seasons?
Hence, three studies were designed and implemented, corresponding to the
three data chapters of this thesis. Chapter II was focused on temporal changes in
mangrove fish assemblages related to tidal and diel cycle in a meso-tidal mangrove
area of Qeshm Island. In Chapter III, carbon and nitrogen compositions of a wide
range of food sources and fish were analyzed across habitats and seasons to determine
the main food pathways for fish and to identify the importance of mangroves in
supporting fish food webs. Also, identifying trophic pathways based on stable isotope
analyses can sometimes be problematic, i.e., when multiple sources exist (as is the
common case), there is usually no unique solution indicated from the tracer
information. Therefore, in this chapter, a well-recognized way to evaluate 13

General Introduction
underdetermined systems was used by focusing on minimum and maximum estimates
rather than on means, medians or other parameters or model-generated distributions of
solutions. Chapter IV showed whether mangroves enhance fisheries in the low-
rainfall system by comparing the community-level fish diversity, abundance, biomass
and trophic diversity across habitats and seasons.
Also two new concepts are profiled in this thesis:
1- The fish abundance and biomass comparisons are made on both a per m2 basis and
on a per sample basis, with the per m2 comparisons more appropriate when fish are
resident, and the per sample comparisons more appropriate when fish are transient. We
consider comparisons ecologically robust when significant differences are found in
parallel and significant for both ways of expressing the data (e.g., results are
considered ecologically robust when abundance is higher both on a per m2 basis and
also on a per sample basis). Alternatively, if abundance (or biomass) results are not
parallel and significant when expressed on a m2 and a per sample basis, results are not
considered ecologically robust (Chapters II & IV).
2- Fish and food standard ellipse areas (SEA) values are calculated from isotope values
to describe food use and availability. Higher SEA values for fish communities indicate
a broader use of foods, and higher SEA values for foods indicate a wide diversity in
food values. A ratio of these fish/food SEA isotope values is used to test whether fish
communities expand in isotope space just following food isotopes, or whether there is
genuine expansion of food use by fish, once changes in food isotopes are taken into
account. This approach seems to be a valuable first approach reinforcing the
conclusions reach on the basis of fish-only SEA estimates (Chapter IV).
List of manuscripts and contribution of authors
Manuscript I
Shahraki, M., Saint-Paul, U. (submitted) Tidal induced changes in intertidal mangrove
fish assemblages (Qeshm Island, Persian Gulf).
Conceived and designed the experiments: MS and USP. Performed the experiments:
MS. Analyzed the data: MS. Wrote the paper: MS. Provided feedback on different
versions of the manuscript: USP.
14

Chapter I
Manuscript II
Shahraki, M., Fry, B., Krumme, U., Rixen, T., 2014. Microphytobenthos sustain fish
food webs in intertidal arid habitats: A comparison between mangrove-lined and un-
vegetated creeks in the Persian Gulf. Estuarine, Coastal and Shelf Science 149, 203-
212.
Conceived and designed the experiments: MS and TR. Performed the experiments:
MS. Analyzed the data: MS, BF. Wrote the paper: MS. All the coauthers read the
different versions of the draft.
Manuscript III
Shahraki, M., Fry, B. (submitted) Seasonal fisheries changes in low-rainfall mangrove ecosystems.
Conceived and designed the experiments: MS. Performed the experiments: MS.
Analyzed the data: MS and BF. Wrote the paper: MS and BF.
REFERENCES Abrantes, K.G., R. Johnston, R.M. Connolly, and M. Sheaves. 2015. Importance of
Mangrove Carbon for Aquatic Food Webs in Wet–Dry Tropical Estuaries. Estuaries and Coasts 38: 383-399.
Akin, S., and K. Winemiller. 2006. Seasonal variation in food web composition and structure in a temperate tidal estuary. Estuaries and Coasts 29: 552-567.
Al-Khayat, J.A., and D.A. Jones. 1999. A Comparison of the Macrofauna of Natural and Replanted Mangroves in Qatar. Estuarine, Coastal and Shelf Science 49, Supplement 1: 55-63.
Al-Maslamani, I., M.E.M. Walton, H. Kennedy, and L. Le Vay. 2012. Sources of primary production supporting food webs in an arid coastal embayment. Marine Biology 159: 1753-1762.
Al-Maslamani, I., M.E.M. Walton, H.A. Kennedy, M. Al-Mohannadi, and L. Le Vay. 2013. Are mangroves in arid environments isolated systems? Life-history and evidence of dietary contribution from inwelling in a mangrove-resident shrimp species. Estuarine, Coastal and Shelf Science 124: 56-63.
Alongi, D.M. 2002. Present state and future of the world's mangrove forests. Environmental Conservation 29: 331-349.
Alongi, D.M. 2014. Carbon cycling and storage in mangrove forests. Annual review of marine science 6: 195-219.
Barletta, M., A. Barletta-Bergan, U. Saint-Paul, and G. Hubold. 2005. The role of salinity in structuring the fish assemblages in a tropical estuary. Journal of Fish Biology 66: 45-72.
15

General Introduction
Barletta, M., and U. Saint-Paul. 2010. Distribution Pattern of Fish in a Mangrove Estuary. In Mangrove Dynamics and Management in North Brazil, ed. U. Saint-Paul and H. Schneider, 171-188: Springer Berlin Heidelberg.
Blaber, S.J. 2000. Tropical estuarine fishes. ecology, exploitation, and conservation. Blackwell, Oxford.
Blaber, S.J.M. 2013. Fishes and fisheries in tropical estuaries: The last 10 years. Estuarine, Coastal and Shelf Science 135: 57-65.
Blaber, S.J.M., and T.G. Blaber. 1980. Factors affecting the distribution of juvenile estuarine and inshore fish. Journal of Fish Biology 17: 143-162.
Boecklen, W.J., C.T. Yarnes, B.A. Cook, and A.C. James. 2011. On the use of stable isotopes in trophic ecology. Annual Review of Ecology, Evolution, and Systematics 42: 411-440.
Bouillon, S., R.M. Connolly, and I. Nagelkerken. 2009. Carbon Exchange Among Tropical Coastal Ecosystems Ecological Connectivity among Tropical Coastal Ecosystems, 45-70: Springer Netherlands.
Bouillon, S., P.C. Mohan, N. Sreenivas, and F. Dehairs. 2000. Sources of suspended organic matter and selective feeding by zooplankton in an estuarine mangrove ecosystem as traced by stable isotopes. Marine Ecology Progress Series 208: 79-92.
Bui, T.H.H., and S.Y. Lee. 2014. Does ‘You Are What You Eat’Apply to Mangrove Grapsid Crabs? PloS one 9: e89074.
Caut, S., E. Angulo, and F. Courchamp. 2009. Variation in discrimination factors (δ15N and δ13C): the effect of diet isotopic values and applications for diet reconstruction. Journal of Applied Ecology 46: 443-453.
DeNiro, M.J., and S. Epstein. 1978. Influence of diet on the distribution of carbon isotopes in animals. Geochimica et Cosmochimica Acta 42: 495-506.
Duke, N., M. Ball, and J. Ellison. 1998. Factors influencing biodiversity and distributional gradients in mangroves. Global Ecology & Biogeography Letters 7: 27-47.
Ellis, W.L., and S.S. Bell. 2008. Tidal influence on a fringing mangrove intertidal fish community as observed by in situ video recording: implications for studies of tidally migrating nekton. Marine Ecology Progress Series 370: 207-219.
Ewel, K., R. Twilley, and J.I.N. Ong. 1998. Different kinds of mangrove forests provide different goods and services. Global Ecology & Biogeography Letters 7: 83-94.
FAO. 2007. The world’s Mangroves 1980–2005, ed. Food and Agriculture Organization of the United Nations, Rome, Italy.
Faunce, C.H., and J.E. Serafy. 2006. Mangroves as fish habitat: 50 years of field studies. Marine Ecology Progress Series 318: 1-18.
Fry, B. 2006. Stable isotope ecology: Springer. Fry, B., and E.B. Sherr. 1984. δ13C measurements as indicators of carbon flow in
marine and freshwater ecosystems. Contributions in Marine Science 27: 13-47. Gearing, J.N. 1991. The Study of Diet and Trophic Relationships through Natural
Abundance 13C. Carbon Isotope Techniques: 201.
16

Chapter I
Giarrizzo, T., R. Schwamborn, and U. Saint-Paul. 2011. Utilization of carbon sources in a northern Brazilian mangrove ecosystem. Estuarine, Coastal and Shelf Science 95: 447-457.
Giri, C., E. Ochieng, L.L. Tieszen, Z. Zhu, A. Singh, T. Loveland, J. Masek, and N. Duke. 2011. Status and distribution of mangrove forests of the world using earth observation satellite data. Global Ecology and Biogeography 20: 154-159.
Hajisamae, S., L.M. Chou, and S. Ibrahim. 2003. Feeding habits and trophic organization of the fish community in shallow waters of an impacted tropical habitat. Estuarine, Coastal and Shelf Science 58: 89-98.
Herbon, C.M., and I. Nordhaus. 2013. Experimental determination of stable carbon and nitrogen isotope fractionation between mangrove leaves and crabs. Marine Ecology. Progress Series 490: 91-105.
Hogarth, P. 1999. The Biology of Mangroves, 228 pp. New York. Hyslop, E.J. 1980. Stomach contents analysis—a review of methods and their
application. Journal of Fish Biology 17: 411-429. Igulu, M.M., I. Nagelkerken, G. van der Velde, and Y.D. Mgaya. 2013. Mangrove Fish
Production is Largely Fuelled by External Food Sources: A Stable Isotope Analysis of Fishes at the Individual, Species, and Community Levels from Across the Globe. Ecosystems 16: 1336-1352.
Kruitwagen, G., I. Nagelkerken, B.R. Lugendo, Y.D. Mgaya, and S.E.W. Bonga. 2010. Importance of different carbon sources for macroinvertebrates and fishes of an interlinked mangrove-mudflat ecosystem (Tanzania). Estuarine, Coastal and Shelf Science 88: 464-472.
Krumme, U. 2009. Diel and tidal movements by fish and decapods linking tropical coastal ecosystems. In Ecological Connectivity among Tropical Coastal Ecosystems, 271-324: Springer.
Laegdsgaard, P., and C. Johnson. 2001. Why do juvenile fish utilise mangrove habitats? Journal of Experimental Marine Biology and Ecology 257: 229-253.
Laegdsgaard, P., and C.R. Johnson. 1995. Mangrove habitats as nurseries: unique assemblages of juvenile fish in subtropical mangroves in eastern Australia. Marine Ecology Progress Series 126: 67-81.
Laroche, J., E. Baran, and N. Rasoanandrasana. 1997. Temporal patterns in a fish assemblage of a semiarid mangrove zone in Madagascar. Journal of Fish Biology 51: 3-20.
Lin, H.J., and K.T. Shao. 1999. Seasonal and diel changes in a subtropical mangrove fish assemblage. Bulletin of Marine Science 65: 775-794.
Lugendo, B., A. de Groene, I. Cornelissen, A. Pronker, I. Nagelkerken, G. van der Velde, and Y. Mgaya. 2007. Spatial and temporal variation in fish community structure of a marine embayment in Zanzibar, Tanzania. Hydrobiologia 586: 1-16.
Manson, F., N. Loneragan, G. Skilleter, and S. Phinn. 2005. An evaluation of the evidence for linkages between mangroves and fisheries: a synthesis of the
17

General Introduction
literature and identification of research directions. Oceanography and Marine Biology: an Annual Review 43: 483-513.
Marguillier, S., G. van der Velde, F. Dehairs, M. Hemminga, and S. Rajagopal. 1997. Trophic relationships in an interlinked mangrove-seagrass ecosystem as traced by δ 13C and δ 15N. Marine Ecology Progress Series 151.
McCutchan, J.H., Jr., W.M. Lewis, Jr., C. Kendall, and C.C. McGrath. 2003. Variation in Trophic Shift for Stable Isotope Ratios of Carbon, Nitrogen, and Sulfur. Oikos 102: 378-390.
Melville, A., and R. Connolly. 2003. Spatial analysis of stable isotope data to determine primary sources of nutrition for fish. Oecologia 136: 499-507.
Nagelkerken, I. 2009. Evaluation of Nursery function of Mangroves and Seagrass beds for Tropical Decapods and Reef fishes: Patterns and Underlying Mechanisms Ecological Connectivity among Tropical Coastal Ecosystems, 357-399: Springer Netherlands.
Nagelkerken, I., S.J.M. Blaber, S. Bouillon, P. Green, M. Haywood, L.G. Kirton, J.O. Meynecke, J. Pawlik, H.M. Penrose, A. Sasekumar, and P.J. Somerfield. 2008. The habitat function of mangroves for terrestrial and marine fauna: A review. Aquatic Botany 89: 155-185.
Nagelkerken, I., M. Dorenbosch, W.C.E.P. Verberk, E.C.d.l. Morinière, and G.v.d. Velde. 2000. Day-night shifts of fishes between shallow-water biotopes of a Caribbean bay, with emphasis on the nocturnal feeding of Haemulidae and Lutjanidae. Marine Ecology Progress Series 194: 55-64.
Nyunja, J., M. Ntiba, J. Onyari, K. Mavuti, K. Soetaert, and S. Bouillon. 2009. Carbon sources supporting a diverse fish community in a tropical coastal ecosystem (Gazi Bay, Kenya). Estuarine, Coastal and Shelf Science 83: 333-341.
Peterson, B.J., and B. Fry. 1987. Stable Isotopes in Ecosystem Studies. Annual Review of Ecology and Systematics 18: 293-320.
Pinnegar, J.K., and N.V.C. Polunin. 1999. Differential fractionation of δ13C and δ15N among fish tissues: implications for the study of trophic interactions. Functional Ecology 13: 225-231.
Polidoro, B.A., K.E. Carpenter, L. Collins, N.C. Duke, A.M. Ellison, J.C. Ellison, E.J. Farnsworth, E.S. Fernando, K. Kathiresan, and N.E. Koedam. 2010. The loss of species: mangrove extinction risk and geographic areas of global concern. PLoS One 5: e10095.
Post, D.M. 2002. Using Stable Isotopes to Estimate Trophic Position: Models, Methods, and Assumptions. Ecology 83: 703-718.
Quinn, N., and B. Kojis. 1987. The influence of diel cycle, tidal direction and trawl alignment on beam trawl catches in an equatorial estuary. Environmental Biology of Fishes 19: 297-308.
Robbins, C., L. Felicetti, and S. Florin. 2010. The impact of protein quality on stable nitrogen isotope ratio discrimination and assimilated diet estimation. Oecologia 162: 571-579.
18

Chapter I
Robertson, A., and N. Duke. 1987. Mangroves as nursery sites: comparisons of the abundance and species composition of fish and crustaceans in mangroves and other nearshore habitats in tropical Australia. Marine Biology 96: 193-205.
Robertson, A.A., and D.D. Alongi. 1992. Tropical Mangrove Ecosystems. Coastal and Estuarine Studies. 41: American Geophysical Union.
Robertson, A.A., and S.S. Blaber. 1992. Plankton, epibenthos and fish communities. Tropical Mangrove Ecosystems. Coastal and Estuarine Studies. 41-pages: 173-224 pp.
Rooker, J.R., and G.D. Dennis. 1991. Diel, lunar and seasonal changes in a mangrove fish assemblage off southwestern Puerto Rico. Bulletin of Marine Science 49: 684-698.
Sheaves, M. 1998. Spatial patterns in estuarine fish faunas in tropical Queensland: a reflection of interaction between long-term physical and biological processes? Marine and Freshwater Research 49: 31–40.
Sheaves, M. 2005. Nature and consequences of biological connectivity in mangroves systems.
Sheaves, M. 2012. Ecosystem equivalence and the ability to generalise: insights from global consistencies in mangrove fish assemblages. Marine Ecology Progress Series 461: 137-149.
Sheppard, C., M. Al-Husiani, F. Al-Jamali, F. Al-Yamani, R. Baldwin, J. Bishop, F. Benzoni, E. Dutrieux, N.K. Dulvy, S.R.V. Durvasula, D.A. Jones, R. Loughland, D. Medio, M. Nithyanandan, G.M. Pilling, I. Polikarpov, A.R.G. Price, S. Purkis, B. Riegl, M. Saburova, K.S. Namin, O. Taylor, S. Wilson, and K. Zainal. 2010. The Gulf: A young sea in decline. Marine Pollution Bulletin 60: 13-38.
Twilley, R.R., and J. Day. 1999. The productivity and nutrient cycling of mangrove ecosystem. Ecosistemas de manglar en América Tropical. Instituto de Ecología, AC México, UICN/ORMA, Costa Rica, NOAA/NMFS, Silver Spring MD, EUA. p: 127-151.
Vaslet, A., D.L. Phillips, C. France, I.C. Feller, and C.C. Baldwin. 2012. The relative importance of mangroves and seagrass beds as feeding areas for resident and transient fishes among different mangrove habitats in Florida and Belize: Evidence from dietary and stable-isotope analyses. Journal of Experimental Marine Biology and Ecology 434–435: 81-93.
Walters, B.B., P. Rönnbäck, J.M. Kovacs, B. Crona, S.A. Hussain, R. Badola, J.H. Primavera, E. Barbier, and F. Dahdouh-Guebas. 2008. Ethnobiology, socio-economics and management of mangrove forests: A review. Aquatic Botany 89: 220-236.
Wilson, J., and M. Sheaves. 2001. Short-term temporal variations in taxonomic composition and trophic structure of a tropical estuarine fish assemblage. Marine Biology 139: 787-796.
Zagars, M., K. Ikejima, A. Kasai, N. Arai, and P. Tongnunui. 2013. Trophic characteristics of a mangrove fish community in Southwest Thailand:
19

General Introduction
Important mangrove contribution and intraspecies feeding variability. Estuarine, Coastal and Shelf Science 119: 145-152.
20
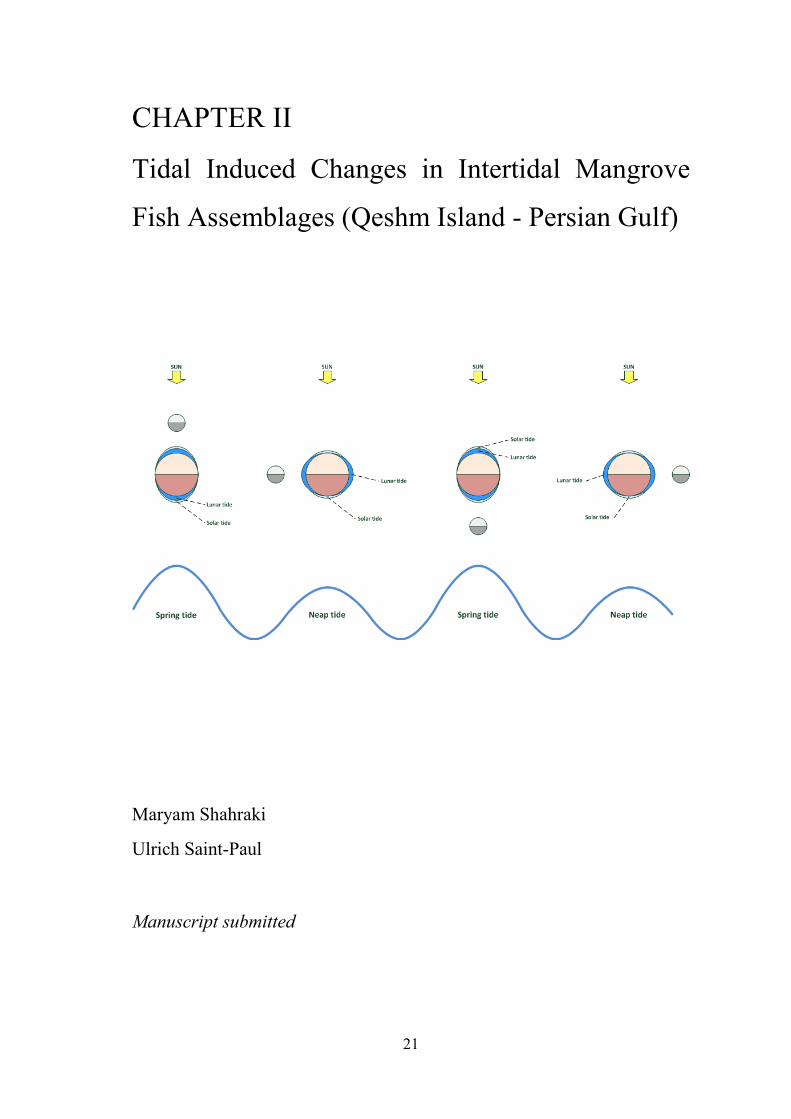
CHAPTER II
Tidal Induced Changes in Intertidal Mangrove
Fish Assemblages (Qeshm Island - Persian Gulf)
Maryam Shahraki
Ulrich Saint-Paul
Manuscript submitted
21

22

Chapter II
ABSTRACT
Fish disturbution patterns in relation to the tidal cycle is relatively unstudied in the Persian
Gulf. We investigated the role of temporal variations and creek topography in shaping fish
community structure in intertidal mangrove creeks in the Strait of Hormuz, Qeshm Island,
Iran (Western Indian Ocean). Block net sampling was carried out to examine the influence of
tide-time of day combinations and month in intertidal fish assemblage structure. The fish
assemblage (29 species) was dominated by Mugilidae (catch mass: 62%, abundance: 41%).
The number of species was significantly influenced by tide-time of day interactions and was
highest during nightly spring tide inundations, although the most abundant species occurred in
all creeks and months. Temporal variations in fish abundance and biomass were a function of
specific tide and time of day combinations, and high fish abundance and biomass were
observed during spring tide night. However, inconsistent monthly and creek-level patterns in
fish abundance and biomass per sample and per m2 were not considered ecologically robust.
Combined results from PERMANOVA and CAP confirmed that tide-time of day drove
changes in the structure of intertidal fish assemblage. Variations in fish assemblage structure
were closely related to changes in water temperature and high water level. High inundation
during spring tide coinciding with the darkness and cool water temperature provided
favorable condition for fish. These findings emphasize the importance of tidal and diel cycle
for fish habitat use in mesotidal mangroves in this low-rainfall ecosystem, and highlight that
spring tides provide fish with greater accessibility to intertidal habitats.
Key words Intertidal mangrove creeks, fish community, tidal cycle, Persian Gulf, Western
Indian Ocean
23

Tidal Induced Changes in Intertidal Mangrove Fish Assemblages
INTRODUCTION
Mangroves in the Persian Gulf are at the northern edge of mangrove distribution in the
Indian Ocean. They thrive under extreme conditions and are subjected to very low
rainfall and high salinities (Al-Khayat and Jones 1999). This harsh environment
restiricts mangrove diversity to two species in this arid region (Duke et al. 1998).
Worldwide, mangroves are considered important habitat for fish (Robertson and Duke
1990; Sasekumar et al. 1992). However, change in environmental variables causes
structural alteration in the dynamics of fish assemblages and consequently the
importance of the mangroves to fish population among systems. Despite the socio-
economic importance of mangrove forests in terms of associated fisheries, little is
known about the dynamics of fish assemblages in relation to the environmental
variables in the mesotidal coast of the Persian Gulf.
Many variables such as environmental attributes, prey availability and
predation avoidance have been suggested to determine fish habitat use of intertidal
mangrove creeks (Blaber 2000; Laegdsgaard and Johnson 2001). But the relative
importance of different environmental factors is variable among the biogeographical
regions (Blaber and Blaber 1980; Blaber 2002). Mangroves in meso/macro tidal coasts
are inundated and exposed by the alternating tidal cycle, and fish have to cope with
variations in habitat availability (Quinn and Kojis 1987; Rooker and Dennis 1991). In
the Caribbean, where tidal ranges are small, only few fish species respond to changes
in water level (Ellis and Bell 2008) and the diel cycle is the dominant rhythm driving
short-term changes in mangrove fish assemblages (Nagelkerken et al. 2000). Indo-
West Pacific mangroves, where the tidal range is large, fish accessibility to mangroves
is limited to periods of intertidal inundation (Wilson and Sheaves 2001; Weis et al.
2009). On coasts with larger tidal ranges, fish exploit temporarily accessible habitats
via tidal movements (Gibson 2003). Given the fact that the coasts of Persian Gulf are
subjected to mesotides, the regular changes in the water level may cause significant
variance in mangrove associated fish fauna as is known from other tidally-influenced
shallow water habitats of Kuwait Bay (e.g. Abou-Seedo et al. 1990; Wright et al.
1990). High-frequency trawls on a non-estuarine mud flat in Kuwait Bay showed the
strong influence of tidal condition on fish assemblage (Wright et al. 1990). In the
western Indo-Pacific, only few studies have examined how non-estuarine mangrove
fish assemblages are affected by the interactive influence of the tidal cycle. Laroche et
al. (1997) found strong lunar, tidal and diel interactions in a fish assemblage in a 24

Chapter II
semiarid mangrove in Madagascar (Laroche et al. 1997). How mesotides affect
intertidal mangrove fish assemblage structure, however, are still lacking for Gulf
mangroves communities.
Water height and flooding frequency are important factors that influence fish
composition and abundance in mangroves that are drained at low tide (Davis 1988;
Laegdsgaard and Johnson 1995). Along the Iranian coast of the Persian Gulf, generally
intertidal mangrove creeks are flooded during the high tide and become completely
exposed at low tide. However, intertidal creeks can be located on differing topographic
levels in a coastal plateau which affect the time of inundation during high water. Thus,
it is important to understand the role of the attributes of a creek, i.e. relative height in
the coastal plain, on fish habitat use in this region.
Mangroves in the Persian Gulf have been neglected with respect to studies of
fish population dynamics, and there is a need to assess the role of the mangrove habitat
for fisheries in this arid system. This study aimed to examine, for the first time,
temporal patterns of mangrove creek fish assemblage structure in the mesotidal coast
of Qeshm Island, Iran. Therefore, this paper addressed: (i) the taxonomic composition
of the intertidal mangrove fish fauna in this arid region, (ii) tidal and diel related
patterns on the structure of fish assemblages considering the relative height of the
creek in the coastal plain. Therefore, this study compliments a previous study in the
area assessing resource use, by contributing to the understanding of fish community
patterns in relation to changes in the abiotic variables. Furthermore, we hypothesized
that number of fish species, abundance and biomass differ in accordance with the
interaction of tide and time-of-day in mangrove intertidal creeks.
MATERIALS AND METHODS
Sampling sites
The study was carried out at Qeshm Island, Iranian coast of Persian Gulf (26.8°N,
55.75°E) (Fig. 1). Details of the study area can be found in (Shahraki et al. 2014). Four
mangrove-lined creeks, flowing into a main channel, were chosen as sampling sites to
test the fish creek use in relation to the tidal cycle. Creeks 2 and 3 were situated at a
lower topographic level and were larger in size (low-lying creeks) than Creeks 1 and 4.
Creeks 1 and 4 were located at a slightly higher topographical level of the intertidal
plateau and were smaller and shorter (high-lying creeks) (Fig. 1 and Fig. S1). High-
25

Tidal Induced Changes in Intertidal Mangrove Fish Assemblages
lying creeks were smaller and have a lower flooding frequency resulting in a reduced
time allowance for intertidal visitors than low-lying creeks.
Figure 1 Location of the study area in Qeshm Island, Strait of Hormuz, Iran (A); mangroves in light gray with the main channel and the 4 intertidal creeks (numbered dashed rectangles in B) (upper figure). Bathymetric map of high-lying creeks 1 and 4 (C), and low-lying creeks 2 and 3 (D).
Sampling design
Fish were sampled from the four intertidal creeks with four block nets (15 - 25 m in
length, 4 m high; 12 mm stretched mesh size) lifted simultaneously at slack high water
during three lunar cycles in December 2011 - January 2012, February - March 2012
and August- September 2012. The block net method is commonly used for fish
collection in mangroves studies e.g. in South Florida and Brazil (Thayer et al. 1987;
26
Chapter II
Barletta et al. 2003); and this method is regarded as highly efficient in capturing the
identity of fish fauna using intertidal habitats (Bozeman and Dean 1980).
Overall 96 block net samples were taken (4 intertidal mangrove creeks x 3
lunar cycles x 4 lunar phases x 2 times of day). Fish sampling accounted for the four
most important combinations of tidal amplitude (and lunar phase) and daylight
conditions: spring tide-night (SN; new moon/full moon-night), spring tide-day (SD;
new moon/full moon-day), neap tide-night (NN; wax/wane moon-night) and neap tide-
day (ND; wax/wane moon-day). Lunar phases were considered as replicates for spring
and neap tide. SN and NN sampling took place in the early morning when fishes had
entered the creeks during the nightly flood tide and were leaving in the morning ebb
tide. SD and ND sampling were carried out in the evening when fishes had entered
with the afternoon flood tide and were leaving in the first part of the night. The time of
each sampling were chosen according to the tide tables for the area
(http://217.218.133.169/hydrography/DrawChart.aspx).
Fish were collected during low tide and transported on ice to the laboratory.
The high-lying creeks were dried out at each tide. However, the low-lying creeks were
inundated at neap low tide. In this instance, a small hand net was used to collect all the
fishes behind the block nets. Collected fishes were identified to the lowest possible
taxonomic level (Fischer and Bianchi 1984; Kuronuma and Abe 1986; Assadi et al.
1997), counted and wet-weighed (g ± 0.1). Fish total length was analyzed in class
intervals of 2.5 cm, except for six large-sized species (see species name with asterisks,
Table 1) where a 10 cm class interval was used.
For each sampling event, surface water temperature was measured (WTW
Multi 3430); and tidal height was recorded at the mouth of the creeks at high water
(tidal gauge). pH values were 8.1±0.2 and salinity averaged 38.3±0.5 throughout the
sampling period, suggesting a stable non-estuarine mangrove environment (Table S1).
The visibility of the water measured by Secchi Disk was 52±2 cm. Additionally, a
HOBO water data level logger (U20-001-01-Ti) was used to assess the interaction
between water level changes and water temperature in the main mangrove channel in
August (HOBO did not operate in December and February). This device measured
water pressure (±0.6 KPa) and temperature (±0.44°C) every 15 minutes resulting in
information about changes in the approximate water height and temperature over
several spring and neap tide cycles.
27

Tidal Induced Changes in Intertidal Mangrove Fish Assemblages
Bathymetric surveys of the creeks were carried out at the end of the sampling
period to assess the local topography with respect to tidal inundation and drainage
patterns. The survey included measuring water levels at horizontal transects for each
creek and drawing approximate inundation areas on a grid map in the field. This
information was introduced to GIS software to produce a bathymetric map of each
creek (Fig. 1). Relationships between high water level and inundated area and volume
were established to standardise catch numbers and weights to density and biomass,
respectively. Abundance and biomass for each species per sample were converted to
abundance and biomass per m2 by dividing total values by respective inundation area
for each creek.
Creek attributes
The area was characterized by a plateau mangrove where the mangrove forest is
flooded only during spring tides. Average tidal range is ~ 2.5 m in the study area. The
low-lying creeks were characterized by having greater water depths (0.37 m ± 0.2 SD)
and greater time of inundation during high water periods when compared to the high-
lying creeks. GIS generated water surface and volume indicated that the relationship
between surface area, volume and intertidal water level increased slowly until
approximately 1 -1.5 m water level rise at the mouth of the creeks and inundation was
still restricted to the creek network. Beyond 2 m water level rise, the water left the
creek network and the mangrove plateau became flooded (Fig. S2).
Data analysis
We used the EstimateS software to produce the rarefaction curves and estimates of
species richness for each creek (Colwell 2009). Species richness between the factors
month and tide-time of day combination (SN, SD, NN, ND) were analyzed with
Kruskal-Wallis One Way Analysis of Variance on Ranks (for each factor), followed by
a Tukey test in SigmaPlot 12.5. The Shapiro-Wilk test was used to test for normality.
The effect of water conditions on intertidal fish abundances or biomass was
assessed with four-way permutational multivariate analysis of variance
(PERMANOVA) model. Factors included: location (fixed, two levels: high-lying and
low-lying creeks), creek nested in location (random, four levels: 1, 2, 3, 4), tide-time of
day combination (fixed, four levels: SN, SD, NN, ND) and month (fixed, three levels:
December, February, August). Additionally, differences among factors were analyzed 28

Chapter II
with pairwise comparisons and in the case of factor location, Monte-Carlo generated p-
values were used because there were inadequate unique permutations possible to
determine permutational p-values (Anderson et al. 2008). Canonical analysis of
principal coordinates (CAP) was applied as a constrained ordination procedure to
visualize patterns revealed by PERMANOVA. The species responsible for differences
were identified based on the strength of their correlation (|r|>0.4) with the CAP axes.
Analyses were performed on square-root transformed data and based on Bray-Curtis
distances. It should be noted that the abundance and biomass comparisons were made
on both a per m2 basis and on a per sample basis, with the per m2 comparisons more
appropriate if fish were resident, and the per sample comparisons more appropriate if
fish were transient. Because fish communities likely represent a mix of residents and
transients, we considered comparisons ecologically robust when significant differences
were found in parallel and significant for both ways of expressing the data (e.g., results
were considered ecologically robust when abundance was higher both on a per m2
basis and also on a per sample basis). Alternatively, if abundance (or biomass) results
were not parallel and significant when expressed on a per m2and a per sample basis,
results were not considered ecologically robust.
Pearson correlation tests were used to test whether HWL and surface water
temperature correlated with intertidal fish abundance and biomass per sample in
Statistica 11.
RESULTS
Species composition and richness
A total of 5954 individuals from 29 fish species and 22 families were caught by 96
block net samples. Half of the species (15 of 29 species) were abundant with 10 or
more individuals. The most speciose families were Clupeidae (4 species), Haemulidae,
Sparidae, Lutjanidae, and Gobiidae (2 species each). Most abundant species were Liza
klunzingeri (Mugilidae) (41%), Leiognathus daura (Leiognathidae) (18%), Pentaprion
longimanus (Gerreidae) (10%), Thryssa vitrirostris (Engraulidae) (8%), and all other
species accounted for the remaining 20% of the total abundance, each with less than
5%. In terms of catch mass, L. klunzingeri (62%), T. vitrirostris (8%) and
Acanthopagrus latus (Sparidae) (5%) made up 75% of the catch (Table 1). The most
abundant species (relative abundance of >0.1) occurred in all creeks (Table 1). Also, a
general similarity in the diversity patterns was indicated in the spatial comparisons of 29

Tidal Induced Changes in Intertidal Mangrove Fish Assemblages
Figure 2 because the observed number of species was similar at 16-20 species when
800 individuals were considered for comparisons between creeks.
Figure 2 Individual-based rarefaction curves of fish species caught in four mangrove-lined creeks sampled at different combinations of the tidal and diel cycle during 3 months (December 2011, February and August 2012) in Qeshm Island, Iran. Dashed lines indicate 95% confidence intervals.
30

Chapter II
Table 1 Fish species composition from 4 intertidal mangrove creeks of Qeshm Island collected during three lunar cycles in December 2011-January 2012, February-March 2012 and August-September 2012, accounting for the four tidal and diel combinations of spring-day (SD), spring-night (SN), neap-day (ND), and neap-night (NN). Fish species sorted decreasing by total number of individuals (N). Relative abundance (RA), relative biomass (RB) and biomass per sample is shown for tide-time of the day, month and creek. Asterisks symbols indicate large-sized species.
Species Size N RA% RB% Tide-time of day Month Creek
SN SD NN ND Dec. Feb. Aug. C1 C2 C3 C4
Liza klunzingeri (Mugilidae) 5-20 2443 41 62 64248 9631 9079 9954 67140 13501 12270 10571
29464
48099 4777
Leiognathus daura (Leiognathidae) 5-12.5 1057 18 3 2704 1081 3487 22.5 857 2475 979 366.
9 1665 1445 833.9
Pentaprion longimanus (Gerreidae) 5-12.5 577 10 4 1373.5 3214 964.5 754 2316 1506 2025 1160 3003 745.5 937.
5 Thryssa vitrirostris (Engraulidae) 10-15 468 8 8 7757.7 167 773 472 565.5 4397 6921 844.
7 2994 6225 1820
Scatophagus argus (Scatophagidae) 2.5-10 302 5 2 1000.6 266.5 505.5 683 876.5 170 1428 158.
5 1109 964.2 243.1
Acanthopagrus latus (Sparidae) 5-15 257 4 5 4097.8 2802 286 69.5 3937 1235 2761 1686 2119 2132 1997
Anodontostoma chacunda (Clupeidae) 5-10 188 3 2 859 1696 504 361 922 1566 454 122 461 2214 145
Sarinella longiceps (Clupeidae) 5-10 166 3 1 0 327 26 1567 7 1915 0 27 1228 0 667
Pomadasys kaakan (Haemulidae) 5-10 161 3 3 3632.5 565 0 13.5 3193 318 986 1615 805.2 1239 837.
6 Sardinella gibbosa (Clupeidae) 5-10 120 2 1 220 777 524.8 35 5 1027 0 35 232 20 745
Lutjanus johni (Lutjanidae) 5-15 73 1 4 5488 65.5 28 11 4354 820 1164 315 2640 2682 701 Ilisha melastoma (Clupeidae) 5-10 53 1 0 77.5 287 0 3 67 288 17.5 22.5 78 247 25
Sillago sihama (Sillaginidae) 10-17.5 18 0 0 192 205 600 0 276 216 132 101 294 89 140
Pseudorhombus elevatus (Paralichthyidae) 10-15 15 0 0 120 0 0 215 0 335 0 0 15 320 0
Plectorhinchus pictus (Haemulidae) 5-15 13 0 0 253 74 227 0 30 0 397 158 84 30 155
Scartelaos tenuis (Gobiidae) 5-10 8 0 0 31 0 100 47.5 17 39 82.5 30.5 69 24 15
31

Tidal Induced Changes in Intertidal Mangrove Fish Assemblages
Species Size N RA% RB% Tide-time of day Month Creek
SN SD NN ND Dec. Feb. Aug. C1 C2 C3 C4 Lutjanus russelli (Lutjanidae) 10-15 6 0 0 0 7.5 0 0 0 80 7.5 0 87.5 0 0 Platycephalus indicus (Platycephalidae)* 20-30 5 0 2 1200 0 5 1650 2300 0 550 0 250 2300 300
Bathygobius fuscus (Gobiidae) 5-10 5 0 0 24 0 0 67 53 38 0 0 31 0 60
Scomberoides lysan (Carangidae) 5-10 5 0 0 0 18 60 49.5 0 0 67.5 0 21.5 46 0
Eleutheronema tetradactylum (Polynemidae)* 20-30 3 0 0 7 0 0 7 0 59 0 0 20 0 39
Sphyraena putnamiae (Sphyraenidae)* 20-30 2 0 1 38.8 0 0 600 600 0 638.8 600 0 638.8 0
Epinephelus coioides (Serranidae)* 30-40 2 0 1 1400 0 0 200 1400 0 200 1600 0 0 0
Strongylura stronglura (Belonidae) 10-15 2 0 0 130 0 80 0 0 130 0 0 0 130 0
Pseudosynanceia melanostigma (Synanceiidae)*
20-30 1 0 0 395 0 0 0 395 0 0 0 261 40 94
Abalistes stellatus (Balistidae)* 20-30 1 0 0 16 0 45 0 0 16 0 16 0 0 0
Acanthopagrus cuvieri (Sparidae) 15-20 1 0 0 2 109 0 0 0 4 107 0 47 4 60
Hemiramphus archipelagicus (Hemiramphidae) 12.5-15 1 0 0 55 0 0 0 0 0 55 0 55 0 0
Upeneus sulphureus (Mullidae) 10-15 1 0 0 2.5 0 0 0 0 0 2.5 0 0 0 2.5
Asterisks indicate large-sized species.
32
Chapter II
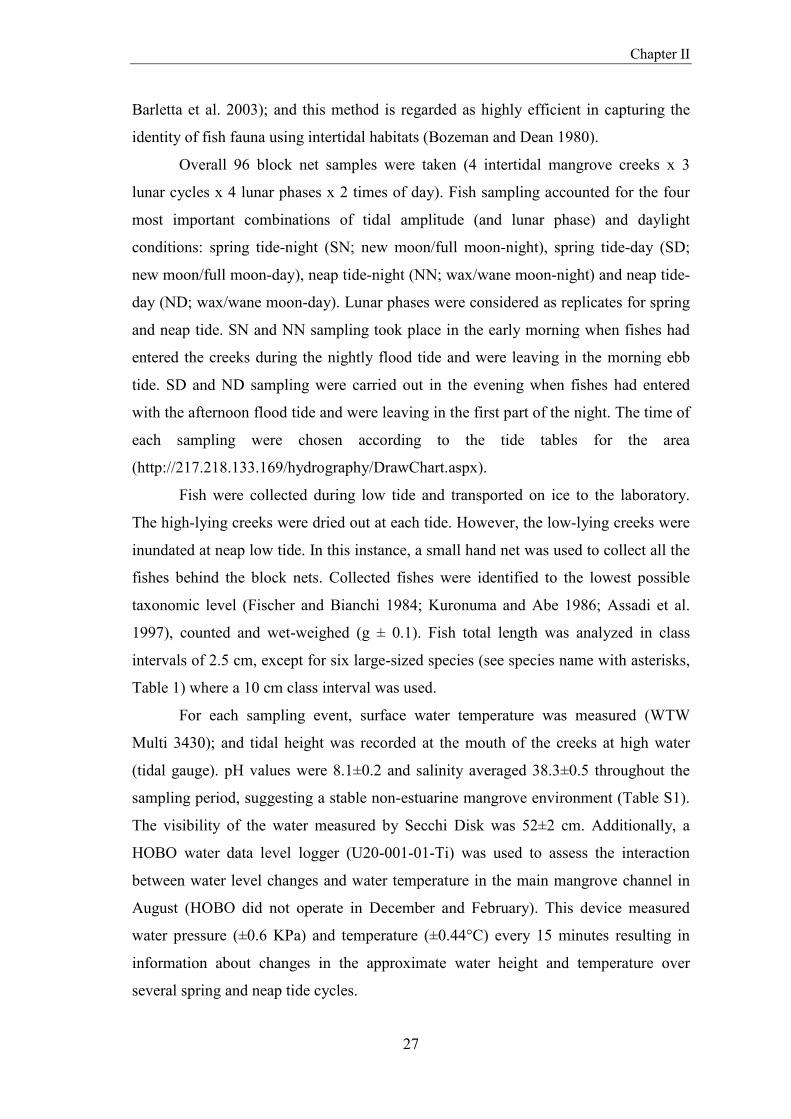
Species richness differed between tide-time of day (KW- H=32.7, P=<0.001; Tukey’s
test, SN > NN and ND) and between months (KW- H=6.06, P=0.04; Tukey’s test; Aug>Dec).
Significantly more species were captured at SN, and ND was responsible for the lowest
species numbers (Fig. 3). The median number of species at SN was 7 (the 25th and 75th
percentiles was 6-8), while for the other tide and time combinations the median ranged
between 4-5 (Fig. 3).
Figure 3 Median number of fish species captured at spring tide night, spring tide-day, neap tide-night and neap tide-day and three months (December 2011, February and August 2012) in intertidal mangrove creeks at high water (n=96 samples). The 25 to 75% quartiles and minimum and maximum values are shown.
The median numbers of species were 4, 5 and 6 for the Dec, Feb and Aug, respectively
(Fig. 3). Detailed species data showed the presence/absence differences among months and
tidal and diel cycle. For example, S. longiceps was not found at SN. P. kaakan and I.
Melastoma did not occur at NN. Also, some rare species with the relative abundance of <0.1,
e.g. U. sulphureus, H. archipelagicus and P. melanostigma occurred mostly at SN (Table 1).
Five species were caught in high biomass during spring tide night: L. klunzingeri, T.
vitrirostris, A. latus, P. kaakan and L. johni. S. longiceps and S. gibbosa (Clupeidae) were
absent in August. However, the monthly variations in species richness were mostly related to
the occasional migrant, e.g. S. lysan, H. archipelagicus and U. sulphureus only occurred in
August, P. elevatus, E. tetradactylum, S. stronglura, A. stellatus, A. cuvieri found in Feb and
P. melanostigma in December. The most abundant species changed rank between months
(Fig. S3).
33

Tidal Induced Changes in Intertidal Mangrove Fish Assemblages
Table 2 Results of 4-way PERMANOVA testing the effects of location (high and low-lying creeks), creeks (Creek 1, 2, 3, 4) nested in location, tide-time of day combination (spring tide day, spring tide night, neap tide day, neap tide night), and month (December, February, August) on biomass and abundance per sample and per m2. Difference were considered to be significant when P < 0.05 (bold values).
Abund. per m2 df SS MS Pseudo-F P(perm) perms P(MC) Biomass per m2 df SS MS Pseudo-F P(perm) perms P(MC) Location 1 2538.4 2538.4 0.4883 1 3 0.853 Location 1 2008.9 2008.9 0.4784 1 3 0.862 Month 2 22397 11199 6.249 0.008 998
Month 2 18768 9384.1 5.4654 0.003 995
Tide 3 32421 10807 5.9633 0.001 999
Tide 3 35670 11890 6.3456 0.001 999 Creek (Location) 2 10397 5198.5 2.7903 0.001 999
Creek (Location) 2 8398.2 4199.1 2.1301 0.006 997
LocationxMonth 2 4422.6 2211.3 1.2339 0.358 999
LocationxMonth 2 3577.8 1788.9 1.0419 0.458 999 LocationxTide 3 4365.5 1455.2 0.80295 0.68 998
LocationxTide 3 4276.8 1425.6 0.76082 0.748 997
MonthxTide 6 23034 3839 2.6898 0.001 996
MonthxTide 6 26027 4337.8 2.9852 0.001 998 Creek(Location)xMonth 4 7168.3 1792.1 0.9619 0.535 998
Creek(Location)xMonth 4 6868 1717 0.87097 0.654 997
Creek(Location)xTide 6 10874 1812.3 0.97274 0.514 997
Creek(Location)xTide 6 11243 1873.8 0.95049 0.583 997 LocationxMonthxTide 6 7861.4 1310.2 0.918 0.584 999
LocationxMonthxTide 6 8350.5 1391.7 0.95777 0.546 999
Creek(Location)xMonthxTide 12 17127 1427.3 0.76609 0.92 997
Creek(Location)xMonthxTide 12 17437 1453.1 0.73711 0.969 997 Residual 48 89427 1863.1
Residual 48 94625 1971.4
Total 95 232030
Total 95 237250 Abund. per sample df SS MS Pseudo-F P(perm) perms P(MC) Biomass per sample df SS MS Pseudo-F P(perm) perms P(MC)
Location 1 4423.8 4423.8 1.3206 0.346 3 0.293 Location 1 4384.5 4384.5 1.497 0.335 3 0.219 Month 2 21330 10665 6.2234 0.004 999
Month 2 17265 8632.5 5.0643 0.01 997
Tide 3 33799 11266 6.031 0.001 998
Tide 3 34244 11415 6.2851 0.001 999 Creek (Location) 2 6699.7 3349.9 1.8168 0.036 998
Creek (Location) 2 5857.6 2928.8 1.4733 0.093 999
LocationxMonth 2 4749.1 2374.5 1.3856 0.251 999
LocationxMonth 2 4081.9 2040.9 1.1973 0.347 997 LocationxTide 3 5196.3 1732.1 0.92722 0.575 999
LocationxTide 3 5354.2 1784.7 0.9827 0.506 999
MonthxTide 6 22529 3754.8 2.62 0.001 997
MonthxTide 6 26243 4373.8 2.9337 0.001 995 Creek(Location)xMonth 4 6854.7 1713.7 0.92943 0.561 999
Creek(Location)xMonth 4 6818.3 1704.6 0.85747 0.728 995
Creek(Location)xTide 6 11208 1868.1 1.0132 0.446 998
Creek(Location)xTide 6 10897 1816.1 0.9136 0.64 999 LocationxMonthxTide 6 8882.7 1480.5 1.033 0.467 998
LocationxMonthxTide 6 9739.9 1623.3 1.0888 0.354 998
Creek(Location)xMonthxTide 12 17198 1433.1 0.77728 0.934 996
Creek(Location)xMonthxTide 12 17891 1490.9 0.74998 0.965 996 Residual 48 88502 1843.8
Residual 48 95419 1987.9
Total 95 231370
Total 95 238200
34

Chapter II
Spatio-Temporal patterns
PERMANOVA results for the effect of month were highly significant (Table 2). But the
pairwise tests were non-significant in all monthly comparisons (t<4.3, P<0.05). Also,
inconsistent patterns in abundance and biomass per sample and per m2 indicated that month
cannot be considered as significant factor (Fig. 4).
Figure 4 Mean abundance and biomass per sample and per m2± 1SE of fishes during different months: December 2011, February and August 2012 from intertidal mangrove-lined creeks in Qeshm Island, Iran.
Highest abundance and biomass per sample and per m2 were observed at SN (Fig. 5).
Also, tidal and diel variations were strong in PERMANOVA results with P<0.001 (Table 2).
The pairwise comparisons for abundance and biomass per sample and per m2 showed higher
values at SN compared with ND (t>3.1, P>0.05). While the tide-time of day combination had
a strong effect on the fish assemblage composition, the effect was not constant between
months (Fig. S4). For instance, unlike other NN conditions, high biomass per sample and per
m2 and abundance per m2 occurred at NN in February. However, this pattern was not observed
35

Tidal Induced Changes in Intertidal Mangrove Fish Assemblages
for abundance per sample. Thus, the interaction between months and tides cannot be
considered ecologically robust, despite being significant in the PERMANOVA (Table 2).
Figure 5 Mean abundance and biomass per sample and per m2± 1SE of fishes at different combinations of the tidal-diel cycle: spring tide-night (SN), spring tide-day (SD), neap tide-night (NN), neap tide-day (ND) from intertidal mangrove-lined creeks in Qeshm Island, Iran.
Mean abundance and biomass per sample were higher at the low-lying creeks (2, 3)
but inconsistent patterns were observed when the biomass and abundance referred to m2.
PERMANOVA tests showed that all the location differences were insignificant (Monte-Carlo
p values>0.05). Creek-level (nested in location) variations were significant in PERMANOVA
results at the 0.006-0.03 level in three of four cases (Table 2). But the creek level variations
did not consider ecologically robust because the pattern was not consistent between creeks
(Fig. S5).
Further examination of the significant factors in the PERMANOVA test (for the
factors that were significant in all four cases (abundance and biomass per sample and per m2),
with the CAP routine, indicated smaller canonical correlation coefficients for the factor month
36

Chapter II (Table S2); CAP only allocated the samples according to the factor tide and time of the day
(Fig. 6). The CAP plot showed that A. latus, L. daura and T. vitrirostris were correlated with
the spring tide. P. longimanus was correlated with the neap tide (Fig. 6).
Figure 6 Canonical analysis (CAP) yielded two axes regarding factor tide-time, with squared canonical correlations of δ1
2 =0.68 and δ2
2=0.40. Symbols represent individual biomass per sample and vectors show individual species correlations with the 2 CAP axes where |r |>0.4. See Table 1 for full species names.
Total abundance and biomass were significantly, positively, related to the high water
level (R=0.4 and 0.2, N=96, P<0.05) and negatively correlated to the surface water
temperature (R=-0.09 and -0.1, N=96, P<0.05).
DISCUSSION
Fish assemblage structure of Qeshm mangrove was characterized by low diversity. This could
be explained by low habitat diversity and lack of other near shore habitats e.g. seagrass beds
and coral reef in the vicinity of the mangroves (Pittman et al. 2004; Blaber 2007). Relatively
high salinities and temperatures that prevail much of the year at the study area might also
-0.3 -0.2 -0.1 0 0.1 0.2 CAP1
-0.2
-0.1
0
0.1
0.2
C A
P 2
A. latus
P. longimanus
T. vitrirostris
L. daura
Spring-Night Neap-Night
Spring-Day Neap-Day
37
Tidal Induced Changes in Intertidal Mangrove Fish Assemblages
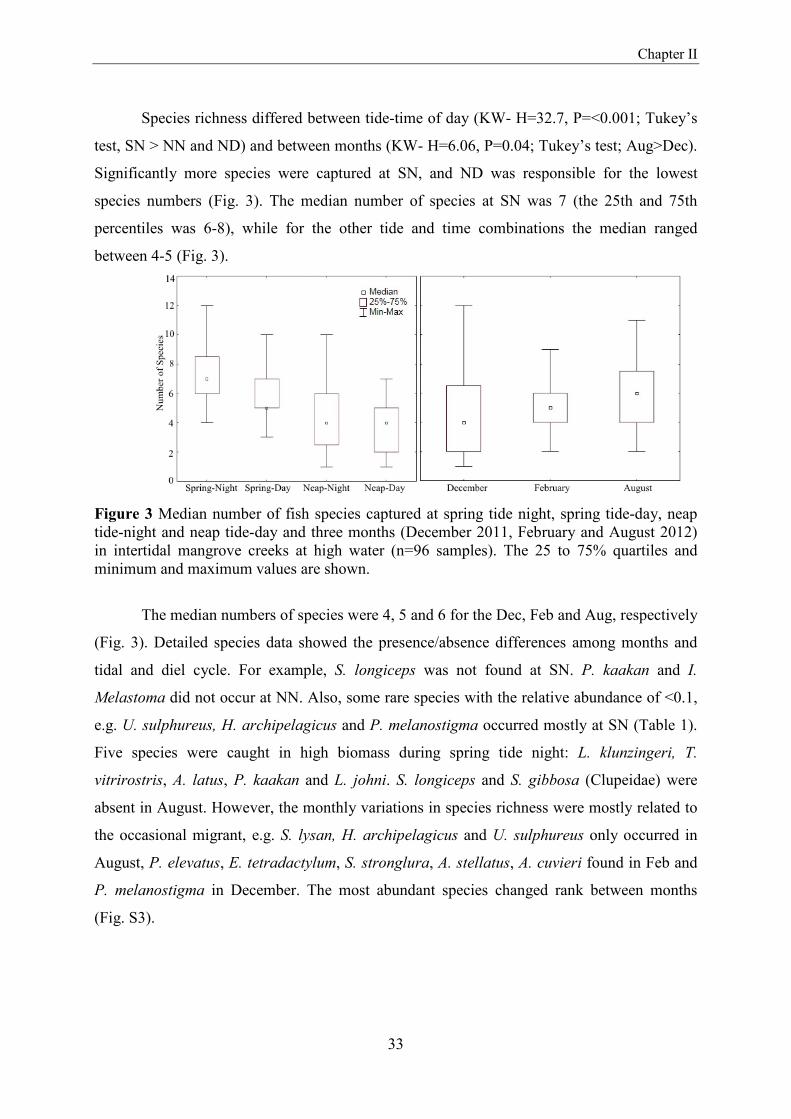
influence species richness. The number of fish species in the mangrove intertidal creeks in
Qeshm Island was lower than in other comparable intertidal shallow water habitats in the
Western Indian Ocean (Table 3), despite covering the major short and mid-term time scales in
this study. For example, intertidal fish communities were represented by 50 species in non-
estuarine Sulaibikhat Bay, in Kuwait (Wright 1989). Also, 60 and 44 species were reported
from the mangrove creeks in Madagascar and Zanzibar, respectively (Laroche et al. 1997;
Lugendo et al. 2007). In contrast, high species diversity has been viewed from the Kenyan
mangrove where the seagrass bed occurred in close vicinity of mangroves (Kimani et al.
1996). However, differing sampling methods and efforts hinder direct comparisons. At a
global scale, the low species diversity in the study area agrees with the standard species
gradient from the center of shallow water species richness in the coral triangle (Blaber 2000;
Carpenter and Springer 2005).
Table 3 Comparison of the number of species and families from different intertidal shallow water habitats in the Western Indian Ocean; studies sorted according to marine biogeographical regions and descending by the year of study.
Western Indian Ocean Sampling method
Habitat type Species (Families)
Abundant fish families
East Africa
Gazi Bay, Kenya1 beach seine Mangrove &seagrass 128 (50) Atherinidae, Clupeidae and Gerreidae
Sarodrano mangrove, Madagaascar2 Gillnet Mangrove creek 60 (35)
Gerreidae and Teraponidae
Chwaka Bay, Zanzibar3 seine net Mangrove creeks and chanles
Mangrove creek (44) Mangrove chabnnel (62)
Ambassidae, Apogonidae and Gerreidae
Gulf Region Sulaikhat Bay, Kuwait4 Otter trawl Intertidal &subtidal 46(28) Mugilidae and
Haemulidae Sulaikhat Bay, Kuwait5 Otter trawl Intertidal &subtidal 50 (30) Mugilidae,
Haemulidae and Leiognathidae
Kuwait Bay6 Otter trawl Intertidal &subtidal Period 1: 37 (29)
Period 2: 38 (29) Leiognathidae, Ariidae and Soleidae
Kuwait Bay7 Trawl &Seine Mud flat and sandy beaches
37 (22) Engraulidae and Gobiidae
Qeshm Island, Iran (persent study) Block net Mangrove 29 (21) Mugilidae and
Leignathidae 1-Kimani et al (1996); 2-Laroche et al (1997); 3-Lugendo et al (2007); 4-Wright (1988); 5-Wright (1989); 6-Wright et al (1990); 7-Abou-Seedo et al (1990)
38

Chapter II
In this study area, Mugilidae, Leiognathidae and Engraulidae dominated in
terms of abundance. Mugilidae were also an abundant family along the coast of Gulf
region (Wright 1988), suggesting that mullets are dominant in shallow-water intertidal
habitats in the Gulf region (Table 3). Also, the dominant species made up more than
75% of the total abundance and biomass. Similarly, other mangrove fish studies
showed that many fish visited the mangrove but few species are dominant (Bell et al.
1984; Little et al. 1988; Chong et al. 1990) this supporting a general notion that higher
complexity and shelter of mangroves attract more fish species.
Species richness differed between months in the low-rainfall mangroves of
Qeshm Island, but differences were mostly related to the seasonally vagrant species
while the highly abundant species were found during all months. This could be linked
to very low precipitation and lack of fresh water input resulting in year-round hyper
saline conditions with low allochthonous nutrient input. Conversely, in other semiarid
and arid mangroves in Madagascar and Mexican Pacific coast, high species richness
was reported in the warm and rainy season (Laroche et al. 1997; González-Acosta et
al. 2005). Also, high food availability in the wet season explained as a reason for high
species richness from the humid mangroves (Ikejima et al. 2003). This suggests that
rainfall regime may play a determinant role in low species diversity in this study area.
Tide emerged as an important and significant factor in the analyses of fish
communities. The results demonstrated that the numbers of species, abundance and
biomass were highest at nightly spring tide inundations. However, species did not
avoid low tide and most abundant species were found in both spring and neap tides,
except S. longiceps that correlated strongly with the neap tide. Qeshm Island presents
mangroves where much larger intertidal areas are inundated at spring than at neap
tides. Higher number of species during the night spring tide could be driven by higher
water level and inundation time that may attract more species in the intertidal
mangrove creeks. It has been observed that most fish using the tidal creeks at high tide
move into main tidal channel during low tide to avoid exposure to air (Barletta and
Saint-Paul 2010). Moreover, the high water could facilitate the movement of fish into
the creeks, thus the fish may rely on the tide for transport (Davis 1988).
Tide-diel related changes in fish assemblages also correlated with different
water temperature dynamics in the creeks during spring and neap tides. This could be
explained by different combination of high and low water level and time (day and
night) that influenced SD, SN, NN and ND water temperature. But the inter-correction 39

Tidal Induced Changes in Intertidal Mangrove Fish Assemblages
of these factors (water height and water temperature) is not justifiable with the
statistics. The results of the HOBO water level logger, operated in August, showed that
the water temperature cooled during the nightly low water and heated during the
daytime low water period, with higher daytime values at spring (up to 36°C) than at
neap tide (33.5°C). Lowest water temperatures were measured during nightly neap tide
low water (31°C) (Fig. S6). Therefore, smaller water temperature ranges during SN
provided better conditions because of the converging of a high level of intertidal
inundation and low water temperatures.
Similarly, in meso/macro tidal coasts of Australia, more fish use the intertidal
area during spring tide rather than neap tide (Laegdsgaard and Johnson 1995; Wilson
and Sheaves 2001). Likewise, in the macrotidal mangrove in northern Brazil, catch
weight of fish entering intertidal mangrove creeks were highest during spring tides
(Krumme et al. 2004; Krumme and Saint-Paul 2010). But in the microtidal coast of
Curaçao and Florida, the mangrove habitats are continuously available for fish
resulting in a lack of pattern in fish community structure according to tidal cycle (Ley
and Halliday 1999; Nagelkerken et al. 2001). The diel cycle is the major rhythm
driving short-term changes in mangrove fish assemblages in non-estuarine system of
Caribbean Sea (Nagelkerken et al. 2000). Also, catches were greater during the night
on the falling tide than the rising tide while the day catches were greater on the falling
tide than the rising tide in intertidal mudflat in the Gulf region (Abou-Seedo et al.
1990). Also, tidal and diel patterns on species diversity were mostly species-specific in
Qeshem mangroves. Lutjanidae (L. johni) was mainly caught at SN yet this family was
largely absent during the day. It is assumed that Lutjanidae are nocturnal so to reduce
risk of predation, and also because of higher activity of their potential prey (i.e.
crustaceans) (Hobson 1965).
Lastly, fish habitat use was greater in the low-lying creeks (C2 and C3) with
regard to the biomass and abundance per sample. The longer inundations in the low-
lying creeks may provide greater habitat accessibility and consequently lead to longer
foraging periods for the fish. But the disproportional increases in the water surface and
the volume of water of low-lying creeks indicated inconsistency in fish biomass and
abundance per sample and per m2. Nevertheless, the findings indicate that interaction
of tide (spring and neap) with day-night cycles can explain the organization of fish
assemblages using intertidal mangroves creeks in mesotidal coasts of Qeshm Island.
Greater habitat use by fishes during spring tide night could be related to the cooler 40

Chapter II
water temperature at night and also spring tide provides longer foraging time for
fishes. Thus, tides can be considered as a determinant of fish habitat use in the
mesotidal coast of the Persian Gulf.
ACKNOWLEDGEMENTS
The authors thank H. Shahraki for assistance in the field and lab work, the fisherman
Saleh Sharifi and his family for assistance during the field work, and M. Dianat
(Payamnoor University, Qeshm island branch), M. Golshani, M. Barani and M.
Parvaresh (Iranian fisheries organization) for logistical support. T. Brey and U.
Krumme provided comments on the earlier version of this manuscript. M. S. has been
supported by the German National merit foundation scholarship (Studienstiftung des
deutschen Volkes). This work was supported by `the Leibniz Center for Tropical
Marine Ecology (ZMT) project number 7109' and `GLOMAR - Bremen International
Graduate School for Marine Sciences'. J. Petersen provided assistance with GIS
software to develop 3-dimensional maps of the creeks. Special thanks go to B. Clarke
for the advice on PERMANOVA design. J. Plass-Johnson kindly proofread the
manuscript.
Supplementary data is given in Annex I
REFERENCES
Abou-Seedo, F., D. Clayton, and J.M. Wright. 1990. Tidal and turbidity effects on the
shallow-water fish assemblage of Kuwait Bay. Marine ecology progress series
65:213-223.
Al-Khayat, J.A., and D.A. Jones. 1999. A Comparison of the Macrofauna of Natural
and Replanted Mangroves in Qatar. Estuarine, Coastal and Shelf Science 49,
Supplement 1: 55-63.
Anderson, M., R. Gorley, and K. Clarke. 2008. UK: PRIMER-E, Plymouth.
PERMANOVA+ for PRIMER: guide to software and statistical methods: 214.
Assadi, H., R.D. P, M. Jahanbakhsh, I.F. Research, and T. Organization. 1997. Atlas of the Persian Gulf & the Sea of Oman fishes: Iranian Fisheries Research and Training Organization.
Barletta, M., A. Barletta-Bergan, U. Saint-Paul, and G. Hubold. 2003. Seasonal changes in density, biomass, and diversity of estuarine fishes in tidal mangrove
41

Tidal Induced Changes in Intertidal Mangrove Fish Assemblages
creeks of the lower Caeté Estuary (northern Brazilian coast, east Amazon). Marine Ecology Progress Series 256: 217-228.
Barletta, M., and U. Saint-Paul. 2010. Distribution pattern of fish in a mangrove estuary. In Mangrove Dynamics and Management in North Brazil, 171-188: Springer.
Bell, J., D. Pollard, J. Burchmore, B. Pease, and M. Middleton. 1984. Structure of a fish community in a temperate tidal mangrove creek in Botany Bay, New South Wales. Marine and Freshwater Research 35: 33-46.
Blaber, S.J. 2000. Tropical estuarine fishes. ecology, exploitation, and conservation. Blackwell, Oxford.
Blaber, S.J. 2007. Mangroves and fishes: issues of diversity, dependence, and dogma. Bulletin of Marine Science 80: 457-472.
Blaber, S.J.M. 2002. Fish in hot water: the challenges facing fish and fisheries research in tropical estuaries. Journal of Fish Biology 61: 1-20.
Blaber, S.J.M., and T.G. Blaber. 1980. Factors affecting the distribution of juvenile estuarine and inshore fish. Journal of Fish Biology 17: 143-162.
Bozeman, E., and J. Dean. 1980. The abundance of estuarine larval and juvenile fish in a South Carolina intertidal creek. Estuaries 3: 89-97.
Carpenter, K.E., and V.G. Springer. 2005. The center of the center of marine shore fish biodiversity: the Philippine Islands. Environmental biology of fishes 72: 467-480.
Chong, V.C., A. Sasekumar, M.U.C. Leh, and R. D'Cruz. 1990. The fish and prawn communities of a Malaysian coastal mangrove system, with comparisons to adjacent mud flats and inshore waters. Estuarine, Coastal and Shelf Science 31: 703-722.
Colwell, R. 2009. EstimateS: Statistical estimation of species richness and shared species from samples. Version 8. 2006. Available from: purl. oclc. org/estimates.
Davis, T.O. 1988. Temporal changes in the fish fauna entering a tidal swamp system in tropical Australia. Environmental Biology of Fishes 21: 161-172.
Duke, N., M. Ball, and J. Ellison. 1998. Factors influencing biodiversity and distributional gradients in mangroves. Global Ecology & Biogeography Letters 7: 27-47.
Ellis, W.L., and S.S. Bell. 2008. Tidal influence on a fringing mangrove intertidal fish community as observed by in situ video recording: implications for studies of tidally migrating nekton. Marine Ecology Progress Series 370: 207-219.
Fischer, W., and G. Bianchi. 1984. FAO Species Identification Sheets For Fishery Purposes Western Indian Ocean (Fishing Area 51). Vol 5: Bony Fishes: Chimaeras, Sharka, Lobsters, Shrimps and Prawns, Sae Turtles: FAO.
Gibson, R.N. 2003. Go with the flow: tidal migration in marine animals. Hydrobiologia 503: 153-161.
González-Acosta, A.F., G. De la Cruz-Agüero, J. De la Cruz-Agüero, and G. Ruiz-Campos. 2005. Seasonal pattern of the fish assemblage of El Conchalito mangrove swamp, La Paz Bay, Baja California Sur, Mexico Patrones
42
Chapter II
estacionales en la estructura de los peces del manglar El Conchalito, Bahía de La Paz, Baja California Sur, México. Hidrobiológica 15: 205-214.
Hobson, E.S. 1965. Diurnal-nocturnal activity of some inshore fishes in the Gulf of California. Copeia: 291-302.
Ikejima, K., P. Tongnunui, T. Medej, and T. Taniuchi. 2003. Juvenile and small fishes in a mangrove estuary in Trang province, Thailand: seasonal and habitat differences. Estuarine, Coastal and Shelf Science 56: 447-457.
Kimani, E., G. Mwatha, E. Wakwabi, J. Ntiba, and B. Okoth. 1996. Fishes of a shallow tropical mangrove estuary, Gazi, Kenya. Marine and Freshwater Research 47: 857-868.
Krumme, U., and U. Saint-Paul. 2010. Dynamics in Mangrove Fish Assemblages on a Macrotidal Coast. In Mangrove Dynamics and Management in North Brazil, ed. U. Saint-Paul and H. Schneider, 189-207: Springer Berlin Heidelberg.
Krumme, U., U. Saint-Paul, and H. Rosenthal. 2004. Tidal and diel changes in the structure of a nekton assemblage in small intertidal mangrove creeks in northern Brazil. Aquatic Living Resources 17: 215-229.
Kuronuma, K., and Y. Abe. 1986. Fishes of the Arabian Gulf: Kuwait Institute for Scientific Research.
Laegdsgaard, P., and C. Johnson. 2001. Why do juvenile fish utilise mangrove habitats? Journal of Experimental Marine Biology and Ecology 257: 229-253.
Laegdsgaard, P., and C.R. Johnson. 1995. Mangrove habitats as nurseries: unique assemblages of juvenile fish in subtropical mangroves in eastern Australia. Marine Ecology Progress Series 126: 67-81.
Laroche, J., E. Baran, and N. Rasoanandrasana. 1997. Temporal patterns in a fish assemblage of a semiarid mangrove zone in Madagascar. Journal of Fish Biology 51: 3-20.
Ley, J.A., and I.A. Halliday. 1999. Diel variation in mangrove fish abundances and trophic guilds of northeastern Australian estuaries with a proposed trophodynamic model. Bulletin of Marine Science 80: 681-720.
Little, M.C., P.J. Reay, and S.J. Grove. 1988. The fish community of an East African mangrove creek. Journal of Fish Biology 32: 729-747.
Lugendo, B.R., I. Nagelkerken, N. Jiddawi, Y.D. Mgaya, and G. Van Der Velde. 2007. Fish community composition of a tropical nonestuarine embayment in Zanzibar, Tanzania. Fisheries Science 73: 1213-1223.
Nagelkerken, I., M. Dorenbosch, W.C.E.P. Verberk, E.C.d.l. Moriniere, and G.v.d. Velde. 2000. Day-night shifts of fishes between shallow-water biotopes of a Caribbean bay, with emphasis on the nocturnal feeding of Haemulidae and Lutjanidae. Marine Ecology Progress Series 194: 55-64.
Nagelkerken, I., S. Kleijnen, T. Klop, R.A.C.J.v.d. Brand, E.C.d.l. Morinière, and G.v.d. Velde. 2001. Dependence of Caribbean reef fishes on mangroves and seagrass beds as nursery habitats: a comparison of fish faunas between bays with and without mangroves/seagrass beds. Marine Ecology Progress Series 214: 225-235.
43
Tidal Induced Changes in Intertidal Mangrove Fish Assemblages
Pittman, S., C. McAlpine, and K. Pittman. 2004. Linking fish and prawns to their
environment: a hierarchical landscape approach. Marine Ecology Progress Series 283: 233-254.
Quinn, N., and B. Kojis. 1987. The influence of diel cycle, tidal direction and trawl alignment on beam trawl catches in an equatorial estuary. Environmental Biology of Fishes 19: 297-308.
Robertson, A.I., and N.C. Duke. 1990. Mangrove fish-communities in tropical Queensland, Australia: Spatial and temporal patterns in densities, biomass and community structure. Marine Biology 104: 369-379.
Rooker, J.R., and G.D. Dennis. 1991. Diel, lunar and seasonal changes in a mangrove fish assemblage off southwestern Puerto Rico. Bulletin of Marine Science 49: 684-698.
Sasekumar, A., V.C. Chong, M.U. Leh, and R. D'Cruz. 1992. Mangroves as a habitat for fish and prawns. Hydrobiologia 247: 195-207.
Shahraki, M., B. Fry, U. Krumme, and T. Rixen. 2014. Microphytobenthos sustain fish food webs in intertidal arid habitats: A comparison between mangrove-lined and un-vegetated creeks in the Persian Gulf. Estuarine, Coastal and Shelf Science 149: 203-212.
Thayer, G.W., D.R. Colby, and W.F. Hettler Jr. 1987. Utilization of the red mangrove prop root habitat. Marine Ecology-Progress Series 35: 25-38.
Weis, J., P. Weis, J. MacDonald, and L. Pearson. 2009. Rapid changes in fish utilization of mangrove habitat in Western Madagascar. Wetlands Ecology and Management 17: 345-354.
Wilson, J., and M. Sheaves. 2001. Short-term temporal variations in taxonomic composition and trophic structure of a tropical estuarine fish assemblage. Marine Biology 139: 787-796.
Wright, J. 1989. Diel variation and seasonal consistency in the fish assemblage of the non-estuarine Sulaibikhat Bay, Kuwait. Marine Biology 102: 135-142.
Wright, J.M., D.A. Clayton, and J.M. Bishop. 1990. Tidal movements of shallow water fishes in Kuwait Bay. Journal of Fish Biology 37: 959-974.
Wright, J.M. 1988. Seasonal and spatial differences in the fish assemblage of the non-estuarine Sulaibikhat Bay, Kuwait. Marine Biology 100: 13-20.
44

CHAPTER III
Microphytobenthos Sustain Fish Food Webs in
Intertidal Arid Habitats: A Comparison between
Mangrove-lined and Un-vegetated Creeks in the
Persian Gulf
Maryam Shahraki
Brian Fry
Uwe Krumme
Tim Rixen
Estuarine, Coastal and Shelf Science (2014) 149, 203-212
45

46
Chapter III
ABSTRACT
The dietary importance of mangroves for fish production often seems to be minor.
However, robust comparisons of fish food webs at mangrove vs. non-mangrove sites
are largely lacking. We analyzed stable carbon (δ13C) and nitrogen (δ15N) isotope
values of dominant fishes (in terms of number) and their potential food sources in
summer and winter from arid mangrove-lined and un-vegetated intertidal creeks in
Qeshm Island, Persian Gulf, Northern Indian Ocean (26.8°N, 55.75°E). Detritivorous
Liza klunzingeri (47%) and Anodontostoma chacunda (34%) dominated the abundance
at the un-vegetated site; at the mangrove site L. klunzingeri (41%) also dominated,
while the zooplanktivores Leiognathus daura (18%), Thryssa vitrirostris (8%) and
macrobenthivores Pentaprion longimanus (10%), Acanthopagrus latus (4%) also
contributed. Our findings showed high dietary reliance by fish on food items
associated with non-mangrove sources as indicated by 2 source mixing models.
Mangrove-derived organic matter contributed a maximum of 36% to the fish tissue
whereas organic matter produced by microphytobenthos and plankton played a major
role in the diet of the most abundant fish species with contributions of 64 - 100%. Two
trophic pathways, a pelagic pathway and a benthic pathway, were present in the fish
food webs at both sites. The pelagic and benthic food sources of the un-vegetated site
were 13C-enriched, consistent with stronger contributions of abundant benthic
cyanobacteria found within that food web. Spatial δ13C variation of microphytobenthos
and plankton was also reflected in the δ13C values of the feeding guilds and some fish
species, suggesting that fish were relatively resident at each site. The isotope values of
most food sources and fish did not differ significantly between seasons. Overall,
regardless of habitat type and season, microphytobenthos and plankton largely
sustained fishes in this region while mangroves, where present, were of minor
importance. Our results suggest both mangrove and un-vegetatted sites act as feeding
grounds for fishes via pelagic and benthic food pathways in this arid region.
Keywords Intertidal mangrove creeks, Un-vegetated habitat, Intertidal fishes, Stable
isotopes, Food web structure, Western Indian Ocean
47

Microphytobenthos Sustain Fish Food Webs in Intertidal Arid Habitats
INTRODUCTION
Mangroves forests are known to be highly productive ecosystems with high rates of
primary production (Alongi, 2014). However, according to the outwelling hypothesis,
large amounts of mangrove leaves, detritus, and particulate or dissolved organic matter
are exported to adjacent habitats and are thus thought to be important in local food
webs (Lee, 1995; Bouillon et al., 2000). Also, mangrove ecosystems contribute to local
fisheries by providing food and shelter (Manson et al., 2005; Chong, 2007) and thus
act as important nursery grounds for many fish species (Robertson and Duke, 1987;
Nagelkerken, 2009). The specific function of mangroves as feeding and nursery
ground for fishes can vary depending on environmental factors (i.e. precipitation,
temperature, tidal regime), and on geomorphological features such as the tidal creek
structure within a mangrove forest (Twilley et al., 1999; Fry and Ewel, 2003; Lugendo
et al., 2007). In the Indo-Pacific where tides are large, fish show little reliance on
organic carbon produced by mangroves trees (Marguillier et al., 1997; Nyunja et al.,
2009). These results are also supported by studies in the Caribbean where mangroves
are often permanently inundated, and primary producers such as microphytobenthos,
algae, seagrass and phytoplankton have been identified as important food sources for
many fishes in mangrove ecosystem (Nagelkerken and Velde, 2004; Nagelkerken et
al., 2008). On the other hand, some studies in high-rainfall areas of the central Indo-
Pacific conclude that organic carbon produced by mangroves trees plays important role
as food source in fish food webs (Rodelli et al., 1984; Zagars et al., 2013).
Furthermore, food sources of different origins can be seasonally important for
consumers in each particular habitat and fishes can change their food habits as a
consequence of prey availability (Vizzini and Mazzola, 2003; Olin et al., 2012). Given
these divergent findings, it seems possible that environmental variables could
determine use of mangrove litter in coastal food webs.
Mangroves in the Persian Gulf thrive under extreme conditions and are
subjected to very low rainfall and high salinities (Al-Khayat and Jones, 1999) which
may influence the functionality of mangroves in this region. So far, there are only a
few studies of mangroves in the Gulf region, mainly from the southern Arabic coast.
These studies focus on the role of different habitats including natural and planted
mangroves on the diet of benthic invertebrates. At the east coast of Qatar, stomach
content analysis and stable isotope approaches indicated that endemic shrimp species
(Palaemon khori) relies on mangrove leaves throughout its post settlement life cycle, 48

Chapter III
while other shrimps such as Penaeus semisulcatus and Metapeneus ensis mostly feed
on seagrass and microbial mat foods (Al-Maslamani et al., 2012; Al-Maslamani et al.,
2013). In the Sulaibikhat Bay also microphytobenthos (microbial mats) are a major
food sources supporting benthic and pelagic macro faunal species (mostly invertebrate
and few subtidal fish species) and the minor role of mangroves trees has been
highlighted as food source for these organisims (Al-Zaidan et al., 2006).
Stable carbon and nitrogen isotopes are often used to compare interlinked
mangrove, seagrass and mudflat food webs. These studies have highlighted the limited
role of mangrove as primary sources of carbon to higher trophic levels (Kruitwagen et
al., 2010; Igulu et al., 2013). However, direct comparisons between mangrove-lined
creeks and similar creeks lacking mangroves have not been previously reported. Here
we use stable carbon and nitrogen isotopes to examine the food pathways in
mangrove-lined and un-vegetated creeks at the arid coast of Qeshm Island, Iran during
winter and summer. More specifically we address the following questions: 1) Do food
sources in the two habitat types (mangrove vs. un-vegetated) differ in isotopic
compositions? 2) What are the main food pathways for fishes in mangrove vs. non-
mangrove sites? 3) Does fish rely on different food sources in winter and summer? 4)
What is the importance of mangroves in supporting fish food webs?
To address these questions, carbon and nitrogen isotope values of food sources
and fishes were considered from two sites each sampled in summer and winter. Stable
isotope analyses provide information on the long-term feeding habits of fish and the
relative contributions of different primary sources to fish nutrition (Peterson and Fry,
1987; Layman, 2007). Two-source mixing models were used to set upper maximum
and lower minimum limits on the mangrove contributions to the fish food webs at the
mangrove site.
MATERIALS AND METHODS
Study sites
The study was carried out at Qeshm Island, Iranian coast of the Persian Gulf, a
protected biosphere reserve at the northern edge of mangrove distribution in the Indian
Ocean (26.8°N, 55.75°E)(Fig. 1). The northwest of Qeshm Island has the largest
mangrove area of Iran, composed exclusively of Avicennia marina, growing in the
high intertidal area, with tree heights of 3 to 6 m (Spalding et al., 2010). The area is
characterized by a plateau mangrove where the mangrove floor is flooded only during 49
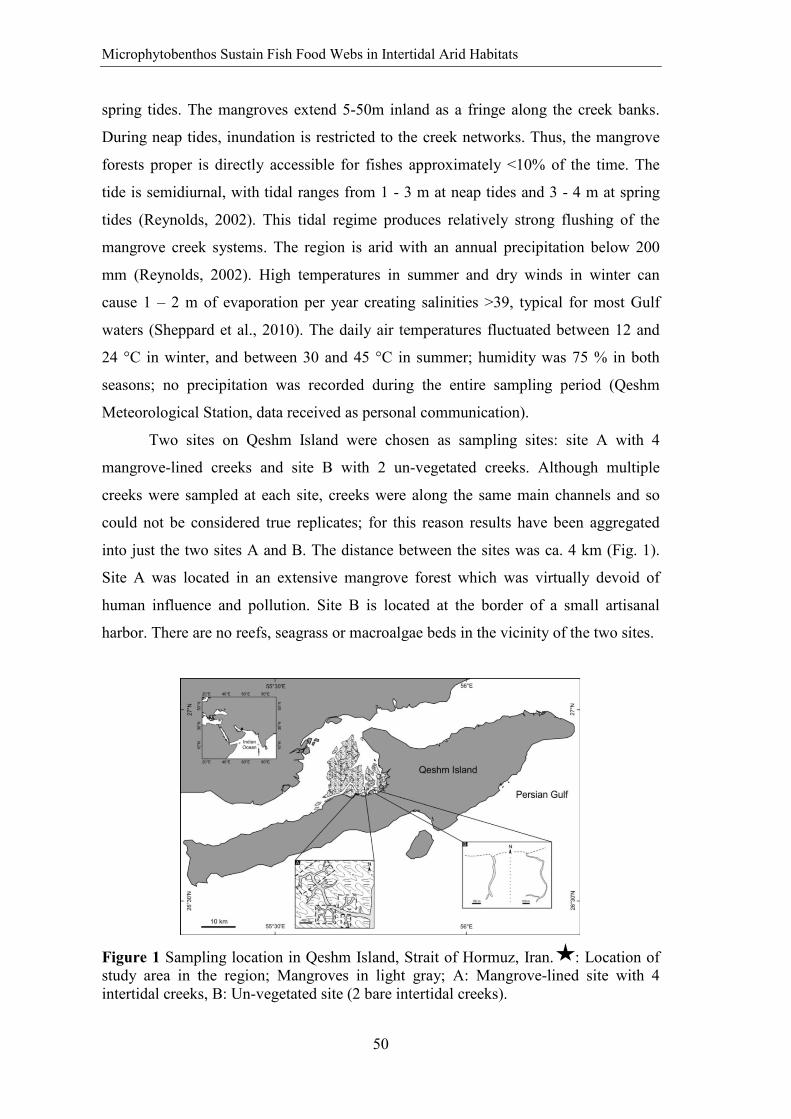
Microphytobenthos Sustain Fish Food Webs in Intertidal Arid Habitats
spring tides. The mangroves extend 5-50m inland as a fringe along the creek banks.
During neap tides, inundation is restricted to the creek networks. Thus, the mangrove
forests proper is directly accessible for fishes approximately <10% of the time. The
tide is semidiurnal, with tidal ranges from 1 - 3 m at neap tides and 3 - 4 m at spring
tides (Reynolds, 2002). This tidal regime produces relatively strong flushing of the
mangrove creek systems. The region is arid with an annual precipitation below 200
mm (Reynolds, 2002). High temperatures in summer and dry winds in winter can
cause 1 – 2 m of evaporation per year creating salinities >39, typical for most Gulf
waters (Sheppard et al., 2010). The daily air temperatures fluctuated between 12 and
24 °C in winter, and between 30 and 45 °C in summer; humidity was 75 % in both
seasons; no precipitation was recorded during the entire sampling period (Qeshm
Meteorological Station, data received as personal communication).
Two sites on Qeshm Island were chosen as sampling sites: site A with 4
mangrove-lined creeks and site B with 2 un-vegetated creeks. Although multiple
creeks were sampled at each site, creeks were along the same main channels and so
could not be considered true replicates; for this reason results have been aggregated
into just the two sites A and B. The distance between the sites was ca. 4 km (Fig. 1).
Site A was located in an extensive mangrove forest which was virtually devoid of
human influence and pollution. Site B is located at the border of a small artisanal
harbor. There are no reefs, seagrass or macroalgae beds in the vicinity of the two sites.
Figure 1 Sampling location in Qeshm Island, Strait of Hormuz, Iran. : Location of study area in the region; Mangroves in light gray; A: Mangrove-lined site with 4 intertidal creeks, B: Un-vegetated site (2 bare intertidal creeks).
50

Chapter III
Sample collection
Various potential food sources (mangrove leaves, microphytobenthos (MPB),
plankton, particulate organic matter (POM), sediment organic matter (SOM)),
macrobenthos (shrimps & crabs) and fishes were collected for carbon and nitrogen
isotopic analysis at both sites in December 2011 and February 2012 (cool, dry period)
and in August 2012 (hot, dry period).
Samples of fresh (green) A. marina leaves were hand-picked. Decomposing
mangrove leaves (yellow) were also collected from the bottoms of the creeks and
combined for the analysis. MPB was collected at low tide by gently scraping off the
visible mats from the sediment surface. SOM was collected from the top layer of the
sediment with a spoon. POM was collected during ebb tide and plankton was sampled
at high water after sunset by filtering 10 l of water through plankton nets (10 μm mesh
size for phytoplankton, 200 μm for zooplankton). Since it was not possible to obtain
phytoplankton samples free of zooplankton, phytoplankton samples were a mixture of
phyto- and zooplankton. Plankton and POM samples were filtered on pre-combusted
(4 h, 450oC) Whatmann GF/F glass fiber filters. Each filter was sun-dried and stored in
a clean glass vial. Benthic invertebrates (shrimps & crabs) were collected with a hand
net. Fish were collected with block nets (20 x 5 m x 12 mm mesh size) set at slack high
water at spring and neap tides in both habitat types and seasons (M. Shahraki Unpubl.
data) and assigned to 4 trophic guilds (detritivores (DV), zooplanktivores (ZP),
macrobenthivores (MB), omnivores (OV)) based on findings from previous studies
(Woodland, 1984; Yamashita et al., 1987; Gandhi, 2002; Kiso and Mahyam, 2003;
Elliott et al., 2007; Hajisamae and Ibrahim, 2008; Tse et al., 2008; Chew et al., 2012;
Froese and Pauly, 2012; Uddin et al., 2012).
For the fish samples, white muscle tissue (1 - 2 g) was taken from below the
anterior end of the dorsal fin. For shrimps and crabs shell or exoskeleton were
removed and soft tissues were extracted for analysis. All samples were dried at 60 °C
for 48 h. Fish and benthic invertebrate white muscle tissue was used because it is less
variable in the δ13C and δ15N than other tissue types (Pinnegar and Polunin, 1999) and
because it reflects the food assimilated over a longer time period of several weeks
(Gearing, 1991). Tissue lipid content is known to affect bulk δ13C because lipids are
depleted in δ13C relative to proteins and carbohydrates (DeNiro and Epstein, 1978;
McConnaughey and McRoy, 1979). To account for lipids, Following (Post et al.,
2007), prior to statistical analysis, carbon isotopic values of fish and invertebrates were 51

Microphytobenthos Sustain Fish Food Webs in Intertidal Arid Habitats
normalized for lipid content following the mathematical normalization technique of
Post et al. (2007). Correction factor for δ13C was used based on C:N values (i.e. C:N
ratios >3.5 for lipid-rich tissue). This normalization changed isotope values by an
average of 0.2‰.
For δ13C-DIC (dissolved inorganic carbon), 20 ml amber-colored glass bottles
were filled with water samples and preserved with a mercury chloride solution. All
samples were sealed and stored cool until analysis at the Leibniz Center for Tropical
Marine Ecology (ZMT), Bremen, Germany.
For microphytobenthos community composition, samples from daytime spring
high tides were taken, fixed with 4% formaldehyde and in the lab, 5 samples were
analyzed for each site. A sub-sample from each of the original mat samples was
removed using a scalpel. Each sub-sample was placed in 100 ml of filtered seawater. A
1 ml sub-sample was extracted from the suspension and equally divided into 3 glass
slides. The number of cells on each slide was counted to give the number of algal cells
per ml using Axioskop (Zeiss) and followed by taxonomical determination to genera
level using (Al-Hasan and Jones, 1989).
In addition, water parameters (water temperature and salinity) were regularly
measured (WTW Multisonde 3430) in both mangrove and un-vegetated sites at slack
high water.
Sample analysis
Samples for stable isotope analysis were ground to powder with a mortar and pestle.
For samples rich in carbonates such as SOM and filters of POM and plankton, sub-
samples were prepared for δ13C analysis by treatment with dilute hydrochloric acid,
followed by rinsing with deionized water and drying. Remaining untreated sub-
samples were used for δ15N analysis as acid has been reported to affect δ15N values
(Goering et al., 1990; Bunn et al., 1995). Elemental values for C and N were
determined with an Euro EA3000 Elemental Analyzer. Samples for δ13C and δ15N
were analyzed with a Delta Plus isotope ratio mass spectrometer connected to the
Carlo Erba Flash EA elemental analyzer via a Finnigan ConFloII interface.
The carbon and nitrogen analysis are expressed in conventional delta (δ)
notation as parts per mil (‰), where the isotopic ratio of 15N/14N is expressed relative
to air and 13C/12C relative to the international PDB standard, as defined by the
equation: 52

Chapter III
δ X(‰)= [(Rsample – Rstandard)/(Rstandard)] x 1000
where X is 13C or 15N, and R represents the ratios 13C/12C or 15N/14N. The analytical
precision of the measurement was <0.06‰ for both δ13C and δ15N. Samples with
higher δ13C or δ15N values are “heavier” or enriched in the heavy 13C or 15N isotope,
while samples with lower values are “lighter” and depleted in 13C or 15N.
Carbon isotopes in DIC were measured with a GasBench II, coupled with a
MAT 253, both from Thermo Scientific. The reference gas used in measurements was
calibrated with NBS19 and with Solenhofener Plattenkalk (SPK) was routinely run as
a control along with samples.
Data analysis
Shapiro-Wilk test were used to test the normality of stable isotope data. Independent
samples t-tests (Equal Variance Test (EV), and Mann-Whitney Rank Sum Test
(MWR) in case the data were not normally distributed) were used to assess site and
seasonal differences in δ13C and δ15N of food sources and fishes belonging to the same
species collected from mangrove-lined and un-vegetated sites. Since we did not detect
any seasonal differences in the carbon and nitrogen stable isotope values of the same
fish species, the isotopic values of fish species were pooled by season. δ13C and δ15N
among different feeding guilds were also tested with independent t-tests.
Two-way ANOVAs (TA) followed by Tukey tests were used to test for the
effects of site and season on δ13C and δ15N values of main food groups and feeding
guilds (DV, ZP, MB). Food sources were grouped into mangrove leaves (green and
yellow), pelagic sources (phytoplankton, zooplankton and POM), benthic sources
(MPB, SOM) and macrobenthos (crabs). The shared species belonging to the same
feeding guilds in two sites were considered for two-way ANOVA. Species and feeding
guilds were grouped as LK and AC (detritivores); LD and TV (zooplanktivores) and
PL, PK and AL (macrobenthivores). All statistical tests were performed using
SigmaPlot 12.3.
Potential minimum and maximum mangrove contributions to fish diets were
calculated from δ13C data within a framework of two-source mixing models (Fry,
2013a, b). There were several mixtures of plant food sources (mangroves,
phytoplankton, and microphytobenthos) that could explain isotope results for fish, and
unfortunately no source mixture was uniquely indicated. In this situation of
underdetermined isotope solutions, it is still possible to calculate minimum and 53

Microphytobenthos Sustain Fish Food Webs in Intertidal Arid Habitats
maximum potential contributions of plants to fish diets, and we used conventional two-
source mixing models in these calculations (Fry, 2006). These models require end-
member sources which we characterized from measured data and literature estimates.
Green and yellow mangrove leaves measured in this study averaged -28.3‰ and a
recent study (Bui and Lee, 2014) indicates that macrofaunal consumers of mangroves
average 5.2‰ enriched in δ13C when fed mangroves, so that in our system, a value of -
23.1‰ was expected for fish that were 100% reliant on mangroves. For fish that were
0% reliant on mangroves at our sites, we used average isotope values for fish species
or groups from our non-mangrove sites. Values between the two source values for 0%
and 100% reliance on mangroves (sources 1 and 2, respectively) indicated possible
maximum mangrove contributions for a fish sample of interest according to two-
source mixing:
Maximum Mangrove Contribution (%) = 100*(δ SAMPLE – δ SOURCE1)/ (δ SOURCE2 – δ
SOURCE1)
Samples were fish averages at the whole community level, at the level of fish
functional groups, and at the species level for seven species where several individuals
were caught at both the mangrove and non-mangrove sites. Errors associated with the
two-source calculations were evaluated using the IsoError programming (Phillips and
Gregg, 2001). The inputs for IsoError were the δ13C values of mean, standard
deviation, and number of samples measured for mangrove and no-mangrove sources.
The output generated by the set of IsoError equations provides estimate contributions
for each source (0-100%), standard errors for these contribution estimates, and
approximate 95% confidence intervals for source contributions, considering error
propagation.
In our study system, we generally found that "aggregated basal plant sources"
(phytoplankton and MPB) could be substituted for mangroves into the 2-source model
above and also explain the observed fish isotope values without any involvement of
mangroves. Thus, the minimum required mangrove contributions were always zero.
Stated another way, the above two-source calculation represents a theoretical possible
or maximum mangrove contribution, but a contribution that could also be zero based
on measured data. Overall, the minimum and maximum mangrove contributions
ranged between respectively 0% and 36% for the various fish groups and species
tested in this study. Other food sources were aggregated in the 2-source model as
54

Chapter III
various types of “algae”, and “algal” contributions to the various fish groups ranged
from a minimum of 64% to a maximum of 100%.
RESULTS & DISCUSSION
Isotopic composition of potential food sources
Four groups of potential sources were considered 1) mangrove leaves (G and Y), 2)
benthic sources (MPB and SOM), 3) pelagic sources (plankton (phyto- and
zooplankton) and POM), 4) macrobenthos (shrimps & crabs).
In mangrove-lined creeks, mangrove leaves were isotopically distinct from
plankton and MPB (Fig. 2), with the most 13C-depleted values for mangroves (-
28.2±1.1‰), intermediate values for plankton (-22.8±1.5‰) and enriched values for
MPB (-17.8±2.1‰) (Table 2). In the un-vegetated site, plankton was the most 13C-
depleted (-21.8±1.7‰), whereas MPB was even more 13C-enriched (-13.8±3‰) (Table
2). Tracing the origin of POM and SOM can be complex due to the many potential
sources (Wu et al., 2003). However, the isotopic composition of POM in both sites was
similar to plankton, suggesting a high contribution of phyto- and zooplankton to POM,
while δ13C values of SOM were closely linked to MPB (Fig. 2).
Figure 2 Plot of mean δ13C and δ15N (±SD) of different food sources from the mangrove-lined and un-vegetated sites in winter and summer, Qeshm Island, Iran. Black and white dots represent mangrove and non-mangrove sources, respectively. Green and yellow mangrove leaves (ML-G and ML-Y); phytoplankton (PHY), zooplankton (ZOO), particulate organic matter (POM), sediment (SOM), microphytobenthos (MPB).
55

Microphytobenthos Sustain Fish Food Webs in Intertidal Arid Habitats
The mangrove leaves had a mean δ13C value of -28.2‰, which is in the range
calculated for mangroves (median= -28.1‰; the 25th and 75th percentiles -29.4‰ to -
27.0‰) (Bouillon et al., 2008), and falls well within the ranges found for mangroves
around the globe (Marguillier et al., 1997; Abrantes and Sheaves, 2008; Giarrizzo et
al., 2011). In this study, MPB had δ13C range from -17‰ to -13‰ and fall in the most 13C-enriched part of the spectrum for carbon sources in aquatic environment reported
by (Bouillon et al., 2008). In relation to plankton that rangeded from -23‰ to -21‰,
MPB was enriched in δ13C in both sites due to cyanobacteria which is known to be
enriched in δ13C owing CO2-concentrating-mechanism (CCM) (Price et al., 2008).
Benthic microalgae in marine waters are known to be more 13C-enriched (by an
average of ∼5‰) relative to phytoplankton due to the thicker boundary layer
experienced by benthic algae (France, 1995; MacLeod and Barton, 1998).
The mean δ13C values of MPB and POM food sources in the mangrove-lined
site were 4-5‰ more depleted than in the un-vegetated site. In the presence of
mangroves, aquatic primary producers can have lower than expected δ13C due to the
incorporation of 13C-depleted DIC of mangrove origin (Bouillon et al., 2008). In our
study, however, the δ13C DIC values were very similar at -0.6‰ and -0.9‰ for
mangrove and un-vegetated sites, respectively. δ13C DIC measurements in the
oligotrophic surface waters of the Arabian Sea close the Strait of Hormuz show values
of 1.5‰ (Rixen et al., 2011). These values are in line with those of Bouillon et al.
(2008), indicating that the respiration of organic matter affects the δ13C DIC value in
our sites of study. The reasons for the 13C depletion in MPB and POM at the mangrove
site remain unknown at this time, but may be related to differences in the MPB
community itself, a community that can contribute to POM when tides resuspend
sediments. Cyanobacteria dominated the MPB community at the un-vegetated site,
while diatoms dominated the MPB community at the mangrove site. (see Table S1 in
the Supplement). Cyanobacteria typically show the most enriched δ13C values among
aquatic autotrophs (e.g., Al-Zaidan et al., 2006). Higher δ13C values of plankton could
be also partly explained by the slightly more saline condition in the un-vegetated site.
Higher δ13C values of zooplankton and POM were partly related to increased salinities
in estuarine mangroves in India (Bouillon et al., 2000).
δ15N values of food sources did not differ between sites (EV, p>0.05). δ15N
values averaged 3.2‰ and 2.0‰ for MPB at the mangrove and un-vegetated sites,
respectively, and to 7‰ and 6.5‰ for zooplankton (Table 2). The mean δ15N values of 56

Chapter III
mangrove leaves were 4.6‰ and 5.2‰ for green and yellow leaves, respectively. Low
δ15N values of MPB would be consistent with presence of benthic nitrogen-fixing
cyanobacteria in both sites. Low δ15N values are related to a large contribution of fixed
nitrogen from the atmosphere, as the δ15N value of atmospheric N2 is defined as 0%
(Yamamuro et al., 1995; France et al., 1998). High δ15N values of phytoplankton
(6.2‰) may reflect some contribution from zooplankton (6.5‰; Table 2).
Mean δ13C and δ15N values of macrobenthos did not show significant
difference between sites (EV; p>0.05). δ13C values of macrobenthos were very close
to the values of MPB, suggesting that macrobenthos relied on MPB. In other
mangroves, e.g. along the southeast coast of India and Tanzania, δ13C values of benthic
invertebrates were very close to the δ13C values of benthic algae (Bouillon et al., 2002;
Kruitwagen et al., 2010). Similarly in another study in the Caribbean, the mean value
of δ13C of invertebrate spanned in the range of algae (Kieckbusch et al., 2004).
Abundant feeding guilds
The fish communities were dominated by 12 and 8 species (with relative abundance
>1%) from the mangrove and un-vegetated sites, respectively. These species were
selected for the carbon and nitrogen isotope analysis because of their high abundance
and because they are the representative species in the region. Overall, a total of 29 and
22 fish species were caught in the mangrove-lined and un-vegetated sites, respectively
and the Chao1 species richness estimator (SChao1) reached an asymptote in both sites
(M. Shahraki Unpubl. data), emphasizing that the species richness of the intertidal fish
communities was well-characterized by our sampling so that additional sampling
should not have yielded additional species (Gotelli and Colwell, 2011). In our study,
the low fish species richness and dominance of just a few species compared to other
tropical regions is likely due to the extreme environmental conditions. Salinity
averaged 38.3±0.5 in the mangrove-lined site and 40.3±2.3 in the un-vegetated site.
Moreover, >20°C seasonal fluctuations in water temperature likely enhance the
stressful condition for fishes (Table S2 in the Supplement).
Detritivores were the most abundant feeding guild in both sites (44% and 81%
in the mangrove-lined and un-vegetated sites, respectively), followed by
zooplanktivores (32%; 8%), macrobenthivores (18%; 7%), and omnivores (5%; <1%)
(Table 1). The dominance of detritivores in our study sites suggests the importance of
benthic (detritus) food webs in the intertidal creeks at Qeshm Island. 57

Microphytobenthos Sustain Fish Food Webs in Intertidal Arid Habitats
Isotopic composition of fish
The δ13C values of different feeding guilds differed between the mangrove-lined and
the un-vegetated sites (Table 3; TA, p<0.05). However, differences in δ13C values at
the species level were only observed for P. longimanus, A. latus, and Pomadasys
kaakan (Table 2; EV, p<0.05). The spatial variability in isotopic values of the feeding
guilds and some species could be explained by difference in δ13C of sources between
habitats. The spatial differences in δ13C of benthic sources (e.g. MPB) were reflected
in the δ13C of fishes (DV and MB) and spatial shift in δ13C of pelagic sources can be
tracked in the δ13C zooplanktivorous fishes. This was consistent with strong overall
fish residency at the sites, even while recognizing fish make at least limited
movements with tides to avoid being stranded (Lugendo et al., 2007; Kruitwagen et al.,
2010).
Table 1 Dominant fish (species with relative abundance >1%) in mangrove-lined and un-vegetated sites in Qeshm Island, Iran. Relative abundance of dominant species (measured on the total number of fish in each habitat type) (RA). Trophic guilds (TG): detritivores (DV), zooplanktivores (ZP), macrobenthivores (MB) and omnivores (OV) according to available literature (see Material & Method section). Dash lines indicate 0.
Species RA(Mangrove) RA(Un-vegetated) TG Liza klunzingeri 41 47 DV1 Leiognathus daura 18 5 ZP2 Pentaprion longimanus 10 5 MB3 Thryssa vitrirostris 8 2 ZP4 Scatophagus argus 5 - OV5 Acanthopagrus latus 4 2 MB6 Anodontostoma chacunda 3 34 DV7 Sardinella longiceps 3 - ZP2 Pomadasys kaakan 3 - MB1,2 Sardinella gibbosa 2 - ZP2 Lutjanus johnii 1 - MB8 Ilisha melastoma 1 - ZP4 Gerres longirostris - 2 MB9
Sillago sihama - 1 ZP2,6 1: Uddin et al (2012); 2: Hajisamae and Ibrahim (2008); 3: Yamashita et al (1987); 4. Elliot et al (2007), 5. Gandhi (2002); 6: Tse et al (2008); 7: Chew et al. (2012); 8: Kiso and Mahyam (2003); 9: Woodland (1984).
58

Chapter III
Table 2 Mean carbon and nitrogen isotope values (±SD) of food sources and consumers in mangrove-lined and un-vegetated intertidal creeks, Qeshm Island, Iran. N: Number of replicates. Differences were considered to be significant when p < 0.05 (bold values).
Mangrove-lined site Un-vegetated site p values Key N δ15N δ13C N δ15N δ13C δ15N δ13C
Food Sources Avicennia marina (green) ML(G) 20 4.6±0.7 -28.2±1.1
Avicennia marina (yellow) ML(Y) 6 5.4±1.0 -28.9±0.7 Microphytobenthos MPB 22 3.2±1.6 -17.9±1.9 11 2.0±1.2 -13.1±2.8 0.06 0.001 Sediment organic matter SOM 12 3.6±1.2 -19.5±2.1 10 4.5±0.8 -17.4±2.4 0.08 0.4 Phytoplankton PHY 26 6.9±0.7 -22.3±1.6 14 6.2±1.1 -21.8±1.6 0.7 0.001 Zooplankton ZOO 24 7.0±0.5 -23.5±0.9 13 6.5±1 -22.6±1.3 0.1 0.01 Particulate organic matter POM 30 5.0±1.1 -22.8±0.8 11 4.7±0.7 -19.1±1.2 0.3 0.001 Macrobenthos Eurycarcinus spp. EUR 4 9.1±0.4 -14.6±0.5 3 6.8±2.5 -11.6±1.6 0.4 0.06 Macrophetalmus spp. MAC 2 7.1±1.6 -12.1±2.3 2 6.5±1.7 -11.3±1.5 0.1 0.3 Portunus spp. POR 2 6.9±0 -16.2±0.1 2 7.8±1.3 -17.1±3.2 0.2 0.5 Penaeus merguinsis
PM 16 8.2±1.9 -15.0 ±1.1
Fish Detritivores (DV) 6.7±0.6 -14.1±0.7 7.6±1.4 -12.1±1.5 Liza klunzingeri LK 8 6.5±0.6 -14.3±0.8 12 8.0±1.7 -11.5±1.3 0.07 0.1 Anodontostoma chacunda AC 6 7.0±0.5 -13.8±0.6 6 6.9±0.6 -13.5±1.0 0.03 0.7 Zooplanktivores (ZP) 12.1±1.1 -16.6±1.6 11.5±1 -15.6±2.1 Leiognathus daura LD 6 12.9±0.5 -19.0±1.3 5 12.3±0.7 -17.9±2.0 0.08 0.2 Thryssa vitrirostris TV 5 11.4±0.7 -14.6±0.5 6 10.9±0.7 -14.2±0.5 0.03 0.8 Sardinella longiceps SL 3 11.3±0.7 -17.9±0.3
59
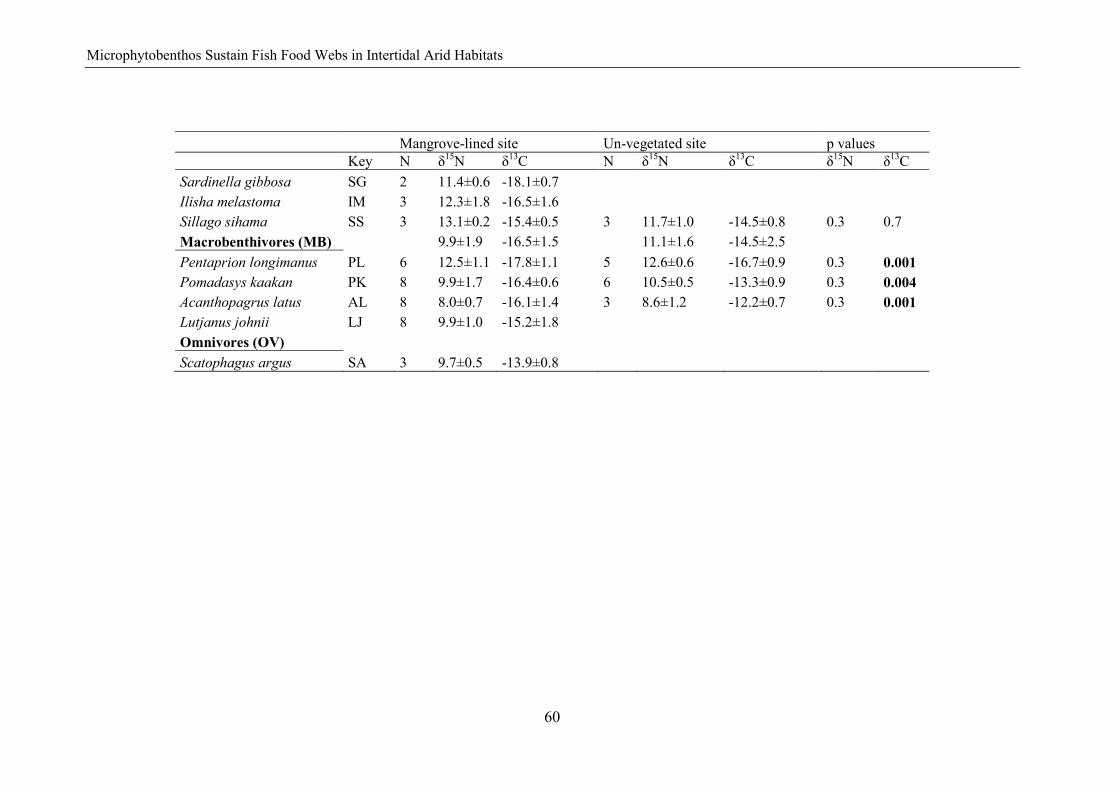
Microphytobenthos Sustain Fish Food Webs in Intertidal Arid Habitats
Mangrove-lined site Un-vegetated site p values Key N δ15N δ13C N δ15N δ13C δ15N δ13C Sardinella gibbosa SG 2 11.4±0.6 -18.1±0.7 Ilisha melastoma IM 3 12.3±1.8 -16.5±1.6 Sillago sihama SS 3 13.1±0.2 -15.4±0.5 3 11.7±1.0 -14.5±0.8 0.3 0.7 Macrobenthivores (MB) 9.9±1.9 -16.5±1.5 11.1±1.6 -14.5±2.5 Pentaprion longimanus PL 6 12.5±1.1 -17.8±1.1 5 12.6±0.6 -16.7±0.9 0.3 0.001 Pomadasys kaakan PK 8 9.9±1.7 -16.4±0.6 6 10.5±0.5 -13.3±0.9 0.3 0.004 Acanthopagrus latus AL 8 8.0±0.7 -16.1±1.4 3 8.6±1.2 -12.2±0.7 0.3 0.001 Lutjanus johnii LJ 8 9.9±1.0 -15.2±1.8 Omnivores (OV) Scatophagus argus SA 3 9.7±0.5 -13.9±0.8
60

Chapter III
Table 3 Mean carbon and nitrogen isotope values (±SD) of main food source groups and feeding guilds (DV, ZP, MB) in mangrove-lined and un-vegetated intertidal creeks in winter and summer, Qeshm Island, Iran. Differences were considered to be significant when p<0.05. Food sources were mangrove leaves, pelagic sources (phytoplankton, zooplankton and POM), benthic sources (MPB & SOM) and macrobenthos (crabs). Fish species considered for each trophic guilds are provided in brackets. Bold p values indicate significant differences.
Mangrove-lined site Un-vegetated site 2 way ANOVA (p<0.05) ( δ13C) winter summer winter summer site season site*season Food sources
A. marina (G &Y) -27.3±0.7(11) -29.7±0.7(15) - - - 0.9
Benthic sources -18.3±2.7(14) -18.5±1.2(20) -16.1±3.1(10) -14.3±3.7(11) <0.001 0.7 0.9 Pelagic sources -23.5±0.6(45) -21.9±1.4(35) -21.7±2.0(21) -20.1±1.6(17) <0.001 <0.001 0.04 Macrobenthos (crabs) -15.8±0.7(5) -12.0±3.8(3) -15.3±3.2(2) -12.2±1.5(5) 0.6 0.02 0.5 Feeding guilds Detritivores (LK, AC) -14.2±0.9(8) -14.1±0.4(6) -12.0±2.1(9) -12.1±0.8(9) <0.001 0.2 0.1 Zooplanktivores (LD, TV) -16.8±2.2(5) -15.9±1.3(6) -17.3±2.7(5) -14.7±1.1(6) 0.007 0.6 0.1 Macrobenthivores (PL, PK, AL) -16.6±1.5(13) -16.8±0.6(9) -14.8±3.2(7) -14.2±0.3(6) <0.001 0.06 0.4
( δ15N) Food sources A. marina 4.2±0.8(11) 5.1±0.8(15) - - - 0.2 Benthic sources 3.3±1.7(14) 3.4±1.9(20) 3.1±1.5(10) 3.2±1.7(11) 0.7 0.3 0.1 Pelagic sources 6.0±1.4(45) 6.5±1.0(35) 5.4±1.2(21) 6.4±0.9(17) 0.1 0.004 0.2 Macrobenthos (crabs) 8.0±0.1(5) 8.1±1.9(3) 6.0±1.1(2) 7.4±2.0(5) 0.1 0.1 0.5 Feeding guilds Detritivores (LK, AC) 6.3±0.4(8) 7.2±0.2(6) 7.9±1.3(9) 7.4±1.6(9) 0.06 0.6 0.1 Zooplanktivores (LD, TV) 11.9±0.0 (5) 12.4±1.0(6) 12.0±0.4(5) 11.1±1.2(6) 0.06 0.2 0.1 Macrobenthivores (PL, PK, AL) 9.2±1.8(13) 10.9±2.3(9) 11.0±1.9(7) 11.2 ±1.2(6) 0.7 0.1 0.4
61

Microphytobenthos Sustain Fish Food Webs in Intertidal Arid Habitats
Regarding fish feeding guilds respectively, average δ13C values were lowest for
zooplanktivores (δ13Cmean= -16.6±1.6‰ and -15.6±2.1‰ respectively in the mangrove-
lined and un-vegetated sites), intermediate for macrobenthivores (δ13Cmean= -
16.5±1.5‰ and -14.5±2.5‰) and the highest for detritivorores (δ13Cmean= -14.1±0.7‰
and -12.1±1.5‰), (Table 2; EV, p>0.05). This pattern indicates that zooplanktivorores
rely on more 13C-depleted food sources, while detritivores feed on the more 13C-
enriched food sources. This suggests high dietary reliance of detrtivores on benthic
sources and zooplanktivorores on pelagic sources. Different carbon isotopic values for
benthic and planktonic sources are the likely reason for the relative δ13C enrichment of
benthic and pelagic consumers, with heavier δ13C values in the benthic than pelagic
pathway. The δ13C values of herbivorous, omnivorous and planktivorous fishes were
more depleted than the predatory fish in fringe mangrove in the Caribbean region
(Kieckbusch et al., 2004). This has been explained by the dietary reliance of non-
predatory fish on more local sources.
The δ15N values did not differ significantly between habitats at the species or
trophic guild level, with exceptions observed in 2 species (A. chacunda, T. vitrirostris)
(Table 2 & 3, TA, p>0.05 and EV, p<0.05). Mean δ15N values of all fish species
ranged between 6.5‰ and 13.1‰ in the mangrove-lined and from 6.6‰ to 12.6‰ in
the un-vegetated site (Table 2). The δ15N values differed significantly among trophic
guilds in both sites (MWR; p<0.05), with lowest values for detritivores (δ15Nmean=
6.7±0.6‰ in the mangrove-lined, and 7.6±1.4‰ in the un-vegetated sites) and highest
values for zooplanktivores (δ15Nmean= 12.1±1.1‰ in the mangrove-lined, and 11.5±1‰
in the un-vegetated sites). Macrobenthivores and omnivores showed intermediate δ15N
values. Similar to other food web studies, the zooplanktivores in Qehsm Island had the
highest δ15N values, while detritivores had the lowest δ15N values and carnivores had
similar or even higher δ15N than zooplanktivores. (Abrantes and Sheaves, 2009; Vaslet
et al., 2012). These differences in δ15N between zooplanktivores and detritivores are
most likely due to the approximately 4‰ differences in δ15N between phytoplankton
and MPB (Table 2).
The isotope data and known feeding biology of the fish were consistent with
the views that there were two main pathways for potential food sources to support the
fish community in the area, irrespective of habitat type (mangrove-lined vs. un-
vegetated site) (Fig. 3 a, b):
62
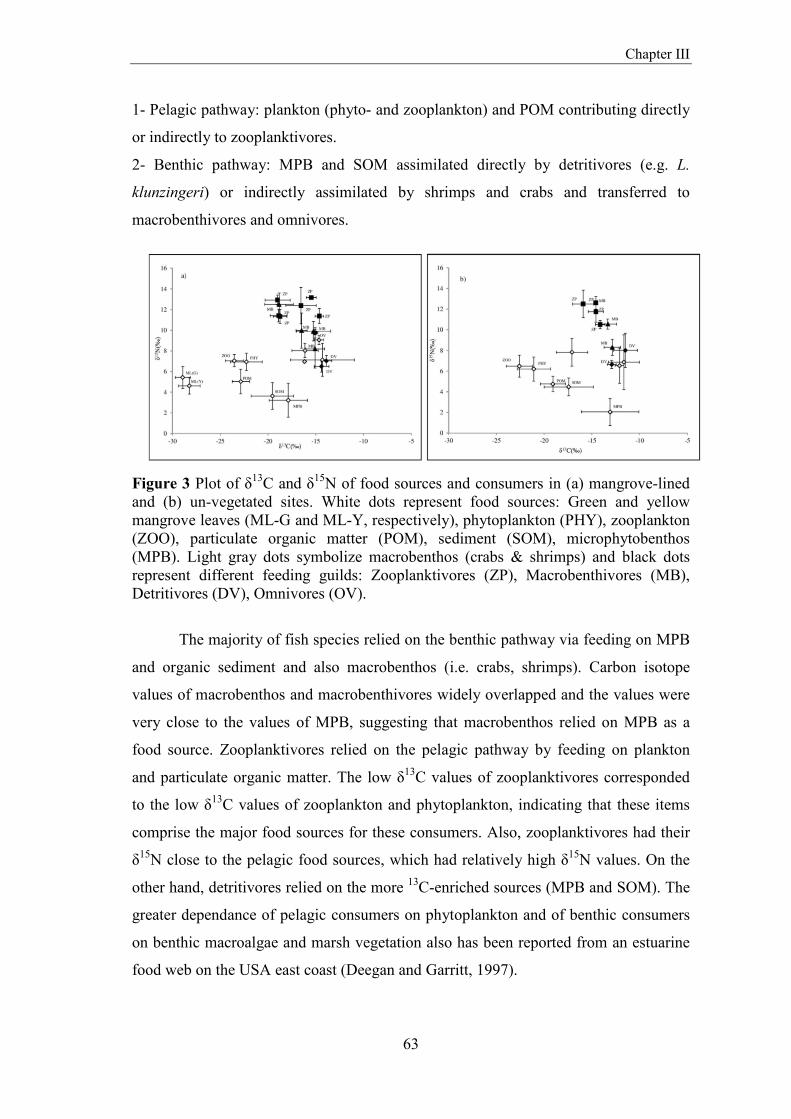
Chapter III
1- Pelagic pathway: plankton (phyto- and zooplankton) and POM contributing directly
or indirectly to zooplanktivores.
2- Benthic pathway: MPB and SOM assimilated directly by detritivores (e.g. L.
klunzingeri) or indirectly assimilated by shrimps and crabs and transferred to
macrobenthivores and omnivores.
Figure 3 Plot of δ13C and δ15N of food sources and consumers in (a) mangrove-lined and (b) un-vegetated sites. White dots represent food sources: Green and yellow mangrove leaves (ML-G and ML-Y, respectively), phytoplankton (PHY), zooplankton (ZOO), particulate organic matter (POM), sediment (SOM), microphytobenthos (MPB). Light gray dots symbolize macrobenthos (crabs & shrimps) and black dots represent different feeding guilds: Zooplanktivores (ZP), Macrobenthivores (MB), Detritivores (DV), Omnivores (OV).
The majority of fish species relied on the benthic pathway via feeding on MPB
and organic sediment and also macrobenthos (i.e. crabs, shrimps). Carbon isotope
values of macrobenthos and macrobenthivores widely overlapped and the values were
very close to the values of MPB, suggesting that macrobenthos relied on MPB as a
food source. Zooplanktivores relied on the pelagic pathway by feeding on plankton
and particulate organic matter. The low δ13C values of zooplanktivores corresponded
to the low δ13C values of zooplankton and phytoplankton, indicating that these items
comprise the major food sources for these consumers. Also, zooplanktivores had their
δ15N close to the pelagic food sources, which had relatively high δ15N values. On the
other hand, detritivores relied on the more 13C-enriched sources (MPB and SOM). The
greater dependance of pelagic consumers on phytoplankton and of benthic consumers
on benthic macroalgae and marsh vegetation also has been reported from an estuarine
food web on the USA east coast (Deegan and Garritt, 1997).
63

Microphytobenthos Sustain Fish Food Webs in Intertidal Arid Habitats
Temporal variability in isotope composition of food sources and fish feeding
guilds
There were few significant seasonal differences in the stable carbon and nitrogen
isotope values of the potential food sources, although most δ13C values were slightly
higher in summer. Pelagic sources (phyto- zooplankton and POM) were the only food
resource with significantly (TA, p<0.05) higher δ13C values in summer (Table 3), with
an average summer increase in δ13C of 1.6‰. The seasonal variability of plankton
(phyto- and zooplankton) could be related to higher water temperatures in summer
which provide suitable condition for photosynthetic production, which was reflected
by a slightly higher phytoplankton biomass in summer (0.35±0.08 mg ml-1 in summer
and 0.28±0.1 mg ml-1 in winter). But further experiments are needed to confirm this
hypothesis. Higher δ13C in zooplankton during the periods of higher phytoplankton
abundance and biomass has been reported from an Indian mangrove estuary (Bouillon
et al., 2000).
The δ13C and δ15N values of the different feeding guilds did not show any
seasonal variability (TA, p>0.05) (Table 3). The seasonal variabilty of plankton was
also not reflected in the feeding guilds. However, seasonal variability in the carbon and
nitrogen isotopic values of species from different trophic guilds (i.e., primary,
secondary, and tertiary consumers) in an estuarine system in Florida were associated
with food source availability (Olin et al., 2012). The lack of seasonal shifts in fish
isotope values could be partly explained by no shifts in diet, habitat and stable isotope
composition of sources. Our results of no seasonal shifts in fish isotopes contrast to
those for a western Mediterranean lagoon where seasonal shifts were explained by
dietary ontogenetic shift and intra-specific food partitioning (Vizzini and Mazzola,
2003). More studies are needed to elucidate controls of seasonal shifts in food webs.
Contribution of Mangrove leaves in aquatic food webs
At the level of the whole community and functional groups, maximum mangrove
contributions ranged from 13 to 23%, with means and SE of 22+4% for the whole
community, 13+8% for zooplanktivores, 18+3% for detritivores, and 23+7% for
macrobenthivores (Fig. 4). For individual species caught at both mangrove and non-
mangrove habitats, maximum potential mangrove contributions ranged from 3 to 35%
with means and SE of 24+3% for L. klunzingeri, 3+5% for A. chacunda, 21+17% for
L. daura, 4+3% for T. vitrirostri, 10+9% for Sillago sihama, 17+9% for P. 64

Chapter III
longimanus, 32+3 for P. kaakan, and 36+5 for A. latus (Fig. 4; see also Table S3 in the
Supplement).
Figure 4 Potential maximum contributions of mangroves to fish diets (mean ± 95% confidence interval) calculated by IsoError program for the whole fish community (FC), fish functional groups (DV, ZP, MB) and individual fish species (LK, AC, LD, TV, SS, PL, PK, AL; see Table 2 for full species name). Left panel includes a large 5.2 fractionation (F= 5.2‰) from mangroves to fish, and the right panel shows low estimates for potential mangrove contributions assuming no fractionation (F = 0) with from mangroves to fish. Cumulative trophic δ13C fractionation from plants to fish diets (F). This figure shows potential maximum mangrove contributions; required minimum contributions to fish diets were 0% in all cases.
Among these averages for maximum possible mangrove contributions, there
was no obvious pattern of detritivore species (L. klunzingeri and A. chacunda) being
markedly more reliant on mangroves than other species, and as stated in Methods, no
mangrove contribution was actually required to explain fish isotopes at the mangrove
sites. The calculated maximum contributions were non-zero due to 1-4‰ negative
shifts in average fish isotope values at the mangrove sites, but at these sites, MPB also
shifted in the same negative direction by 4.8‰ (Table 2). Thus, reliance on MPB
rather than mangroves could account for the negative isotope shifts for fish at the
mangrove sites. Lastly, our maximum calculations for mangroves assumed a large
5.2‰ trophic fractionation between mangroves and fish, with this assumption based on
a newly published study (Bui and Lee, 2014). However, older studies indicate that
trophic fractionations are smaller for stable carbon isotopes (McCutchan et al., 2003),
and values between 0 and 3‰ have been used for fish food webs (e.g., (Schwamborn
et al., 2002; Abrantes and Sheaves, 2008). Using these smaller values reduces the 65

Microphytobenthos Sustain Fish Food Webs in Intertidal Arid Habitats
maximum food web support from mangroves, i.e., values would be half the maximum
values given above if there is 0‰ trophic fractionation (Fig. 4). Also, if the isotope
values for yellow leaves (-28.9‰) is used as the more appropriate value for mangrove
detritus instead of the -28.3‰ average of yellow and green leaves, potential maximum
mangrove contributions are slightly less than the maxima show in the left panel of Fig.
4, for example 20+3% instead of 22+4% for the whole fish community.
In summary, there were four reasons pointing to a conclusion that mangrove
food web support is likely quite small or zero at the mangrove sites, i.e., 1) maximum
potential contributions averaged only 21% for the mangrove fish community, 2)
trophic fractionations, if smaller, would have resulted in lower maximum mangrove
inputs, 3) there was not an obvious pattern of detrivorous fishes having a much higher
potential trophic reliance on mangroves, and 4) shifts in isotope values of MPB
provided a reasonable explanation for the relatively small shifts in fish isotope values
at the mangrove sites.
Given the lack of other productive habitats in the proximities of the Qeshm
Island mangroves, the low mangrove contribution to fish diets may be mainly due to
the low overall productivity of arid mangrove systems, linked to a lack of freshwater
input and very low precipitation. This finding is in line with previous observations in
Gulf mangroves which pointed out the limited role of mangroves as primary food
sources of epibenthic invertebrates (Al-Zaidan et al., 2006; Al-Maslamani et al., 2012).
It was also argued that cyanophyta-dominated algal mats associated with tidal flats
were a greater contributor to primary productivity in the Gulf as a whole compared to
mangroves (Price et al., 1993). However, strong contributions of mangroves in aquatic
food webs has been reported in the diet of an endemic shrimp species (Palaemon
khori) from the east coast of Qatar (Al-Maslamani et al., 2013). Al-Maslamani et al,
(2013) suggested that inwelling of external seagrass and plankton foods partially
supported resident mangrove fauna. In contrast, invertebrates and fishes in several
estuarine mangrove systems, such as in Brazil, Malaysia and Thailand showed a
potentially higher reliance on mangroves, along with a generally mixed food web
(Rodelli et al., 1984; Giarrizzo et al., 2011; Zagars et al., 2013). This suggests that the
rainfall setting, tidal regime and habitat settings may influence how much mangroves
contribute to coastal food webs. Furthermore, mangrove forests in Qeshm Island are
flooded only during spring tides. This might also influence the role of mangrove as
feeding habitat and provide less chance for fishes to utilize mangrove foods. 66

Chapter III
The mean C/N value of green mangrove leaves was high (C/N ratio of 20) and
increased during the degradation (to values of up to 65) (see Fig. S2 in the
Supplement). Apparently, there is a faster loss of N than C during mangrove leave
decomposition. The dissolved organic nitrogen (DON) might be preferentially leached
and sustain the microbial food web in the mangrove site, which may lead to a high C/N
ratio and heavier δ15N values in decomposed mangrove leaves. Senescent mangrove
leaf litter has been reported as an unattractive food for most animals because it is
nutritionally poor (high C/N ratio) (Wolcott and O'Connor, 1992). The carbon of
mangrove leaves was likely not stored in the sediment due to the low sediment C/N
values (see Fig. S2 in the Supplement). Mangrove carbon might be exported out of the
system by the tide probably in the form of dissolved organic carbon (DOC), DIC and
particulate organic carbon (POC). Further measurements of δ13C of DOC are likely
needed to know the fate of most exported mangrove productivity in this region.
CONCLUSIONS
Our findings suggest that intertidal fish in Qeshm Island have little dependency on
organic carbon produced by mangrove trees but a high dependency on planktonic and
MPB sources. The overall reliance on mangrove carbon by fish was low for the
dominant fish species in the mangrove-lined creeks. Organic matter formed by
mangrove leaves contributed 0-36% to the fish diets in mangrove creeks whereas
organic carbon produced by MPB and plankton contributed 64-100%. High salinities
and a wide temperature range likely restrict mangrove productivity in the Gulf region.
Detritivores were the most abundant feeding guild, with isotope measurements
strongly linking them to MPB in both mangrove-lined and un-vegetated intertidal
creeks. MPB thus appeared very important in structuring the aquatic food web in this
arid coastal area. Both mangrove and un-vegetated sites act as feeding grounds for
fishes via pelagic and benthic food pathways.
Supplementary data is given in Annex II
ACKNOWLEDGEMENTS
The authors thank H. Shahraki for his assistant in the field and lab work, the fisherman
Saleh Sharifi and his family for assistance during the field work, and M. Dianat
(Payamnoor University, Qeshm island branch), M. Golshani, M. Barani and M. 67

Microphytobenthos Sustain Fish Food Webs in Intertidal Arid Habitats
Parvaresh (Iranian fishery organization) and X. Feghhi (Persian Gulf Biotechnology
Research Center) for logistical support. We also thank A. Sari for his help with crab
identification, K. Bischof, M. Teichberg and K. Becker for their support to identify
microphytobenthos. M. Elliott and U. Saint-Paul provided useful comments on the
feeding guilds. A. Sepulveda Lozada, J. Plass-Johnson and F. Weigt reviewed an
earlier version of the manuscript. D. Dasbach, M. Birkicht, S. Bröhl and C.
Waldthausen provided laboratory support. We thank to T. Mann for his help with GIS.
M. S. has been supported by a German National merit foundation (Studienstiftung des
deutschen Volkes) scholarship. This work was supported by `the Leibniz Center for
Tropical Marine Ecology (ZMT) project number 7109' and `GLOMAR - Bremen
International Graduate School for Marine Sciences'. The Food and Agriculture
Organization of the United Nations (FAO) kindly provided permission for use of fish
illustrations. We thank the associate editor and 2 anonymous reviewers for their
insightful comments.
REFERENCES Abrantes, K., and M. Sheaves. 2008. Incorporation of terrestrial wetland material into
aquatic food webs in a tropical estuarine wetland. Estuarine, Coastal and Shelf Science 80: 401-412.
Abrantes, K.t., and M. Sheaves. 2009. Food web structure in a near-pristine mangrove area of the Australian Wet Tropics. Estuarine, Coastal and Shelf Science 82: 597-607.
Al-Hasan, R., and W. Jones. 1989. Marine algal flora and sea grasses of the coast of Kuwait. J. Univ. Kuwait (Sci.) 16: 289-342.
Al-Khayat, J.A., and D.A. Jones. 1999. A Comparison of the Macrofauna of Natural and Replanted Mangroves in Qatar. Estuarine, Coastal and Shelf Science 49, Supplement 1: 55-63.
Al-Maslamani, I., M.E.M. Walton, H. Kennedy, and L. Le Vay. 2012. Sources of primary production supporting food webs in an arid coastal embayment. Marine Biology 159: 1753-1762.
Al-Maslamani, I., M.E.M. Walton, H.A. Kennedy, M. Al-Mohannadi, and L. Le Vay. 2013. Are mangroves in arid environments isolated systems? Life-history and evidence of dietary contribution from inwelling in a mangrove-resident shrimp species. Estuarine, Coastal and Shelf Science 124: 56-63.
Al-Zaidan, A., H. Kennedy, D. Jones, and S. Al-Mohanna. 2006. Role of microbial mats in Sulaibikhat Bay (Kuwait) mudflat food webs: evidence from δ13C analysis. Marine Ecology. Progress Series 308: 27-36.
Alongi, D.M. 2014. Carbon cycling and storage in mangrove forests. Annual Review of Marine Science 6: 195-219.
68
Chapter III
Bouillon, S., R.M. Connolly, and S.Y. Lee. 2008. Organic matter exchange and cycling in mangrove ecosystems: Recent insights from stable isotope studies. Journal of Sea Research 59: 44-58.
Bouillon, S., P.C. Mohan, N. Sreenivas, and F. Dehairs. 2000. Sources of suspended organic matter and selective feeding by zooplankton in an estuarine mangrove ecosystem as traced by stable isotopes. Marine Ecology Progress Series 208: 79-92.
Bouillon, S.B., N.K. Koedam, A.R. Raman, and F.D. Dehairs. 2002. Primary producers sustaining macro-invertebrate communities in intertidal mangrove forests. Oecologia 130: 441-448.
Bui, T.H.H., and S.Y. Lee. 2014. Does ‘You Are What You Eat’Apply to Mangrove Grapsid Crabs? PloS one 9: e89074.
Bunn, S., N. Loneragan, and M. Kempster. 1995. Effects of acid washing on stable isotope ratios of C and N in penaeid shrimp and seagrass: implications for food-web studies using multiple stable isotopes. Limnology and Oceanography 40: 622-625.
Chew, L.L., V.C. Chong, K. Tanaka, and A. Sasekumar. 2012. Phytoplankton fuel the energy flow from zooplankton to small nekton in turbid mangrove waters. Marine Ecology Progress Series 469: 7-24.
Chong, V.C. 2007. Mangroves-fisheries Linkages-The Malaysian perspective. Bulletin of Marine Science 80: 755-772.
Deegan, L., and R. Garritt. 1997. Evidence for spatial variability in estuarine food webs. Marine Ecology Progress Series 147: 31-47.
DeNiro, M.J., and S. Epstein. 1978. Influence of diet on the distribution of carbon isotopes in animals. Geochimica et Cosmochimica Acta 42: 495-506.
Elliott, M., A.K. Whitfield, I.C. Potter, S.J.M. Blaber, D.P. Cyrus, F.G. Nordlie, and T.D. Harrison. 2007. The guild approach to categorizing estuarine fish assemblages: a global review. Fish and Fisheries 8: 241-268.
France, R. 1995. Carbon-13 enrichment in benthic compared to planktonic algae: foodweb implications. Marine Ecology Progress Series 124: 307-312.
France, R., J. Holmquist, M. Chandler, and A. Cattaneo. 1998. δ15N evidence for nitrogen fixation associated with macroalgae from a seagrass-mangrove-coral reef system. Marine Ecology Progress Series 167: 297-299.
Froese, R., and D. Pauly. 2012. FishBase: world wide web electronic publication, version (09/2010). URL www. fishbase. org. Accessed October 2013.
Fry, B. 2006. Stable isotope ecology: Springer. Fry, B. 2013a. Alternative approaches for solving underdetermined isotope mixing
problems. Marine Ecology Progress Series 472: 1-13. Fry, B. 2013b. Minmax solutions for underdetermined isotope mixing problems: Reply
to Semmens et al. (2013). Marine Ecology Progress Series 490: 291-294. Fry, B., and K.C. Ewel. 2003. Using stable isotopes in mangrove fisheries research - a
review and outlook. Isotopes in Environmental Health Studies 39: 191-196.
69

Microphytobenthos Sustain Fish Food Webs in Intertidal Arid Habitats
Gandhi, V. 2002. Studies on the food and feeding habits of cultivable butterfish Scatophagus argus. Journal of the Marine Biological Association of India 44: 115-121.
Gearing, J.N. 1991. The Study of Diet and Trophic Relationships through Natural Abundance 13C. Carbon Isotope Techniques: 201.
Giarrizzo, T., R. Schwamborn, and U. Saint-Paul. 2011. Utilization of carbon sources in a northern Brazilian mangrove ecosystem. Estuarine, Coastal and Shelf Science 95: 447-457.
Goering, J., V. Alexander, and N. Haubenstock. 1990. Seasonal variability of stable carbon and nitrogen isotope ratios of organisms in a North Pacific Bay. Estuarine, Coastal and Shelf Science 30: 239-260.
Gotelli, N.J., and R.K. Colwell. 2011. Estimating species richness. Biological Diversity: Frontiers in Measurement and Assessment: 39-54.
Hajisamae, S., and S. Ibrahim. 2008. Seasonal and spatial variations of fish trophic guilds in a shallow, semi-enclosed tropical estuarine bay. Environmental Biology of Fishes 82: 251-264.
Igulu, M.M., I. Nagelkerken, G. van der Velde, and Y.D. Mgaya. 2013. Mangrove Fish Production is Largely Fuelled by External Food Sources: A Stable Isotope Analysis of Fishes at the Individual, Species, and Community Levels from Across the Globe. Ecosystems 16: 1336-1352.
Kieckbusch, D., K., M. Koch, S., J. Serafy, E., and W.T. Anderson. 2004. Trophic Linkages Among Primary Producers and Consumers in Fringing Mangroves of Subtropical Lagoons. Bulletin of Marine Science 74: 271-285.
Kiso, K., and M.I. Mahyam. 2003. Distribution and feeding habits of juvenile and young John's snapper Lutjanus johnii in the Matang mangrove estuary, west coast of Peninsular Malaysia. Fisheries Science 69: 563-568.
Kruitwagen, G., I. Nagelkerken, B.R. Lugendo, Y.D. Mgaya, and S.E.W. Bonga. 2010. Importance of different carbon sources for macroinvertebrates and fishes of an interlinked mangrove-mudflat ecosystem (Tanzania). Estuarine, Coastal and Shelf Science 88: 464-472.
Layman, C.A. 2007. What can stable isotope ratios reveal about mangroves as fish habitat? Bulletin of Marine Science 80: 513-527.
Lee, S.Y. 1995. Mangrove outwelling: a review. Hydrobiologia 295: 203-212. Lugendo, B.R., I. Nagelkerken, G. Kruitwagen, G. van der Velde, and Y.D. Mgaya.
2007. Relative importance of mangroves as feeding habitats for fishes: a comparison between mangrove habitats with different settings. Bulletin of Marine Science 80: 497-512.
MacLeod, N.A., and D.R. Barton. 1998. Effects of light intensity, water velocity, and species composition on carbon and nitrogen stable isotope ratios in periphyton. Canadian Journal of Fisheries and Aquatic Sciences 55: 1919-1925.
Manson, F., N. Loneragan, G. Skilleter, and S. Phinn. 2005. An evaluation of the evidence for linkages between mangroves and fisheries: a synthesis of the literature and identification of research directions. Oceanography and Marine Biology: an Annual Review 43: 483-513.
70

Chapter III
Marguillier, S., G. van der Velde, F. Dehairs, M. Hemminga, and S. Rajagopal. 1997. Trophic relationships in an interlinked mangrove-seagrass ecosystem as traced by δ 13C and δ 15N. Marine Ecology Progress Series 151.
McConnaughey, T., and C. McRoy. 1979. 13C label identifies eelgrass (Zostera marina) carbon in an Alaskan estuarine food web. Marine Biology 53: 263-269.
McCutchan, J.H., W.M. Lewis, C. Kendall, and C.C. McGrath. 2003. Variation in trophic shift for stable isotope ratios of carbon, nitrogen, and sulfur. Oikos 102: 378-390.
Nagelkerken, I. 2009. Evaluation of Nursery function of Mangroves and Seagrass beds for Tropical Decapods and Reef fishes: Patterns and Underlying Mechanisms Ecological Connectivity among Tropical Coastal Ecosystems, 357-399: Springer Netherlands.
Nagelkerken, I., S.J.M. Blaber, S. Bouillon, P. Green, M. Haywood, L.G. Kirton, J.O. Meynecke, J. Pawlik, H.M. Penrose, A. Sasekumar, and P.J. Somerfield. 2008. The habitat function of mangroves for terrestrial and marine fauna: A review. Aquatic Botany 89: 155-185.
Nagelkerken, I., and G.v.d. Velde. 2004. Relative importance of interlinked mangroves and seagrass beds as feeding habitats for juvenile reef fish on a Caribbean island. Marine Ecology Progress Series 274: 153-159.
Nyunja, J., M. Ntiba, J. Onyari, K. Mavuti, K. Soetaert, and S. Bouillon. 2009. Carbon sources supporting a diverse fish community in a tropical coastal ecosystem (Gazi Bay, Kenya). Estuarine, Coastal and Shelf Science 83: 333-341.
Olin, J., S. Rush, M.A. MacNeil, and A. Fisk. 2012. Isotopic Ratios Reveal Mixed Seasonal Variation Among Fishes from Two Subtropical Estuarine Systems. Estuaries and Coasts 35: 811-820.
Peterson, B.J., and B. Fry. 1987. Stable Isotopes in Ecosystem Studies. Annual Review of Ecology and Systematics 18: 293-320.
Phillips, D.L., and J.W. Gregg. 2001. Uncertainty in source partitioning using stable isotopes. Oecologia 127: 171-179.
Pinnegar, J.K., and N.V.C. Polunin. 1999. Differential fractionation of δ13C and δ15N among fish tissues: implications for the study of trophic interactions. Functional Ecology 13: 225-231.
Post, D., C. Layman, D.A. Arrington, G. Takimoto, J. Quattrochi, and C. Montaña. 2007. Getting to the fat of the matter: models, methods and assumptions for dealing with lipids in stable isotope analyses. Oecologia 152: 179-189.
Price, A.R.G., C.R.C. Sheppard, and C.M. Roberts. 1993. The Gulf: Its biological setting. Marine Pollution Bulletin 27: 9-15.
Price, G.D., M.R. Badger, F.J. Woodger, and B.M. Long. 2008. Advances in understanding the cyanobacterial CO2-concentrating-mechanism (CCM): functional components, Ci transporters, diversity, genetic regulation and prospects for engineering into plants. Journal of Experimental Botany 59: 1441-1461.
71

Microphytobenthos Sustain Fish Food Webs in Intertidal Arid Habitats
Reynolds, R. 2002. Oceanography. In Khan N, Munawar M and Price A (ed) The Gulf ecosystem: health and sustainability. Backhuys Publishers, Leiden, The Netherlands: 55-64.
Rixen, T., P. Ramachandran, L. Lehnhoff, D. Dasbach, B. Gaye, B. Urban, R. Ramachandran, and V. Ittekkot. 2011. Impact of monsoon-driven surface ocean processes on a coral off Port Blair on the Andaman Islands and their link to North Atlantic climate variations. Global and Planetary Change 75: 1-13.
Robertson, A., and N. Duke. 1987. Mangroves as nursery sites: comparisons of the abundance and species composition of fish and crustaceans in mangroves and other nearshore habitats in tropical Australia. Marine Biology 96: 193-205.
Rodelli, M.R., J.N. Gearing, P.J. Gearing, N. Marshall, and A. Sasekumar. 1984. Stable isotope ratio as a tracer of mangrove carbon in Malaysian ecosystems. Oecologia 61: 326-333.
Schwamborn, R., W. Ekau, M. Voss, and U. Saint-Paul. 2002. How important are mangroves as a carbon source for decapod crustacean larvae in a tropical estuary? Marine Ecology Progress Series 229: 195-205.
Sheppard, C., M. Al-Husiani, F. Al-Jamali, F. Al-Yamani, R. Baldwin, J. Bishop, F. Benzoni, E. Dutrieux, N.K. Dulvy, S.R.V. Durvasula, D.A. Jones, R. Loughland, D. Medio, M. Nithyanandan, G.M. Pilling, I. Polikarpov, A.R.G. Price, S. Purkis, B. Riegl, M. Saburova, K.S. Namin, O. Taylor, S. Wilson, and K. Zainal. 2010. The Gulf: A young sea in decline. Marine Pollution Bulletin 60: 13-38.
Spalding, M., M. Spalding, M. Kainuma, and L. Collins. 2010. World atlas of mangroves: Earthscan.
Tse, P., T.H.M. Nip, and C.K. Wong. 2008. Nursery function of mangrove: A comparison with mudflat in terms of fish species composition and fish diet. Estuarine, Coastal and Shelf Science 80: 235-242.
Twilley, R.R., M. Montaño, J.M. Valdivieso, and A. Bodero. 1999. The environmental quality of coastal ecosystems in Ecuador: Implications for the development of integrated mangrove and shrimp pond management. Mangrove Ecosystems in Tropical America. IUCN/NOAA/Instituto de Ecologia, Xalapa, Mexico: 199-230.
Uddin, S., A.N. Al-Ghadban, M. Behbehani, A. Aba, A. Al Mutairi, and Q. Karam. 2012. Baseline concentration of 210Po in Kuwait’s commercial fish species. Marine Pollution Bulletin 64: 2599-2602.
Vaslet, A., D.L. Phillips, C. France, I.C. Feller, and C.C. Baldwin. 2012. The relative importance of mangroves and seagrass beds as feeding areas for resident and transient fishes among different mangrove habitats in Florida and Belize: Evidence from dietary and stable-isotope analyses. Journal of Experimental Marine Biology and Ecology 434–435: 81-93.
Vizzini, S., and A. Mazzola. 2003. Seasonal variations in the stable carbon and nitrogen isotope ratios (13C/12C and 15N/14N) of primary producers and consumers in a western Mediterranean coastal lagoon. Marine Biology 142: 1009-1018.
72

Chapter III
Wolcott, D.L., and N.J. O'Connor. 1992. Herbivory in Crabs: Adaptations and Ecological Considerations. American Zoologist 32: 370-381.
Woodland, D.J. 1984. Gerreidae. In W. Fischer and G. Bianchi (ed.) FAO species identification sheets for fishery purposes. Western Indian Ocean fishing area 51. Vol. 2. FAO, Rome.
Wu, Y., J. Zhang, D.J. Li, H. Wei, and R.X. Lu. 2003. Isotope variability of particulate organic matter at the PN section in the East China Sea. Biogeochemistry 65: 31-49.
Yamamuro, M., H. Kayanne, and M. Minagawa. 1995. Carbon and nitrogen stable isotopes of primary producers in coral reef ecosystems. Limnology and Oceanography 40: 617-621.
Yamashita, Y., N. Piamthipmanus, and K. Mochizuki. 1987. Gut contents analysis of fishes sampled from the Gulf of Thailand. In K. Kawaguchi (ed.) studies on the mechanism of marine productivity in the shallow waters around the South China Sea with special reference to the Gulf of Thailand, Ministry of Educ. Sci. and Culture, Japan: 33-55.
Zagars, M., K. Ikejima, A. Kasai, N. Arai, and P. Tongnunui. 2013. Trophic characteristics of a mangrove fish community in Southwest Thailand: Important mangrove contribution and intraspecies feeding variability. Estuarine, Coastal and Shelf Science 119: 145-152.
73

74

CHAPTER IV
Seasonal Fisheries Changes in Low-Rainfall Mangrove Ecosystems
Maryam Shahraki
Brian Fry
Manuscript submitted
75

76

Chapter IV
ABSTRACT
To determine the role of mangroves for fisheries in the arid region of the Persian Gulf,
we investigated fish community structure and trophic diversity in intertidal creeks with
and without mangroves. Fish community abundance and biomass were compared
across habitats and seasons. To identify variations in overall community trophic niches
among habitats and seasons, we measured niches with size-corrected standard ellipse
areas (SEAc) calculated from C and N stable isotope values. We found a general
similarity in the diversity patterns, although slightly greater species richness occurred
at mangrove sites. However, there were no consistent differences in fish abundance
and biomass for mangrove vs. non-mangrove fish collections. Community trophic
diversity measured as SEAc also showed no significant difference between mangrove
and non-mangrove sites. Instead, strong seasonal patterns were observed in the fish
assemblages. Winter samples had consistently higher fish abundance and biomass than
summer samples. Winter SEAc values were significantly higher, indicating that the fish
community had a larger isotopic niche in winter than summer. Overall, we found that
seasonality was much stronger than habitat in determining fish community structure
and trophic diversity in the mangrove and non-mangrove ecosystems of Qeshm Island,
Iran.
Key words Fish community structure, isotopic niche size, mangrove, non-mangrove,
Qeshm Island, Iran
77
Seasonal Fisheries Changes in Low-Rainfall Mangrove Ecosystems
INTRODUCTION
Mangrove forests are highly productive coastal ecosystems with high rates of primary
production that help support complex local food webs (Blaber 2007; Chong 2007;
Alongi 2014). Over the past 50 years, one-third of the world’s mangrove forests have
been destroyed by human disturbance through urban development, farming and
pollution, and the remaining mangrove forests are under continuing threat from these
factors (Alongi 2002). Rationales for conserving mangrove ecosystems are partly
based on hypotheses that mangroves are important for fisheries (Fry and Ewel 2003).
Fish abundance in mangroves has been attributed to the diversity and availability of
food sources in this habitat (Laegdsgaard and Johnson 2001), and primary producers
such as microphytobenthos, macroalgae and phytoplankton have been identified as
sources of nutrition for many fish in mangrove ecosystems (Nagelkerken et al. 2008).
But a number of other variables are also known to influence mangrove-associated fish
assemblages. High structural complexity and shelter from predation have been
recognized as major factors responsible for the greater abundance of mangrove-
associated fish (Blaber 2000; Manson et al. 2005; Verweij et al. 2006). Overall, clear
tests of how mangroves influence fish communities and fisheries sustainability are
relatively rare.
Most studies have examined the role of mangrove as fish habitat from the
perspective of either community structure or trophic diversity. Community approach
studies have documented greater abundance of juvenile species in mangroves than in
other nearshore habitats e.g. in Australia (Robertson and Duke 1987; Laegdsgaard and
Johnson 1995), Malaysia (Chong et al. 1990) and the Caribbean (Nagelkerken and
Velde 2002). However, any changes in the trophic web may have strong effects on the
whole community, and result in major changes to ecosystem structure and function
(Williams et al. 2002; Duffy 2003). The analysis of trophic structure can be used to
complement the commonly used community descriptors, by giving a different set of
quantitative measures of community structure (Bersier et al. 2002; Kaartinen and
Roslin 2012). Newsome et al. (2007) emphasized that stable isotope analysis can
provide quantitative information on animal food use and trophic niche sizes. We used a
combination of community descriptors and isotopic niche estimates as a more holistic
approach to determining the habitat use and function of mangrove fisheries.
While some studies show that mangrove organic matter provides important
nutrition to aquatic communities (Giarrizzo et al. 2011; Zagars et al. 2013; Abrantes et 78

Chapter IV
al. 2015), other studies do not show a strong nutritional linkage between mangroves
and fisheries, especially in the Caribbean and Gulf region (Nagelkerken and Velde
2004; Al-Maslamani et al. 2012). Factors that may help explain these divergent results
include environmental parameters such rainfall and tidal regimes that may affect
outwelling of mangrove derived organic carbon (Alongi 2009). This study focused on
a low rainfall region in the Persian Gulf to test the idea that low rainfall might lead to
low mangrove use in fisheries food webs. Mangroves in this area are the northernmost
mangroves in the Indo-Pacific region and are subjected to very low rainfall and high
salinities (Al-Khayat and Jones 1999). Along the Iranian coast of Persian Gulf, natural
mangroves stands are limited to 10 sites (Spalding et al. 2010) and the understanding
of the relationship between mangroves and fisheries has received little study in this
area.
A recent stable isotope study of the contribution of carbon sources supporting
mangrove food webs suggested that the direct importance of mangrove litter as
assimilated food was surprisingly low for Persian Gulf mangroves (Shahraki et al.
2014). Also, possible nutritional use of mangroves was less than use of other primary
producers for benthic and epibenthic invertebrates in the Gulf region (Al-Zaidan et al.
2006; Al-Maslamani et al. 2012). Therefore, there was a need to assess the role of
mangroves for fisheries in the Persian Gulf region. Due to the aridity of the coast of
Persian Gulf, many intertidal creeks are devoid of mangroves but still may be
important habitats for fish. This provides a unique opportunity to evaluate the fisheries
support of mangroves by comparing mangrove and non-mangrove habitats. We
hypothesized that fish community structure is the same in our low-rainfall mangrove
and non-mangrove habitats, and also the communities have the same isotopic niche
size across habitats. We also considered whether the high seasonal fluctuations in
water temperature (>20°C) in Qeshm mangroves might have strong impact on the
variability of food sources with resultant in changes fish communities. Sampling was
designed to contrast the effects of habitats (mangroves vs. non-mangroves) versus
season as controls of fisheries food webs in the Persian Gulf. We tested whether
mangroves enhance fisheries support by comparing the community-level fish diversity,
abundance, biomass and trophic diversity across habitats and seasons.
79

Seasonal Fisheries Changes in Low-Rainfall Mangrove Ecosystems
MATERIALS AND METHODS
Study sites
The study was carried out at Qeshm Island, Strait of Hormuz, Iranian coast of the
Persian Gulf (26.8°N, 55.75°E) (Fig. 1A, B). Mangrove sampling sites included four
intertidal creeks (C1, C2, C3, C4) that drained into a main channel. The mangroves
extended 5-50 m inland as a fringe along the creek banks, and were 3-6 m tall; and
non-mangrove sites included two intertidal creeks (C5 and C6) (Fig. 1C, D). The
distance between the two sets of creeks was ca. 4 km.
Figure 1 Study area in Qeshm Island, Iran. Location of the study area in the region (A), sampling sites (mangroves in light gray) (B), mangrove site (with 4 intertidal creeks) (C), non-mangrove site (with 2 intertidal bare creeks) (D), bathymetric maps of creeks 1, 2, 3, 4, 5 and 6 (E).
Sample collection
Fish were sampled by setting block nets (15 - 25 m in length, 4 m high; 12 mm
stretched mesh size) at slack high water during four different combinations of tide and
daylight conditions. The block net method is regarded as highly efficient in recording
the fish fauna using intertidal habitats (Bozeman and Dean 1980) and used for fish
80

Chapter IV
collection in some mangroves studies e.g. in South Florida (Thayer et al. 1987) and
Brazil (Barletta et al. 2003). Block net sampling is an area-based method and results
are reported here both on a per sample and per area (m-2) basis.
Six nets were deployed simultaneously at low tide along the mouth of the
creeks and were buried in the sediment and held in place with wooden stakes. The nets
were rolled down to the level of the sediment and left until high tide. At high tide, the
top of the nets were lifted onto wooden stakes. In the following low tide when the
creeks were almost empty the fish were collected. Prawns were also collected
simultaneously by the nets with 2 mm mesh size. A total of 96 and 32 block net
samples were taken from mangrove and non-mangrove intertidal creeks in winter
(December and February) and summer (August) 2011-2012. December sampling was
carried out only in mangrove creeks and results were therefore excluded from this
study.
All fish and prawns were transported on ice to the laboratory. They were
identified to the lowest possible taxonomic level (Fischer and Bianchi 1984;
Kuronuma and Abe 1986; Assadi et al. 1997), counted and weighed (g ± 0.1). Fish
total length was measured to the nearest 0.1 cm and analyzed in class intervals of 2.5
cm, except for five large-sized species (see species name with # symbols, Table 1)
where a 10 cm class interval was used. Abundance estimates were based on the
number of individual fish collected.
Bathymetric surveys of the creeks were carried out at the end of the sampling
period to assess the local topography with respect to tidal inundation and drainage
patterns. A survey included measuring water levels at different horizontal transects for
each creek using a tape measure, GPS and a compass, then drawing approximate
inundation areas on a grid map in the field. This information was used with GIS
software to produce a bathymetric map of each creek (Fig. 1E). Abundance and
biomass for each species per sample were converted to abundance and biomass per m2
by dividing total values by respective inundation area for each creek. The inundation
areas and volumes of water of the creeks are presented in Table S1.
Carbon and nitrogen isotopic values of various potential food sources
(mangrove leaves, microphytobenthos (MPB), plankton, particulate organic matter
(POM), sediment organic matter (SOM), macrobenthos and fishes were measured to
estimate the trophic diversity in mangrove and non-mangrove sites. Details of this data
set have been published previously (Shahraki et al. 2014). 81

Seasonal Fisheries Changes in Low-Rainfall Mangrove Ecosystems
Data analysis
Since the objective of the present study was to determine habitat, creek and seasonal
effects rather than tide-diel variations, statistical analyses were performed for each site
per season. We used the EstimateS software (Colwell 2009) to produce the rarefaction
curves and estimate species richness.
To assess whether intertidal fish assemblages differed in abundance or biomass
between habitats, creeks and seasons, three-way PERMANOVA (permutational
multivariate analysis of variance) models were used with the factors: habitat (fixed,
two levels: mangrove and non-mangrove), creek (random, six levels, C1, C2, C3, C4,
C5, C6) nested in habitat and season (fixed, two levels, winter and summer).
Additionally, with the same set up in PERMANOVA, differences between
habitats were tested using Monte-Carlo p-values, because not enough unique
permutations were possible to determine permutational p-values for the factor habitat.
Monte-Carlo p-values provide an approximation of significance based on asymptotic
theory and should be used in preference to the permutational p-values when the
number of unique permutations is < 100 (Anderson et al. 2008). Canonical analysis of
principal coordinates (CAP) was used as a constrained ordination procedure to
visualize fish abundance patterns revealed by PERMANOVA. CAP is a canonical
multivariate discriminant analysis which maximizes the differences among a priori
defined groups. The main species responsible for differences were identified based on
the strength of their correlation (|r|>0.4) with the CAP axes. Analyses were performed
on square-root transformed data and based on Bray-Curtis distances (Anderson et al.
2008).
Fish abundance and biomass comparisons were made on both a per m2 basis
and on a per sample basis, with the per m2 comparisons more appropriate if fish were
resident, and the per sample comparisons more appropriate if fish were transient.
Because fish communities likely represent a mix of residents and transients, we
considered comparisons ecologically robust when significant differences were found in
parallel and significant for both ways of expressing the data (e.g., results were
considered ecologically robust when abundance was higher both on a per m2 basis and
also on a per sample basis). Alternatively, if abundance (or biomass) results were not
parallel and significant when expressed on a m-2 and a per sample basis, results were
not considered ecologically robust. This logic showed that seasonal differences in
abundance and biomass were consistently parallel, significant and robust for the fish 82
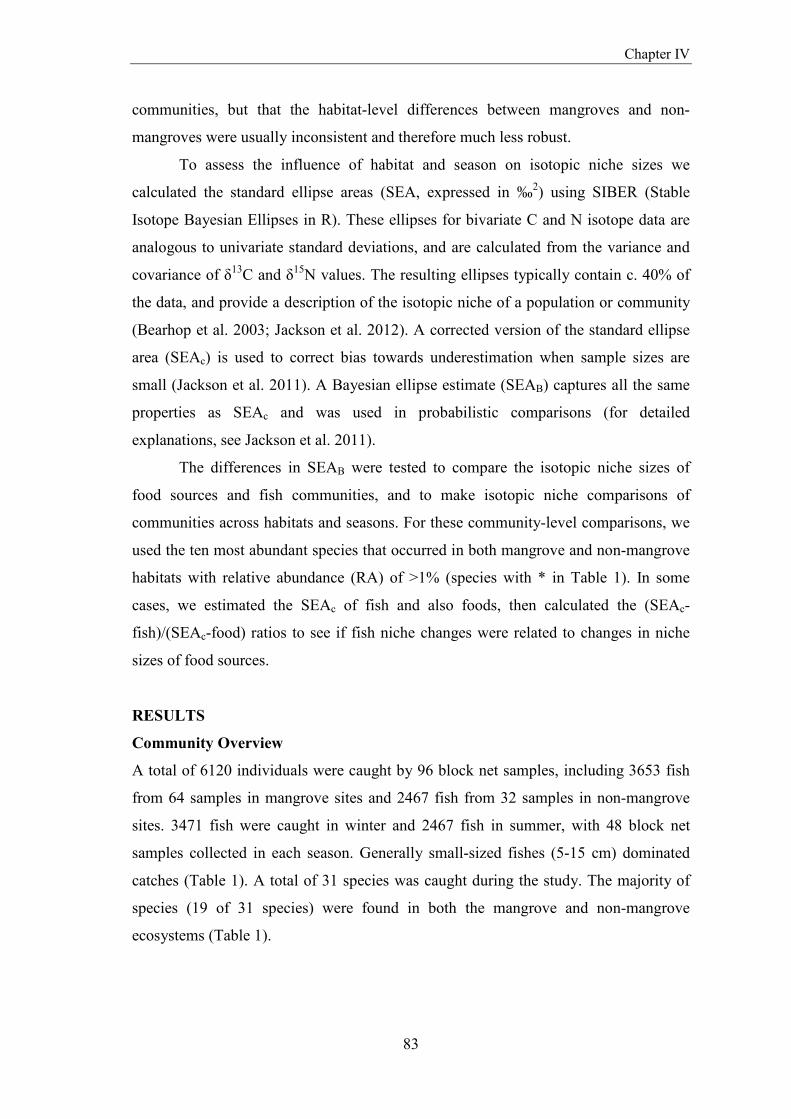
Chapter IV
communities, but that the habitat-level differences between mangroves and non-
mangroves were usually inconsistent and therefore much less robust.
To assess the influence of habitat and season on isotopic niche sizes we
calculated the standard ellipse areas (SEA, expressed in ‰2) using SIBER (Stable
Isotope Bayesian Ellipses in R). These ellipses for bivariate C and N isotope data are
analogous to univariate standard deviations, and are calculated from the variance and
covariance of δ13C and δ15N values. The resulting ellipses typically contain c. 40% of
the data, and provide a description of the isotopic niche of a population or community
(Bearhop et al. 2003; Jackson et al. 2012). A corrected version of the standard ellipse
area (SEAc) is used to correct bias towards underestimation when sample sizes are
small (Jackson et al. 2011). A Bayesian ellipse estimate (SEAB) captures all the same
properties as SEAc and was used in probabilistic comparisons (for detailed
explanations, see Jackson et al. 2011).
The differences in SEAB were tested to compare the isotopic niche sizes of
food sources and fish communities, and to make isotopic niche comparisons of
communities across habitats and seasons. For these community-level comparisons, we
used the ten most abundant species that occurred in both mangrove and non-mangrove
habitats with relative abundance (RA) of >1% (species with * in Table 1). In some
cases, we estimated the SEAc of fish and also foods, then calculated the (SEAc-
fish)/(SEAc-food) ratios to see if fish niche changes were related to changes in niche
sizes of food sources.
RESULTS
Community Overview
A total of 6120 individuals were caught by 96 block net samples, including 3653 fish
from 64 samples in mangrove sites and 2467 fish from 32 samples in non-mangrove
sites. 3471 fish were caught in winter and 2467 fish in summer, with 48 block net
samples collected in each season. Generally small-sized fishes (5-15 cm) dominated
catches (Table 1). A total of 31 species was caught during the study. The majority of
species (19 of 31 species) were found in both the mangrove and non-mangrove
ecosystems (Table 1).
83
Seasonal Fisheries Changes in Low-Rainfall Mangrove Ecosystems
Table 1 Fish species composition in mangrove and non-mangrove intertidal creeks of Qeshm Island from winter (February 2012) and summer (August 2012). Relative abundance (RA) = 100* total individuals in the species/total individuals in the study; Occurrence (M %, NM %) are % samples where individuals of the species occurred (in mangrove and non-mangrove habitats). # symbols indicate large-sized species, and asterisks indicate the species considered for the SEA.
Size range
(cm) RA (%)
Occurrence (M %)
Occurrence (NM %)
Mangrove and Non-mangrove Scatophagus argus (Scatophagidae)* 2.5 - 10 2 96 4
Pomadasys kaakan (Haemulidae)* 5 - 15 2 90 10 Ilisha melastoma (Clupeidae) 5 - 10 0 82 18 Sarinella longiceps (Clupeidae)* 5 - 10 3 88 12 Leiognathus daura (Leiognathidae)* 5 - 12.5 15 75 25 Thryssa vitrirostris (Engraulidae)* 10 - 15 8 78 22 Acanthopagrus cuvieri (Sparidae) 15 - 20 0 79 21 Pentaprion longimanus (Gerreidae)* 5 - 12.5 8 60 40 Acanthopagrus latus (Sparidae)* 5 - 15 3 55 45 Eleutheronema tetradactylum (Polynemidae)# 20 - 30 0 60 40 Scomberoides lysan (Carangidae) 5 - 10 0 56 44 Liza klunzingeri (Mugilidae)* 5 - 20 38 34 66 Pseudorhombus elevatus (Paralichthyidae) 10 - 15 0 43 57 Platycephalus indicus (Platycephalidae)# 30 - 40 0 33 67 Sphyraena putnamiae (Sphyraenidae)# 30 - 40 0 20 80 Hemiramphus archipelagicus (Hemiramphidae) 12.5 - 15 0 33 67 Sillago sihama (Sillaginidae)* 10 - 17.5 1 19 81 Upeneus sulphureus (Mullidae) 10 - 15 0 20 80 Anodontostoma chacunda (Clupeidae)* 5 - 10 16 7 93 Mangroves only
Lutjanus johni (Lutjanidae) 5 - 15 0 100 0 Plectorhinchus pictus (Haemulidae) 5 - 15 0 100 0 Sardinella gibbosa (Clupeidae) 5 - 10 2 100 0 Scartelaos tenuis (Gobiidae) 5 - 10 0 100 0 Bathygobius fuscus (Gobiidae) 5 - 10 0 100 0 Epinephelus coioides (Serranidae)# 30 - 40 0 100 0 Abalistes stellatus (Balistidae)# 20 -30 0 100 0 Lutjanus russelli (Lutjanidae) 10 - 15 0 100 0 Strongylura stronglura (Belonidae) 10 - 15 0 100 0 Non-mangrove only
Terapon jarbua (Terapontidae ) 7.5 - 10 0 0 100 Euryglossa orientalis (Soleidae ) 12.5 - 15 0 0 100 Gerres poieti (Gerreidae) 5 - 12.5 1 0 100 Crustacean
Penaeus merguiensis (Penaeidae)
100 0
84

Chapter IV
Fish diversity
Diversity was generally similar for both seasons and habitats (Fig. 2). The observed
number of species was similar at 20-22 species when 2000 individuals were considered
for comparisons between mangrove and non-mangrove sites or between winter and
summer collections (Fig. 2). The Chao1 species richness estimator reached asymptotic
values for fish from different sites (at 28 and 21 species for mangrove and non-
mangrove, respectively) and seasons (at 24 and 22 species for winter and summer,
respectively), well before all the individuals were collected in each habitat and season.
This indicated that species richness of the intertidal fish communities was well-
characterized by our sampling, and that additional sampling should not have yielded
additional species (Gotelli and Colwell 2011).
Figure 2 Individual-based rarefaction curves of fish species sampled in different habitats (mangrove vs. non-mangrove) and seasons (winter vs. summer). Dashed lines indicate 95% confidence intervals.
Nine species from seven families were caught only in mangrove creeks
descending by abundance: Sardinella gibbosa (Clupeidae), Lutjanus johni
(Lutjanidae), Plectorhinchus pictus (Haemulidae), Bathygobius fuscus and Scartelaos
tenuis (Gobiidae), Lutjanus russelli (Lutjanidae) Epinephelus coioides (Serranidae),
Abalistes stellatus (Balistidae) and Strongylura stronglura (Belonidae). One species of
85

Seasonal Fisheries Changes in Low-Rainfall Mangrove Ecosystems
prawn (P. merguiensis) also occurred only in the mangrove creeks, and at relatively
high abundance. Three fish species from three families were caught only in the non-
mangrove creeks: Gerres poieti (Gerreidae), Euryglossa orientalis (Soleidae) and
Terapon jarbua (Terapontidae). Regarding seasonal results, G. poieti was only found
in summer, while S. longiceps and S. gibbosa were only found in winter. Most of these
species occurred at low (<1%) relative abundance as rare species e.g., S. lysan, S.
putnamiae, P. pictus, E. coioides and P. indicus occurred in summer, and P. elevates,
A. stellatus, S. stronglura, T. jarbua, E. orientalis and B. fuscus occurred in winter.
Detailed species data for each habitat and season are presented in Table S2.
Fish abundance and biomass
Total fish abundance (individuals) and biomass per sample and per m2 was dominated
by Mugilidae (L. klunzingeri) in both mangrove vs. non-mangrove habitats. Also,
Leiognathidae, Gerreidae, Engraulidae and Clupeidae were among the most abundant
families in both sites. In spite of these similarities, we found inconsistent differences
for mean abundance and biomass for mangrove vs. non-mangrove fish collections.
These inconsistent differences reflected how the comparisons were made, on a per m2
or per sample basis (Fig. 3). Thus, fish from mangroves showed higher abundance and
biomass per m2 than fish from non-mangrove sites, but the opposite pattern pertained
when data was expressed on a per sample basis, i.e., fish from mangroves showed
lower abundance and biomass per sample than fish from non-mangrove sites (Fig. 3).
Only biomass data is shown in Figure 3; additional graphs for abundance and
correlations relating abundance and biomass are presented in the Figures S1 and S2.
86

Chapter IV
Figure 3 Mean fish biomass (g) per sample and per m2 (±SE) in different habitats (left panels) and seasons (right panels). Left panels show fish can be more abundant at greater biomass when results are expressed on a per m2 basis (top panels), but the opposite result pertains when results are expressed on a per sample basis (bottom panels). Right panels show the consistent seasonal differences between winter and summer fish assemblages, regardless of a per sample or per m2 basis used to scale the data.
PERMANOVA tests showed that all these habitat differences were significant
at the 0.004-0.01 level for Monte- Carlo p-values (Table 2). Thus, the habitat-level
comparisons showed significant trends but had opposite directions depending on how
data were expressed. The inconsistent habitat differences were not considered
ecologically robust.
Seasonal effects were much more consistent. Mean winter fish assemblages had
higher biomass and abundance in all comparisons made on a per m2 or per sample
basis (Fig. 3), and seasonal effects were all significant at the 0.015-0.023 level (Table
2). Interactions between season and habitat (mangrove vs. non-mangrove) were also
significant (P <0.05) in three of four cases (Table 2). The seasonal patterns were partly
due to the high abundance of S. argus in summer and Clupeidae (A. chacunda, S.
longiceps and S. gibbosa) during winter. The rare species (e.g. P. elevatus) also
contributed to the high biomass in winter. Lastly, creek-level variations were strong in
PERMANOVA results with P<0.03 (Table 2), but patterns were not consistent
between creeks as shown in Figure S3. Statistical tests showed no significant
interactions between creeks and seasons (Table 2). 87

Seasonal Fisheries Changes in Low-Rainfall Mangrove Ecosystems
Table 2 Results of 3-way PERMANOVA, testing the effects of habitats, creeks and seasons on biomass and abundance per sample and per m2. Biomass and abundance per sample (top matrix) and biomass and abundance per m2 (bottom matrix). Difference were considered to be significant when P < 0.05 (bold values).
Biomass per sample df SS MS Pseudo-F P(perm) perms P(MC) Abundance per sample df SS MS Pseudo-F P(perm) perms P(MC)
Habitat 1 11222 11222 3.221 0.081 15 0.014 Habitat 1 13391 13391 4.12 0.054 15 0.003
Season 1 7555.8 7555.8 4.5085 0.015 998
Season 1 9600.5 9600.5 4.9082 0.016 996
Creek (Habitat) 4 13937 3484.1 1.792 0.006 998
Creek (Habitat) 4 13001 3250.3 1.7139 0.014 998
Habitat x Season 1 4710.9 4710.9 2.811 0.07 997
HabitatxSeason 1 7084.2 7084.2 3.6218 0.037 997
Creek(Habitat)xSeason 4 6703.6 1675.9 0.862 0.664 999
Creek (Habitat) x Season 4 7824 1956 1.0314 0.412 998
Residual 84 163320 1944.3
Residual 84 159300 1896.5
Total 95 209670
Total 95 214110
Biomass per m2 df SS MS Pseudo-F P(perm) perms P(MC) Abundance per m2 df SS MS Pseudo-F P(perm) perms P(MC)
Habitat 1 11945 11945 4.0799 0.067 15 0.004 Habitat 1 16115 16115 5.1394 0.071 15 0.001
Season 1 8341.5 8341.5 5.0361 0.023 997
Season 1 7707.7 7707.7 4.0688 0.018 999
Creek (Habitat) 4 11711 2927.8 1.5134 0.025 998
Creek (Habitat) 4 12543 3135.6 1.6583 0.016 998
Habitat x Season 1 5420 5420 3.2722 0.038 999
Habitat x Season 1 10173 10173 5.37 0.012 997
Creek (Habitat) x Season 4 6625.4 1656.3 0.8562 0.693 998
Creek (Habitat) x Season 4 7577.4 1894.3 1.0018 0.486 997
Residual 84 162510 1934.6
Residual 84 158840 1890.9
Total 95 208720
Total 95 217080
88

Chapter IV
A further examination of the significant factors in the PERMANOVA tests of
Table 2 was performed using the CAP routine with leave-one-out procedures, and
indicated a low overall allocation success for the factor creek (<30%). Thus creeks
were not identified as consistent factor that could separate samples based on the CAP
ordination, despite being significant in PERMANOVA tests. CAP analysis also
showed smaller canonical correlation coefficients for the factor habitat and CAP only
allocated the samples according to the factor season (Fig. 4). Summer samples were
divided from the winter samples along the CAP1 axis. Two species (S. argus and P.
pictus) were correlated with the summer and three species L. daura, S. longiceps and
P. longimanus were correlated with winter (Fig. 4). Detailed CAP results are presented
in Table S3.
Figure 4 Canonical analysis (CAP) yielded two axes regarding factor season, with squared canonical correlations of δ1
2 =0.63 and δ2
2=0.50. Symbols represent biomass (g m-2) for individual block net samples and vectors show individual species correlations with the two CAP axes where |r |>0.4. See Table 1 for full species names.
Isotope niche diversity
The standard ellipses based on fish carbon and nitrogen isotope compositions showed
some differences in niche size among sites and seasons (Fig. 5). The standard ellipse
89

Seasonal Fisheries Changes in Low-Rainfall Mangrove Ecosystems
sizes for fish were more variable between seasons than habitats, with winter ellipses
estimated to be significantly larger than summer ellipses at the 96% probability
indicated by SEAB (Table 3). Mangrove and non-mangrove fish assemblages showed a
much lower 30% probability of difference based on SEAB (Table 3). To examine
whether the seasonal comparisons for fish were due to a larger food isotope variability,
we calculated standard ellipses using food isotopic values (Fig. 5). Food isotope
variability was similar in mangrove vs. non-mangrove sites, but significantly less
diverse in winter than in summer (probability of 99%; Table 3). Density plots showing
the credibility intervals of the standard ellipses areas (SEA) for fish and food sources
are presented in Figure S4.
Figure 5 Standard ellipses areas (SEA) based on carbon and nitrogen stable isotope compositions of fish and food sources from different sites (left panels) and seasons (right panels); upper panels show data for fish, lower panels show data for potential foods. Solid and dashed lines enclose the standard ellipses area (SEAC) that contain ca. 40% of the data and show the isotopic niche of communities and sources at each habitat and season.
We used the fish and food SEA values of Table 3 to calculate (SEAc-
fish)/(SEAc-food) ratios, finding a convergence towards similar results of no difference
for mangrove vs. non-mangrove fish (ratios of 0.4 and 0.5 respectively; Table 3) but
more pronounced differences for winter vs. summer (respective ratios of 0.7 vs. 0.3).
These ratio calculations of larger niche diversity in winter matched those when fish
abundance and biomass were considered, so that this winter increase in the community
feeding niche appeared relatively robust. Also, much less seasonality was observed in
90

Chapter IV
these ratios at the mangrove sites (0.4 and 0.3 for winter and summer, respectively)
versus at non-mangrove sites (0.8 and 0.4 for winter and summer, respectively).
Table 3 Small size-corrected standard ellipse areas (SEAC) for food sources and fish. Probability that the SEA of food sources and fish from one group is smaller than the other group (habitats & seasons) is indicated based on Bayesian standard ellipse areas (SEAB). The SEAc ratios (SEAc fish)/(SEAc food sources) are shown for different habitats and seasons. Bold numbers indicate the high probability of significant differences in SEA.
Food sources Fish Ratios
Groups
SEA
c (‰
2 )
SEA
B n
on-m
angr
ove
< SE
AB m
angr
ove
SEA
B w
inte
r < S
EAB
su
mm
er
SE
Ac (
‰2 )
SEA
B m
angr
ove
> SE
AB
non-
man
grov
e SE
AB w
inte
r > S
EAB
sum
mer
R
atio
s of S
EAc
(fis
h) /(
food
sour
ce)
Mangrove 28.0 0.12 -
11.6 0.30 -
0.4
Non-mangrove 24.0
13.1
0.5
Winter 25.0 - 0.99
16.5 - 0.96
0.7
Summer 34.3
11.6
0.3
DISCUSSION
Season emerged as the most important and significant factor in our analyses of fish
communities of Qeshm Island. Fish were less abundant in summer than in winter. Very
low precipitation and lack of fresh water inputs in the region result in year-round
hyper-saline conditions (salinities of 39 and above), and summer water temperatures
are often high >33oC (Shahraki et al. 2014). Our findings on seasonality are not
unexpected and agree with other studies that have shown that fish abundance and
biomass in tropical mangrove habitats can be related to the environmental parameters
such as salinity (Wright 1986), rainfall (Robertson and Duke 1990; Rooker and Dennis
1991), and turbidity (Little et al. 1988). Fish seasonal patterns in abundance occur
against a wider biogeographic variation in fish diversity, with relatively low diversity
characteristic of the study region (Wright 1989; Blaber 1997; Blaber 2000). The lack
of seagrass in the area may also partly explain the observed low fish diversity (Pittman
et al. 2004).
91
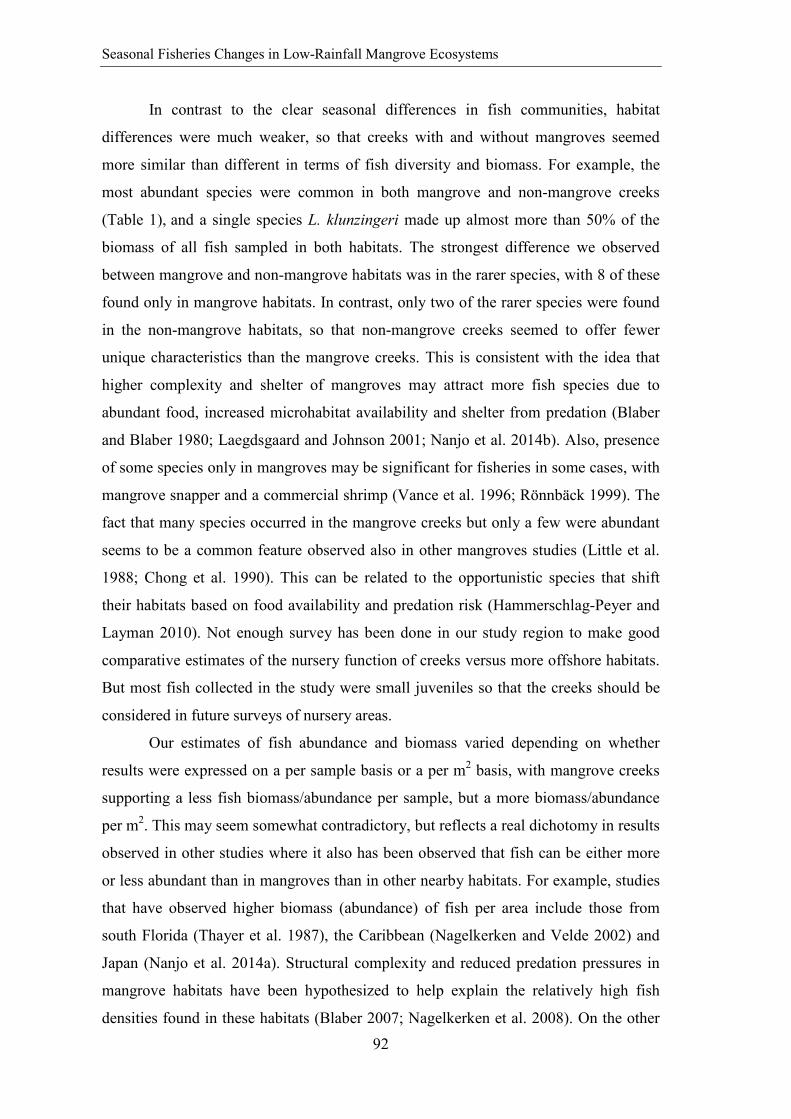
Seasonal Fisheries Changes in Low-Rainfall Mangrove Ecosystems
In contrast to the clear seasonal differences in fish communities, habitat
differences were much weaker, so that creeks with and without mangroves seemed
more similar than different in terms of fish diversity and biomass. For example, the
most abundant species were common in both mangrove and non-mangrove creeks
(Table 1), and a single species L. klunzingeri made up almost more than 50% of the
biomass of all fish sampled in both habitats. The strongest difference we observed
between mangrove and non-mangrove habitats was in the rarer species, with 8 of these
found only in mangrove habitats. In contrast, only two of the rarer species were found
in the non-mangrove habitats, so that non-mangrove creeks seemed to offer fewer
unique characteristics than the mangrove creeks. This is consistent with the idea that
higher complexity and shelter of mangroves may attract more fish species due to
abundant food, increased microhabitat availability and shelter from predation (Blaber
and Blaber 1980; Laegdsgaard and Johnson 2001; Nanjo et al. 2014b). Also, presence
of some species only in mangroves may be significant for fisheries in some cases, with
mangrove snapper and a commercial shrimp (Vance et al. 1996; Rönnbäck 1999). The
fact that many species occurred in the mangrove creeks but only a few were abundant
seems to be a common feature observed also in other mangroves studies (Little et al.
1988; Chong et al. 1990). This can be related to the opportunistic species that shift
their habitats based on food availability and predation risk (Hammerschlag-Peyer and
Layman 2010). Not enough survey has been done in our study region to make good
comparative estimates of the nursery function of creeks versus more offshore habitats.
But most fish collected in the study were small juveniles so that the creeks should be
considered in future surveys of nursery areas.
Our estimates of fish abundance and biomass varied depending on whether
results were expressed on a per sample basis or a per m2 basis, with mangrove creeks
supporting a less fish biomass/abundance per sample, but a more biomass/abundance
per m2. This may seem somewhat contradictory, but reflects a real dichotomy in results
observed in other studies where it also has been observed that fish can be either more
or less abundant than in mangroves than in other nearby habitats. For example, studies
that have observed higher biomass (abundance) of fish per area include those from
south Florida (Thayer et al. 1987), the Caribbean (Nagelkerken and Velde 2002) and
Japan (Nanjo et al. 2014a). Structural complexity and reduced predation pressures in
mangrove habitats have been hypothesized to help explain the relatively high fish
densities found in these habitats (Blaber 2007; Nagelkerken et al. 2008). On the other 92

Chapter IV
hand, a study in the Barwon River Estuary in Australia reported less fish biomass per
area in mangrove habitats than in other microtidal habitats (Smith and Hindell 2005).
Also a study that made per sample comparisons found that the vegetated areas of
mangroves had lower fish abundances compared to nearby treeless mudflats and
creeks (Wang et al. 2009). Lack of uniform methods and sampling strategies among
the various studies make it difficult at this time to generally assess mangrove
importance for fish abundances and densities. Also, block net studies show varying
abundance and biomass in mangroves with different environmental settings, limiting
direct comparisons to this study. Nevertheless, we did not define the life history of fish
in this study, and future surveys need to consider fish residency status.
It is possible that food may contribute to these often conflicting patterns of fish
abundance and biomass. Greater food availability has been suggested as a factor
responsible for greater fish numbers in mangroves compared to other habitats
(Robertson and Blaber 1992; Laegdsgaard and Johnson 2001). But in our study area,
there is a low estimated role of mangrove detritus and a likely shared dependence on
mudflat algal food resources (Shahraki et al. 2014). Thus, similarity in the food
resources may partially account for similarities in fish communities in the mangrove
and non-mangrove creeks of Qeshm Island.
The SEAc analyses showed that fish communities had similar isotopic niche
sizes in both mangrove and non-mangrove habitats. This might reflect the similarity in
fish compositions among sites and a common reliance on algal food resources in both
habitats (Shahraki et al. 2014). Also, fish movement between habitats could lead to
connectivity of food webs across habitats (Layman 2007; Hammerschlag-Peyer and
Layman 2010). However, there was a broader trophic diversity among fish in winter.
The presence/ absence of some species largely accounted for this seasonal variation in
the isotopic niche size. Especially the zooplanktivores L. daura and S. longiceps were
present at high abundances in winter and their presence increased the isotopic niche
size. High δ15N values for zooplanktivores are reported in other food webs studies
(Abrantes and Sheaves 2009; Vaslet et al. 2012). If these fish were removed from the
SEA analysis, seasonal differences in SEA were no longer significant as indicated by
lower (15%) probability of difference based on SEAB.
Our summer fish isotope diversity results are similar in some respects to those
of Layman et al. (2007) who found less isotopic diversity in stressed ecosystems
(Layman et al. 2007). High water temperature in summer (>31°C) may decrease 93

Seasonal Fisheries Changes in Low-Rainfall Mangrove Ecosystems
fisheries productivity by increasing energy costs in juvenile fishes (Wuenschel et al.
2004; Wuenschel et al. 2005). However, our results contrast to those of Abrantes et al.
(2014) who found trophic diversity increased with increased food isotope diversity
following wet season flooding (Abrantes et al. 2014). In our study, we found the
opposite pattern, namely that fish trophic diversity decreased in summer at a time
when food isotope diversity increased. Because of these similarities and differences
across studies, further research about isotope niche sizes and isotope trophic diversity
seems warranted. Some caution must be used in these studies because the isotope
values are usually (as in this study) measured for many potential foods rather than just
the actual important foods, and because isotope diversity in foods does not necessarily
equate to an increased availability of foods themselves (Matthews and Mazumder
2004; Newsome et al. 2007). Future studies should probably be conducted in concert
with gut content studies to better identify important foods and the relationship of fish
isotope diversity to the diversity of those important foods. However, seasonal changes
in fish/food isotope niche ratios agreed with and magnified the seasonal patterns
observed in fish isotope diversity in this study, so that our coarse-level view of food
isotope diversity based on all foods, not just important foods, seemed to be a
reasonable first approach.
Our findings emphasized that fish had different niche sizes across the seasons
in Qeshm Island. The lower seasonality observed in the fish/food isotope niche ratios
at the mangrove sites may indicate more consistent food web dynamics at the
mangrove sites. Fish communities at both mangrove and non-mangrove sites had
similar isotopic niche sizes, and both habitats appeared to support juvenile fish. Our
findings indicate that the abundance and biomass of small fish is not always higher in
mangrove areas. Like mangrove creeks, the non-mangrove creeks are utilized by a
wide variety of fish suggesting greater attention should be given to these habitats.
Supplementary data is given in Annex III
ACKNOWLEDGEMENTS
The authors thank H. Shahraki for assistance in the field and lab work, the fisherman
Saleh Sharifi and his family for assistance during the field work, and M. Dianat
(Payamnoor University, Qeshm Island branch), M. Golshani, M. Barani and M.
Parvaresh (Iranian fishery organization) for logistical support. We thank to T. Bery, F. 94

Chapter IV
Weigt and H. Sloterdijk for their useful comments on the manuscript. This work was
supported by `the Leibniz Center for Tropical Marine Ecology (ZMT) project number
7109' and `GLOMAR - Bremen International Graduate School for Marine Sciences'.
MS has been supported by the German National Merit Foundation Scholarship
(Studienstiftung des deutschen Volkes).
REFERENCES Abrantes, K.G., A. Barnett, and S. Bouillon. 2014. Stable isotope-based community
metrics as a tool to identify patterns in food web structure in east African estuaries. Functional Ecology 28: 270-282.
Abrantes, K.G., R. Johnston, R.M. Connolly, and M. Sheaves. 2015. Importance of Mangrove Carbon for Aquatic Food Webs in Wet–Dry Tropical Estuaries. Estuaries and Coasts 38: 383-399.
Abrantes, K.t., and M. Sheaves. 2009. Food web structure in a near-pristine mangrove area of the Australian Wet Tropics. Estuarine, Coastal and Shelf Science 82: 597-607.
Al-Khayat, J.A., and D.A. Jones. 1999. A Comparison of the Macrofauna of Natural and Replanted Mangroves in Qatar. Estuarine, Coastal and Shelf Science 49, Supplement 1: 55-63.
Al-Maslamani, I., M.E.M. Walton, H. Kennedy, and L. Le Vay. 2012. Sources of primary production supporting food webs in an arid coastal embayment. Marine Biology 159: 1753-1762.
Al-Zaidan, A., H. Kennedy, D. Jones, and S. Al-Mohanna. 2006. Role of microbial mats in Sulaibikhat Bay (Kuwait) mudflat food webs: evidence from δ13C analysis. Marine Ecology. Progress Series 308: 27-36.
Alongi, D.M. 2002. Present state and future of the world's mangrove forests. Environmental Conservation 29: 331-349.
Alongi, D.M. 2009. The energetics of mangrove forests: Springer Science & Business Media.
Alongi, D.M. 2014. Carbon cycling and storage in mangrove forests. Annual Review of Marine Science 6: 195-219.
Anderson, M., R. Gorley, and K. Clarke. 2008. UK: PRIMER-E, Plymouth. PERMANOVA+ for PRIMER: guide to software and statistical methods: 214.
Assadi, H., R.D. P, M. Jahanbakhsh, I.F. Research, and T. Organization. 1997. Atlas of the Persian Gulf & the Sea of Oman fishes: Iranian Fisheries Research and Training Organization.
Barletta, M., A. Barletta-Bergan, U. Saint-Paul, and G. Hubold. 2003. Seasonal changes in density, biomass, and diversity of estuarine fishes in tidal mangrove creeks of the lower Caeté Estuary (northern Brazilian coast, east Amazon). Marine Ecology Progress Series 256: 217-228.
95

Seasonal Fisheries Changes in Low-Rainfall Mangrove Ecosystems
Bearhop, S., R.W. Furness, G.M. Hilton, S.C. Votier, and S. Waldron. 2003. A forensic approach to understanding diet and habitat use from stable isotope analysis of (avian) claw material. Functional Ecology 17: 270-275.
Bersier, L.-F., C. Banašek-Richter, and M.-F. Cattin. 2002. Quantitative descriptors of food-web matrices. Ecology 83: 2394-2407.
Blaber, S. 1997. Fish and fisheries of tropical estuaries: Chapman & Hall, London. Blaber, S.J. 2000. Tropical estuarine fishes. ecology, exploitation, and conservation.
Blackwell, Oxford. Blaber, S.J. 2007. Mangroves and fishes: issues of diversity, dependence, and dogma.
Bulletin of Marine Science 80: 457-472. Blaber, S.J.M., and T.G. Blaber. 1980. Factors affecting the distribution of juvenile
estuarine and inshore fish. Journal of Fish Biology 17: 143-162. Bozeman, E.L., and J.M. Dean. 1980. The abundance of estuarine larval and juvenile
fish in a South Carolina intertidal creek. Estuaries 3: 89-97. Chong, V.C. 2007. Mangroves-fisheries Linkages-The Malaysian perspective. Bulletin
of Marine Science 80: 755-772. Chong, V.C., A. Sasekumar, M.U.C. Leh, and R. D'Cruz. 1990. The fish and prawn
communities of a Malaysian coastal mangrove system, with comparisons to adjacent mud flats and inshore waters. Estuarine, Coastal and Shelf Science 31: 703-722.
Colwell, R. 2009. EstimateS: Statistical estimation of species richness and shared species from samples. Version 8. 2006.
Duffy, J.E. 2003. Biodiversity loss, trophic skew and ecosystem functioning. Ecology Letters 6: 680-687.
Fischer, W., and G. Bianchi. 1984. FAO Species Identification Sheets For Fishery Purposes Western Indian Ocean (Fishing Area 51). Vol 5: Bony Fishes: Chimaeras, Sharka, Lobsters, Shrimps and Prawns, Sae Turtles: FAO.
Fry, B., and K.C. Ewel. 2003. Using stable isotopes in mangrove fisheries research - a review and outlook. Isotopes in Environmental Health Studies 39: 191-196.
Giarrizzo, T., R. Schwamborn, and U. Saint-Paul. 2011. Utilization of carbon sources in a northern Brazilian mangrove ecosystem. Estuarine, Coastal and Shelf Science 95: 447-457.
Gotelli, N.J., and R.K. Colwell. 2011. Estimating species richness. Biological Diversity: Frontiers in Measurement and Assessment: 39-54.
Hammerschlag-Peyer, C.M., and C.A. Layman. 2010. Intrapopulation variation in habitat use by two abundant coastal fish species. Marine Ecology Progress Series 415: 211-220.
Jackson, A.L., R. Inger, A.C. Parnell, and S. Bearhop. 2011. Comparing isotopic niche widths among and within communities: SIBER–Stable Isotope Bayesian Ellipses in R. Journal of Animal Ecology 80: 595-602.
Jackson, M.C., I. Donohue, A.L. Jackson, J.R. Britton, D.M. Harper, and J. Grey. 2012. Population-level metrics of trophic structure based on stable isotopes and their application to invasion ecology. PloS one 7: e31757.
96

Chapter IV
Kaartinen, R., and T. Roslin. 2012. High temporal consistency in quantitative food web structure in the face of extreme species turnover. Oikos 121: 1771-1782.
Kuronuma, K., and Y. Abe. 1986. Fishes of the Arabian Gulf: Kuwait Institute for Scientific Research.
Laegdsgaard, P., and C. Johnson. 2001. Why do juvenile fish utilise mangrove habitats? Journal of Experimental Marine Biology and Ecology 257: 229-253.
Laegdsgaard, P., and C.R. Johnson. 1995. Mangrove habitats as nurseries: unique assemblages of juvenile fish in subtropical mangroves in eastern Australia. Marine Ecology Progress Series 126: 67-81.
Layman, C.A. 2007. What can stable isotope ratios reveal about mangroves as fish habitat? Bulletin of Marine Science 80: 513-527.
Layman, C.A., J.P. Quattrochi, C.M. Peyer, and J.E. Allgeier. 2007. Niche width collapse in a resilient top predator following ecosystem fragmentation. Ecology Letters 10: 937-944.
Little, M.C., P.J. Reay, and S.J. Grove. 1988. The fish community of an East African mangrove creek. Journal of Fish Biology 32: 729-747.
Manson, F., N. Loneragan, G. Skilleter, and S. Phinn. 2005. An evaluation of the evidence for linkages between mangroves and fisheries: a synthesis of the literature and identification of research directions. Oceanography and Marine Biology: an Annual Review 43: 483-513.
Matthews, B., and A. Mazumder. 2004. A critical evaluation of intrapopulation variation of δ13C and isotopic evidence of individual specialization. Oecologia 140: 361-371.
Nagelkerken, I., S.J.M. Blaber, S. Bouillon, P. Green, M. Haywood, L.G. Kirton, J.O. Meynecke, J. Pawlik, H.M. Penrose, A. Sasekumar, and P.J. Somerfield. 2008. The habitat function of mangroves for terrestrial and marine fauna: A review. Aquatic Botany 89: 155-185.
Nagelkerken, I., and G.v.d. Velde. 2002. Do non-estuarine mangroves harbour higher densities of juvenile fish than adjacent shallow-water and coral reef habitats in Curaçao (Netherlands Antilles)? Marine Ecology Progress Series 245: 191-204.
Nagelkerken, I., and G.v.d. Velde. 2004. Are Caribbean mangroves important feeding grounds for juvenile reef fish from adjacent seagrass beds? Marine Ecology Progress Series 274: 153-159.
Nanjo, K., H. Kohno, Y. Nakamura, M. Horinouchi, and M. Sano. 2014a. Differences in fish assemblage structure between vegetated and unvegetated microhabitats in relation to food abundance patterns in a mangrove creek. Fisheries Science 80: 21-41.
Nanjo, K., H. Kohno, Y. Nakamura, M. Horinouchi, and M. Sano. 2014b. Effects of mangrove structure on fish distribution patterns and predation risks. Journal of Experimental Marine Biology and Ecology 461: 216-225.
Newsome, S.D., C. Martinez del Rio, S. Bearhop, and D.L. Phillips. 2007. A niche for isotopic ecology. Frontiers in Ecology and the Environment 5: 429-436.
97

Seasonal Fisheries Changes in Low-Rainfall Mangrove Ecosystems
Pittman, S., C. McAlpine, and K. Pittman. 2004. Linking fish and prawns to their environment: a hierarchical landscape approach. Marine Ecology Progress Series 283: 233-254.
Robertson, A., and N. Duke. 1987. Mangroves as nursery sites: comparisons of the abundance and species composition of fish and crustaceans in mangroves and other nearshore habitats in tropical Australia. Marine Biology 96: 193-205.
Robertson, A.A., and S.S. Blaber. 1992. Plankton, epibenthos and fish communities. Tropical Mangrove Ecosystems. Coastal and Estuarine Studies. 41-pages: 173-224 pp.
Robertson, A.I., and N.C. Duke. 1990. Mangrove fish-communities in tropical Queensland, Australia: Spatial and temporal patterns in densities, biomass and community structure. Marine Biology 104: 369-379.
Rönnbäck, P. 1999. The ecological basis for economic value of seafood production supported by mangrove ecosystems. Ecological Economics 29: 235-252.
Rooker, J.R., and G.D. Dennis. 1991. Diel, lunar and seasonal changes in a mangrove fish assemblage off southwestern Puerto Rico. Bulletin of Marine Science 49: 684-698.
Shahraki, M., B. Fry, U. Krumme, and T. Rixen. 2014. Microphytobenthos sustain fish food webs in intertidal arid habitats: A comparison between mangrove-lined and un-vegetated creeks in the Persian Gulf. Estuarine, Coastal and Shelf Science 149: 203-212.
Smith, T.M., and J.S. Hindell. 2005. Assessing effects of diel period, gear selectivity and predation on patterns of microhabitat use by fish in a mangrove dominated system in SE Australia. Marine Ecology Progress Series 294: 257-270.
Spalding, M., M. Spalding, M. Kainuma, and L. Collins. 2010. World atlas of mangroves: Earthscan.
Thayer, G.W., D.R. Colby, and W.F. Hettler Jr. 1987. Utilization of the red mangrove prop root habitat. Marine Ecology-Progress Series 35: 25-38.
Vance, D., M.E. Haywood, D. Heales, R. Kenyon, and N. Loneragan. 1996. How far do prawns and fish move into mangroves? Distribution of juvenile banana prawns Penaeus merguiensis and fish in a tropical mangrove forest in northern Australia. Marine Ecology Progress Series 131: 115-124.
Vaslet, A., D.L. Phillips, C. France, I.C. Feller, and C.C. Baldwin. 2012. The relative importance of mangroves and seagrass beds as feeding areas for resident and transient fishes among different mangrove habitats in Florida and Belize: Evidence from dietary and stable-isotope analyses. Journal of Experimental Marine Biology and Ecology 434–435: 81-93.
Verweij, M.C., I. Nagelkerken, S.L. Wartenbergh, I.R. Pen, and G. van der Velde. 2006. Caribbean mangroves and seagrass beds as daytime feeding habitats for juvenile French grunts, Haemulon flavolineatum. Marine Biology 149: 1291-1299.
Wang, M., Z. Huang, F. Shi, and W. Wang. 2009. Are vegetated areas of mangroves attractive to juvenile and small fish? The case of Dongzhaigang Bay, Hainan Island, China. Estuarine, Coastal and Shelf Science 85: 208-216.
98

Chapter IV
Williams, R.J., E.L. Berlow, J.A. Dunne, A.L. Barabási, and N.D. Martinez. 2002. Two degrees of separation in complex food webs. Proceedings of the National Academy of Sciences 99: 12913-12916.
Wright, J. 1989. Diel variation and seasonal consistency in the fish assemblage of the non-estuarine Sulaibikhat Bay, Kuwait. Marine Biology 102: 135-142.
Wright, J.M. 1986. The ecology of fish occurring in shallow water creeks of a Nigerian mangrove swamp. Journal of Fish Biology 29: 431-441.
Wuenschel, M.J., A.R. Jugovich, and J.A. Hare. 2004. Effect of temperature and salinity on the energetics of juvenile gray snapper (Lutjanus griseus): implications for nursery habitat value. Journal of Experimental Marine Biology and Ecology 312: 333-347.
Wuenschel, M.J., A.R. Jugovich, and J.A. Hare. 2005. Metabolic response of juvenile gray snapper (Lutjanus griseus) to temperature and salinity: physiological cost of different environments. Journal of Experimental Marine Biology and Ecology 321: 145-154
Zagars, M., K. Ikejima, A. Kasai, N. Arai, and P. Tongnunui. 2013. Trophic characteristics of a mangrove fish community in Southwest Thailand: Important mangrove contribution and intraspecies feeding variability. Estuarine, Coastal and Shelf Science 119: 145-152.
99

100

CHAPTER V
Synoptic Discussion and Outlook
101

102

Chapter V
Synoptic discussion and outlook
This thesis provides new information on variables structuring fish assemblages in the
low-rainfall coastal ecosystem of Qeshm Island, Iran, and helps to fill a gap in
knowledge regarding fish communities in the northern edge of mangrove distribution
in the Indian Ocean. The findings show the influence of environmental variables (e.g.
tide and temperature) in structuring fish assemblages in a meso-tidal area of the
Persian Gulf (Chapters II and IV). The unique aspect of this study is to combine the
community descriptors and isotopic niche diversity to determine the patterns of
changes in the fish assemblages of Qeshm Island. With respect to this, the structuring
effect of seasonality is more important than habitat in determining the fish distribution
patterns (Chapter IV). Moreover, the outcomes of this dissertation demonstrate the
main food pathways sustaining fish communities in mangrove and non-mangrove
intertidal creeks (Chapters III). The conceptual framework describing the factors
structuring Qeshm Island fish communities and food web dynamics is shown in figure
1.
Figure 1 Simplified model of the factors shaping fish communities and food webs in Qeshm Island, Iran. Arrows indicate the direction of the influence.
103

Synoptic Discussion and Outlook
Factors determining structural changes in fish communities
Environmental factors
Changes in environmental variables cause a structural alteration among fish
assemblages, although the relative importance of different factors is variable between
the biogeographical regions (Blaber and Blaber 1980; Blaber 2002). While seasonal
fluctuations of salinity structure fish communities in humid regions (Barletta et al.
2003; Barletta and Saint-Paul 2010), this effect is negligible in the low-rainfall system
of Qeshm Island. Given the fact that the coasts of the Persian Gulf are subjected to
mesotides, the regular changes in the water level cause significant variance in fish
distribution. The results of this study show that the interaction between tides (spring
and neap) and day-night cycles influence the organization of fish assemblages. The
highest fish biomass, abundance and diversity are observed during spring tide night.
Qeshm Island presents mangroves where much larger intertidal areas are inundated at
spring, rather than at neap tides. Therefore, high inundation during spring tide
coinciding with the darkness provided favorable conditions for fish. This minimizes
the predation effect and provides longer habitat accessibility for fish. These findings
are not unexpected and are consistent with other studies that have viewed tidal cycles
as one of the major factors in determining the dynamics of mangrove fish assemblages
in tidal coasts e.g. in the Indo-West Pacific (Laroche et al. 1997; Rönnbäck et al. 1999;
Wilson and Sheaves 2001). Conversely, in the Caribbean, the tidal cycle plays a
negligible role in structuring fish assemblages, and instead, the diel cycle is the major
rhythm driving short-term changes in mangrove fish assemblages (Nagelkerken et al.
2000). Thus, tidal dynamics’ effect on Qeshm fish assemblages is similar to other
mangroves exposed to median to large tidal regimes (range 2 to >5).
There, exist a unique attribute of high seasonal fluctuations in water
temperatures (>20°C). Thereby, this contrasting characteristic of arid mangroves is
crucial for structuring fish assemblages. In this context, low fish abundance and
biomass are observed in summer. Extreme summer water temperatures (>33°C) likely
limit the fish abundance and biomass. The observation of a decline in fish assemblages
in summer due to an increase in water temperature is characteristic in the Gulf’s
shallow water habitats (Wright 1989).
Also, intertidal mangrove creeks in Qeshm Island do not support many fish
species. Seasonal fluctuations in water temperatures of >20°C likely limit the
suitability of this shallow-water habitat for coastal-marine fish species in Qeshm 104

Chapter V
mangroves. Therefore, the diversity of fish may also be closely linked to the
environmental conditions. While high species diversity (>80 species) has been
reported among the humid mangroves in the Indo-Malaysian region (Tongnunui et al.
2002; Ikejima et al. 2003), the species richness is relatively low in the arid mangroves
of Qeshm Island (<30 species). This difference in species richness could partly reflect
the effect of different environmental settings across regions e.g., the lack of fresh water
and rainfall in the Persian Gulf as compared to South East Asia’s high precipitation
rate. The low species diversity could also be driven by the lack of other productive
habitats in the proximities of the Qeshm mangroves, such as seagrass and coral reef.
However, at a global scale, the low species diversity in the western Indian Ocean
reflects the standard species gradient from the center of shallow water species richness
in the coral triangle in all directions (Blaber 2000; Carpenter and Springer 2005).
Changes in fish communities are most likely linked to the biogeography of the
mangroves, whereby distinctive environmental factors contribute to the organization of
fish distribution patterns. Qeshm mangroves are characterized by stable salinities and
other variables such as tide-diel cycle, and seasonal changes in water temperature have
been shown to be an important determinant in shaping fish community structure in this
region (see Chapters II and IV). Also, stressful environmental conditions at the
northern edge of mangrove distribution in the Western Indian Ocean influence fish
species diversity in this region.
Food sources
Larger inundation areas during spring tides enable fish to access intertidal forest rich in
prey resources that are not available during inundations at neap tides. This can be
linked to higher fish abundance and biomass during spring tide in Qeshm’s intertidal
mangrove creeks. It has been observed that during high tide, fish from adjacent
habitats such as mud flats and seagrass beds migrate into the mangroves to feed
(Vance et al. 1996; Sheaves and Molony 2000). Depending on local conditions,
phytoplankton, algae and seagrass detritus imported with tides may represent a
significant supplementary food input (Kristensen et al. 2008; Nagelkerken et al. 2008).
In Qeshm’s mangrove-lined creeks, mangrove leaves are isotopically distinct from
other food sources. The findings of this study do not support mangrove litter as a major
feeding source for fish in Qeshm Island; and algal sources sustain food webs in
intertidal arid habitats (Shahraki et al. 2014). Algal material could be a readily 105

Synoptic Discussion and Outlook
available food source for fish and invertebrates on flooding tides. Also, the large
amounts of algae covering the pneumatophore provide food for many invertebrates and
juvenile fish (Laegdsgaard and Johnson 2001).
High fish abundance in mangroves has been attributed to the availability of
food sources in this habitat (Laegdsgaard and Johnson 2001; Chong 2007). To reliably
assess the role of mangrove ecosystems in supporting aquatic food webs, mangrove
habitats should be compared with habitats of the same type but without mangrove
cover, recognizing that this may be a somewhat artificial comparison if the habitat type
strongly shifts foraging opportunities. When comparing mangrove vs. non-mangrove
food webs, both habitats fuel fish with similar food sources. Fish compositions are
very similar between mangroves and non-mangroves, both in terms of species richness
and especially in the contribution of dominant species (see Chapter IV). Also,
community trophic diversity measured as size-corrected standard ellipse areas show no
significant difference between mangrove and non-mangrove sites in Qeshm Island.
Moreover, food sources of different origins can be seasonally important for
consumers (Vizzini and Mazzola 2003; Olin et al. 2012). In the current work, food
standard ellipse areas (SEA) values indicate wider diversity in food values in summer.
Also, the δ13C of pelagic food sources (e.g. plankton) show seasonal variations, which
are reflected in seasonal isotopic variations of zooplanktivoures. In summer,
temperature stress decreases fish trophic diversity, and fish communities are
characterized by low biomass and abundance. In contrast, higher SEA values for fish
communities in winter indicate a broader use of foods, though this is mostly due to
presence of zooplanktivores, which are not abundant in summer months.
In addition, seasonal changes in fish/food isotope niche ratios confirm and
magnify the seasonal patterns in fish isotope diversity in this study. Thus, the coarse-
level view of food isotope diversity based on all foods, not just important foods,
seemed to be a reasonable first approach. However, these findings should be
interpreted with some caution because the isotope values are usually (as in this study)
measured for many potential foods rather than the actual foods, and because isotope
diversity in foods does not necessarily equate to an increased availability of foods
themselves (Matthews and Mazumder 2004; Newsome et al. 2007).
Based on these conclusions, the structure of fish assemblages of species which
use mangrove and non-mangrove intertidal creeks is mostly influenced by seasonal
changes in water temperatures. These seasonal developments influence the 106
Chapter V
accessibility of food sources, resulting in changes among fish assemblages. Also,
similarities in the food resources across habitats may partially account for similarities
in fish communities in the mangrove and non-mangrove creeks of Qeshm Island.
The main sources of energy for fish
The fish food web’s support of mangrove and non-mangrove intertidal creeks seem to
be energetically driven by pelagic and benthic food pathways in Qeshm Island (Fig. 2).
The fish community result is indicated by the dominance of detrivores in this arid
environment. However, there is not an obvious pattern of detrivorous fish having a
much higher potential trophic reliance on mangrove leaves.
Figure 2 Simplified mangrove food webs indicating two food pathways in Qeshm mangroves, Persian Gulf. Arrows indicate the destination of food sources (particulate organic matter (POM), sediment (SOM), microphytobenthos (MPB) to macrobenthos (crabs and shrimps) to fish (detritivores, zooplanktivores, macrobenthivores); Modified from Shahraki et al. (2014).
As it is shown in Chapter III, fish show low reliance on organic matter derived
by mangrove trees at multiple levels, from species to trophic guilds to communities.
Overall, the minimum and maximum mangrove contributions range between 0% and
36%, respectively, for the various fish groups and species tested in this study. Other
107

Synoptic Discussion and Outlook
food sources are aggregated in the 2-source model as various types of “algae”, and
“algal” contributions to the various fish groups ranged from a minimum of 64% to a
maximum of 100%. A global overview of the contribution of food sources supporting
mangrove food webs reveals a high importance of mangrove litter to fish diet in the
Indo-Malaysian region, indicated by high precipitation (Rodelli et al. 1984; Zagars et
al. 2013) and low mangrove litter contributions for the African region, which is
characterized by the moderate to low rainfalls (Nyunja et al. 2009; Kruitwagen et al.
2010). Elsewhere, such as in the Caribbean where mangroves are permanently
inundated, this role is also limited (Nagelkerken and Velde 2004). These divergent
results suggest that environmental parameters e.g., the precipitation regime may affect
the outwelling of mangrove derived organic carbon (Alongi 2009). In this study area,
the low mangrove litter contribution to fish food webs could be mainly related to a
lack of freshwater input and very low precipitation. Similarly, the possible contribution
of mangroves as a source of nutrition for benthic and epibenthic invertebrates was less
than other primary producers in some other studies in the Gulf region (Al-Zaidan et al.
2006; Al-Maslamani et al. 2012). These results therefore suggest that attributes of an
arid environment, in other words, the dearth of rainfall, may largely reduce the
outwelling of mangrove derived organic carbon, and thus influence the use of
mangrove litter in aquatic food webs.
Furthermore, the dominance of detritivores in both mangrove and non-
mangrove intertidal creeks suggests the importance of benthic (detritus) food webs in
the intertidal creeks at Qeshm Island.
Mangroves fisheries support
Benefits to fisheries from mangroves are derived from a high availability of food
sources as well as physical attributes (shelter from predation), as demonstrated by high
fish abundance and diversity (Manson et al. 2005; Chong 2007). But, when mangrove
fish food webs are compared with the non-mangroves, there is a low estimated role of
mangrove detritus and a likely shared dependence on mudflat algal food resources in
both sites in Qeshm Island (Shahraki et al. 2014).
The estimates of fish abundance and biomass vary depending on whether
results are expressed on a per sample basis or a per m2 basis, with mangrove creeks
supporting less abundance and biomass per sample, but more abundance and biomass
per m2. This may seem somewhat contradictory, but reflects a real dichotomy in results 108

Chapter V
presented in other studies where it has been also observed that fish can be either more
or less abundant than in mangroves than in other nearby habitats. For example, studies
that have observed higher biomass (abundance) of fish per area include those from
south Florida (Thayer et al. 1987), the Caribbean (Nagelkerken and Velde 2002) and
Japan (Nanjo et al. 2014a). Structural complexity and reduced predation pressures in
mangrove habitats have been hypothesized to help explain the relatively high fish
densities found in these habitats (Blaber 2007; Nagelkerken et al. 2008). On the other
hand, a study in the Barwon River Estuary in Australia reported less fish biomass per
area in mangrove habitats than in other microtidal habitats (Smith and Hindell 2005).
Also, a study that made per sample comparisons found that the vegetated areas of
mangroves had lower fish abundances compared to nearby treeless mudflats and
creeks (Wang et al. 2009). Lack of uniform methods and sampling strategies among
the various studies make it difficult at this time to generally assess mangrove
importance for fish abundances and densities. This reinforces the need for an
integrated approach to evaluate the role of mangrove as fish habitats.
A somewhat more mangrove-centric view of this study is the presence of some
economically important species (e.g. snapper and a commercial shrimp) found only in
mangroves, suggesting Qeshm mangroves are particularly important habitats for
associated-mangrove fisheries. Also, the numbers of rarer species (species with
relative abundance of <1%) occur more frequently in mangroves than in non-
mangroves, which is consistent with the idea that the higher complexity and shelter of
mangroves may attract more fish species (Verweij et al. 2006; Nanjo et al. 2014b).
Perspectives and future directions
This study compliments previous studies in the western Indian Ocean by contributing
to the understanding of fish community patterns in relation to changes in the abiotic
variables. Tide and season emerged as important factors for structuring fish
assemblages in the low-rainfall mangroves of Qeshm Island. However, there is still a
lack of ecological knowledge regarding mangrove habitat use by fish in an arid system
and further studies, especially in the Gulf region, are needed for a more widespread
understanding of the relationship between mangrove complexity and fish distribution
patterns. In this study, the fish abundance and biomass comparisons are made on both
a per m2 basis and on a per sample basis, revealing an interesting difference between
the two expressions of the data. These contrasting results are addressed in this thesis. 109
Synoptic Discussion and Outlook
However, the challenge lies in identifying the life history of fish to assess the
importance of the mangroves to fish population. Further research is needed to know
which species, when, and at what life stages rely on mangroves. Also, future research
will address turnover rates for fish population to estimate fish productivity in Qeshm
mangroves.
There exists a small body of research which surveys food webs from a low
rainfall ecosystem, like Qeshm Island, and this study not only records the first fish
food webs knowledge based on the isotope approach for the Iranian coast of the
Persian Gulf, but also provides valuable benchmarks for the comparison of trophic
diversity with comparable arid and humid systems. However, it should be noted that
only abundant fish species are included for determining fish food webs in this study.
For having a complete picture of food web dynamics, all fish species should be
incorporated for the stable isotope measurements. Also, future studies should be
conducted in concert with gut content analysis to better identify important food sources
and the relationship between fish isotope diversity and the diversity of those foods.
The reason for the δ13C depletion in benthic and pelagic pathways of mangrove
as compared to non-mangrove sites remains unknown in this study, although it may be
related to differences in the microphytobenthos community itself. Cyanobacteria
dominate the microphytobenthos at the non-mangrove sites. This might be the impact
of an enhanced proportion of nitrogen-fixing cyanobacteria within the
microphytobenthos. The dominant role of nitrogen-fixing cyanobacteria is also
reflected in the nutrient concentrations (Shahraki Unpubl. data). Relatively high nitrate
and low phosphate concentrations indicate the preferential uptake of phosphates that is
leached from the sediments by the cyanobacteria mats, leading to phosphate-limiting
conditions in the non-mangrove intertidal creeks (Shahraki Unpubl. data). The shading
effect of mangrove might explain why diatoms dominated over cyanobacteria in the
mangrove site. But, further studies are needed to clarify these hypotheses.
It has been believed that large amounts of mangrove leaves, detritus and
particulate organic matter are exported to adjacent habitats and drive offshore fisheries
production (Odum and Heald 1972; Lee 1995). However, recent stable isotope studies
find that it is not the case in humid mangroves (Rodelli et al. 1984; Newell et al. 1995;
Chong et al. 2001). Because the export of mangrove detritus to adjacent habitats might
be limited due to lack of fresh water input, this pattern could be more complex in arid
mangroves. Therefore, our understanding of the role of organic matter produced by 110
Chapter V
mangrove trees for food webs of adjacent habitats, to which they are linked through
tidal flows, remains restricted. Mangrove carbon might be exported out of the system
by the tide, probably in the form of dissolved organic carbon (DOC), dissolved
inorganic carbon (DIC) and particulate organic carbon (POC). Measuring isotopic
values of fish along a gradient from the mangrove creeks towards open marine waters
should be considered in future studies. Also, further measurements of δ13C of DOC are
needed to know the fate of most exported mangrove carbon in this low rainfall region.
Lastly, the possible roles played by benthos within Iranian mangrove systems
in the transfer and processing of organic matter remain largely unknown. Biogenic
activities such as bio-turbation and bio-irrigation could drive sediment–water exchange
of nutrients and organic matter (Stieglitz et al. 2000), therefore contributing to the
aquatic food webs. Spatio-temporal variability of solute fluxes (O2, CO2, nutrients) at
the sediment-water interface, could act as indicators of ecosystem functioning (e.g.,
nutrient cycling) and thereby affecting the biodiversity, in particular the production of
fish communities. Hence, further analyses and monitoring of the biogeochemical
fluxes along the sediment-water system hold the potential to delineate the supply of
organic matter into the food web.
REFERENCES Al-Maslamani, I., M.E.M. Walton, H. Kennedy, and L. Le Vay. 2012. Sources of
primary production supporting food webs in an arid coastal embayment. Marine Biology 159: 1753-1762.
Al-Zaidan, A., H. Kennedy, D. Jones, and S. Al-Mohanna. 2006. Role of microbial mats in Sulaibikhat Bay (Kuwait) mudflat food webs: evidence from δ13C analysis. Marine Ecology. Progress Series 308: 27-36.
Alongi, D.M. 2009. The energetics of mangrove forests: Springer Science & Business Media.
Barletta, M., A. Barletta-Bergan, U. Saint-Paul, and G. Hubold. 2003. Seasonal changes in density, biomass, and diversity of estuarine fishes in tidal mangrove creeks of the lower Caeté Estuary (northern Brazilian coast, east Amazon). Marine Ecology Progress Series 256: 217-228.
Barletta, M., and U. Saint-Paul. 2010. Distribution Pattern of Fish in a Mangrove Estuary. In Mangrove Dynamics and Management in North Brazil, ed. U. Saint-Paul and H. Schneider, 171-188: Springer Berlin Heidelberg.
Blaber, S.J. 2000. Tropical estuarine fishes. ecology, exploitation, and conservation. Blackwell, Oxford.
Blaber, S.J. 2007. Mangroves and fishes: issues of diversity, dependence, and dogma. Bulletin of Marine Science 80: 457-472.
111

Synoptic Discussion and Outlook
Blaber, S.J.M. 2002. ‘Fish in hot water”: the challenges facing fish and fisheries research in tropical estuaries. Journal of Fish Biology 61: 1-20.
Blaber, S.J.M., and T.G. Blaber. 1980. Factors affecting the distribution of juvenile estuarine and inshore fish. Journal of Fish Biology 17: 143-162.
Carpenter, K.E., and V.G. Springer. 2005. The center of the center of marine shore fish biodiversity: the Philippine Islands. Environmental biology of fishes 72: 467-480.
Chong, V.C. 2007. Mangroves-fisheries Linkages-The Malaysian perspective. Bulletin of Marine Science 80: 755-772.
Chong, V.C., C.B. Low, and T. Ichikawa. 2001. Contribution of mangrove detritus to juvenile prawn nutrition: a dual stable isotope study in a Malaysian mangrove forest. Marine Biology 138: 77-86.
Ikejima, K., P. Tongnunui, T. Medej, and T. Taniuchi. 2003. Juvenile and small fishes in a mangrove estuary in Trang province, Thailand: seasonal and habitat differences. Estuarine, Coastal and Shelf Science 56: 447-457.
Kristensen, E., S. Bouillon, T. Dittmar, and C. Marchand. 2008. Organic carbon dynamics in mangrove ecosystems: A review. Aquatic Botany 89: 201-219.
Kruitwagen, G., I. Nagelkerken, B.R. Lugendo, Y.D. Mgaya, and S.E.W. Bonga. 2010. Importance of different carbon sources for macroinvertebrates and fishes of an interlinked mangrove-mudflat ecosystem (Tanzania). Estuarine, Coastal and Shelf Science 88: 464-472.
Laegdsgaard, P., and C. Johnson. 2001. Why do juvenile fish utilise mangrove habitats? Journal of Experimental Marine Biology and Ecology 257: 229-253.
Laroche, J., E. Baran, and N. Rasoanandrasana. 1997. Temporal patterns in a fish assemblage of a semiarid mangrove zone in Madagascar. Journal of Fish Biology 51: 3-20.
Lee, S.Y. 1995. Mangrove outwelling: a review. Hydrobiologia 295: 203-212. Manson, F., N. Loneragan, G. Skilleter, and S. Phinn. 2005. An evaluation of the
evidence for linkages between mangroves and fisheries: a synthesis of the literature and identification of research directions. Oceanography and Marine Biology: an Annual Review 43: 483-513.
Matthews, B., and A. Mazumder. 2004. A critical evaluation of intrapopulation variation of δ13C and isotopic evidence of individual specialization. Oecologia 140: 361-371.
Nagelkerken, I., S.J.M. Blaber, S. Bouillon, P. Green, M. Haywood, L.G. Kirton, J.O. Meynecke, J. Pawlik, H.M. Penrose, A. Sasekumar, and P.J. Somerfield. 2008. The habitat function of mangroves for terrestrial and marine fauna: A review. Aquatic Botany 89: 155-185.
Nagelkerken, I., M. Dorenbosch, W.C.E.P. Verberk, E.C.d.l. Moriniere, and G.v.d. Velde. 2000. Day-night shifts of fishes between shallow-water biotopes of a Caribbean bay, with emphasis on the nocturnal feeding of Haemulidae and Lutjanidae. Marine Ecology Progress Series 194: 55-64.
Nagelkerken, I., and G.v.d. Velde. 2002. Do non-estuarine mangroves harbour higher densities of juvenile fish than adjacent shallow-water and coral reef habitats in
112

Chapter V
Curaçao (Netherlands Antilles)? Marine Ecology Progress Series 245: 191-204.
Nagelkerken, I., and G.v.d. Velde. 2004. Are Caribbean mangroves important feeding grounds for juvenile reef fish from adjacent seagrass beds? Marine Ecology Progress Series 274.
Nanjo, K., H. Kohno, Y. Nakamura, M. Horinouchi, and M. Sano. 2014a. Differences in fish assemblage structure between vegetated and unvegetated microhabitats in relation to food abundance patterns in a mangrove creek. Fisheries Science 80: 21-41.
Nanjo, K., H. Kohno, Y. Nakamura, M. Horinouchi, and M. Sano. 2014b. Effects of mangrove structure on fish distribution patterns and predation risks. Journal of Experimental Marine Biology and Ecology 461: 216-225.
Newell, R.I.E., N. Marshall, A. Sasekumar, and V.C. Chong. 1995. Relative importance of benthic microalgae, phytoplankton, and mangroves as sources of nutrition for penaeid prawns and other coastal invertebrates from Malaysia. Marine Biology 123: 595-606.
Newsome, S.D., C. Martinez del Rio, S. Bearhop, and D.L. Phillips. 2007. A niche for isotopic ecology. Frontiers in Ecology and the Environment 5: 429-436.
Nyunja, J., M. Ntiba, J. Onyari, K. Mavuti, K. Soetaert, and S. Bouillon. 2009. Carbon sources supporting a diverse fish community in a tropical coastal ecosystem (Gazi Bay, Kenya). Estuarine, Coastal and Shelf Science 83: 333-341.
Odum, W.E., and E.J. Heald. 1972. Trophic Analyses of an Estuarine Mangrove Community. Bulletin of Marine Science 22: 671-738.
Olin, J., S. Rush, M.A. MacNeil, and A. Fisk. 2012. Isotopic Ratios Reveal Mixed Seasonal Variation Among Fishes from Two Subtropical Estuarine Systems. Estuaries and Coasts 35: 811-820.
Rodelli, M.R., J.N. Gearing, P.J. Gearing, N. Marshall, and A. Sasekumar. 1984. Stable isotope ratio as a tracer of mangrove carbon in Malaysian ecosystems. Oecologia 61: 326-333.
Rönnbäck, P., M. Troell, N. Kautsky, and J.H. Primavera. 1999. Distribution Pattern of Shrimps and Fish AmongAvicenniaandRhizophoraMicrohabitats in the Pagbilao Mangroves, Philippines. Estuarine, Coastal and Shelf Science 48: 223-234.
Shahraki, M., B. Fry, U. Krumme, and T. Rixen. 2014. Microphytobenthos sustain fish food webs in intertidal arid habitats: A comparison between mangrove-lined and un-vegetated creeks in the Persian Gulf. Estuarine, Coastal and Shelf Science 149: 203-212.
Sheaves, M., and B. Molony. 2000. Short-circuit in the mangrove food chain. Marine Ecology Progress Series 199: 97-109.
Smith, T.M., and J.S. Hindell. 2005. Assessing effects of diel period, gear selectivity and predation on patterns of microhabitat use by fish in a mangrove dominated system in SE Australia. Marine Ecology Progress Series 294: 257-270.
113

Synoptic Discussion and Outlook
Stieglitz, T., P. Ridd, and P. Müller. 2000. Passive irrigation and functional morphology of crustacean burrows in a tropical mangrove swamp. Hydrobiologia 421: 69-76.
Thayer, G.W., D.R. Colby, and W.F. Hettler Jr. 1987. Utilization of the red mangrove prop root habitat. Marine Ecology-Progress Series 35: 25-38.
Tongnunui, P., K. Ikejima, T. Yamane, M. Horinouchi, T. Medej, M. Sano, H. Kurokura, and T. Taniuchi. 2002. Fish fauna of the Sikao Creek mangrove estuary, Trang, Thailand. Fisheries Science 68: 10-17.
Vance, D., M.E. Haywood, D. Heales, R. Kenyon, and N. Loneragan. 1996. How far do prawns and fish move into mangroves? Distribution of juvenile banana prawns Penaeus merguiensis and fish in a tropical mangrove forest in northern Australia. Marine Ecology Progress Series 131: 115-124.
Verweij, M.C., I. Nagelkerken, D. de Graaff, M. Peeters, E.J. Bakker, and G. van der Velde. 2006. Structure, food and shade attract juvenile coral reef fish to mangrove and seagrass habitats: a field experiment. Marine Ecology Progress Series 306 257–268
Vizzini, S., and A. Mazzola. 2003. Seasonal variations in the stable carbon and nitrogen isotope ratios (13C/12C and 15N/14N) of primary producers and consumers in a western Mediterranean coastal lagoon. Marine Biology 142: 1009-1018.
Wang, M., Z. Huang, F. Shi, and W. Wang. 2009. Are vegetated areas of mangroves attractive to juvenile and small fish? The case of Dongzhaigang Bay, Hainan Island, China. Estuarine, Coastal and Shelf Science 85: 208-216.
Wilson, J., and M. Sheaves. 2001. Short-term temporal variations in taxonomic composition and trophic structure of a tropical estuarine fish assemblage. Marine Biology 139: 787-796.
Wright, J. 1989. Diel variation and seasonal consistency in the fish assemblage of the non-estuarine Sulaibikhat Bay, Kuwait. Marine Biology 102: 135-142.
Zagars, M., K. Ikejima, A. Kasai, N. Arai, and P. Tongnunui. 2013. Trophic characteristics of a mangrove fish community in Southwest Thailand: Important mangrove contribution and intraspecies feeding variability. Estuarine, Coastal and Shelf Science 119: 145-152.
114

ANNEX
Annex I. Supplements for Chapter II
Annex II. Supplements for Chapter III
Annex II. Supplements for Chapter IV
115

116

Supplements for Chapter II
Annex I. Supplements for Chapter II
Table S1 Mean ± SD of environmental parameters measured in different months at the water surface during slack high tide at the mouth of intertidal mangrove creeks in Qeshm Island, Iran. N: Number of measurements for each variable.
Sampling Time N Salinity Water temperature (°C)
pH Oxygen concentration (mgl-1)
December 2011 - January 2012 32 38.3±0.6 19.9±1.2 8.1±0.1 8.7±0.5 February - March 2012 32 37.9±0.4 19.4±1.7 8.2±0.7 9.3±0.7 August- September 2012 32 38.7±0.3 33.7±1.5 8.2±0.2 6.5±1.2 Table S2 Canonical analysis of principal coordinates (CAP) testing the effect of tide-time of day (spring tide-night, spring tide-day, neap tide-night, neap tide-day) and months (December, February and August). %Var = percentage of the total variation explained by the first m principal coordinate axes; allocation success = percentage of points correctly allocated into each group; δ2 = square canonical correlation.
Factor m Var % Allocation success (%) Total δ2 P Tide-Time SN SD NN ND 12 97 70.8 79.1 45.8 79.1 68.7 0.7 0.001 Month Dec Feb Aug 6 96 50 71.8 68.7 61.9 0.4 0.01
117

Annex I
Figure S1 Intertidal mangrove creek at low water (on the left) and in high water (on the right), Qeshm Island, Iran. The photos on the tops indicate the low-lying creeks and high-lying creeks are shown in the bottom.
118

Supplements for Chapter II
Figure S2 Relationship between level of intertidal inundation and GIS-generated surface area (m2) and volume (m³) in two high-lying (a) and two low-lying(b) intertidal mangrove-lined creeks in Qeshm Island, Iran (Note: different x axis scales).
Figure S3 Rank-abundance plot of fishes captured from intertidal mangrove-lined creeks at different tide-time of day combinations during a lunar cycle in December 2011, February and August 2012 in Qeshm Island, Iran.
119

Annex I
Figure S4 Mean abundance and biomass per sample and per m2± 1SE of fish at different combination of the tidal-diel cycles and months.
Figure S5 Mean abundance and biomass per sample and per m2± 1SE of fish from two low-lying (C2, C3) and two high-lying (C1, C4) intertidal mangrove-lined creeks in Qeshm Island, Iran.
120

Supplements for Chapter II
Figure S6 Continuous 15 min measurements of water temperature and water height (m) with a HOBO water level data logger installed in the subtidal area at the mouth of the main channel from 21.08.2012 at 6:30 PM until 5.09.2012 at 7:30 PM (August - September 2012).
121

Annex II
Annex II. Supplements for Chapter III Table S1 List of microphytobenthos genera in mangrove-lined and un-vegetated sites. The numbers indicate the relative cell abundance. Bold numbers highlight site differences.
Taxa Mangrove-lined Un-vegetated Navicula spp. 62.2 2.3 Nitzschia spp. 12.2 - Bacillariophyceae (Total) 74.4 2.3 Anabaena spp. - 0.8 Chroococcus spp. 1.4 12.3 Gloeocapsa spp. - 0.8 Microcoleus spp. 13.5 49.8 Oscillatoria spp. 10.7 34.1 Cyanophyceae (Total) 25.6 97.8
Table S2 Physico-chemical characteristics of the seawater from the mangrove-lined and un-vegetated sites, Qeshm Island, Iran.
Site Season pH Do (mg/l) Salinity Temperature (°C) Mangrove-
lined Winter 8.1
±0.1 9.06±0.7 38.1±0.5 19.6±1.5
Summer 8.2±0.2 6.6±1.2 38.7±0.3 33.7±1.4 Un-vegetated Winter 8.0±0.1 9.4±0.3 40.8±4.2 19.6±2.0
Summer 8.2±0.0 7.2±0.9 40.4±1.1 34.0±2.0
Table S3 Potential contributions of mangroves to fish diets (mean ± 95% confidence interval) calculated by IsoError program and two-source mixing models for the whole fish community, fish functional group and individual fish species using δ13C values.
Sample
(Mangrove fish)
Source 1 (Non-
mangrove sources)
Source 2 (Mangrove
Leaves- green & yellow)
Whole fish community δ13C [‰] (SD) -15.8 (1.7) -13.8 (2.5) -28.3 (1.09) -23.1 (1.09) Sample size 66 46 26 Source proportions (No fractionation) 87-100 0-13 Source proportions [%] (SE) 86 (03) 14 (03) 95% Confidence limits (%) 81-91 09-19 Source proportions (Max fractionation) 79-100 0-21 Source proportions [%] (SE) 78 (04) 22 (04) 95% Confidence limits (%) 71-86 14-29 Functional groups Detritivores (DV) δ13C [‰] (SD) -14.1 (0.7) -12.1 (1.5) -28.3 (1.09) -23.1 (1.09) Sample size 14 18 26 Source proportions (No fractionation) 88-100 0-12
122

Supplements for Chapter III
Sample
(Mangrove fish)
Source 1 (Non-
mangrove sources)
Source 2 (Mangrove
Leaves- green & yellow)
Source proportions [%] (SE) 88 (02) 12 (02) 95% Confidence limits (%) 83-92 08-17 Source proportions (Max fractionation) 82-100 0-18 Source proportions [%] (SE) 82 (03) 18 (03) 95% Confidence limits (%) 75-88 12-25 Zooplanktivores (ZP) δ13C [‰] (SD) -16.6 (1.6) -15.6 (2.1) -28.3 (1.09) -23.1 (1.09) Sample size 22 14 26 Source proportions (No fractionation) 93-100 0-7 Source proportions [%] (SE) 92 (05) 08 (05) 95% Confidence limits (%) 82-100 00-18 Source proportions (Max fractionation) 87-100 0-13 Source proportions [%] (SE) 87 (08) 13 (08) 95% Confidence limits (%) 70-100 00-30 Macrobenthivores (MB) δ13C [‰] (SD) -16.5 (1.5) -14.5 (2.5) -28.3 (1.09) -23.1 (1.09) Sample size 30 14 26 Source proportions (No fractionation) 86-100 0-14 Source proportions [%] (SE) 86 (05) 14 (05) 95% Confidence limits (%) 76-95 05-24 Source proportions (Max fractionation) 77-100 0-23 Source proportions [%] (SE) 77 (07) 23 (07) 95% Confidence limits (%) 63-91 09-37 Fih species Liza klunzingeri δ13C [‰] (SD) -14.3 (0.8) -11.5 (1.3) -28.3 (1.09) -23.1 (1.09) Sample size 8 12 26 Source proportions (No fractionation) 84-100 0-16 Source proportions [%] (SE) 83 (03) 17 (03) 95% Confidence limits (%) 78-89 11-22 Source proportions (Max fractionation) 76-100 0-24 Source proportions [%] (SE) 76 (03) 24 (03) 95% Confidence limits (%) 69-83 17-31 Anodontostoma chacunda δ13C [‰] (SD) -13.8 (0.6) -13.5 (1) -28.3 (1.09) -23.1 (1.09) Sample size 6 6 26 Source proportions (No fractionation) 98-100 0-2 Source proportions [%] (SE) 98 (03) 02 (03) 95% Confidence limits (%) 91-100 00-09 Source proportions (Max fractionation) 97-100 0-3 Source proportions [%] (SE) 97 (05) 03 (05) 95% Confidence limits (%) 86-100 00-14 Leiognathus daura δ13C [‰] (SD) -19 (1.3) -17.9 (2) -28.3 (1.09) -23.1 (1.09) Sample size 6 5 26 Source proportions (No fractionation) 90-100 0-10 Source proportions [%] (SE) 89 (09) 11 (09) 95% Confidence limits (%) 68-100 00-32 Source proportions (Max fractionation) 79-100 0-21 Source proportions [%] (SE) 79 (17) 21 (17) 95% Confidence limits (%) 39-100 00-61
123

Annex II
Sample
(Mangrove fish)
Source 1 (Non-
mangrove sources)
Source 2 (Mangrove
Leaves- green & yellow)
Thryssa vitrirostris δ13C [‰] (SD) -14.6 (0.5) -14.2 (0.5) -28.3 (1.09) -23.1 (1.09) Sample size 5 6 26 Source proportions (No fractionation) 98-100 0-2 Source proportions [%] (SE) 97 (02) 03 (02) 95% Confidence limits (%) 92-100 00-08 Source proportions (Max fractionation) 96-100 0-4 Source proportions [%] (SE) 96 (03) 04 (03) 95% Confidence limits (%) 88-100 00-12 Sillago sihama δ13C [‰] (SD) -15.4 (0.5) -14.5 (0.8) -28.3 (1.09) -23.1 (1.09) Sample size 3 3 26 Source proportions (No fractionation) 94-100 0-6 Source proportions [%] (SE) 93 (04) 07 (04) 95% Confidence limits (%) 81-100 00-19 Source proportions (Max fractionation) 90-100 0-10 Source proportions [%] (SE) 90 (06) 10 (06) 95% Confidence limits (%) 71-100 00-29 Pentaprion longimanus δ13C [‰] (SD) -17.8 (1.1) -16.7 (0.9) -28.3 (1.09) -23.1 (1.09) Sample size 6 5 26 Source proportions (No fractionation) 80-100 0-20 Source proportions [%] (SE) 91 (05) 09 (05) 95% Confidence limits (%) 79-100 00-21 Source proportions (Max fractionation) 83-100 0-17 Source proportions [%] (SE) 83 (09) 17 (09) 95% Confidence limits (%) 63-100 00-37 Pomadasys kaakan δ13C [‰] (SD) -16.4 (0.6) -13.3 (0.9) -28.3 (1.09) -23.1 (1.09) Sample size 8 6 26 Source proportions (No fractionation) 76-100 0-24 Source proportions [%] (SE) 79 (02) 21 (02) 95% Confidence limits (%) 74-85 15-26 Source proportions (Max fractionation) 69-100 0-31 Source proportions [%] (SE) 68 (03) 32 (03) 95% Confidence limits (%) 61-76 24-39 Acanthopagrus latus δ13C [‰] (SD) -16.1 (1.4) -12.2 (0.7) -28.3 (1.09) -23.1 (1.09) Sample size 8 3 26 Source proportions (No fractionation) 76-100 0-24 Source proportions [%] (SE) 76 (04) 24 (04) 95% Confidence limits (%) 67-84 16-33 Source proportions (Max fractionation) 65-100 0-35 Source proportions [%] (SE) 64 (05) 36 (05) 95% Confidence limits (%) 53-76 24-47
124

Supplements for Chapter III
Figure S1 Plot of δ13C and CN% values of food sources and consumers in the mangrove site of Qeshm Island, Iran. Green and yellow mangrove leaves: ML (G), ML (Y), phytoplankton (PHY), zooplankton (ZOO), particulate organic matter (POM), Sediment (SOM), Microphytobenthos (MPB), ∆: Macrobenthos, : Fishes. Arrow indicates CN% shift from green to yellow (decomposed) leaves.
SOM ML(G)
ML (Y)
PHY MPB POM ZOO
0
20
40
60
80
100
120
-35 -30 -25 -20 -15 -10 -5
CN
(%)
δ13C(‰)
125

Supplements for Chapter IV
Annex III. Supplements for Chapter IV Table S1 Mean inundation area and volume of water for each creek during spring and neap high tides.
Creeks Spring tide Neap tide Area(m2) Volume(m3) Area(m2) Volume(m3) C1 2774 1562 338 102 C2 6481 4600 815 165 C3 11460 10327 2937 1807 C4 3811 3439 1281 220 C5 5672 2240 282 54 C6 10822 6034 1362 240
Table S2 Detailed species data for total abundance and biomass of fish and prawn on a per sample and per m2 basis for each habitat and season.
Factor m Var % Allocation success (%) Total δ2 P
Habitat mangrove
non-mangrove
5 95 76.5 78.1 74.9 0.3 0.004
Season winter summer 9 97 75 81.2 75.9 0.6 0.02 Creek (habitat) C1 C2 C3 C4 C5 C6
11 97 18.7 37.5 31.2 25 25 43.7 29.9 0.4 0.02
126

Annex III
Table S3 Table S3. Canonical analysis of principal coordinates (CAP) testing the effect of habitat (mangrove and non-mangrove), season (winter and summer) and creeks (C1, C2, C3, C4, C5, C6). %Var = percentage of the total variation explained by the first m principal coordinate axes; allocation success = percentage of points correctly allocated into each group; δ2 = square canonical correlation.
Total abundance per sample Total abundance per m2 Total biomass per sample Total biomass per m2 Habitat Season Habitat Season Habitat Season Habitat Season
M
angr
ove
Non
-man
grov
e
Win
ter
Sum
mer
Man
grov
e
Non
-man
grov
e
Win
ter
Sum
mer
Man
grov
e
Non
-man
grov
e
Win
ter
Sum
mer
Man
grov
e
Non
-man
grov
e
Win
ter
Sum
mer
Mangrove and non-mangrove Scatophagus argus (Scatophagidae) 2.30 0.09 0.13 3.00
0.040 0.001 0.00 0.04
25.0 1.0 4.2 29.76
0.27 0.01 0.06 0.21
Pomadasys kaakan (Haemulidae) 1.36 0.16 0.52 1.40
0.021 0.001 0.01 0.02
20.4 3.9 7.7 22.10
0.32 0.02 0.09 0.26 Ilisha melastoma (Clupeidae) 0.28 0.06 0.29 0.13
0.003 0.000 0.00 0.00
4.8 0.7 6.0 0.80
0.03 0.00 0.03 0.01
Sarinella longiceps (Clupeidae) 2.58 0.34 3.67 0.00
0.066 0.001 0.07 0.00
29.9 2.3 41.4 0.00
0.85 0.01 0.85 0.01 Leiognathus daura (Leiognathidae) 12.39 4.16 16.25 3.04
0.230 0.014 0.21 0.03
54.0 14.8 61.3 20.55
1.07 0.06 0.88 0.19
Thryssa vitrirostris (Engraulidae) 6.83 1.88 2.88 7.48
0.118 0.009 0.06 0.07
176.8 48.2 105.0 162.92
3.09 0.23 1.79 1.54 Acanthopagrus cuvieri (Sparidae) 0.23 0.06 0.04 0.31
0.003 0.000 0.00 0.00
1.7 6.7 0.1 6.71
0.02 0.03 0.03 0.05
Pentaprion longimanus (Gerreidae) 5.69 3.75 5.60 4.48
0.092 0.014 0.05 0.06
55.2 36.2 54.3 43.39
0.91 0.14 0.41 0.52 Acanthopagrus latus (Sparidae) 2.30 1.88 1.63 2.69
0.046 0.008 0.02 0.03
62.4 52.8 58.3 60.12
1.69 0.20 1.12 0.62
Eleutheronema tetradactylum (Polynemidae) 0.09 0.06 0.13 0.04
0.005 0.000 0.00 0.00
0.9 1.3 1.2 0.85
0.05 0.00 0.05 0.00
Scomberoides lysan (Carangidae) 0.08 0.06 0.00 0.15
0.001 0.000 0.00 0.00
1.1 1.3 0.0 2.27
0.01 0.00 0.00 0.01 Liza klunzingeri (Mugilidae) 18.20 36.09 24.98 23.3
0.277 0.164 0.26 0.18
402.7 793.2 590.5 475.16
6.58 3.70 5.59 3.45
Pseudorhombus elevatus (Paralichthyidae) 0.05 0.06 0.10 0.00
0.001 0.000 0.00 0.00
5.2 7.8 12.2 0.00
0.05 0.02 0.05 0.00
Platycephalus indicus (Platycephalidae) 0.06 0.13 0.00 0.17
0.001 0.001 0.00 0.00
8.6 45.0 0.0 41.46
0.14 0.24 0.24 0.38
Sphyraena putnamiae (Sphyraenidae) 0.02 0.06 0.00 0.06
0.000 0.000 0.00 0.00
10.0 12.8 0.0 21.85
0.22 0.08 0.08 0.30
Hemiramphus archipelagicus 0.02 0.03 0.02 0.02
0.001 0.000 0.00 0.00
0.9 0.3 0.2 1.15
0.01 0.00 0.00 0.01
127

Supplements for Chapter IV
Total abundance per sample Total abundance per m2 Total biomass per sample Total biomass per m2 Habitat Season Habitat Season Habitat Season Habitat Season
Man
grov
e
Non
-man
grov
e
Win
ter
Sum
mer
Man
grov
e
Non
-man
grov
e
Win
ter
Sum
mer
Man
grov
e
Non
-man
grov
e
Win
ter
Sum
mer
Man
grov
e
Non
-man
grov
e
Win
ter
Sum
mer
(Hemiramphidae)
Sillago sihama (Sillaginidae) 0.16 0.69 0.58 0.08
0.004 0.004 0.01 0.00
5.4 21.2 17.6 3.79
0.16 0.12 0.14 0.04 Upeneus sulphureus (Mullidae) 0.02 0.06 0.04 0.02
0.000 0.000 0.00 0.00
0.0 1.3 0.8 0.05
0.00 0.01 0.00 0.00
Anodontostoma chacunda (Clupeidae) 2.00 26.06 18.40 1.65
0.016 0.089 0.09 0.01
31.6 221.2 163.1 26.44
0.24 0.78 0.27 0.18
Mangroves only Lutjanus johni (Lutjanidae) 0.27 0.00 0.15 0.21
0.008 0.000 0.01 0.00
31.0 0.0 17.1 24.24
0.97 0.00 0.73 0.24
Plectorhinchus pictus (Haemulidae) 0.11 0.00 0.00 0.15
0.002 0.000 0.00 0.00
6.2 0.0 0.0 8.27
0.12 0.00 0.00 0.12 Sardinella gibbosa (Clupeidae) 1.84 0.00 2.46 0.00
0.029 0.000 0.03 0.00
16.0 0.0 21.4 0.00
0.24 0.00 0.24 0.00
Scartelaos tenuis (Gobiidae) 0.11 0.00 0.04 0.10
0.002 0.000 0.00 0.00
1.9 0.0 0.8 1.72
0.04 0.00 0.01 0.02 Bathygobius fuscus (Gobiidae) 0.03 0.00 0.04 0.00
0.001 0.000 0.00 0.00
0.6 0.0 0.8 0.00
0.01 0.00 0.01 0.00
Epinephelus coioides (Serranidae) 0.02 0.00 0.00 0.02
0.000 0.000 0.00 0.00
3.1 0.0 0.0 4.17
0.07 0.00 0.00 0.07 Abalistes stellatus (Balistidae) 0.02 0.00 0.02 0.00
0.000 0.000 0.00 0.00
0.3 0.0 0.3 0.00
0.01 0.00 0.01 0.00
Lutjanus russelli (Lutjanidae) 0.03 0.00 0.02 0.02
0.001 0.000 0.00 0.00
1.4 0.0 1.7 0.16
0.10 0.00 0.10 0.00 Strongylura stronglura (Belonidae) 0.02 0.00 0.02 0.00
0.000 0.000 0.00 0.00
2.0 0.0 2.7 0.00
0.01 0.00 0.01 0.00
Non-mangrove only Terapon jarbua (Terapontidae ) 0.00 0.03 0.02 0.00
0.000 0.000 0.00 0.00
0.0 1.1 0.7 0.00
0.00 0.00 0.00 0.00
Euryglossa orientalis (Soleidae ) 0.00 0.03 0.02 0.00
0.000 0.000 0.00 0.00
0.0 0.4 0.3 0.00
0.00 0.00 0.00 0.00 Gerres poieti (Gerreidae) 0.00 1.34 0.00 0.90
0.000 0.004 0.00 0.00
0.0 20.5 0.0 13.66
0.00 0.06 0.06 0.06
Crustacean Penaeus merguiensis (Penaeidae) 25.547 0 31.04 3.02
0.4 0 0.37 0.04
126.5 0 157.8 11.53
0.03 0 0.04 0.002
Number of species 28 22 25 23
128

Annex III
Figure S1 Correlation analyses between abundance and biomass per sample and per area. The correlation between abundance and biomass are significant for both per sample (r=0.9, N=96, P<0.05) and per area (r=0.6, N=96, P<0.05).
129

Supplements for Chapter IV
Figure S2 Mean fish abundance per sample and per m2 (±SE) in different habitats (left panels) and seasons (right panels).
Figure S3 Mean fish abundance and biomass (±SE) per m2 (upper panels) and per sample (lower panels), indicates inconsistent patterns between creeks (Note: different y axis scales).
130

Annex III
Figure S4 Density plots showing the credibility intervals of the standard ellipses areas (SEA) for fish species (upper panels) and food sources (lower panels). Black circles are the mode SEA, gray squares are the small sample size corrected SEA (SEAc), and boxes indicate the 50%, 75% and 95% credibility intervals.
131

132

Acknowledgements
ACKNOWLEDGEMENTS
My deepest gratitude goes to my supervisor Professor Ulrich Saint-Paul for his endless
support and enormous encouragement. Thanks for allowing me to explore my curiosity
while at the same time providing timely nudges. This project would not have been
possible without his support. Thanks for everything!
I am extremely grateful to Professor Brian Fry for all scientific guidance and
invaluable support. He challenged me to think in different ways and provided excellent
feedbacks (always on short notice). Thanks for all the ping pong emails!
Special thanks to the examination board members. In particular, I am indebted
to Professor Brey for his valuable scientific advice on the manuscripts and great
mentorship.
I would like to thank Dr. Rixen for introducing me to the world of
biogeochemistry and many fruitful discussions.
With deep sense of gratitude, I would like to thank my father for the
outstanding assistance during the field work and his approval on all the sampling and
laboratory procedures in Iran based on the animal ethics committee of Iranian
Veterinary Organization. Thanks Dady! I would like to also thank Farhad Hatami for
the excellent ideas for the bathymetric survey of the creeks.
My sincere thanks go to the fisherman Saleh Sharifi and his family for their
assistance during the field work. Thanks for staying with me in the field even when it
was 50°C and never complaining during winter night sampling while we all were
shivering. It was tough field work, although a very memorable experience. Thank you
so much!
Special thanks to Dr. Dianat who was very encouraging and supportive during
the field work. Also I acknowledge the logistical and administrative support of
“Payamnoor University, Qeshm Island branch”, “Iranian fishery organization” and
“Iranian institute for oceanography”.
I would like to express my gratitude to the German National Merit Foundation
(Studienstiftung des deutschen Volkes), that granted me a three-year scholarship, for
which I am forever grateful. I also gratefully acknowledge the support of University of
Bremen by a “Promotionsabschlussstipendium” to finish up writing my dissertation.
I very much appreciate the financial support of GLOMAR allowing me to
participate in the “Meeting on Mangrove ecology, functioning and Management
(MMM3)” in Sri Lanka (2012), “Practical training cruise on board R/V Poseidon”, 133
Acknowledgements
Lisbon (2013) and the “European Geosciences Union General Assembly” in Vienna
(2014).
My deepest gratitude goes to the people of ZMT. There are too many people to
thank individually from the IT team to the analytical laboratory, who contributed in
this PhD in some way or another. Particularly, I would like to thank my colleagues
Alejandra, Hans, Jeremy, Ray, Shilly and Simon for helpful discussions and sharing
ideas.
I would like to thank Karin Boos and Simon Geist for translating the abstract
into German. Many thanks to Alejandra Sepúlveda Lozada, Alexandra Ghosh, Hans
Sloterdijk, Sara Munday and Sunil Kumar for their thorough proofreading and many
helpful comments.
Special thanks to Gaby Böhme, and my German parents Christiane and Djalal
for their enormous support throughout this journey.
Most importantly, I thank my parents, brother, sisters and husband for so many
other things. To them I dedicate this thesis.
134

Erklärung
Eidesstattliche Erklärung
(Gem. § 6(5) Nr. 1-3 PromO)
Hiermit versichere ich, dass ich die vorliegende Arbeit:
1. ohne unerlaubte Hilfe angefertigt habe.
2. keine anderen, als die von mir im Text angegebenen Quellen und Hilfsmittel benutzt
habe.
3. die den benutztenWerken wörtlich oder inhaltlich entnommenen Stellen als solche
kenntlich gemacht habe.
Bremen, März 2015
Maryam Shahraki
135
