fiscal year 2020 - bozeman
TRANSCRIPT

FISCAL
YEAR
2020
FOR FISCAL YEAR 2020 JULY 1, 2019 TO JUNE 30, 2020
CITY OF BOZEMAN, MONTANA


TABLE OF CONTENTS
EXECUTIVE SUMMARY CITY MANAGER’S BUDGET MESSAGE 1 BUDGET SUMMARY 9 BACKGROUND 11 CITY STRUCTURE 12 CORE VALUES 12 CITY VISION AND STARTEGIC GOALS 12 ECONOMIC OUTLOOK 14 BUDGET PROCESS 15 FUNDING STRUCTURE 15 BUDGET POLICIES 17 FINANCIAL AND RESERVE POLICIES 18 AWARDS AND ACCOMPLISHMENTS 19 FY2020 BUDGET SUMMARY 19 FUND SUMMARIES 29 SUMMARY OF ALL FUND REVENUES BY TYPE 31 SUMMARY OF ALL FUND
EXPENDITURES BY TYPE 33 GENERAL FUND 35 SPECIAL REVENUE FUNDS 39 DEBT SERVICE FUNDS 54 CONSTRUCTION FUNDS 56 ENTERPRISE FUNDS 57 INTERNAL SERVICE FUNDS 64 PERMENANENT FUNDS 65
ACTIVITY/DEPARTMENT DETAIL 67 GENRAL GOVERNMENT 71
CITY COMMISSION 73 CITY MANAGER 75 CITY CLERK 77
NEIGHBORHOODS 79 CITY ATTORNEY 81 FINANCE 83 FACILITIES MANAGEMENT 85 INFORMATION TECHNOLOGY 87 HUMAN RESOURCES 89 COMMUNITY DEVELOPMENT 91 MUNICIPAL COURT 93
PUBLIC SAFETY 95 POLICE 97
FIRE 99 BUILDING INSPECTION 101 PARKING 105
PUBLIC WORKS 105
PUBLIC WORKS ADMINISTRATION 107 ENGINEERING 109
GIS/ASSET MANAGEMENT 111 SOLID WASTE & RECYCLING 113 STORMWATER 115 STREETS 117
VEHICLE MAINTENANCE 119 WASTEWATER‐ OPERATION 121
WASTEWATER‐ RECLAIMATION 123 FACILITY
WATER‐ OPERATIONS 125 WATER‐ TREATMENT PLANT 127
WATER‐ CONSERVATION 129
PUBLIC WELFARE 131 RECREATION 133 FORESTRY 135 PARKS 137 CEMETERY 139 LIBRARY 141
ECONOMIC DEVELOPMENT 143 SUSTAINABILITY 145
AFFORDABLE HOUSING 147 OTHER
NON‐DEPARTMENTAL 149 CAPITAL EXPENDITURES SUMMARY 153 FY 2020‐CAPITAL IMPROVEMENT PLAN BUDGET 155 APPENDICES 163 STATISTICAL SECTION 165 FISCAL POLICIES 169 LONG RANGE FINANCIAL PLANNING 177 GENERAL FUND MINIMUM FUND BALANCE 185 ANALYSIS GLOSSARY OF KEY TERMS 191


Executive Summary


June 24, 2019
Bozeman City Commission:
We are pleased to present to you the Approved Budget for Fiscal Year 2019‐2020 (FY20). This budget represents
the thoughtful work of dozens of people in developing the spending plan for our organization for the coming fiscal
year. Bozeman is a vital, growing, and changing city. This year we have focused on equipping the organization to
cope with our community’s continued rapid growth. We have incorporated the City’s Strategic Plan into budget
priorities: Community Outreach, Affordable Housing, Planning & Land Use Initiatives, Annexation Analysis & Study,
and Parks & Trails Maintenance District. The City is going forward with building the Bozeman Public Safety Center
after its passage in FY19.
The City’s total budget this year is estimated to be $204.8 million. This will support 448.93 full‐time equivalent
employees and $73 million in capital spending. The FY20 budget estimates an annual increase in taxes and
assessments for the typical residential property owner of $121.70, or $10.14 per month. This includes a partial
year payment of Bozeman Public Safety Center bonds and other increases based on recent rate studies, growth,
inflation, and Strategic Plan objectives.
StrategicPlanOn April 16, 2018, the City adopted its current Strategic Plan. The FY19 budget began the first steps in
accomplishing this plan. The Strategic Plan significantly informs the items approved in the FY20 budget. We have
made substantial changes to this budget document and have details regarding strategic plan efforts by division in
the Activity Detail section of this document. The full plan can be found at https://www.bozeman.net/city‐
projects/bozeman‐strategic‐plan.
Community Outreach – Many divisions have plans for community outreach and communication,
working towards transparency and access for city residents. We are developing the City’s updated
communication plan. Throughout the organization, communication has become part of work plans
and budgets. For example, the Information Technology department is budgeting for a push
notification platform and many Public Works departments are communicating service levels.
Affordable Housing – The Affordable Housing Action Plan is being funded in FY20 and will be used
to identify performance metrics for affordable housing and possible funding sources. This budget
includes projects that have been brought forward and approved by the Community Affordable
Housing Advisory Board, such as the Tschache Lane project and Timber Ridge Senior Living project.
An additional 2 mills ($219,980) were added to further build the fund balance, brining this year’s
total property tax mills for affordable housing to 5 ($542,125).
1

Planning & Land Use Initiatives‐ The Downtown Plan, the Neighborhood Conservation Overlay
District, and the Community Growth Plan update will promote continued investment in the city’s
inventory of historic structures relative to ongoing infill and redevelopment. Engineering will also
continue its planning and execution efforts for a well‐planned City.
Annexation Analysis & Study – Currently, the staff is working with the Commission to evaluate and
update policies. Based on the revised annexation policies, staff will begin planning possible areas of
annexation and the extension of service plans for areas that are wholly surrounded. This will have a
positive impact on the budget with funding, while adding service area and the number of special
improvement districts for funding the infrastructure to bring City services online.
Parks Maintenance District – The FY20 budget includes education efforts and election costs for a
vote on a Parks and Trails Maintenance District.
Strategic Vision 7‐ We will continue work towards a high performing organization and being a “best
in class” employer. With this budget proposal, we will continue to work towards market rate pay
and invest in training for employees. We are developing and tracking performance measures for
each division, as you will see in the Activity Detail section, of this document. Some measures are
new and will be tracked going forward while others we have historical data to show our
performance.
ContinuedGrowthOur community continues to see growth in all areas. We see strong building permit activity, and increased traffic
counts and congestion on City streets. According to the 2017 Census estimates, the City of Bozeman population
has increased by 25% since the 2010 Census, whereas Gallatin County outside of Bozeman has increased by 18.5%.
The City of Bozeman has enough water and sewer mains to stretch from Bozeman to Denver and has 110 miles of
stormwater mains. The City also has 925 acres of parkland, two swim facilities, and four recreation facilities. Much
of our budget decisions have been made in
response to the prolonged growth that
Bozeman continues to experience.
Level of service ‐ There were 266 new single
family homes and 593 multi‐family residential
units built in Bozeman in 2018. In order to
maintain service levels and perform the work
necessary to accomplish our Strategic Plan
action items, we must expand our staff in key
areas, such as public safety and public works,
292 285 373 403266
338497 356
420593
0
200
400
600
800
1,000
2014 2015 2016 2017 2018
New Residential Units
Single Family Multi‐Family
2

for a total of 15.85 additional full time equivalents (FTE).
Transportation‐ The City is responsible for
maintaining 215.1 miles of streets, and the street
mileage the City is responsible for maintaining has
increased by 22% since 2010. $18.5 million is
planned for transportation expenditures, with $9.9
million in capacity expanding projects.
Clean water supply and conservation‐ The City of
Bozeman has 288 miles of water mains under our
roadways. The water distribution system (water
mains) has increased by 22% since 2010. The
average growth of the number of water accounts
has been 4.1% a year for the last five years. We
expect the trend to continue. With the proposed
tiered rates for water use we should encourage
water conservation along with our expansion
efforts of $6.9 million in operational, and
maintenance efforts of $10.1 million.
ChallengesThis year it was a very difficult task to balance the needs and desires of the community with the resources that
we have available. The General Fund continues to see demands for funding that are growing faster than our
projected revenues. We simply could not fund all Department and outside requests. We had to make difficult
choices about what to include in the budget and what to trim, delay, or forego in the plan.
The General Fund is used to account for all financial resources of the City that are not required to be segregated
into a separate fund. The General Fund is the most complex fund, it receives the most numerous sources of
revenue and supports the highest number of departments. With the proposed tax increase, overall revenue is
estimated to increase by 3.5%. With less expected carry‐over funding and no large one‐time funding, as we saw
in FY19, expenditures had to be held to a total increase of less than 1% in order to balance the budget and maintain
reserve levels.
We were hopeful that this year’s Legislative Session would give us additional tools and resources for funding,
especially in the General Fund. However, the session ended without the passage of a local option tax and without
any increases in the inflation‐factor for property taxes (currently set at one‐half of the three‐year average rate of
inflation). During the last days of the session, Senate Bill 160 passed. The bill immediately added $105,000 in
Workers Compensation costs for firefighters in the General Fund, without any funding from the State of Montana
or increase in our property tax cap.
170
180
190
200
210
220
FY10 FY11 FY12 FY13 FY14 FY15 FY16 FY17 FY18
City Maintained Road Mileage
235
255
275
295
FY10 FY11 FY12 FY13 FY14 FY15 FY16 FY17 FY18
Mileage of Water Mains
3

FY20ApprovedBudgetThe City of Bozeman’s Fiscal Year 2020 budget shows large increases in total revenues and expenditures. One
main source of this is the bond issuance and the construction of the Bozeman Public Safety Center. The bond
issuance and other debt financing for large capacity projects has other financing revenue up $73 million and capital
spending up $38.6 million from FY19. Major factors affecting the rest of the revenue sources are the increase in
charges for services, the estimated 4% growth in taxable value, and the additional levy of property tax mills. The
Fiscal Year 2020 budget has over $80.6 million in personnel and operational expenditures, which is a 9% increase
over FY19 ($6.6 million).
Revenues
Property Taxes‐ With the growth of the City, expected service levels, and the strategic plan initiatives, it is
necessary to increase the property tax mill levy. This is essential to address the needs of the expanding City
while funding ongoing operations with sustainable revenues. This year, with the expected first partial bond
payment for the Bozeman Public Safety
Center, the levy in total is approved at
209.15 mills on all taxable property
within city limits. To calculate property
tax revenues, a 4% growth rate is
assumed from new construction,
leaving the estimated value of a mill at
$108,490. This is a re‐appraisal year,
which makes it difficult to estimate the
change in the levy and to estimate the
median home. The total annual
property tax for the median home is
estimated to be $820.53, an $95.87
increase from the prior year.
Special Assessments‐ City property owners pay annual street maintenance, arterial street, and tree
maintenance assessments based on the square footage of the lot they own. With the growth of the street
network and other rising costs, the Street
Maintenance FY20 budget is larger;
therefore, 8% is the increase in the
assessment. With the gas tax funding and
our capital improvement plans there is no
change needed to the Arterial & Collector
fund. For Tree Maintenance we needed an
inflationary increase of 2%.
FY18 Approved
Changes
Streets 17%,
Trees 15%
Arterial Street
63%
FY19 Approved
Changes
Streets 5%,
Trees 5%
Arterial Street
(‐28%)
FY20
Recommended
Changes
Streets 8%,
Trees 2%
Arterial Street
0%
188.76
210.16
205.30
187.33
191.24
209.15
175.00
180.00
185.00
190.00
195.00
200.00
205.00
210.00
215.00
FY15 FY16 FY17 FY18 FY19 FY20
Tax Levy
4
Utility Rates‐ The City completed a water and sewer system rate study, which adjusted both water and sewer
rates for all user classes based on costs of services. The study also approved updating
water rates for the residential customer by adjusting the tier structure and adding a
fourth tier. This structure will aid in conservation efforts and help the City with any
future drought. For Stormwater we are recommending a 4% increase in the Stormwater
fees to keep up with growth and construction costs. This is the first increase in
Stormwater fees since 2015.
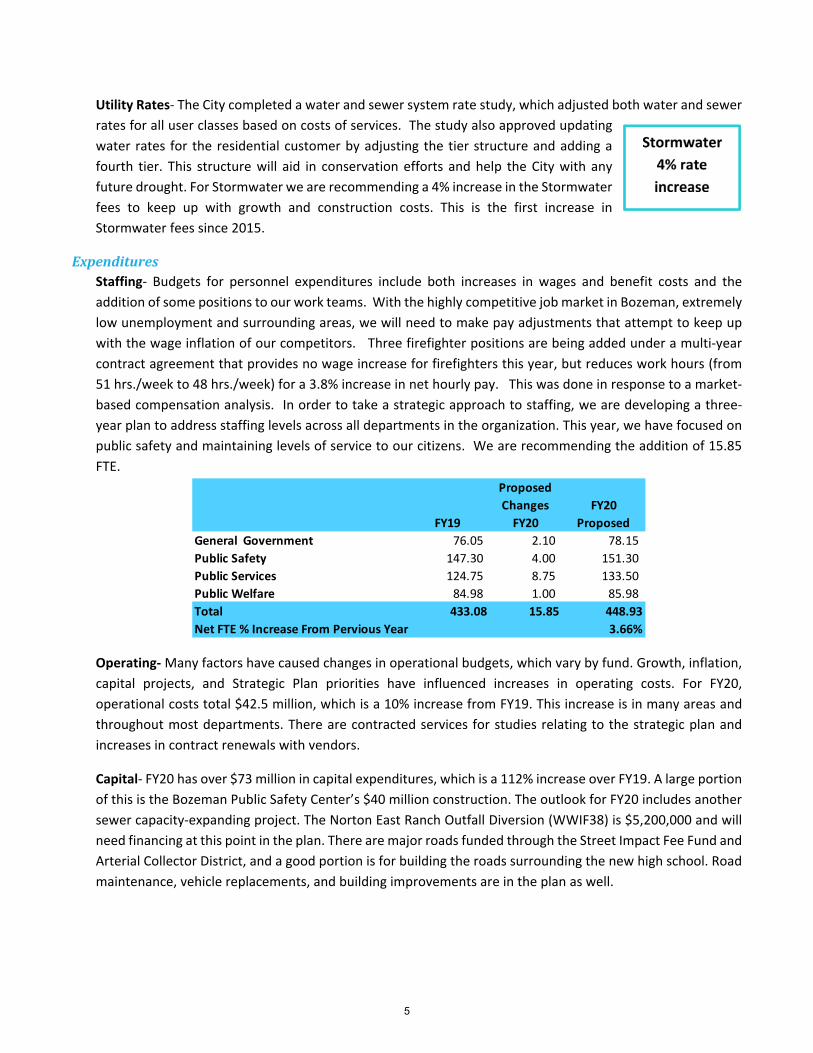
ExpendituresStaffing‐ Budgets for personnel expenditures include both increases in wages and benefit costs and the
addition of some positions to our work teams. With the highly competitive job market in Bozeman, extremely
low unemployment and surrounding areas, we will need to make pay adjustments that attempt to keep up
with the wage inflation of our competitors. Three firefighter positions are being added under a multi‐year
contract agreement that provides no wage increase for firefighters this year, but reduces work hours (from
51 hrs./week to 48 hrs./week) for a 3.8% increase in net hourly pay. This was done in response to a market‐
based compensation analysis. In order to take a strategic approach to staffing, we are developing a three‐
year plan to address staffing levels across all departments in the organization. This year, we have focused on
public safety and maintaining levels of service to our citizens. We are recommending the addition of 15.85
FTE.
Operating‐ Many factors have caused changes in operational budgets, which vary by fund. Growth, inflation,
capital projects, and Strategic Plan priorities have influenced increases in operating costs. For FY20,
operational costs total $42.5 million, which is a 10% increase from FY19. This increase is in many areas and
throughout most departments. There are contracted services for studies relating to the strategic plan and
increases in contract renewals with vendors.
Capital‐ FY20 has over $73 million in capital expenditures, which is a 112% increase over FY19. A large portion
of this is the Bozeman Public Safety Center’s $40 million construction. The outlook for FY20 includes another
sewer capacity‐expanding project. The Norton East Ranch Outfall Diversion (WWIF38) is $5,200,000 and will
need financing at this point in the plan. There are major roads funded through the Street Impact Fee Fund and
Arterial Collector District, and a good portion is for building the roads surrounding the new high school. Road
maintenance, vehicle replacements, and building improvements are in the plan as well.
FY19
Proposed
Changes
FY20
FY20
Proposed
General Government 76.05 2.10 78.15
Public Safety 147.30 4.00 151.30
Public Services 124.75 8.75 133.50
Public Welfare 84.98 1.00 85.98
Total 433.08 15.85 448.93
Net FTE % Increase From Pervious Year 3.66%
5

ReservesThe FY20 budget has a reduction in total fund balances mainly due to planned infrastructure spending. The
General Fund reserve will maintain its required minimum of 16.67% of annual revenues. We are recommending
that the Commission move towards the Government Finance Officer Association’s updated best practice with a
risk‐based approach to funding beyond the 16.67% of revenues method. We have performed an initial analysis
based on the updated best practice (Appendix D) and recommend the City work towards a reserve 17% of
expenditures. We suggest that we accomplish this increase in reserves over the next year or two by: (1) not
spending down additional cash carry‐over in the General Fund, and (2) not allocating property tax dollars that
exceed our estimates. In Special Revenue and Enterprise funds, efforts have been made to maintain a reasonable
fund balance based on the operating conditions and circumstances of the fund. Recent water and wastewater
rate studies have outlined needed reserves, which included establishing a drought reserve for the water fund.
FY20CitizenImpactA typical residential property owner will see taxes and assessment increases of $121.70 for the year, or $10.14
per month. The estimated cost per mill is $3.92. The typical resident is calculated using an average sized lot (7,500s
qft), median home of $292,000 (this was the median home taxable value at last appraisal cycle and could change)
and water use of 10‐HCF (would be charged tier 2 rate per recent rate study):
LookingForwardIn developing this year’s spending plan, we realize that there are a number of projects on the near horizon that
will impact our budget in the coming years. We have been doing the work to plan for them at the financial and
operational level, and they represent exciting opportunities and significant challenges for our community and
organization.
Parks and Trails District‐ The creation of a Parks and Trails Maintenance District allows us to use an assessment
for funding of Parks operations and maintenance. This tool would free up the portion of the General Fund currently
used for Parks, personnel, operation, and capital. When voters pass the Parks and Trails Maintenance District in
2020, the funding would begin in next year’s budget (FY21). The Commission will need to examine this and its
current capital plan when deciding the FY21 budget impacts.
Levy/Assessment FY19 Approved
FY20
Recommended
Recommended
increase % Change
Street Assessment 207.92 224.55 16.63 8%
Arterial Street Assessment 51.78 51.78 ‐ 0%
Tree (Forestry ) Assessment 23.61 24.05 0.44 2%
Property Taxes 724.66 820.53 95.87 13%
Storm Water Services 70.92 73.76 2.84 4%
Water Service 542.05 555.81 13.76 3%
Sewer Services 630.99 630.99 0.00 0%
129.54
10.79
Total Annual Estimated Increase
Monthly Increase
Average Citizen ‐ 7,500 Sqft lot, TV $292,000, 10‐HCF water use
6

Bozeman Public Safety Center full bond payments levy and operational mills – Fiscal Year 2021 will see a full
bond payment on the property tax rolls, which will increase the mill levy for property owners. In addition, in FY22
the City will begin funding operational costs for the building, including added staff. Added costs are expected to
be approximately $523,000. A small portion of this amount that supports records staff could be generated
through a reduction of the 9 mills held back for funding 911 and Records Services (Resolution No. 3954.) The rest
of the funding would come from a General Fund mill levy increase, bringing us very close to our mill levy cap.
Staffing plan‐ We have been working on a city‐wide multi‐year staffing plan that projects staffing levels for all of
our departments. Through this process, we have identified many positions needed (especially in the General
Fund) if we intend to maintain and improve our services in this growing community. A number of those positions
have been included in this proposed budget. However, the majority of requested positions could not be funded
with our existing resources (33 requested in FY20, 15.85 included in FY20 budget.) Going forward, we will need
to discuss broader strategies to add staffing to the organization.
ConclusionIn closing, we are thankful to the Commission, community members, and staff who participated in the many
processes that resulted in this budget. Staff spent many hours discussing the Strategic Plan, which helped guide
our priorities for FY20, working together, we have consistently found innovative ways to deliver services and invest
in our community in fiscally responsible ways. We believe that the FY20 Approved Budget will allow us to continue
to operate and advance the City of Bozeman.
We are a resilient, enterprising, and creative community. The FY20 Approved Budget is an achievable plan to
provide efficient and effective services, and to achieve the Commission’s vision and priorities set out in the
Strategic Plan for the City of Bozeman.
Respectfully,
Andrea Surratt, City Manager
Anna Rosenberry, Assistant City Manager
Kristin Donald, Finance Director
7

8

Budget Summary
9

10

Budget Summary Municipal budgets serve a number of important functions. In addition to laying out a spending plan for the city, and allocating resources to meet the diverse needs of the community, Bozeman’s budget:
Is a principal policy and management tool for the city’s administration, reflecting and defining the annual
work program;
Provides a framework for the city to accomplish its vision and strategic plan; and
Reflects core city values of integrity, leadership, service, and teamwork. This Budget Summary provides information about the city, along with information about the budget process,
revenues, expenditures, and city programs and services. It is intended to provide an accessible, transparent way
of learning about the city budget, while accurately showing how the city invests its resources.
BackgroundThe City of Bozeman is located on the eastern slope of the Rocky Mountains and is the county seat of Gallatin
County, Montana. Gallatin County encompasses over 2,500 square miles, bordering Yellowstone National Park to
its south. The City encompasses an area over 18 square miles with its next‐closest municipality being the City of
Belgrade, approximately 7 miles from our outermost boundary. Bozeman is located 143 miles west of Billings and
200 miles east of Missoula. Named after one of its early settlers, John Bozeman, the town was incorporated in
1874 and declared a city in 1883 before Montana was admitted into the United State in 1889. Bozeman is home
to Montana State University – Bozeman and the Fighting Bobcats. The local newspaper is the Bozeman Daily
Chronicle, and the City is served by Bozeman Yellowstone International Airport at Gallatin Field.
Today, Bozeman is the fourth
largest city in the state and is the
principal city of the Bozeman
micropolitan area, which
consists of all of Gallatin County.
The City is named after John M.
Bozeman, founder of the
Bozeman Trail. Located in the
fastest‐growing county in the
state, Bozeman was elected an
All‐American City in 2001 by the
National Civic League. Bozeman
residents are known as
Bozeman‐ites.
The City has seen large amounts of growth in the last five years going from a population of under 40,000 to over
46,000. The population is expected to reach 50,000 in 2019. The average age is 27.9 and 55.6% of the population
has Bachelor’s Degree or higher.
35,944
36,933
37,280
37,314
38,116
38,753
38,860
41,660
43,405
45,250
46,596
‐
5,000
10,000
15,000
20,000
25,000
30,000
35,000
40,000
45,000
50,000
2008 2009 2010 2011 2012 2013 2014 2015 2016 2017 2018
Estimated Population
11

CityStructureThe Bozeman City Commission
is composed of four members
and a Mayor that are elected by
the voters of the city at large in
accordance with the City
Charter. At every regular city
election, the voters of the City
shall elect a mayor at large for a
term of four years. The person
so elected shall serve as Deputy
Mayor and a Commissioner for
the first two years of their term,
and mayor for the balance of
their term of office. The City
Manager is selected by, and reports to the City
Commission. The City Manager's office is responsible
for over‐seeing City staff and completing tasks as
directed by the City Commission.
CoreValuesCity Commission Resolution No. 3832 adopted the
City’s core values in 2005. They were developed
through extensive discussions the City Manager had
with staff groups from all departments including
department directors. These core values are what
create the culture of our organization.
CityVisionandStrategicGoalsThe plan was adopted in spring 2018. Below are the vision and vision statements adopted by the Commission as
part of the Strategic Plan:
VisionBozeman remains a safe, inclusive community, fostering civic engagement and creativity, with a thriving
diversified economy, a strong environmental ethic, and a high quality of life as our community grows and changes.
StrategicVisionStatements:1) An Engaged Community. We foster a culture of engagement and civic leadership based on innovation and best
practices involving community members of all backgrounds and perspectives.
2) An Innovative Economy. We grow a diversified and innovative economy leveraging our natural amenities,
skilled and creative people, and educational resources to generate economic opportunities.
3) A Safe, Welcoming Community. We embrace a safe, healthy, welcoming and inclusive community.
Integrity
•Be honest, hardworking, reliable and accountable to the public.
Leadership
•Take initiative, lead by example, and be open to innovative ideas.
Service
•Work unselfishly for our community and its citizens.
Teamwork
•Respect others, welcome citizen involvement, and work together to achieve the best result.
City of Bozeman Citizens
Mayor ‐Cyndy Andrus
Deputy Mayor‐
Chris Mehl
Commissioner‐ Terry Cunningha
m
Commissioner‐ I‐Ho Pomeroy
Commissioner‐ Jeff Krauss
Municipal Judge
City Manager‐Andrea Surratt
City Departments
12

4) A Well‐Planned City. We maintain our community's quality of life as it grows and changes, honoring our sense
of place and the 'Bozeman feel' as we plan for a livable, affordable, more connected city.
5) A Creative, Learning Culture. We expand learning, education, arts, expression and creativity for all ages.
6) A Sustainable Environment. We cultivate a strong environmental ethic, protecting our clean air, water, open
spaces and climate, and promote environmentally sustainable businesses and lifestyles.
7) A High Performance Organization. We operate as an ethical, high performance organization anticipating future
needs, utilizing best practices, and striving for continuous improvement.
FY2020GoalsThe Commission reviewed the seven priorities from FY19 and removed the Bozeman Public Safety Center, which
was supported by City voters. The debt
issuance and construction costs for the
center are included in FY20 budget. They
also removed Partnerships for Education
and Learning because in FY19 great
strides were made with Montana State
University and the Bozeman School
District that are continuing in FY20. The
remaining five, became the priories for
FY20 and the budget. In addition to these
top five priorities, five new projects are
included in FY20 efforts:
1% for Art Program Establishment
Intersection Level of Service
Communication
Sewer Capacity Communication
Street Light Study
Vendor Gender Pay project
FY2020EconomicOutlook
The population of the City has been growing over the last ten years. There were 1,282 residential building
permits in 2018 and 52 new commercial building permits. This growth has increased the need for City services
and infrastructure. Montana State University has seen a steady growth of enrollment over the last three years
as well. Tourism is growing with the Bozeman Yellowstone Airport seeing an increase in passengers of 11.8% in
2018 and expecting the same growth for 2019.
13

The Consumer Price Index has grown over the last 10 years for the united State and particularly for the Western
States. For FY18 the three year average change was 2.03% while the Western State CPI‐U is showing 2.95% three
year average change.
Currently, the unemployment rate is 2.6% and per capita income is $28,784. The median home price for 2018
was $374,750. The top three major employers are Bozeman Deaconess Hospital, Oracle America and Bozeman
School District #7. Recent job growth is at 4.6% and the Bozeman area has the strongest economy for a city with
fewer than 50,000 people in the U.S., according to POLICOM’s recent report.
See Appendix A for more statistical details about the City’s demographics and tax base.
0.0%
1.0%
2.0%
3.0%
4.0%
5.0%
6.0%
7.0%
8.0%
$22,000
$23,000
$24,000
$25,000
$26,000
$27,000
$28,000
$29,000
$30,000
2010 2011 2012 2013 2014 2015 2016 2017 2018
Income Per Capita and Poplation Percent Change
Per capita Income % Change in Population
210.2216
219.2225.7
229.6233.0 234.8 236.5
241.4246.5
251.1
219.6218.8 221.2
227.5
232.4 236.1239.1
243.0247.7
257.3265.2
200
210
220
230
240
250
260
270
2008 2009 2010 2011 2012 2013 2014 2015 2016 2017 2018
CPI‐U
United States CPI Western States CPI
14

BudgetProcessThe City plans for the long‐term needs of our community through a number of efforts and studies. Consultants
and staff, with numerous public hearings and advisory board meetings prior to their formal adoption by the
Commission, usually develop these documents. Once adopted, we work diligently to implement the
recommendations and changes outlined in the plans. The starting point is the Strategic Plan and then the other
master plans that have been developed for each area of concern or study. Along with these documents, the capital
improvement plan is used to budget for capital projects. The following chart outlines our process and timing for
the budget:
FundingStructureTo better understand this budget document a basic understanding of the structure, often‐used terms, and fund
types is helpful. The City’s operating expenditures are organized into the following hierarchical categories:
Activities, Departments, Divisions, and Budget Units.
Activity: Activity represents the highest level of summarization used in the City’s financial structure.
This level is primarily used for entity‐wide financial reporting and for summarization in this budget
document.
Department: Department is the second level of summarization used in the City’s financial structure. This
function classification represents a grouping of related operations and programs aimed at accomplishing
a broad goal or providing a major service.
Division: Department can be further split into divisions, which are usually associated with functioning
work groups that have more limited sets of work responsibilities. Their primary purpose is organizational
December
Capital Improvement Plan is adopted and is based on department master plans, citizen engagement, advisory boards and the strategic plan.
January ‐ February
Commission evaluates the strategic plan and goals for the up‐coming years.
February ‐ April
Staff develop budgets and revenue projections. The City Manager reviews and prepares proposed budget.
May‐June
The City Manager provides to the Commission the proposed budget for adoption. The Commission adopts final budget.
Agust ‐ September
Commission adopts Mill Levy based on certified values and set assessments based on the budget
15

and budgetary accountability.
BudgetUnit:Divisions may be further subdivided into budget units. A budget unit is used to account
for a specific service performed within a division in the pursuit of individual goals and objectives. A
budget unit is aimed at accomplishing a specific service or regulatory program for which a government is
responsible.
Funds:The activities are funded through various means that are accounted for within specific funds. The City has a
comprehensive fund plan for financial accounting in accordance with the provisions of the recommendations of
the National Council on Governmental Accounting as outlined in their publication Governmental Accounting,
Auditing, and Financial Reporting (GAAFR), which is the standard accounting guide for local governments.
Governmental funds are a group of funds that account for activities associated with the City's basic operations.
This group of funds uses a modified accrual basis of accounting and focuses on operating revenues and
expenditures.
General Fund: The General Fund is used to
account for all financial resources of the
City, except for those required to be
accounted for in another fund. The General
Fund supports such basic services as the
Legislative Branch, Judicial Branch, General
Administration, Police, Fire, Finance,
Engineering, Recreation, and Library
services. The City's General Fund is financed
heavily by property taxes, which provide
nearly half of the General Fund revenue.
Special Revenue Funds: Special Revenue
Funds are used to account for the proceeds
of specific revenue sources (other than
expendable trusts, or for major capital
projects) that are legally restricted to
expenditure for specific purposes.
Debt Service Funds: Debt Service Funds are
used to account for the accumulation of
resources for, and the payment of, general
long‐term debt principal and interest.
Capital Project Funds: Capital Project Funds are used to account for financial resources to be used for the
acquisition or construction of major capital facilities (other than those financed by proprietary funds).
Bozeman Fund Structure Overview
Governmental Funds
General Fund
Special Revenue Funds
Debt Service
Capital Project
Proprietary Funds
Enterprise Funds
Fiduciary Funds
16
Proprietary Fund Types Proprietary funds are a group of funds that account for activities that are often seen in the private sector and are
operated in a similar manner as in the private sector. This group of funds uses a full accrual basis of accounting
and focuses on net income and capital maintenance.
Internal Service Funds: Internal Service Funds are used to account for the financing of goods or services
provided by one department to other departments on a cost‐reimbursement basis.
Enterprise Funds: Enterprise Funds are used to account for operations that are financed and operated in
a manner similar to private business enterprises‐‐where the intent of the governing body is that the costs
(expenses, including depreciation) of providing goods or services to the general public on a continuing
basis be financed or recovered primarily through user charges.
Fiduciary Fund Types Fiduciary funds are trust and agency funds that account for assets held by a governmental unit in a trustee capacity
or as an agent for individuals, private organizations, other governmental units, or other funds. These include
expendable trust funds, non‐ expendable trust funds, pension trust funds, and agency funds.
Trust Funds: Trust Funds are used to account for assets held by a governmental unit in a trustee capacity.
These include (a) expendable trust funds, (b) permanent trust funds, and (c) pension trust funds. Trust
Funds are supported by donations and interest income.
BudgetPoliciesState statute provides the “Local Government Budget Act” in MCA 7‐6‐4001. This section of the law was adopted
by the 2001 Legislature to replace the “Municipal Budget Law” and other various sections of code that related to
city finances. See detailed Budget and Fiscal Policies in Appendix B. The law limits the amount of expenditures to
approved appropriations, requires reporting to the State after final budgets and tax levies are adopted, and
provides for a detailed preliminary and final budget adoption within the confines of the State determined property
tax assessment time‐table. The Budget must be “balanced,” and the City can use fund balance as a resource to
balance the budget. Fund balance should not be used as a long‐term approach to balancing the budget. Planned
uses of fund balances should be limited.
It is also appropriate to use fund balance when fund balances have increased beyond the reserve requirements
due to higher than anticipated revenues. In this circumstance, the use of fund balances will be used for one‐time
expenditures, not ongoing operating costs. In all circumstances, it is important to retain sufficient undesignated
fund balance for unforeseen circumstances. The City's budget encompasses both the operating budget and the
capital improvement budget. Each budget unit includes amounts appropriated for both operating expenses and
capital items
BasisofBudgetingThe basis of budgeting and accounting refers to when a transaction or related event is recognized in an agency’s
budget, or in the operating statement, both of which follow GAAP principles. All governmental funds (including
the general, special revenue, debt service and capital projects funds) use modified accrual as both the basis of
17

budgeting and for accounting/financial reporting. Under the modified accrual system, revenues are recognized in
the accounting period in which they become “measurable and available.” “Measurable” means the amount of the
transaction can be determined and “available” means collectible within the current period or soon enough
thereafter to pay liabilities of the current period. Property tax is reported as a receivable and deferred revenue
when the levy is certified and as a revenue when due for collection in the subsequent year. An allowance for
estimated uncollectible taxes is included in the estimated tax needed to balance the budget.
The basis of accounting for proprietary funds is full accrual, where revenues are recognized when earned and
expenditures when they are incurred. The basis of budgeting for proprietary funds is full accrual with the
exceptions of depreciation and amortization. For capital assets and capital purchases, funds are budgeted from a
perspective of the actual cash outlay required (cash basis).
FinancialandReservePolicesThe following financial policies are established to provide direction in the fulfilling of duties and responsibilities
for the City of Bozeman. The following is a summary of the policies that have a direct impact on the budget
process; a complete listing of Fiscal Policies to be adopted with the budget are in Appendix B.
Long‐rangePlanningThe City needs to have the ability to anticipate future challenges in revenue and expense imbalances so that
corrective action can be taken before a crisis develops. To provide city officials with pertinent data to make
decisions for multi‐year policy direction, the Finance Director prepares revenue and expenditure forecasts. These
forecasts will identify changes in revenue and expenditures due to projected new development in the City,
program changes, collective bargaining agreements, asset replacement schedules and capital projects coming
online.
CapitalPlanning,andAssetInventoryandConditionAssessmentThe City annually prepares its Capital Improvement Program to plan capital projects and equipment needs for a
five‐year period. The plan is created on the fund basis and reviews all capital needs greater than $10,000. The plan
can be found on the city website.
RevenuePoliciesThe City values a diversified mix of revenue sources to mitigate the risk of volatility. The major source of revenue
for the General Fund is property tax, which comprises 56% percent of total General Fund revenue in 2019. Since
property values are impacted by the economy and housing market, it is important to make every effort to improve
the diversity of the City’s revenue sources. Tax dollars should support essential city services that benefit and are
available to everyone in the community (such as parks, police and fire protection). For services that largely or
solely benefit individuals, the City should recover full or partial costs of service delivery through user fees.
Use of One‐time and Unpredictable Revenues ‐ One‐time revenues should be used only for one‐time
expenditures and not for ongoing expenditures. By definition, one‐time revenues cannot be relied on in future
budget years. Appropriate uses of one‐time revenues include early debt retirement, capital expenditures that
will reduce operating costs or address deferred capital needs, and special projects that will not incur ongoing
operating costs.
18

ExpenditurePoliciesExpenses should always be for City operations and strategic goals. Department heads and the Finance Department
monitor expenditures. All expenditures must comply with City laws, rules and regulations and have proper support
and authorization.
DebtCapacity,IssuanceandManagementThe City shall evaluate and consider the following factors in analyzing, reviewing and recommending the issuance
of obligations before presenting a proposal to the Commission and voters as needed:
1. Purpose, feasibility and public benefit of the project
2. Impact on debt ratios generally applied by rating agencies
3. Availability of appropriate revenue stream(s)
4. Aggregate debt burden upon the City's tax base, including other entities' tax supported debt
5. Analysis of financing and funding alternatives, including available reserves from other City funds
AwardsandAccomplishmentsThe Government Finance Officers Association of the
United States and Canada (GFOA) presented an award
of Distinguished Budget Presentation to the City of
Bozeman for its annual budget for the fiscal year
beginning July 1, 2018. The City has received this
award for each budget it has prepared in the past 27
years.
In order to receive this award, a governmental unit
must publish a budget document that meets program
criteria as a policy document, as an operations guide,
as a financial plan and as a communications device.
This award is valid for a period of one year only. We
believe our current budget continues to conform to
program requirements, and we are submitting it to
GFOA to determine its eligibility for another award.
FY2020 BudgetSummaryThe City of Bozeman’s Fiscal year 2020 budget shows a large increase in revenues and expenditures and one main
source of this is the bond issuance and the construction of the Bozeman Public Safety Center. The bond issuance
and other debt financing for large capacity projects has other financing revenue up $81 million and capital
spending up $38.6 million from FY19. The major factors affecting the rest of the revenue sources are the increase
in charges for services, the estimated 4% growth in taxable value, and the additional levy of property tax mills.
Fiscal Year 20 budget has over $80.6 million in personnel and operation expenditures, which is a 9% increase over
FY19 ($6.6 million).
19

FY2020FinancialSummary
General
Fund
Special
Revenue Debt Service
Construction
Projects Enterprise
Internal
Service Permanent All Funds
Projected Beginning
Fund Balance/Working Capital 7,076,606$ 20,358,180$ 4,923,477$ 5,128,109$ 28,643,630$ 411,454$ 1,399,941$ 67,941,397$
Estimated Revenues 32,687,698 26,033,422 40,751,603 ‐ 36,488,903 9,380,066 90,000 145,431,692
Transfers In 369,483 4,265,877 ‐ 38,044,733 955,000 105,458 ‐ 43,740,551
Total Estimated Revenues 33,057,181 30,299,299 40,751,603 38,044,733 37,443,903 9,485,524 90,000 189,172,243
Budgted Expenditures 34,211,877 31,510,635 3,443,702 41,467,362 41,081,471 9,377,654 ‐ 161,092,701
Transfers out 355,000 5,076,753 37,602,070 ‐ 706,728 ‐ ‐ 43,740,551
Total Approprations 34,566,877 36,587,388 41,045,772 41,467,362 41,788,199 9,377,654 ‐ 204,833,252
Increase/(Decrease) in
Fund Balance/Working Capital (1,509,696) (6,288,089) (294,169) (3,422,629) (4,344,296) 107,870 90,000 (15,661,009)
Projected Ending
Fund Balance/Working Capital 5,566,910$ 14,070,091$ 4,629,308$ 1,705,480$ 24,299,334$ 519,324$ 1,489,941$ 52,280,388$
Financial Summary‐ Approved Budget Fiscal Year 2019‐2020
General Fund18%
Special Revenue15%
Debt Service22%
Construction Projects20%
Enterprise20%
Internal Service5% Permanent
0%
Revenue by Fund Type
General Fund17%
Special Revenue17%
Debt Service20%
Construction Projects21%
Enterprise20%
Internal Service5% Permanent
0%
Expenditures by Fund Type
20

FY2020EstimatedMillLeviesandValues
FISCAL YEAR FY15 FY16 FY17 FY18 FY19 FY20
MILL VALUE (net of TIFD's) 87,894$ 86,564$ 89,325$ 101,195$ 104,321$ 108,490$
PERCENTAGE CHANGE 2.6% ‐1.5% 3.2% 13.3% 3.1% 4.0%
GENERAL FUND:
All‐Purpose 144.77 155.78 148.21 134.39 139.69 142.19
SPECIAL REVENUE:
City Planning 2.00 2.00 2.00 2.00 2.00 2.00
Health/Med Insurance 23.18 27.11 26.40 24.48 25.44 25.95
Fire Capital & Equipment 4.00 4.00 4.00 4.00 4.00 4.00
Transfer to Stormwater ‐ Landfill Project 1.57 1.62 1.56 1.38 0.71 0.69
Transfer to Landfill Closure ‐ Monitring ‐ ‐ 4.00 3.67 2.38 2.58
Senior Transportation 1.00 1.00 1.00 1.00 1.00 1.00
Workforce Housing 1.00 3.00 3.00 3.00 3.00 5.00
TOTAL SPECIAL REVENUE 32.75 38.72 41.96 39.53 38.53 41.22
DEBT SERVICE:
BPSC GO Bonds ‐ ‐ ‐ ‐ ‐ 13.29
Park & Trail G.O.Bonds 8.13 12.49 12.06 10.68 10.38 9.93
Library G.O. Bonds 3.11 3.16 3.07 2.73 2.64 2.52
TOTAL DEBT SERVICE 11.24 15.65 15.13 13.41 13.02 25.73
Total Levied 188.76 210.16 205.30 187.33 191.24 209.15
Percentage Change in Mills 9.4% 12.4% ‐2.6% ‐8.6% 1.9% 9.6%
Property Taxes Levied 16,590,871$ 18,191,892$ 18,338,501$ 18,956,859$ 19,950,675$ 22,690,261$
Percentage Change in Dollars 11.9% 9.7% 0.8% 3.4% 5.2% 13.7%
* These funds are being combined into the All Purpose Levy. They are all subject to MCA 15‐10‐420.
General Fund Reduction 1,271,667$ 363,096$ 703,800$ 907,719$ 718,772$ 81,130$
911 Mills (Resolution No. 3954) 770,733$ 779,076$ 803,925$ 910,755$ 938,889$ 976,410$
Total Authorized But Not Levied 2,042,400$ 1,142,172$ 1,507,725$ 1,818,474$ 1,657,661$ 1,057,540$
Number of Mills Not Levied 23.85 13.19 16.88 17.97 15.89 9.75
Maximum Levy Allowed 212.61 223.35 222.18 205.30 207.13 218.90
MILL LEVIES & MILL VALUES
Tax Authority Authorized but Not Levied
188.76
210.16 205.30
187.33 191.24
209.15
23.85
13.19 16.88
17.97 15.89
9.75
F Y 1 5 F Y 16 F Y 17 F Y 18 F Y 19 F Y 2 0
Total Levied Number of Mills Not Levied
21

FY2020RevenuesOverall, revenues are estimated at $186 million, a $78 million increase in revenue or 73%, over the prior year. The
large difference is mainly due to the bond issuance for the Bozeman Public Safety Center, along with water and
sewer capacity projects being funded through financing as well; therefore, 46% of revenues is other financing
sources. Charges for services make up 29% of revenues, followed by taxes at 15%.
For the GeneralFund, taxes make up 49% of the revenue sources followed by intergovernmental revenue.
Property Taxes15%
Special Assessments
1%Licenses & Permits
2%
Inter‐governmental
5%
Charges for Services29%
Fines and Forfeitures
1%
Interest Income0%
Other Revenues1%
Other Financing Sources46%
All Funds Revenue by Type
Property Taxes49%
Gallatin County Option5%
Grants0%
County Shared ‐Library2%
State Shared22%
General Government
Charges10%
Fines and Fees3%
Miscellaneous Revenue
1%
Transfers8%
General Fund Revenue by Type
22

FY2020AppropriationsExpenditures, often called “Appropriations,” are classified under one of six major categories: Personnel &
Benefits, Operating Expense, Capital, Debt Service, Transfers, and Other Financing Uses. The graph below shows
the relative percentage of the FY20 budget expenditures for all funds. Again, with the Bozeman Public Safety
Center and other capital projects, Capital makes 36% followed by Operations at 20% and Personnel at 19%.
In general,governmental agencies see their largest percentage of expenditures as personnel. With our growing
City, there is a need for more infrastructure spending. The GeneralFund personnel expenses are a much higher
percentage, at 66%. There are fewer capital items in the General Fund than all the funds as a whole.
Personnel & Benefits19%
Operations20%
Capital36%
Debt Service3%
Transfers22%
Other Financing
Uses0%
All Funds Expednitures by Type
Personnel & Benefits66%
Operations29%
Capital4%
Debt Service0%Transfers
1%
General Fund Expenditures By Type
23

FY2020ChangesinFundBalance/WorkingCapital
Fiscal Year
Projected Fund
Balance/Working
Capital
Estimated
Revnues Appropriations
Budgeted Ending
Fund
Balance/Working
Capital
General Fund
10 General Fund 7,076,606 33,057,181 34,566,877 5,566,910
Special Revenue Funds
100 Planning Fund 1,148,732 1,450,574 1,873,348 725,958
103 Health‐Medical Insurance 411,839 2,815,374 2,815,384 411,829
108 Community Transportation 59,625 900 ‐ 60,525
109 Highway Safety Improvement Projects 23,462 200 ‐ 23,662
110 Gas Tax Apportionment 1,578,972 1,421,750 2,120,350 880,372
111 Street Maintenance District 334,133 6,203,836 6,462,343 75,626
112 Tree Maintenance 271,260 782,945 787,767 266,438
113 Fire Impact Fee 2,497,496 416,134 20,451 2,893,179
114 Street Impact Fee 3,124,141 4,490,095 7,565,195 49,041
115 Building Inspection Special Revenue 922,552 1,975,200 2,657,236 240,516
116 Dowtown Improvement District 1,885,421 1,729,400 2,816,000 798,821
119 Economic Development Loan Fund 829,753 50,000 31,000 848,753
120 Community Housing 1,002,092 556,950 934,458 624,584
121 Housing Revolving Loan Fund 2,485 1,195 ‐ 3,680
123 Big Sky Ec Dev Grant ‐ 50,000 50,000 ‐
125 Drug Forfeiture 42,589 199,474 242,052 11
128 Fish Wildlife And Park Management Areas 12,766 200 8,000 4,966
130 Americans With Disability Act 36,307 400 ‐ 36,707
131 Beautification of Bozeman 1,018 10 ‐ 1,028
132 Bogert Park Special Revenue 17,967 6,275 5,000 19,242
133 Recreation Department Special Revenue 16,252 2,075 ‐ 18,327
135 Cemetery Department Special Revenue 2,444 30 ‐ 2,474
136 Park Department Special Revenue 13,217 2,600 ‐ 15,817
137 Library Department Special Revenue 44,253 20,000 ‐ 64,253
138 Law & Justice Center 274,125 ‐ 19,125 255,000
139 Police Department Special Revenue 280,534 15,000 40,000 255,534
140 Police Domestic Violence ‐ 187,040 187,040 ‐
141 Street Arterial Construction 627,223 2,627,747 2,396,000 858,970
143 TIF Midtown (formerly N7th) 1,600,000 2,467,949 3,001,852 1,066,097
144 TIF NE Urban Renewal 320,000 142,500 339,500 123,000
145 TIF Mandeville Industrial 75,744 25,000 ‐ 100,744
Various Lighting Dist.'s (146‐170, 181, 182, 200‐243) 491,152 457,286 477,499 470,939
174 Victim Witness Advocate 299,646 68,500 90,000 278,146
175 Senior Transportation 2,707 108,740 108,490 2,957
176 Business Improvement District 8,297 168,350 167,160 9,487
177 Neighborhood Associations 994 10 ‐ 1,004
178 Veteran's Treatment Court 37,844 115,500 152,346 998
179 Diaster Relief Fund 140,777 11,000 ‐ 151,777
CHANGES IN FUND BALANCE/WORKING CAPITAL
24
Fiscal Year
Projected Fund
Balance/Working
Capital
Estimated
Revnues Appropriations
Budgeted Ending
Fund
Balance/Working
Capital
183 Fire Department Special Revenue 79,046 4,000 50,000 33,046
184 Parks Master Plan Develop 23,708 ‐ ‐ 23,708
186 Development Impacts 154,169 1,500 5,000 150,669
187 Fire Department Equipment 656,899 436,460 1,068,000 25,359
188 City/County Drug Forfeiture 132,985 1,300 ‐ 134,285
189 Story Mansion Special Revenue 5,797 35,000 40,792 5
191 Tourism BID 1,200 1,101,200 ‐ 1,102,400
193 Street Maintenance ‐ Babcock SID 8,383 2,650 ‐ 11,033
194 Street Maintenance ‐ Durston SID 136,688 41,450 ‐ 178,138
199 Sports Park ‐ 51,000 51,000 ‐
850 Park Land ‐ Cash in Lieu 721,486 54,500 5,000 770,986
Total Special Revenue Funds 20,358,180 30,299,299 36,587,388 14,070,091
Debt Service Funds
300 Special Improvement District Revolv. Fund 3,229,669 18,700 867,070 2,381,299
303 G.O. Refunding Series 2012 86,848 273,300 273,300 86,848
304 Park & Trails Bond ‐ 1,076,788 1,076,788 ‐
305 TIF 2007 Downtown Bonds ‐ 418,898 418,898 ‐
307 Bozeman Public Safety Center ‐ GO Bonds ‐ 38,406,716 38,376,716 30,000
310‐448 SID Funds 1,606,960 525,201 1,000 2,131,161
450 Sports Park Loan ‐ 32,000 32,000 ‐
Total Debt Service Funds 4,923,477 40,751,603 41,045,772 4,629,308
Construction Funds
500's Capital Projects 5,128,109 38,044,733 41,467,362 1,705,480
Enterprise Funds
600 Water 9,323,836 11,946,576 10,171,734 11,098,678
610 Water Impact Fee ‐ Net Assets 6,157,774 1,930,831 6,963,052 1,125,553
620 Waste Water 3,216,959 10,036,394 9,124,612 4,128,741
630 Waste Water Impact Fee ‐ Net Assets 6,233,498 6,540,674 7,343,417 5,430,755
640 Solid Waste 1,755,498 4,165,681 5,154,777 766,402
641 Landfill Post‐Closure & Monitoring 6,209 282,000 287,417 792
650 Parking Enterprise 1,289,609 1,063,340 1,082,669 1,270,280
670 Storm Water 660,247 1,478,407 1,660,521 478,133
Total Enterprise Funds 28,643,630 37,443,903 41,788,199 24,299,334
Internal Service Funds
710 Vehicle Maintenance Shop 6,164 1,390,212 1,387,800 8,576
720 Health‐Medical Self‐Insurance Fund 405,290 5,044,794 5,044,794 405,290
750 Public Works Administration ‐ 3,050,518 2,945,060 105,458
Total Internal Service Funds 411,454 9,485,524 9,377,654 519,324
Permanent Funds
800 Cemetery Perpetual Care 1,399,941 90,000 ‐ 1,489,941
Total All Funds 67,941,397 189,172,243 204,833,252 52,280,388
CHANGES IN FUND BALANCE/WORKING CAPITAL
25

FY2020StaffingChanges We strive to maintain service levels with our growing community. We have a strategic approach to staffing this
year and have developed a three‐year staffing plan to address our staffing needs on a citywide level. Going
forward, we hope this staffing plan process will become more refined and predictable for the organization and
community.
FY18 FY19
Proposed
Changes
FY20 FY20 Total
General Government
City Commission 2.10 2.10 ‐ 2.10
City Manager 9.00 9.00 ‐ 9.00
Municipal Court 9.50 9.50 0.10 9.60
City Attorney 10.70 10.70 1.00 11.70
Finance 12.50 13.50 ‐ 13.50
Community Development 13.00 14.25 1.00 15.25
Facilities Management 4.50 5.00 ‐ 5.00
Information Technology 6.00 7.00 ‐ 7.00
Human Resources 4.00 5.00 ‐ 5.00
71.30 76.05 2.10 78.15
Public Safety
Police 72.70 74.55 1.00 75.55
Fire 46.00 47.00 3.00 50.00
Building Inspection 19.50 19.75 ‐ 19.75
Parking 6.00 6.00 ‐ 6.00
144.20 147.30 4.00 151.30
Public Services
Public Works Administration 11.50 16.25 2.00 18.25
Streets 21.85 21.35 0.95 22.30
Stormwater 7.50 7.50 1.00 8.50
Water 25.95 26.45 1.20 27.65
Wastewater 28.80 28.55 1.00 29.55
Solid Waste Collection/Recycling 17.15 17.15 1.60 18.75
Vehicle Maintenance 7.50 7.50 1.00 8.50
120.25 124.75 8.75 133.50
Public Welfare
Parks and Recreation 51.46 53.46 ‐ 53.46
Library 28.02 28.02 ‐ 28.02
Ecomic Development 2.00 2.00 1.00 3.00
Sustainability 1.50 1.50 ‐ 1.50
82.98 84.98 1.00 85.98
Total Employees 418.73 433.08 15.85 448.93
Net FTE % Increase From Pervious Year 3.43% 3.66%
FTE Summary By Department
26

OrganizationalChart
27

28

Fund Summaries
29
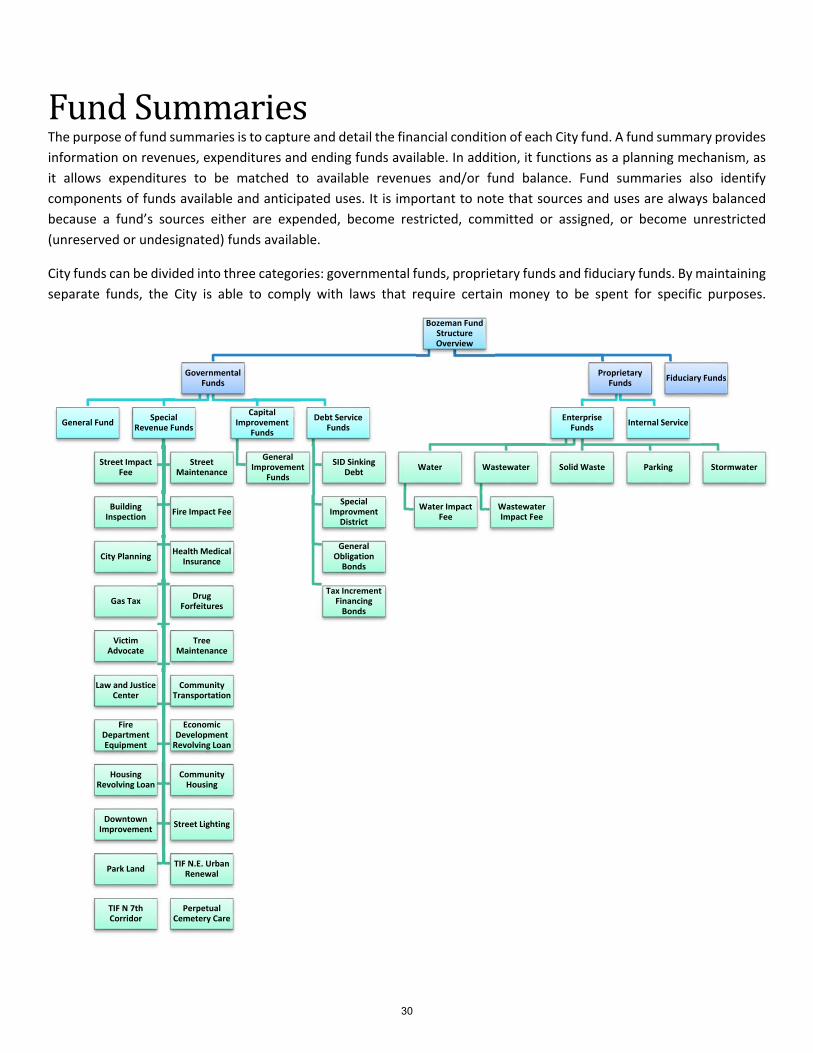
Fund Summaries The purpose of fund summaries is to capture and detail the financial condition of each City fund. A fund summary provides
information on revenues, expenditures and ending funds available. In addition, it functions as a planning mechanism, as
it allows expenditures to be matched to available revenues and/or fund balance. Fund summaries also identify
components of funds available and anticipated uses. It is important to note that sources and uses are always balanced
because a fund’s sources either are expended, become restricted, committed or assigned, or become unrestricted
(unreserved or undesignated) funds available.
City funds can be divided into three categories: governmental funds, proprietary funds and fiduciary funds. By maintaining
separate funds, the City is able to comply with laws that require certain money to be spent for specific purposes.
Bozeman Fund Structure Overview
Governmental Funds
General FundSpecial
Revenue Funds
Street Impact Fee
Street Maintenance
Building Inspection
Fire Impact Fee
City PlanningHealth Medical
Insurance
Gas TaxDrug
Forfeitures
Victim Advocate
Tree Maintenance
Law and Justice Center
Community Transportation
Fire Department Equipment
Economic Development Revolving Loan
Housing Revolving Loan
Community Housing
Downtown Improvement
Street Lighting
Park LandTIF N.E. Urban
Renewal
TIF N 7th Corridor
Perpetual Cemetery Care
Capital Improvement
Funds
General Improvement
Funds
Debt Service Funds
SID Sinking Debt
Special Improvment
District
General Obligation Bonds
Tax Increment Financing Bonds
Proprietary Funds
Enterprise Funds
Water
Water Impact Fee
Wastewater
Wastewater Impact Fee
Solid Waste Parking Stormwater
Internal Service
Fiduciary Funds
30

SummaryofallFundRevenuesbyType
City of Bozeman Revenues: All Funds
Property Taxes
Special Assessments
Licenses & Permits
Inter-governmental
Charges for Services
Fines and Forfeitures
Interest Income
Other Revenues
Other Financing Sources
TOTAL
010 - General Fund 17,703,193$ 414,975$ 7,965,993$ 2,916,037$ 1,122,000$ 75,000$ 110,500$ 2,749,483$ 33,057,181$
100 - Community Development/Planning 216,980 111,851 788,800 6,500 53,400 273,043 1,450,574
103 - Health-Medical Insurance 2,815,374 2,815,374
108 - Community Transportation 900 900 109 - Highway Safety Improvement Projects 200 200
110 - Gas Tax 1,416,750 5,000 1,421,750
111 - Street Maintenance 18,000 6,139,336 10,000 36,500 6,203,836
112 - Tree Maintenance 774,945 3,000 5,000 782,945
113 - Fire Impact Fee 404,134 12,000 416,134
114 - Street Impact Fee 4,429,095 60,000 1,000 4,490,095
115 - Building Inspection Fund 1,958,700 1,500 15,000 1,975,200
116 - TIFD Downtown Improvement 1,674,400 45,000 10,000 1,729,400
119 - Economic Development Loan 50,000 50,000
120 - Community Housing Fund 542,450 5,000 9,500 556,950
121 - Housing Revolving Loan 20 1,175 1,195
123 - Big Sky Econ. Development Grant 50,000 50,000
125 - Drug Forfeiture Fund 115,000 60,000 700 23,774 199,474
128 - Fish Wildlife & Park Mgmt 200 200
130 - Americans with Disability 400 400
131 - Beautification of Bozeman 10 10
132 - Bogert Park Special Revenue 175 6,100 6,275
133 - Recreation Special Revenue 75 2,000 2,075
135 - Cemetery Special Revenue 30 30
136 - Park Special Revenue 100 2,500 2,600
137 - Library Special Revenue - 20,000 20,000
139 - Police Special Revenue 2,500 12,500 15,000
140 -Police Domestic Violence 187,040 - 187,040
141 - Street Arterial Construction 1,372,840 7,000 525,057 722,850 2,627,747
143 - TIF N 7th Corridor 651,949 9,500 1,806,500 2,467,949
144 - TIF NE Urban Renewal District 139,500 3,000 142,500
145 - TIF Mandeville Farm Industrial 25,000 25,000 146 - 170;181;182; 200 -241 - Lighting Districts 450,254 5,890 1,142 457,286
174 - Victim/Witness Advocate 65,000 3,500 68,500
175 - Senior Transportation 108,490 250 108,740
31

City of Bozeman Revenues: All Funds
Property Taxes
Special Assessments
Licenses & Permits
Inter-governmental
Charges for Services
Fines and Forfeitures
Interest Income
Other Revenues
Other Financing Sources
TOTAL
176 - BID Downtown Improv Dist 100 25,250 143,000 168,350
177 - Neighborhood Association 10 10
178 - Veteran's Treatment Court 113,000 2,500 115,500
179 - Disaster Relief 11,000 11,000 183 - Fire Department Special Revenue 1,000 3,000 4,000 186 - Development Impacts 1,500 1,500
187 - Fire Dept Equipment 433,960 2,500 436,460
188 - City/County Joint Forfeiture - 1,300 1,300
189 - Story Mansion Special Revenue 35,000 35,000
191 - Bozeman Tourism BID 1,100,000 1,200 1,101,200
193 - Street Maintenance - Babcock SID 650 2,000 2,650
194 - Street Maintenance - Durston SID 500 40,950 41,450
199- Sports Park 51,000 51,000
850 - Cash in Lieu of Parkland 4,500 50,000 54,500
300 - SID Revolving Fund 15,000 3,700 18,700
303 - G.O. Refunding Series 2012 273,300 273,300
304 - Parks & Open Space Bond 1,076,788 1,076,788
305 - 2007 Downtown TIF Bonds 418,898 418,898
307 - BPSC GO Bonds 1,441,716 36,965,000 38,406,716
310-447- SID Funds 417,627 13,045 94,529 525,201
450 - Sports Park Loan 32,000 32,000
500-566 - Construction Funds 38,044,733 38,044,733
600 - Water Fund 1,500 10,455,076 160,000 130,000 1,200,000 11,946,576
610 - Water Impact Fee 1,925,831 5,000 1,930,831
620 - Waste Water Fund 35,000 9,921,394 80,000 - 10,036,394
630 - Waste Water Impact Fee 1,320,674 20,000 5,200,000 6,540,674
640 - Solid Waste Fund 4,132,473 7,275 25,933 4,165,681
641 - Landfill Closure Costs 2,000 280,000 282,000
650 - Parking Fund 456,000 50,000 300,000 5,000 252,340 1,063,340
670 - Storm Water Fund 1,397,907 5,500 75,000 1,478,407
710 - Vehicle Maintenance 1,389,462 250 500 1,390,212
720 - Health-Medical Insurance 5,044,794 5,044,794
750 - Public Works Administration 2,945,060 105,458 3,050,518
800 - Cemetery Perpetual Care 80,000 10,000 90,000
27,103,100$ 3,372,721$ 2,847,675$ 9,991,134$ 54,151,518$ 1,547,000$ 582,080$ 1,873,776$ 87,703,239$ 189,172,243$
% of Total 14% 2% 2% 5% 29% 1% 0% 1% 46% 100%
32

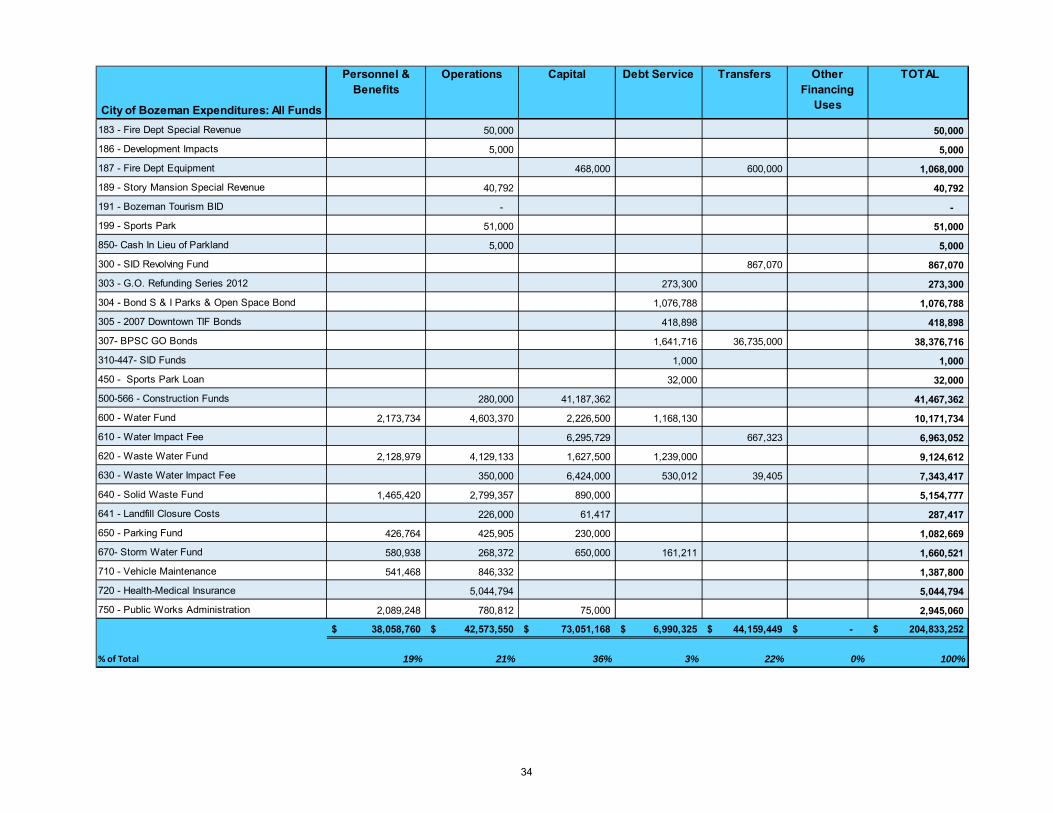
SummaryofallFundExpendituresbyType
City of Bozeman Expenditures: All Funds
Personnel & Benefits
Operations Capital Debt Service Transfers Other Financing
Uses
TOTAL
010 - General Fund 22,734,715$ 10,149,112$ 1,283,580$ 44,470$ 355,000$ 34,566,877$
100 - Community Development/Planning 1,416,573 421,775 35,000 1,873,348
103 - Health-Medical Insurance 2,815,384 2,815,384
110 - Gas Tax 1,157,500 240,000 722,850 2,120,350
111 - Street Maintenance 1,756,594 2,175,136 1,510,080 310,800 709,733 6,462,343
112 - Tree Maintenance 455,103 242,664 90,000 787,767
113 -Fire Impact Fee 20,451 20,451
114 - Street Impact Fee - 7,376,000 189,195 7,565,195
115 - Building Inspection Fund 1,869,291 787,945 - 2,657,236
116 - TIFD Downtown Improvement 17,929 2,379,173 418,898 2,816,000
119 - Economic Development Loan 31,000 31,000
120 - Community Housing Fund 81,708 852,750 934,458
123 - Big Sky Ec Dev Fund 50,000 50,000
125 - Drug Forfeiture Fund 233,152 8,900 242,052
128 - Fish Wildlife & Park Mgmt 8,000 8,000
132 - Bogert Park Special Revenue 5,000 5,000
138 - Law & Justice Center 19,125 19,125
139 - Police Special Revenue Fund 40,000 40,000
140 -Police Domestic Violence 187,040 187,040
141 - Street Arterial Construction 15,000 2,381,000 2,396,000
143 - TIF N 7th Corridor 26,379 2,975,473 - 3,001,852
144 - TIF NE Urban Renewal District 26,379 220,121 93,000 - 339,500
145 - TIF Mandeville Farm Industrial - - 146 - 170;181;182; 200 -241 - Lighting Districts 458,359 19,140 477,499
174 - Victim/Witness Advocate 90,000 90,000
175 - Senior Transportation 108,490 108,490
176 - BID Downtown Improv Dist 167,160 167,160
178 - Veteran's Treatment Court 34,386 117,960 152,346
33
City of Bozeman Expenditures: All Funds
Personnel & Benefits
Operations Capital Debt Service Transfers Other Financing
Uses
TOTAL
183 - Fire Dept Special Revenue 50,000 50,000
186 - Development Impacts 5,000 5,000
187 - Fire Dept Equipment 468,000 600,000 1,068,000
189 - Story Mansion Special Revenue 40,792 40,792
191 - Bozeman Tourism BID - -
199 - Sports Park 51,000 51,000
850- Cash In Lieu of Parkland 5,000 5,000
300 - SID Revolving Fund 867,070 867,070
303 - G.O. Refunding Series 2012 273,300 273,300
304 - Bond S & I Parks & Open Space Bond 1,076,788 1,076,788
305 - 2007 Downtown TIF Bonds 418,898 418,898
307- BPSC GO Bonds 1,641,716 36,735,000 38,376,716
310-447- SID Funds 1,000 1,000
450 - Sports Park Loan 32,000 32,000
500-566 - Construction Funds 280,000 41,187,362 41,467,362
600 - Water Fund 2,173,734 4,603,370 2,226,500 1,168,130 10,171,734
610 - Water Impact Fee 6,295,729 667,323 6,963,052
620 - Waste Water Fund 2,128,979 4,129,133 1,627,500 1,239,000 9,124,612
630 - Waste Water Impact Fee 350,000 6,424,000 530,012 39,405 7,343,417
640 - Solid Waste Fund 1,465,420 2,799,357 890,000 5,154,777
641 - Landfill Closure Costs 226,000 61,417 287,417
650 - Parking Fund 426,764 425,905 230,000 1,082,669
670- Storm Water Fund 580,938 268,372 650,000 161,211 1,660,521
710 - Vehicle Maintenance 541,468 846,332 1,387,800
720 - Health-Medical Insurance 5,044,794 5,044,794
750 - Public Works Administration 2,089,248 780,812 75,000 2,945,060
38,058,760$ 42,573,550$ 73,051,168$ 6,990,325$ 44,159,449$ -$ 204,833,252$
% of Total 19% 21% 36% 3% 22% 0% 100%
34

GeneralFundThe General Fund is used to account for all financial resources of the City, except for those required to be accounted for
in another fund. The General Fund supports such basic services as the General Administration, Police, Fire, Finance,
Recreation, and Library services. Over the past ten years, the average percent increase in revenue is 4% while expenditure
change is 5%.
Revenues The City's General Fund is financed heavily by property taxes, which provide nearly half of the General Fund revenue.
Other revenue sources include: licenses and permits, intergovernmental revenue, charges for services, fines and
forfeitures, interest on investments, operating transfers, and miscellaneous revenues. For the budget, we have estimated
4% growth and have proposed levying three additional mills to bring annual revenues in line with annual operations. Below
are the property tax trends:
22,902,157
26,965,254
33,057,181
22,881,261
27,428,654
34,566,877
‐
5,000,000
10,000,000
15,000,000
20,000,000
25,000,000
30,000,000
35,000,000
40,000,000
General Fund for the last 10 years and FY20 Approved
Revenue Expenditures Fund balance
Fiscal
Year
City Taxable
Value
Change
in TV
City Tax
Levy
Property Tax
Dollars
General Fund
Portion
2015 87,894 2.64% 188.76 16,590,871 12,724,414
2016 86,564 ‐1.51% 210.16 18,191,892 13,484,940
2017 89,325 3.19% 209.91 18,338,501 13,238,858
2018 101,195 13.29% 187.33 18,956,859 13,599,596
2019 104,321 3.09% 191.24 19,950,675 14,563,212
** 2020 108,490 4.00% 207.15 22,473,281 15,426,193
35

We are estimating the General Fund to generate $33 million in total revenue, with 49% is from property taxes, 22% from
the State Entitlement share and 10% for charges for services. The following chart shows the breakdown of esimated
revenues.
Expenditures This year’s General Fund budget has $34.3 Million in expenditures. Personnel expenses are the highest portion at $22.7
million, followed by operations of $10.1 million. The capital expenditures are $1.2 million, which includes vehicle
replacements, portion of the road by Rose Park and Police portable radio lease. The break down by percentage is below:
Personnel & Benefits66%
Operations29%
Capital4%
Debt Service0% Transfers
1%
General Fund Expenditures By Type
Property Taxes49%
Gallatin County Option5%
Penalty & Interest0%
Grants0%
County Shared ‐Library2%
State Shared22%
General Government
Charges10%
Fines and Fees3%
Miscellaneous Revenue
1%
Transfers8%
General Fund Revenue by Type
36

The expenditures by division show Police with 26% followed by Fire with 16%, both have an increase in staff for FY20
with one Police officer added and three Fire Fighters. Non‐Departmental is the next largest portion, which accounts for
the general liability and property insurance and the non‐cash transfer for State share of Police and Fire retirement. See
budget details in the Activity/Division Detail section.
Fund Balance The City policy for General Fund Reserve is to maintain at least 16.67% of the year’s revenue in ending fund balance. For
the FY20 approved budget, we estimate to have 16.67% at the end of the fiscal year. We are recommending the fund
balance policy work towards a risk based assessment model where the reserve is set at budget time. We performed a
preliminary analysis and want to work towards 17% of expenditures, if there is cash carryover or mill values are higher
than expected, the additional amount should go towards this effort. See Appendix D for risk based analysis.
City Commission1%
City Manager4%
Municipal Court3%
City Attorney4%
Finance3% Facilities Management
5%
Information Technology4%
Human Resources
2%
Police26%
Police Pension (Non‐Departmental)
5%
Fire16%
Fire Pension (Non‐Departmental)
3%
Cemetery2%
Parks7%
Library7%
Recreation6%
Economic Development1%
Sustainability0%
Non‐Departmental4%
‐ 1,000,000 2,000,000 3,000,000 4,000,000 5,000,000 6,000,000 7,000,000 8,000,000
5,566,910 5,831,829
General Fund‐ Fund Balance
37

FY18 Actual FY19 Budget FY20 Approved
Revenues
Property Taxes 14,067,669 15,076,534 16,023,193
Gallatin County Option 1,621,597 1,545,000 1,680,000
Penalty & Interest 92 ‐ ‐
Business/Animal Licenses and Permits 395,109 409,475 414,975
Grants 47,933 40,000 40,000
County Shared ‐ Library 666,757 696,280 706,762
State Shared 6,971,332 6,906,231 7,219,231
General Government Charges 2,760,257 2,940,941 2,916,037
Library Fines 47,559 50,000 50,000
Police Court Fines 1,007,617 1,023,000 1,025,000
Parking Fines 12,550 38,000 25,000
Snow Removal Fines 26,016 20,000 22,000
Interest Income ‐ 75,000 75,000
Admin Reimbursement 1,500 ‐ ‐
Miscellaneous Revenue 74,550 12,000 36,000
Refunds & Reimbursements 1,025,290 25,000 25,000
Rents and Royalties (Leases) 40,296 40,950 44,000
Sales/Unclaimed Property ‐ 5,500 5,500
Transfers 2,323,901 2,560,119 2,729,483
Loan Proceeds 8,006 431,500 ‐
Proceeds‐Asset Disposition 12,208 20,000 20,000
Total Revenues 31,110,239 31,915,530 33,057,181
Expenditures
Personnel & Benefits 22,531,001 21,960,888 22,734,715
Operations 6,237,763 9,788,744 10,149,112
Capital 704,076 1,523,717 1,283,580
Debt Service 4,702 3,650 44,470
Transfers 632,084 491,188 355,000
Total Expenditures 30,109,626 33,768,187 34,566,877
010 ‐ General Fund
FUND
38

SpecialRevenueFundsSpecial Revenue Funds are used to account for the proceeds of specific revenue sources that are legally restricted to
expenditure for specific purposes. The revenue is generated in different ways; some have assessments on properties,
property taxes, charges for services, and some are funded through grants or donations. The City currently has 119 special
revenue funds with a total of $36.5 million expenditures planned in FY20. Information on the programs funded or partially
funded by these Special Revenue Funds can be found in the description by division in the Activity/Division Detail section.
Highlighted in the following discussion are our Transportation special revenue funds and some of our major program
special revenue funds, followed by the financial information for all special revenue funds.
TransportationSpecialRevenuefundsStreet Maintenance Fund relies on assessments for
revenue generation for street maintenance and
reconstruction. The City expanded, the Streets program
starting in FY16 to include increased maintenance. The City
has seen an increase in the quantity of streets to maintain
as well. This year we are increasing the assessment by 8%
to be able to adjust to growth.
The Street Maintenance fund budget includes increased
amounts of pavement maintenance, capital projects, and
the addition of Streets workers. This trend will continue
with the Capital Improvement Plan and the three‐year
staffing plan showing increases for further growth.
0.0%
5.0%
10.0%
15.0%
20.0%
6.9% 6.4%
10.0%
15.0%17.0%
5.0%
8.0%
Street Maintenance Assessment Rate Change
‐
2,000,000
4,000,000
6,000,000
8,000,000
2,012,817 3,743,738
6,203,836
2,087,184
4,335,599
6,462,343
Street Maintenance Fund Financial Trends
Revenue Expenditures
Street maintenance
Assessments
Lot Size
FY18 Approved
Increase
Streets 17%
FY19 Approved
Increase
Streets 5%
FY20 Approved
Changes
Streets 8%
Small ‐ 5,000 sgft 131.99 138.59 149.67
Average= 7,500 sqft 198.02 207.92 224.55
Large= 10,000 sqft 264.02 272.22 229.40
39
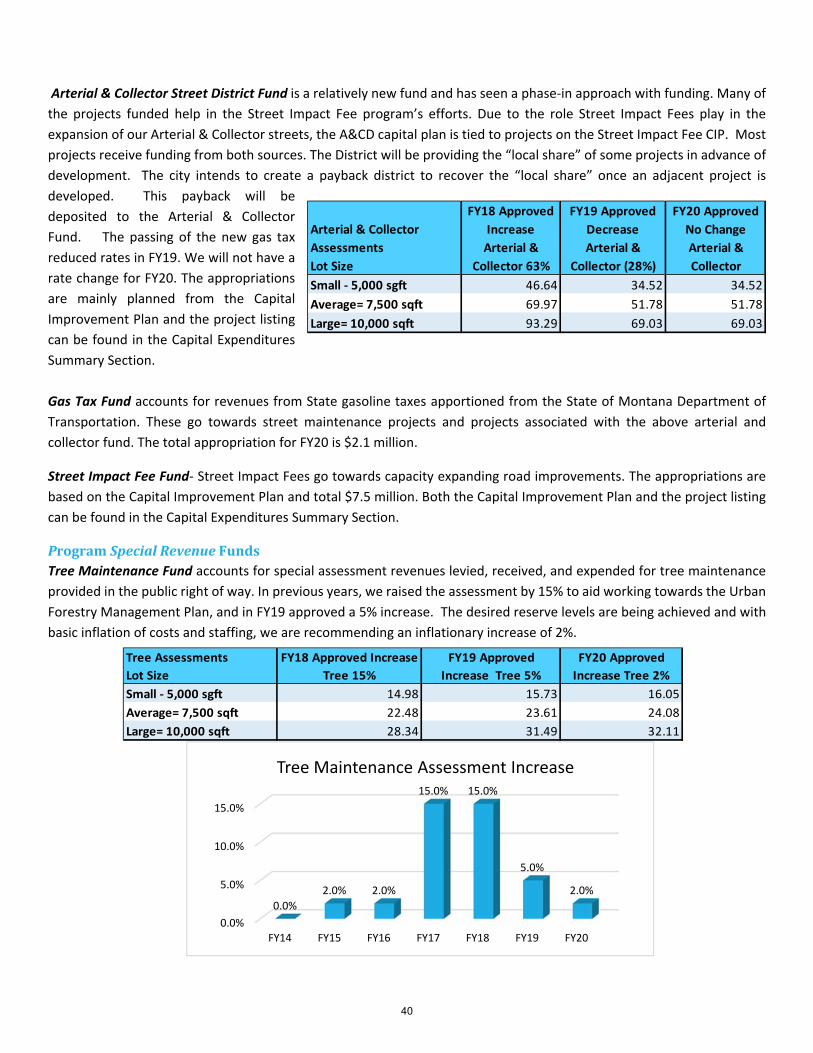
Arterial & Collector Street District Fund is a relatively new fund and has seen a phase‐in approach with funding. Many of
the projects funded help in the Street Impact Fee program’s efforts. Due to the role Street Impact Fees play in the
expansion of our Arterial & Collector streets, the A&CD capital plan is tied to projects on the Street Impact Fee CIP. Most
projects receive funding from both sources. The District will be providing the “local share” of some projects in advance of
development. The city intends to create a payback district to recover the “local share” once an adjacent project is
developed. This payback will be
deposited to the Arterial & Collector
Fund. The passing of the new gas tax
reduced rates in FY19. We will not have a
rate change for FY20. The appropriations
are mainly planned from the Capital
Improvement Plan and the project listing
can be found in the Capital Expenditures
Summary Section.
Gas Tax Fund accounts for revenues from State gasoline taxes apportioned from the State of Montana Department of
Transportation. These go towards street maintenance projects and projects associated with the above arterial and
collector fund. The total appropriation for FY20 is $2.1 million.
Street Impact Fee Fund‐ Street Impact Fees go towards capacity expanding road improvements. The appropriations are
based on the Capital Improvement Plan and total $7.5 million. Both the Capital Improvement Plan and the project listing
can be found in the Capital Expenditures Summary Section.
ProgramSpecialRevenueFundsTree Maintenance Fund accounts for special assessment revenues levied, received, and expended for tree maintenance
provided in the public right of way. In previous years, we raised the assessment by 15% to aid working towards the Urban
Forestry Management Plan, and in FY19 approved a 5% increase. The desired reserve levels are being achieved and with
basic inflation of costs and staffing, we are recommending an inflationary increase of 2%.
Arterial & Collector
Assessments
Lot Size
FY18 Approved
Increase
Arterial &
Collector 63%
FY19 Approved
Decrease
Arterial &
Collector (28%)
FY20 Approved
No Change
Arterial &
Collector
Small ‐ 5,000 sgft 46.64 34.52 34.52
Average= 7,500 sqft 69.97 51.78 51.78
Large= 10,000 sqft 93.29 69.03 69.03
Tree Assessments
Lot Size
FY18 Approved Increase
Tree 15%
FY19 Approved
Increase Tree 5%
FY20 Approved
Increase Tree 2%
Small ‐ 5,000 sgft 14.98 15.73 16.05
Average= 7,500 sqft 22.48 23.61 24.08
Large= 10,000 sqft 28.34 31.49 32.11
0.0%
5.0%
10.0%
15.0%
FY14 FY15 FY16 FY17 FY18 FY19 FY20
0.0%
2.0% 2.0%
15.0% 15.0%
5.0%
2.0%
Tree Maintenance Assessment Increase
40

Community Development Planning Fund is a special revenue fund that accounts for revenues and expenditures related
to community planning and zoning operations. There are two major revenue sources for the fund, mills from the general
mill levy along with planning fees. The Community Development Fund now has four fees that are restricted for use on
long‐range and other planning document updates, and technology (Long‐Range, Conservation Overlay, Entryway Corridor,
and Technology.) The total planned expenditures are $1.87 million.
Building Inspection Fund is supported entirely by the revenue from building fees and permits. Revenues and expenditures
are statutorily restricted to amounts that support the building safety program. This fund is dependent on construction in
the City and therefore is monitored based on economic conditions. In addition, it is reported in the quarterly report to the
Commission. Total planned expenditures are $2.65 million.
The Workforce Housing Fund is where our affordable housing program is accounted for. Affordable Housing is part of our
Strategic Plan and a priority for FY20. With the hiring of the Program Manager, the City is forming an updated plan to be
approved by the Commission. The fund receives three mills of the general mill levy as well as cash‐in‐lieu of affordable
housing for projects. The Commission approved an additional 2 mills for FY20 to continue to build the reserve.
568,698
761,209
1,002,092
624,584
‐
200,000
400,000
600,000
800,000
1,000,000
1,200,000
Actual FY17 Actual FY18 Approved FY19 RecommendedFY20
Workforce Housing Fund
Ending Fund Balance Total Estimated Revenues: Total Proposed Expenditures:
41

All Special Revenue Funds:
FY18 Actual FY19 Budget FY20 Approved
Revenues
Property Taxes 199,071 210,488 216,980
State Shared 114,495 110,733 111,851
Charges for Services 909,607 785,500 788,800
Interest Income ‐ 6,500 6,500
Refunds & Miscellaneous Revenue 49,330 53,400 53,400
Transfers 106,750 127,575 273,043
Total Revenues 1,379,253 1,294,196 1,450,574
Expenditures
Personnel & Benefits 881,772 990,695 1,416,573
Operations 337,908 369,281 421,775
Capital ‐ 301,218 35,000
Total Expenditures 1,219,680 1,661,194 1,873,348
103 ‐ Health‐Medical Insurance
Revenues
Property Taxes 2,435,316 2,654,566 2,815,374
Total Revenues 2,435,316 2,654,566 2,815,374
Expenditures
Transfers 2,407,104 2,654,566 2,815,384
Total Expenditures 2,407,104 2,654,566 2,815,384
108 ‐ Community Transportation
Revenues
Interest Income 993 1,200 900
Total Revenues 993 1,200 900
Expenditures
Capital ‐ ‐
Total Expenditures ‐ ‐ ‐
Revenues
Interest Income 244 200 200
Total Revenues 244 200 200
FUND
Special Revenue Funds
100 ‐ Community Development/Planning
109 ‐ Highway Safety Improvement Projects
42

FY18 Actual FY19 Budget FY20 Approved
Revenues
State Shared 971,627 1,402,031 1,416,750
Interest Income ‐ 9,000 5,000
Total Revenues 971,627 1,411,031 1,421,750
Expenditures
Operations 502,278 244,500 1,157,500
Capital 653,164 927,000 240,000
Transfers ‐ ‐ 722,850
Total Expenditures 1,155,442 1,171,500 2,120,350
Revenues
Penalty & Interest 16,152 11,500 11,500
Permits 17,407 18,000 18,000
Public Service 5,460,337 5,730,198 6,139,336
Interest Income (974) 10,000 10,000
Other Financing Sources 35,509 ‐ ‐
Refunds & Reimbursements 173,172 10,000 25,000
Proceeds‐Asset Disposition 12,827 ‐ ‐
Loan Proceeds 244,531 ‐ ‐
Transfers 31,900 ‐ ‐
Total Revenues 5,990,861 5,779,698 6,203,836
Expenditures
Personnel & Benefits 1,676,893 1,629,339 1,756,594
Operations 1,937,735 2,019,801 2,175,136
Capital 805,722 1,314,500 1,510,080
Debt Service 223,985 315,207 310,800
Transfers 1,313,800 695,478 709,733
Total Expenditures 5,958,135 5,974,325 6,462,343
Revenues
Penalty & Interest 2,094 1,200 2,000
Grants 750 ‐ ‐
State Revenue 7,825 ‐ ‐
Public Service 689,113 730,821 774,945
Interest Income 3,578 2,200 3,000
Sale of Raw Materials 15,050 3,000 3,000
Total Revenues 718,410 737,221 782,945
Expenditures
Personnel & Benefits 432,444 435,400 455,103
Operations 143,947 244,177 242,664
Capital 124,773 146,000 90,000
Total Expenditures 701,164 825,577 787,767
FUND
Special Revenue Funds
112 ‐ Tree Maintenance
110 ‐ Gas Tax
111 ‐ Street Maintenance
43

FY18 Actual FY19 Budget FY20 Approved
Revenues
Public Safety 599,364 380,363 404,134
Interest Income ‐ 12,000 12,000
Total Revenues 599,364 392,363 416,134
Expenditures
Operations 44,984 ‐ ‐
Transfers ‐ ‐ 20,451
Total Expenditures 44,984 ‐ 20,451
Revenues
Public Service 5,523,020 4,226,250 4,429,095
Interest Income ‐ 115,000 60,000
Admin Reimbursement ‐ 1,000 1,000
Grants ‐ ‐ ‐
Total Revenues 5,523,020 4,342,250 4,490,095
Expenditures
Operations 161,261 45,000 ‐
Capital 7,663,383 6,373,000 7,376,000
Transfers ‐ ‐ 189,195
Total Expenditures 7,824,644 6,418,000 7,565,195
Revenues
Permits 2,199,692 1,783,700 1,958,700
General Government 67 1,500 1,500
Interest Income ‐ 15,000 15,000
Miscellaneous Revenue 2 ‐ ‐
Total Revenues 2,199,761 1,800,200 1,975,200
Expenditures
Personnel & Benefits 1,341,328 1,702,127 1,869,291
Operations 777,494 706,608 787,945
Capital ‐ 251,681 ‐
Total Expenditures 2,118,822 2,660,416 2,657,236
FUND
Special Revenue Funds
113 ‐ Fire Impact Fee
114 ‐ Street Impact Fee
115 ‐ Building Inspection Fund
44

FY18 Actual FY19 Budget FY20 Approved
Revenues
Property Taxes 1,232,868 1,820,000 1,674,400
State Shared 56,050 45,000 45,000
Interest Income ‐ 10,000 10,000
Other Revenues ‐ ‐ ‐
Total Revenues 1,288,918 1,875,000 1,729,400
Expenditures
Personel ‐ ‐ 17,929
Operations 459,248 1,618,500 2,379,173
Transfers 721,473 434,000 418,898
Total Expenditures 1,180,721 2,052,500 2,816,000
Revenues
Interest Income 1,549 ‐ ‐
Loan Principal ‐ 25,000 25,000
Loan Interest 21,737 25,000 25,000
Total Revenues 23,286 50,000 50,000
Expenditures
Operations 37,782 31,000 31,000
Total Expenditures 37,782 31,000 31,000
Revenues
Property Tax Revenue 302,781 315,732 542,450
Interest Income 398 4,000 5,000
Loan Principal & Interest ‐ 9,500 9,500
Transfers 20,500 166,188 ‐
Total Revenues 323,679 495,420 556,950
Expenditures
Personnel 27,052 78,708 81,708
Operations 100,010 293,150 852,750
Total Expenditures 127,062 371,858 934,458
Revenues
Interest Income 22 10 20
Loan Principal ‐ 1,000 1,000
Loan Interest 7 275 175
Total Revenues 29 1,285 1,195
Expenditures
Operations ‐ ‐ ‐
Total Expenditures ‐ ‐ ‐
FUND
Special Revenue Funds
116 ‐ TIFD Downtown Improvement
119 ‐ Economic Development Loan
120 ‐ Community Housing Fund
121 ‐ Housing Revolving Loan
45

FY18 Actual FY19 Budget FY20 Approved
Revenues
Grants 70,000 50,000 50,000
Total Revenues 70,000 50,000 50,000
Expenditures
Operations 70,000 50,000 50,000
Total Expenditures 70,000 50,000 50,000
Revenues
Grants 65,295 75,000 70,000
State Shared 46,136 ‐ 45,000
Police Court Fines 72,985 54,000 60,000
Interest Income 784 70 700
Other Financing Sources 122,069 28,872 23,774
Total Revenues 307,269 157,942 199,474
Expenditures
Personnel & Benefits 260,567 222,710 233,152
Operations 10,119 8,500 8,900
Total Expenditures 270,686 231,210 242,052
Revenues
Interest Income 216 150 200
Total Revenues 216 150 200
Expenditures
Operations ‐ 8,000 8,000
Total Expenditures ‐ 8,000 8,000
Revenues
Interest Income 377 300 400
Total Revenues 377 300 400
Revenues
Interest Income 10 9 10
Total Revenues 10 9 10
FUND
Special Revenue Funds
123 ‐ Big Sky Econ. Development Grant
125 ‐ Drug Forfeiture Fund
128 ‐ Fish Wildlife & Park Mgmt
130 ‐ Americans with Disability
131 ‐ Beautification of Bozeman
46

FY18 Actual FY19 Budget FY20 Approved
Revenues
Interest Income 194 100 175
Donations 11,750 5,000 5,000
Refunds & Reimbursements 1,086 1,200 1,100
Total Revenues 13,030 6,300 6,275
Expenditures
Operations 10,175 5,000 5,000
Total Expenditures 10,175 5,000 5,000
Revenues
Interest Income 72 100 75
Donations 4,634 2,000 2,000
Total Revenues 4,706 2,100 2,075
Expenditures
Operations 9,500 ‐ ‐
Total Expenditures 9,500 ‐ ‐
Revenues
Interest Income 25 20 30
Total Revenues 25 20 30
Revenues
Interest Income 173 100 100
Donations 31,144 ‐ ‐
Miscellaneous Revenue 2,320 2,500 2,500
Total Revenues 33,637 2,600 2,600
Expenditures
Operations 515 ‐ ‐
Capital 8,980 ‐ ‐
Total Expenditures 9,495 ‐ ‐
Revenues
Grants ‐ ‐ ‐
Interest Income (342) 100 ‐
Donations 16,030 75,000 20,000
Other Financing Sources 35,000 ‐ ‐
Total Revenues 50,688 75,100 20,000
Expenditures
Operations 45,784 ‐ ‐
Total Expenditures 45,784 ‐ ‐
FUND
Special Revenue Funds
132 ‐ Bogert Park Special Revenue
133 ‐ Recreation Special Revenue
135 ‐ Cemetery Special Revenue
136 ‐ Park Special Revenue
137 ‐ Library Special Revenue
47

FY18 Actual FY19 Budget FY20 Approved
Expenditures
Operations 19,125 19,125 19,125
Total Expenditures 19,125 19,125 19,125
Revenues
Grants 6,200 ‐ ‐
Interest Income 2,567 2,000 2,500
Donations 2,933 2,000 3,000
Miscellaneous Revenue 7,808 10,000 9,000
Refunds & Reimbursements ‐ 500 500
Total Revenues 19,508 14,500 15,000
Expenditures
Operating 35,406 ‐ 40,000
Capital ‐ ‐ ‐
Total Expenditures 35,406 ‐ 40,000
Revenues
Grants 44,936 ‐ 187,040
State Shared ‐ ‐ ‐
Transfers 53 ‐ ‐
Total Revenues 44,989 ‐ 187,040
Expenditures
Personnel & Benefits 2,666 ‐ ‐
Operating 42,323 ‐ 187,040
Total Expenditures 44,989 ‐ 187,040
Revenues
Penalty & Interest 4,894 2,334 2,500
Street Maintenance Assessments 1,821,677 1,333,854 1,372,840
Other Revenues/Refunds 221,891 378,688 522,557
Interest Income ‐ 20,031 7,000
Transfers ‐ ‐ 722,850
Total Revenues 2,048,462 1,734,907 2,627,747
Expenditures
Operating 34,180 115,000 15,000
Capital 1,707,236 3,453,000 2,381,000
Total Expenditures 1,741,416 3,568,000 2,396,000
FUND
Special Revenue Funds
140 ‐ Police Domestic Violence
141 ‐ Street Arterial Construction
138 ‐ Law & Justice Center
139 ‐ Police Special Revenue
48

FY18 Actual FY19 Budget FY20 Approved
Revenues
Property Taxes 638,613 651,949 651,949
Interest Income ‐ 9,500 9,500
Proceeds Sales of TIF Bonds ‐ ‐ 1,806,500
Transfers 48,835 ‐ ‐
Total Revenues 687,448 661,449 2,467,949
Expenditures
Personnel ‐ ‐ 26,379
Operating 184,331 1,491,900 2,975,473
Capital 397,951 ‐ ‐
Transfers 36,000 40,000 ‐
Total Expenditures 618,282 1,531,900 3,001,852
Revenues
Property Taxes 144,461 139,500 139,500
Grants 1,356 ‐ ‐
Interest Income 3,765 1,500 3,000
Proceeds of Bond Sale ‐ ‐ ‐
Total Revenues 149,582 141,000 142,500
Expenditures
Personnel ‐ ‐ 26,379
Operating 19,987 420,100 220,121
Debt Service 92,000 ‐ 93,000
Transfers 10,000 14,000 ‐
Total Expenditures 121,987 434,100 339,500
Revenues
Property Taxes 56,063 25,000 25,000
Interest Income 198 ‐ ‐
Total Revenues 56,063 25,000 25,000
Expenditures
Operating 4,721 4,000 ‐
Total Expenditures 4,721 4,000 ‐
Revenues
Penalty & Interest ‐ 113 1,142
Special Assessments 425,319 426,562 450,254
Interest Income 5,929 4,925 5,890
Total Revenues 431,248 431,487 457,286
Expenditures
Operating 442,189 440,617 458,359
Transfers 31,900 31,900 19,140
Total Expenditures 474,089 472,517 477,499
FUND
Special Revenue Funds
143 ‐ TIF Midtown (N 7th Corridor)
144 ‐ TIF NE Urban Renewal District
145 ‐ TIF Mandeville Farm Industrial
146 ‐ 170;181;182; 200 ‐243 ‐ Lighting Districts
49

FY18 Actual FY19 Budget FY20 Approved
Revenues
Police Court Fines 72,052 63,000 65,000
Interest Income 4,084 3,100 3,500
Total Revenues 76,136 66,100 68,500
Expenditures
Operating 81,500 150,000 90,000
Total Expenditures 81,500 150,000 90,000
Revenues
Property Taxes 99,539 105,244 108,490
Interest Income 470 200 250
Total Revenues 100,009 105,444 108,740
Expenditures
Operating 100,678 105,244 108,490
Total Expenditures 100,678 105,244 108,490
Revenues
Principal 128,136 143,000 143,000
Penalty & Interest ‐ 200 100
Donations/other ‐ 19,500 25,250
Total Revenues 128,136 162,700 168,350
Expenditures
Operating 132,939 162,175 167,160
Total Expenditures 132,939 162,175 167,160
Revenues
Interest Income 10 8 10
Total Revenues 10 8 10
Revenues
Grants 39,838 113,000 113,000
State Shared ‐ ‐ ‐
Refunds & Reimbursements 2,464 7,000 2,500
Transfers ‐ ‐
Total Revenues 42,302 120,000 115,500
Expenditures
Personnel & Benefits 10,346 ‐ 34,386
Operating 29,681 87,156 117,960
Total Expenditures 40,027 87,156 152,346
FUND
Special Revenue Funds
178 ‐ Veteran's Treatment Court
176 ‐ BID Downtown Improv Dist
177 ‐ Neighborhood Association
174 ‐ Victim/Witness Advocate
175 ‐ Senior Transportation
50

FY18 Actual FY19 Budget FY20 Approved
Revenues
Interest Income (6,656) 11,000 11,000
Total Revenues (6,656) 11,000 11,000
Revenues
Interest Income 1,022 650 1,000
Donations 6,205 3,000 3,000
Grants 53,346 ‐ ‐
Total Revenues 60,573 3,650 4,000
Expenditures
Operating 89,252 40,000 50,000
Total Expenditures 89,252 40,000 50,000
Revenues
Transfers ‐ ‐ ‐
Total Revenues ‐ ‐ ‐
Expenditures
Operating 1,999 ‐ ‐
Total Expenditures 1,999 ‐ ‐
Revenues
Interest Income 1,815 1,500 1,500
Other Revenue 100 ‐ ‐
Total Revenues 1,915 1,500 1,500
Expenditures
Operating 7,903 ‐ 5,000
Total Expenditures 7,903 ‐ 5,000
187 ‐ Fire Dept Equipment
Revenues
Property Taxes 398,156 420,976 433,960
Other 5,569 ‐ ‐
Interest Income ‐ 2,500 2,500
Total Revenues 403,725 423,476 436,460
Expenditures
Operating 17,904 ‐ ‐
Capital 583,137 606,000 468,000
Transfers ‐ ‐ 600,000
Total Expenditures 601,041 606,000 1,068,000
FUND
Special Revenue Funds
179 ‐ Disaster Relief (Hail Damage Events)
183 ‐ Fire Department Special Revenue
184 ‐ Parks Master Plan/Improvement Grants
186 ‐ Development Impacts
51

FY18 Actual FY19 Budget FY20 Approved
188 ‐ City/County Joint Drug Forfeiture
Revenues
Fines ‐ 500 ‐
Interest Income 1,361 1,100 1,300
Total Revenues 1,361 1,600 1,300
Revenues
Charges for Sevices 25,610 22,000 35,000
Total Revenues 25,610 22,000 35,000
Expenditures
Operating 31,946 57,302 40,792
Capital ‐ ‐ ‐
Total Expenditures 31,946 57,302 40,792
Revenues
Special Assessments 1,028,397 1,200,000 1,100,000
Penalty & Interest ‐ 1,200 1,200
Total Revenues 1,028,397 1,201,200 1,101,200
Expenditures
Operations 1,028,397 1,200,000 ‐
Total Expenditures 1,028,397 1,200,000 ‐
Revenues
Principal 1,928 2,000 2,000
Interest 595 1,200 600
Interest Income 40 ‐ 50
Total Revenues 2,563 3,200 2,650
Revenues
Principal 52,299 40,000 40,000
Interest 521 500 500
Interest Income 935 400 950
Total Revenues 53,755 40,900 41,450
FUND
Special Revenue Funds
193 ‐ Street Maint ‐ Babcock SID
194 ‐ Street Maint ‐ Durston SID
189 ‐ Story Mansion Special Revenue
191 ‐ Bozeman Tourism BID
52

FY18 Actual FY19 Budget FY20 Approved
199‐ Sports Park
Revenues
Other ‐ ‐ 51,000
Total Revenues ‐ ‐ 51,000
Expenditures
Operating ‐ ‐ 51,000
Total Expenditures ‐ ‐ 51,000
Revenues
Cash in Lieu of Parkland 187,144 ‐ 50,000
Interest Income ‐ 4,500 4,500
Total Revenues 187,144 4,500 54,500
Expenditures
Operations 4,320 ‐ 5,000
Total Expenditures 4,320 ‐ 5,000
FUND
Special Revenue Funds
850 ‐ Cash in Lieu of Parkland
53

DebtServiceFundsDebt Service Funds are used to account for the accumulation of resources for, and the payment of, general long‐term debt
principal and interest. General Obligation Bonds are backed by the full faith and credit of the City and are payable from
ad valorem property taxes. Except for refunding bonds issued to achieve savings, Bozeman voters must approve general
obligation debt prior to issuance. A large change for FY20 is expected with the issuance of General Obligation bonds for
the Bozeman Public Safety Center in late summer, first part of FY20. There is also a loan initiated during 2019 to fund two
additional turf fields and the Sports Park that will be repaid through user group fees managed by the Sports Park
Foundation. Debt schedules are located at the end of the Activity/Division Section under the Non‐Departmental.
FY18 Actual FY19 Budget FY20 Approved
Revenues
Interest Income ‐ 26,000 15,000
Loan Interest 3,685 3,500 3,700
Other ‐ 224,011 ‐
Total Revenues 3,685 253,511 18,700
Expenditures
Transfers ‐ 224,011 867,070
Total Expenditures ‐ 224,011 867,070
Revenues
Property Taxes 274,863 275,900 273,300
Total Revenues 274,863 275,900 273,300
Expenditures
Debt Service 276,500 276,900 273,300
Total Expenditures 276,500 276,900 273,300
Revenues
Property Taxes 1,078,563 1,083,136 1,076,788
Total Revenues 1,078,563 1,083,136 1,076,788
Expenditures
Debt Service 1,081,238 1,088,138 1,076,788
Total Expenditures 1,081,238 1,088,138 1,076,788
Revenues
Transfers In 422,637 423,673 418,898
Total Revenues 422,637 423,673 418,898
Expenditures
Debt Service 422,288 423,673 418,898
Total Expenditures 422,288 423,673 418,898
FUND
Debt Service Funds
300 ‐ SID Revolving Fund
303 ‐ G.O. Refunding Series 2012
304 ‐ Bond S & I Parks & Open Space Bond
305 ‐ 2007 Downtown TIF Bonds
54

FY18 Actual FY19 Budget FY20 Approved
Revenues
Property Taxes ‐ ‐ 1,441,716
Proceeds Sales of GO Bonds ‐ ‐ 36,965,000
Transfers ‐ ‐ ‐
Total Revenues ‐ ‐ 38,406,716
Expenditures
Debt Service ‐ ‐ 1,641,716
Transfers ‐ ‐ 36,735,000
Total Expenditures ‐ ‐ 38,376,716
Revenues
Special Assessments 415,290 439,129 417,627
Penalty & Interest 91,390 152,985 94,529
Interest Income 10,589 1,200 13,045
Total Revenues 517,269 593,314 525,201
Expenditures
Debt Service 972 385,800 1,000
Transfers ‐ ‐ ‐
Total Expenditures 972 385,800 1,000
Revenues
Special Assessments ‐ ‐ 32,000
Total Revenues ‐ ‐ 32,000
Expenditures
Debt Service ‐ ‐ 32,000
Total Expenditures ‐ ‐ 32,000
450‐ Ssports Park Foundation Turf Field Loan
310‐448‐ SID Funds
FUND
Debt Service Funds
307 ‐ Bozeman Public Safety Center‐ GO Bonds
55

ConstructionFundsCapital Projects Funds account for the construction of general improvement projects financed by special assessments
other than those financed by proprietary funds. Citizens and public officials in Bozeman have supported significant public
investments that make Bozeman the city it is today. The City’s Capital Improvement Program (CIP) develops the Five‐Year
CIP, manages the City’s annual budget process for funding citywide capital maintenance and expansion projects, supports
strategic capital planning and
programming efforts with City
departments, and provides analysis for
judicious financial decision making. A
Capital Improvement is a project or effort
that maintains, improves, or constructs a
City asset, such as buildings,
transportation networks, or parks and
recreation facilities. The large change in
these funds for FY20 is the construction of
the Bozeman Public Safety Center
approved by the voters in November 2018.
FY18 Actual FY19 Budget FY20 Approved
Revenues
Interest Income ‐ ‐ ‐
Transfers 1,313,800 284,011 38,044,733
Other Funding 1,363,457 ‐ ‐
Total Revenues 2,677,257 284,011 38,044,733
Expenditures
Operating 105,274 735,000 280,000
Capital 5,777,080 284,011 41,187,362
Transfers ‐ ‐ ‐
Total Expenditures 5,882,354 1,019,011 41,467,362
FUND
Construction Funds
500‐566 ‐ Construction Funds
56

EnterpriseFundsEnterprise Funds are used to account for efforts that are financed and operated in a manner similar to private business
enterprises‐‐where the intent of the governing body is that the costs (expenses, including depreciation) of providing goods
or services to the general public on a continuing basis be financed or recovered primarily through user charges. The
following is a discussion of some of the major enterprise funds and ones with larger changes for FY20, followed by all
Enterprise Fund financials.
Water Fund‐ City property owners are, by and large, required to use the City’s Water treatment systems. The City recently
underwent a rate study that included water conservation rate examination, and drought rate and reserve design. The rate
study was presented and accepted by the Commission on April 15, 2019. The plan outlines targets for reserves that
includes a drought reserve to cover times of extreme drought. The drought reserve rate will be $0.08 per CCF. The rates
for the residential class will be based on their usage on the tier system pictured below to encourage water conservation
and discourage over watering.
Then rates will change based on user class:
57

With these changes, appropriate users classes will be charged based on their cost of service and the City will be able to
achieve and maintain appropriate revenue levels and reserves. Overall, the fund has maintained a healthy reserve and
improved, as well as maintained, the City’s water system.
Wastewater Fund‐ City Property owners are, by and large, required to use the City’s Sewer treatment systems. The City
recently underwent a rate study presented and accepted by the Commission on April 15, 2019. Rates vary by user class:
With these changes, appropriate users classes will be charged based on their cost of service and the City will be able to
achieve and maintain appropriate revenue levels and reserves. Overall, the fund has maintained a healthy reserve and
improved as well as maintained the City’s sewer system. The fund balance needs growth as the infrastructure is starting
to age.
‐
5,000,000
10,000,000
15,000,000
20,000,000
25,000,000
Water Fund Financial Trends
Revenues Expenditures Fund Balance
58

Stormwater Fund‐ The City’s Stormwater fund started in 2013 and had its current rate structure set in April 2015, rates
are based on impervious area, and existing infrastructure. The rate has not changed since the 2015
restructure. With inflation costs and growth, we are recommending a 4% rate increase. With increasing
the rate and with projected growth, the fund will be able to maintain a 45‐dayoperating resevre and a
depreciation reserves to be able to replace unexpected loss of equipment.
Solid Waste Fund ‐The City’s Solid Waste Fund accounts for the garbage and recycling service provided to citizens.
Revenues are comprised of solid waste and recycling fees. Expenses are for personnel, operations and capital items. Fund
balance is sufficient for depreciation coverage and for an event, if we lose the use of a truck unexpectedly. We are currently
performing a rate study that will determine if a rate increase is needed by early August 2019. For this budget, revenue has
been estimated based on past growth with no rate change.
‐
5,000,000
10,000,000
15,000,000
20,000,000
25,000,000
30,000,000
Wastewater Fund
Revenues Expenditures Fund Balance
‐
500,000
1,000,000
1,500,000
2,000,000
2,500,000
2013 2014 2015 2016 2017 2018 2019Budget
2020Approved
Storm Water Financial Trends
Revenues Expenditures Fund Balance
59

All Enterprise Funds:
FY18 Actual FY19 Budget FY20 Approved
Revenues
Penatly & Interest 66 ‐ ‐
State Shared 59,029 1,500 1,500
Utility Charges 8,544,654 8,985,959 10,455,076
Interest Income (1,639) 168,495 160,000
Donations ‐ Contributed Capital 4,874,798 ‐ ‐
Cah in Lieu‐Water Rights 1,180,122 ‐ ‐
Miscellaneous Revenue ‐ 50,000 50,000
Refunds & Reimbursements 500
Rents & Royalties 38,567 80,000 80,000
Administrative Reimbursement 1,486,808 ‐ ‐
Other Financing Sources ‐ 1,750,000 1,200,000
Total Revenues 16,182,405 11,036,454 11,946,576
Expenditures
Personnel & Benefits 3,203,117 2,085,584 2,173,734
Operating 5,573,070 4,634,920 4,603,370
Capital 971,834 4,316,009 2,226,500
Debt Service ‐ 1,165,630 1,168,130
Total Expenditures 9,748,021 12,202,143 10,171,734
Revenues
Utilities & Enterprise 2,757,565 1,883,070 1,925,831
Interest Income (344) 5,000 5,000
Total Revenues 2,757,221 1,888,070 1,930,831
Expenditures
Operating 152,736 ‐ ‐
Capital 279,399 1,586,020 6,295,729
Transfers ‐ 600,000 667,323
Total Expenditures 432,135 2,186,020 6,963,052
FUND
Enterprise Funds
600 ‐ Water Fund
610 ‐ Water Impact Fee
60

FY18 Actual FY19 Budget FY20 Approved
Revenues
Penalties & Interest 23 ‐ ‐
State Shared 36,704 1,500 35,000
Utility & Enterprise 8,876,015 9,559,623 9,921,394
Interest Income ‐ 91,238 80,000 Refunds & Reimbursements 29,035 ‐ ‐ Contributed Capital 4,102,663 ‐ ‐ Other Financing 1,007 ‐ ‐
Total Revenues 13,045,447 9,652,361 10,036,394
Expenditures
Personnel & Benefits 1,987,336 2,017,844 2,128,979
Operating 3,267,033 4,069,269 4,129,133
Capital 1,502,439 3,352,500 1,627,500
Debt Service ‐ 1,476,059 1,239,000
Transfers ‐ ‐ ‐
Total Expenditures 6,756,808 10,915,672 9,124,612
Revenues
Utility & Enterprise 1,810,489 1,282,208 1,320,674
Loan Proceeds ‐ 7,985,000 5,200,000
Interest Income ‐ 20,000 20,000
Total Revenues 1,810,489 9,287,208 6,540,674
Expenditures
Operating 83,977 ‐ 350,000
Capital 127,634 8,625,000 6,424,000
Debt Service ‐ ‐ 530,012
Transfers ‐ ‐ 39,405
Total Expenditures 211,611 8,625,000 7,343,417
FUND
Enterprise Funds
620 ‐ Waste Water Fund
630 ‐ Waste Water Impact Fee
61

FY18 Actual FY19 Budget FY20 Approved
Revenues
Penalty & Interest 234 ‐ ‐
State Shared 24,471 ‐ ‐
Recycling Revenue 446,931 408,035 483,771
Utilities & Enterprise 3,479,192 3,508,627 3,648,702
Interest Income 151 6,995 7,275
Miscellaneous Revenue ‐ ‐
Refunds & Reimbursements 3,078 ‐ ‐
Rents and Royalties ‐ 8,240 8,570
Roll‐Off Container Rental 14,778 16,695 17,363
Total Revenues 3,968,835 3,948,592 4,165,681
Expenditures
Personnel & Benefits 1,463,392 1,351,142 1,465,420
Operating 2,769,103 2,312,942 2,799,357
Capital 736,637 100,000 890,000
Transfers ‐ ‐ ‐
Total Expenditures 4,969,132 3,764,084 5,154,777
Revenues
Interest 2,914 ‐ 2,000
Transfers 368,084 250,000 280,000
Total Revenues 370,998 250,000 282,000
Expenditures
Operations 303,372 250,000 226,000
Capital 61,417 61,417 61,417
Total Expenditures 364,789 311,417 287,417
Revenues
Licenses and Permits 612,118 414,000 456,000
Charges for Services 64,308 50,000 50,000
Fines and Forfeitures 281,954 300,000 300,000
Interest Income ‐ 5,000 5,000
Loan Interest 762 840 840
Miscellaneous Revenue 18,401 ‐ ‐
Rents & Receivables 1,837 1,500 1,500
Transfers from other Funds 250,000 250,000 250,000
Total Revenues 1,229,380 1,021,340 1,063,340
Expenditures
Personnel & Benefits 389,115 353,362 426,764
Operating 744,665 393,978 425,905
Capital 159,336 112,031 230,000
Total Expenditures 1,293,116 859,371 1,082,669
FUND
Enterprise Funds
640 ‐ Solid Waste Fund
641 ‐ Landfill Post Closure and Monitoring Costs
650 ‐ Parking Fund
62
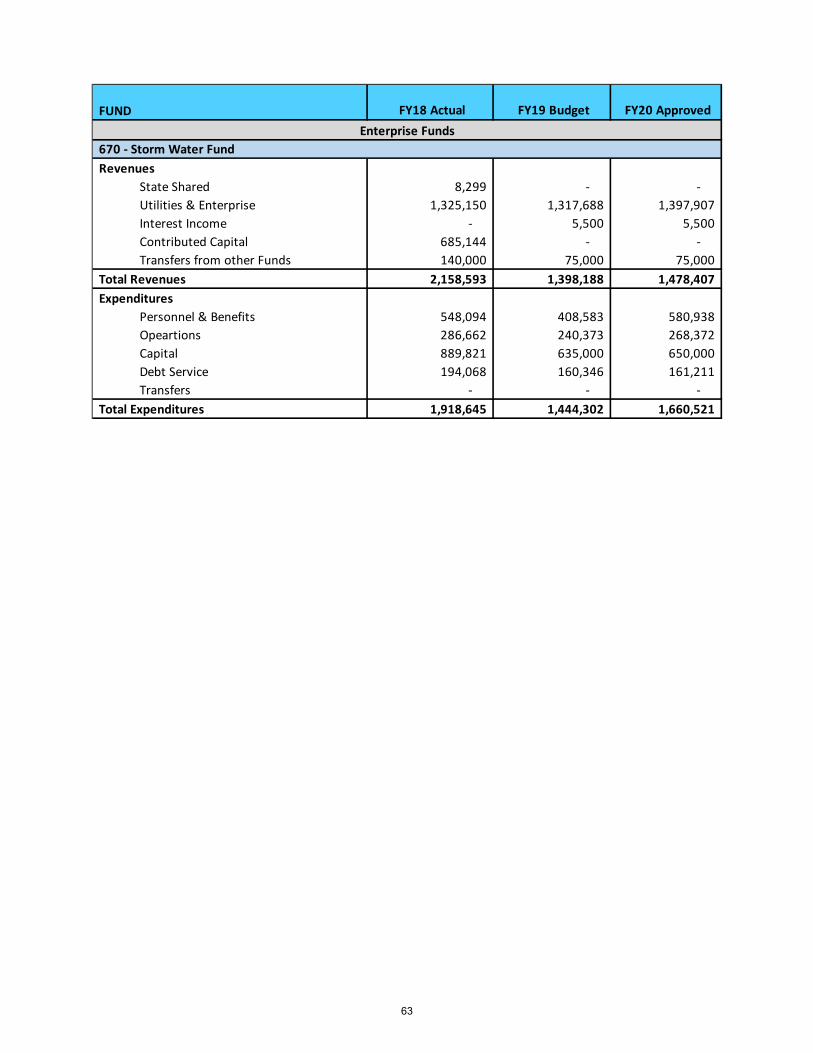
FY18 Actual FY19 Budget FY20 Approved
Revenues
State Shared 8,299 ‐ ‐
Utilities & Enterprise 1,325,150 1,317,688 1,397,907
Interest Income ‐ 5,500 5,500
Contributed Capital 685,144 ‐ ‐
Transfers from other Funds 140,000 75,000 75,000
Total Revenues 2,158,593 1,398,188 1,478,407
Expenditures
Personnel & Benefits 548,094 408,583 580,938
Opeartions 286,662 240,373 268,372
Capital 889,821 635,000 650,000
Debt Service 194,068 160,346 161,211
Transfers ‐ ‐ ‐
Total Expenditures 1,918,645 1,444,302 1,660,521
FUND
Enterprise Funds
670 ‐ Storm Water Fund
63
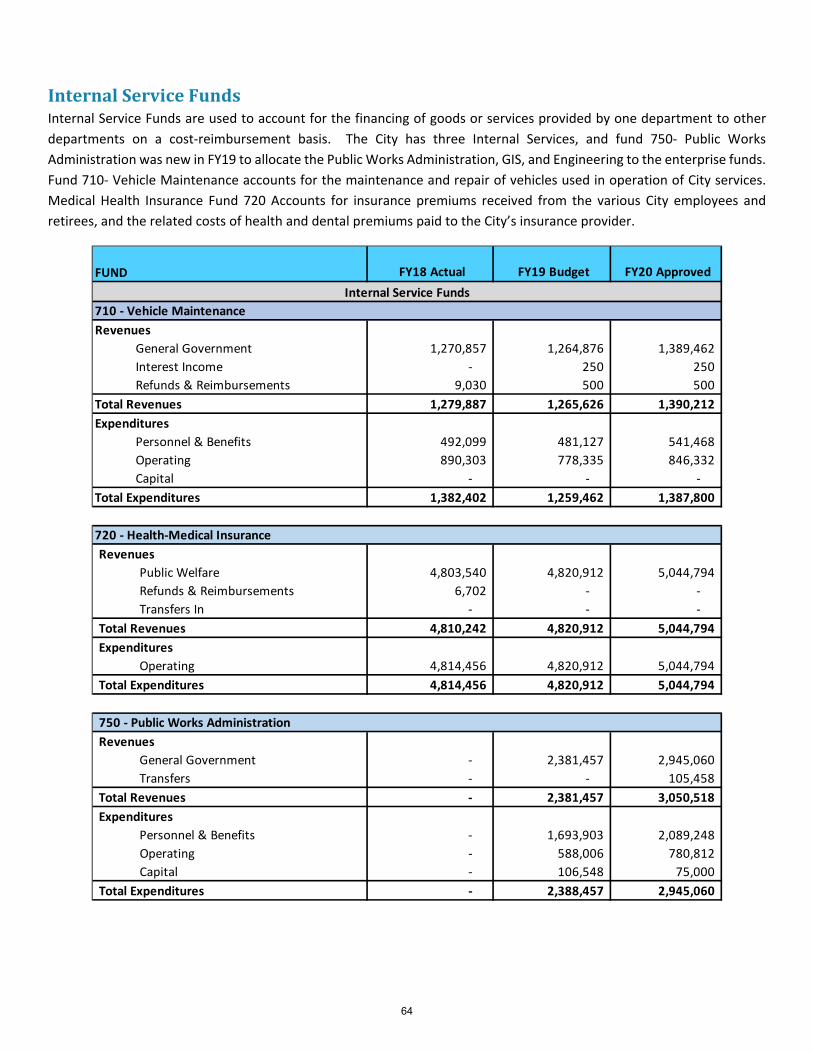
InternalServiceFundsInternal Service Funds are used to account for the financing of goods or services provided by one department to other
departments on a cost‐reimbursement basis. The City has three Internal Services, and fund 750‐ Public Works
Administration was new in FY19 to allocate the Public Works Administration, GIS, and Engineering to the enterprise funds.
Fund 710‐ Vehicle Maintenance accounts for the maintenance and repair of vehicles used in operation of City services.
Medical Health Insurance Fund 720 Accounts for insurance premiums received from the various City employees and
retirees, and the related costs of health and dental premiums paid to the City’s insurance provider.
FY18 Actual FY19 Budget FY20 Approved
Revenues
General Government 1,270,857 1,264,876 1,389,462
Interest Income ‐ 250 250
Refunds & Reimbursements 9,030 500 500
Total Revenues 1,279,887 1,265,626 1,390,212
Expenditures
Personnel & Benefits 492,099 481,127 541,468
Operating 890,303 778,335 846,332
Capital ‐ ‐ ‐
Total Expenditures 1,382,402 1,259,462 1,387,800
720 ‐ Health‐Medical Insurance
Revenues
Public Welfare 4,803,540 4,820,912 5,044,794
Refunds & Reimbursements 6,702 ‐ ‐
Transfers In ‐ ‐ ‐
Total Revenues 4,810,242 4,820,912 5,044,794
Expenditures
Operating 4,814,456 4,820,912 5,044,794
Total Expenditures 4,814,456 4,820,912 5,044,794
Revenues
General Government ‐ 2,381,457 2,945,060
Transfers ‐ ‐ 105,458
Total Revenues ‐ 2,381,457 3,050,518
Expenditures
Personnel & Benefits ‐ 1,693,903 2,089,248
Operating ‐ 588,006 780,812
Capital ‐ 106,548 75,000
Total Expenditures ‐ 2,388,457 2,945,060
FUND
Internal Service Funds
710 ‐ Vehicle Maintenance
750 ‐ Public Works Administration
64

PermanentFundsPerpetual Cemetery Care Fund 800 accounts for the maintenance fee received from the sale of City cemetery lots, which
is to be used for perpetual care. Beginning in FY19, 35% of all revenue is recorded in to the fund. The fund balance has
seen healthy growth over the last five years and is estimated to be just under $1.5 million by the end of FY20.
FY18 Actual FY19 Budget FY20 Approved
Revenues
Public Welfare 118,028 75,000 80,000
Interest Income ‐ 13,500 10,000
Total Revenues 118,028 88,500 90,000
800 ‐ Cemetery Perpetual Care
Permanent Funds
FUND
65

66
Activity/Department Details
67

Activity/Division Detail As stated in the Budget Summary, the budget is separated by activity. Within those activities are the divisions. See
below the Activities and the corresponding divisions.
Activity
General Government
City Commission
City Manager
Municipal Court
City Attorney
Finance
Human Resources
Information Technology
Community Development
Facility Management
Public Safety
Police
Fire
Building Inspection
Parking
Public Service
Public Works Admin
Streets
Storm water
Water
Water Reclamation
Facility
Solid Waste Collection & Recycling
Vehicle Maintenance
Public Welfare
Parks and Recreation
Library
Economic Development
Other
Non‐Departmental
Debt Service
Special Improvement
District
68
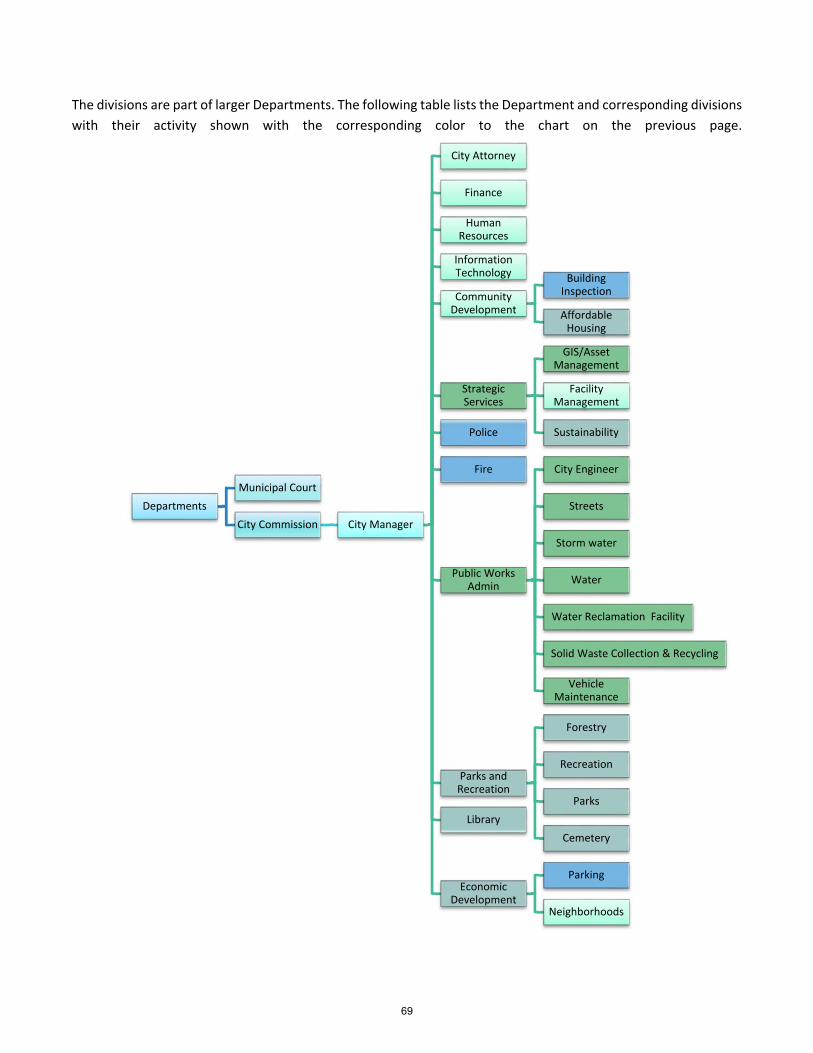
The divisions are part of larger Departments. The following table lists the Department and corresponding divisions
with their activity shown with the corresponding color to the chart on the previous page.
Departments
Municipal Court
City Commission City Manager
City Attorney
Finance
Human Resources
Information Technology
Community Development
Building Inspection
Affordable Housing
Strategic Services
GIS/Asset Management
Facility Management
SustainabilityPolice
Fire
Public Works Admin
City Engineer
Streets
Storm water
Water
Water Reclamation Facility
Solid Waste Collection & Recycling
Vehicle Maintenance
Parks and Recreation
Forestry
Recreation
Parks
Cemetery
Library
Economic Development
Parking
Neighborhoods
69

70

General Government
71

GeneralGovernmentCity Commission- The City Commission is the legislative body of city government comprised of a mayor and four
commissioners. Responsibilities of the Commission include: establishment of policies governing the operation of
the City and appointment of members to citizen advisory boards and commissions.
City Manager – The role of the City Manager is to operate at the will of the City Commission with a focus on policy,
long range planning, and strategy. The purpose of the City Manager’s office is the administration of the
City operations and is to provide overall leadership,
direction, coordination, and support for the City’s
activities.
City Clerk (City Manager)‐ The City Clerk’s Office is dedicated to preparing the proceedings of the City
Commission and preserving the City records, along
with enhancing the ability of the citizenry to
participate in local government.
Neighborhoods (Economic Development) - The Neighborhoods Program creates systems for communication and engagement with Bozeman neighbors.
City Attorney - The City Attorney is the legal advisor and primary attorney for the city and as such is responsible
for protecting the legal interests of the city and directing the legal operations of the city. The City Attorney and
legal department staff: represent the city before all courts, administrative agencies, and all city legal proceedings.
Finance - The Finance Department is charged with the overall Finance, Accounting and Treasury administration
of the City. The Department is comprised of three divisions: Administration, Accounting, and Treasury. The
Finance Department provides support to other departments for all financial matters.
Facilities Management (Strategic Services)- Facilities Management is responsible for coordinating remodeling,
renovations, and new construction projects. Contracted services include activities such as: janitorial services; snow
removal; lawn care; and building systems ventilation, mechanical controls, and building generators.
Information Technology - The Information Technology Department purpose is to manage and operate the City’s
enterprise applications, hardware, and networking services. The division provides technology services, support
to all departments across the city, and maintains daily operations of the data centers.
Human Resources - The Human Resources Department’s purpose is to support City functions by ensuring the
capability and stability of the workforce. The department supports management and employees with current
lawful information, sound recruitment practices, and benefits, protecting the employment rights of the City and
its employees.
Planning (Community Development) ‐ Plans for the growth and development of the City of Bozeman.
Responsible for Long Range Planning, Development Review, Historic Preservation, Impact Fees, Affordable
Housing and serving related Advisory Boards and Commissions.
Municipal Court- Municipal Court accounts for costs associated with the judicial branch of City government. The
Municipal Court hears cases involving city ordinances, misdemeanor cases defined by state criminal codes, may
conduct (preliminary hearings) in felony cases, and Orders of Protection.
72

City Commission Major Objectives: Work closely with the administration and other
government officials to lobby for state legislation
beneficial to cities.
Improve public facilities and the quality of
services delivered to the public in order to meet
the needs of the citizenry.
Ensure that all decisions are protective of the
health, safety and general welfare of the citizens
of this community.
Budget Allocation Funded by the General Fund, making 1% of the
funds expenses
FY19 Accomplishments Passed the Bozeman Public Safety Center Bond
initiative.
FY19 Strategic Plan Set FY19 Strategic Priorities FY20 Strategic Plan Set FY20 Strategic Priorities
Commission1%
General Fund
73
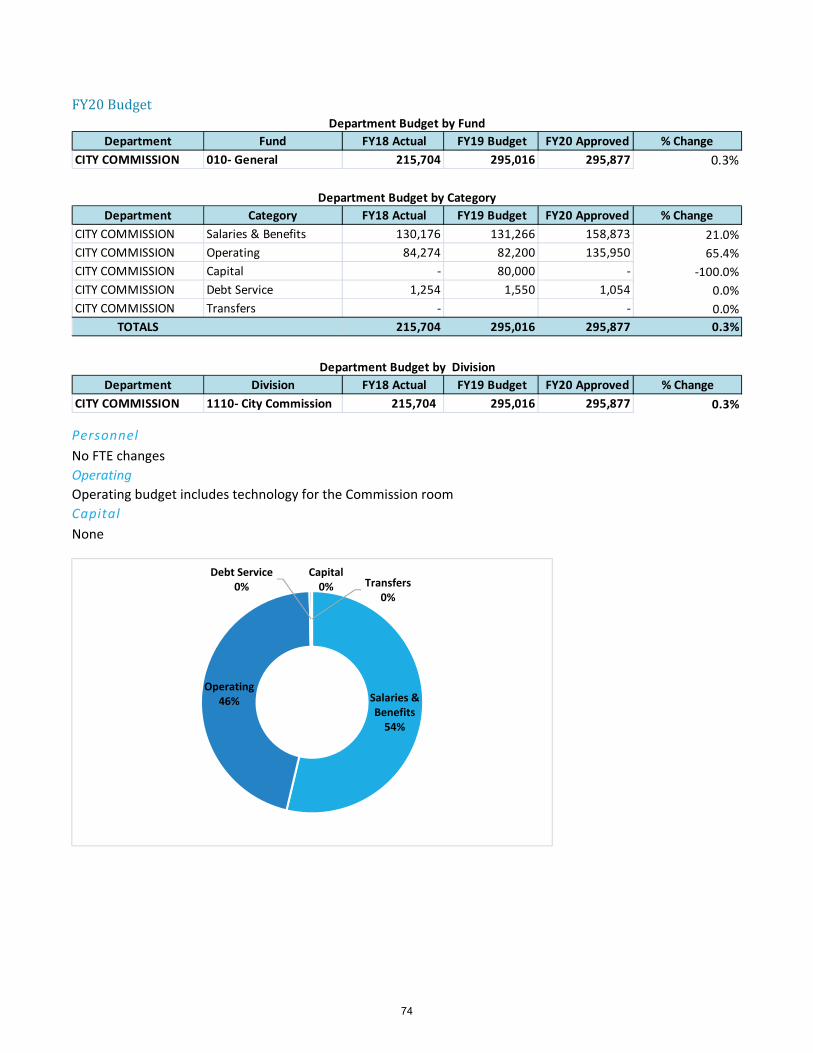
FY20 Budget
Personnel
No FTE changes
Operating
Operating budget includes technology for the Commission room
Capital
None
Department Fund FY18 Actual FY19 Budget FY20 Approved % Change
CITY COMMISSION 010‐ General 215,704 295,016 295,877 0.3%
Department Category FY18 Actual FY19 Budget FY20 Approved % Change
CITY COMMISSION Salaries & Benefits 130,176 131,266 158,873 21.0%
CITY COMMISSION Operating 84,274 82,200 135,950 65.4%
CITY COMMISSION Capital ‐ 80,000 ‐ ‐100.0%
CITY COMMISSION Debt Service 1,254 1,550 1,054 0.0%
CITY COMMISSION Transfers ‐ ‐ 0.0%
TOTALS 215,704 295,016 295,877 0.3%
Department Division FY18 Actual FY19 Budget FY20 Approved % Change
CITY COMMISSION 1110‐ City Commission 215,704 295,016 295,877 0.3%
Department Budget by Fund
Department Budget by Category
Department Budget by Division
Salaries & Benefits54%
Operating46%
Capital0%
Debt Service0% Transfers
0%
74

City Manager Major Objectives: The City Manager’s office is support of the Mission,
Values, and Goals of the City and to implement the
City’s Strategic Plan.
Budget Allocation Funded by the General Fund, making up 3% of the
fund’s expenditures.
FY19 Accomplishments Made advancements with the Strategic Plan
implementation and reporting.
Hired the Communication Coordinator position.
Education efforts for the Bozeman Public Safety
Center and its passing.
FY19 Strategic Plan There were many accomplishments across the
organization. The City Manager’s Office specifically:
Aided in the Bozeman Public Safety Center
education efforts and working towards
communication action items.
Collaborated with MSU with the EPIC‐ N program
Worked toward enhancing communication
FY20 Strategic Plan The City Manager is charged with implementing the plan. There is a focus on the five priorities and the other projects selected by the Commission. Within the City Manager’s Office there is a focus on:
A community that supports creativity, education,
and an innovative economy
A high performing organization that utilizes best
practices to anticipate future needs, and
engages the community for continuous
improvement
City Manager
3%
General Fund
75
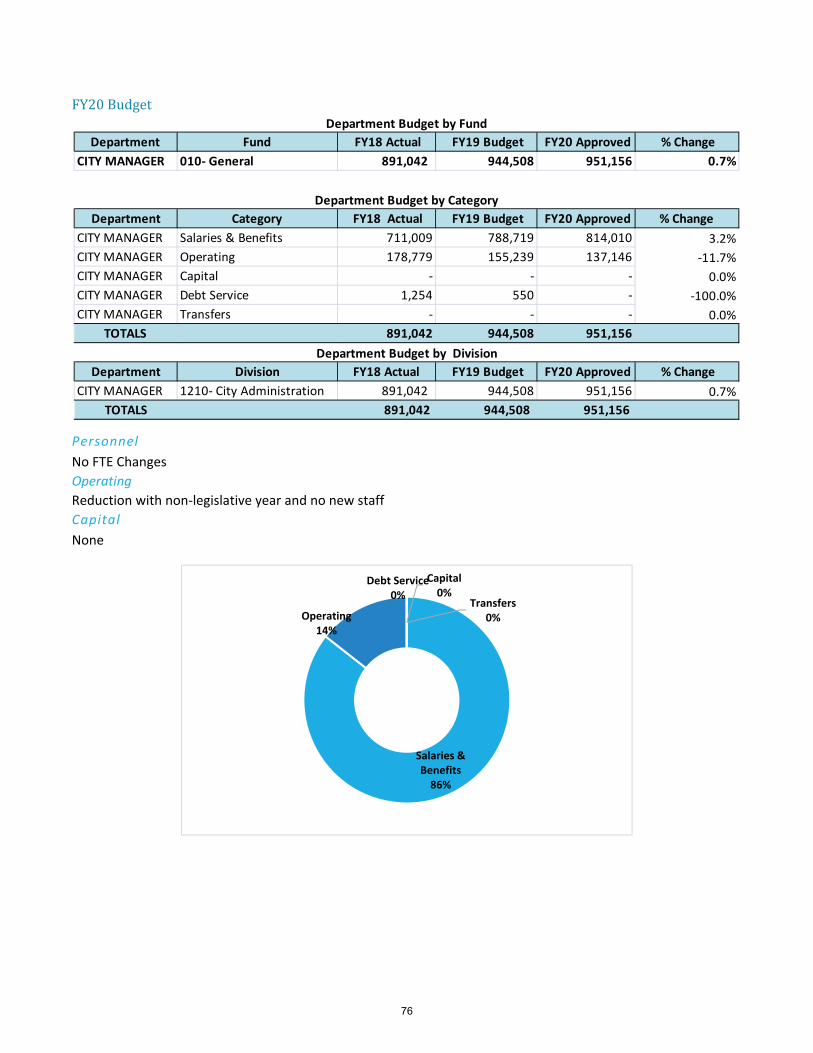
FY20 Budget
Personnel
No FTE Changes
Operating
Reduction with non‐legislative year and no new staff
Capital
None
Department Fund FY18 Actual FY19 Budget FY20 Approved % Change
CITY MANAGER 010‐ General 891,042 944,508 951,156 0.7%
Department Category FY18 Actual FY19 Budget FY20 Approved % Change
CITY MANAGER Salaries & Benefits 711,009 788,719 814,010 3.2%
CITY MANAGER Operating 178,779 155,239 137,146 ‐11.7%
CITY MANAGER Capital ‐ ‐ ‐ 0.0%
CITY MANAGER Debt Service 1,254 550 ‐ ‐100.0%
CITY MANAGER Transfers ‐ ‐ ‐ 0.0%
TOTALS 891,042 944,508 951,156
Department Division FY18 Actual FY19 Budget FY20 Approved % Change
CITY MANAGER 1210‐ City Administration 891,042 944,508 951,156 0.7%
TOTALS 891,042 944,508 951,156
Department Budget by Fund
Department Budget by Category
Department Budget by Division
Salaries & Benefits86%
Operating14%
Capital0%
Debt Service0%
Transfers0%
76

City Clerk (City Manager’s Office) Major Objectives: Support the City Commission by preparing the
proceedings and managing the public meeting
process.
Preserve the City’s records and manage
organization, accuracy, accessibility, and
completeness.
Coordinate the City’s many citizen advisory
boards, commissions, and committees.
Perform centralized administrative tasks
including bid/RFP/RFP management, records
requests, public noticing, public comment,
codification, election coordination, ethics and
financial disclosure tracking, grant approvals,
etc.
Budget Allocation Funded by the General Fund, making up less than 1%
of the fund’s expenditures.
FY19 Accomplishments Procedural improvements:
Online public notices
Alcohol licensing cheat‐sheet
Resolution/Ordinance title consistency
Board/commission/committee accuracy and consistency
FY19 Strategic Plan Strategic Plan ‐ 1.1 Outreach b.) Dramatically increase transparency and create access to all city documents Performance Measures
Performance Measures Maintain and track a high standard of citizen
engagement and trust by creating processes
to distribute all received public comment,
targeted to specialized recipients, within 1
business day to enable timely information
distribution among the commission, boards,
and staff.
Track disposition across city departments,
with a long term goal of significantly
increased disposal, document and
disposition transparency through a
formalized process, and increased facility
space.
FY20 Strategic Plan Strategic Plan ‐ 1.1 Outreach b.) Dramatically increase transparency and create access to all city documents Software that contributes:
Laserfiche – digitized and accessible documents, very few cities do what we do!
Municode – code stays up to date and centralized instead of remaining in ordinance text
Granicus – accessible video, minutes, and packet materials with search capability
Vendor TBA – closed captioned videos critical per Web Content Accessibility Guidelines
City Clerk1%
General Fund
2,908
4,615 4,558 4,500 4,600
0
2,000
4,000
6,000
FY16 FY17 FY18 FY19Approved
FY20Recommended
Documents Processed for Public Access
77

FY20 Budget
Personnel
No FTE changes
Operating
Increase in software licensing agreements
Capital
None
Division Fund FY18 Actual FY19 Budget FY20 Approved % Change
CITY CLERK 010‐ General 185,320 297,839 259,175 ‐13.0%
Division Category FY18 Actual FY19 Budget FY20 Approved % Change
CITY CLERK Salaries & Benefits 148,371 211,314 159,355 ‐24.6%
CITY CLERK Operating 28,290 84,975 98,775 16.2%
CITY CLERK Capital 7,405 ‐ ‐ 0.0%
CITY CLERK Debt Service 1,254 1,550 1,045 ‐32.6%
CITY CLERK Transfers ‐ ‐ 0.0%
TOTALS 185,320 297,839 259,175
Department Division FY18 Actual FY19 Budget FY20 Approved % Change
CITY MANAGER 1220‐City Clerk 185,320 297,839 259,175 ‐13.0%
TOTALS 185,320 297,839 259,175
Department Budget by Fund
Department Budget by Category
Department Budget by Division
Salaries & Benefits62%
Operating38%
Capital0%
Debt Service0%
78

Neighborhoods (Economic Development) Major Objectives: Advance engagement opportunities and
communication with Bozeman neighbors.
Increase the geographic representation of
neighbors by developing outreach systems.
Strengthen collaborations and partnerships with
other public agencies like MSU and stakeholders
like the business community and nonprofit
sector.
Budget Allocation Funded by the General Fund, making up less than
1% of the fund’s expenditures.
FY19 Accomplishments Advanced engagement opportunities for
problem solving and policy discussion and input
with Bozeman Neighbors. Some selected
examples:
Worked closely with new Communications
Coordinator to advance Citywide information
sharing.
Partnership with MSU to create an Off Campus
Living program to support MSU students living in
Bozeman: staff, programming, budget, etc.
FY19 Strategic Plans 1.2 Community Engagement – Broaden and
deepen engagement of the community in city
government, innovating methods for inviting
input from the community and stakeholders.
1.3 Public Agencies Collaboration – Foster
successful collaboration with other public
agencies and build on these successes. (1.3c Enhance our relationship with MSU)
Performance Measures
Monitor program activity both inside and
outside of formal neighborhood boundaries
to demonstrate the reach of community
engagement.
Track partnerships with community
stakeholders to better understand the
impact we can have when working together.
Measure and communicate projects
completed by City departments to show the
value of the services we provide.
FY20 Strategic Plan 1.2b Community Engagement Plan – Develop a
plan to increase community engagement in city
decision‐making processes
1.3c Enhance our relationship with MSU
Neighborhoods0%
General Fund
79

FY20 Budget
Personnel
No FTE changes
Operating
Slight increase for postage and outreach
Capital
None
Division Fund FY18 Actual FY19 Budget FY20 Approved % Change
NEIGHBORHOODS 010‐ General 65,961 96,791 102,462 5.9%
Division Category FY18 Actual FY19 Budget FY20 Approved % Change
NEIGHBORHOODS Salaries & Benefits 53,337 68,816 72,422 5.2%
NEIGHBORHOODS Operating 12,624 27,975 30,020 7.3%
NEIGHBORHOODS Capital ‐ ‐ ‐ 0.0%
NEIGHBORHOODS Debt Service ‐ ‐ ‐ 0.0%
NEIGHBORHOODS Transfers ‐ ‐ ‐ 0.0%
TOTALS 65,961 96,791 102,442
Department Division FY18 Actual FY19 Budget FY20 Approved % Change
Economic
Development
1260‐ Neighborhood 65,961 96,791 102,462 5.9%
TOTALS 65,961 96,791 102,462
Department Budget by Fund
Department Budget by Category
Department Budget by Division
Salaries & Benefits71%
Operating29%
Capital0%Debt Service
0%
Transfers0%
80

City Attorney Major Objectives: To be a critical part of the City’s leadership
through integration with department directors,
HPO members, the City Commission, and other
city agencies.
To enforce state laws and city ordinances
pertaining to misdemeanor offenses within the
city and to prosecute criminal cases in a timely
and efficient manner.
To direct the legal operations of the city and
serve as the city's legal counsel.
Budget Allocation Funded mainly from the General Fund, making up 4%
of the fund’s expenditures
The Department oversees the programming for the
special revenue fund 174Victim/Witness advocate.
Total funding breakdown:
FY19 Accomplishments Continuing to build our team through
professional development, training, and
coordination.
Continued effective integration into all City
departments as demonstrated by a significant
list of accomplishments
Increase in efficiency and effectiveness of the
prosecution team
FY19 Strategic Plans City Attorney’s Office plays a role in the majority of strategic plan items Performance Measures
FY20 Strategic Plan Resources are needed to participate in all aspects of strategic plan implementation.
City Attorney
4%
General Fund
010‐General Fund94%
174‐Victim Witness Advocat…
81

FY20 Budget
Personnel
One FTE added to the Department but funding is from the 100‐Planning Fund and the 750 – PW Admin Fund for
work needed specifically for those areas
Operating
Reduction in the Special revenue fund and slight increase in the General Fund
Capital
None
Department Fund FY18 Actual FY19 Budget FY20 Approved % Change
CITY ATTORNEY 010‐ General Fund 1,188,539 1,258,873 1,315,436 4.5%
CITY ATTORNEY 174‐ Victim Witness Advocate 185,000 150,000 90,000 ‐40.0%
1,373,539 1,408,873 1,405,436
Department Category FY18 Actual FY19 Budget FY20 Approved % Change
CITY ATTORNEY Salaries & Benefits 1,076,328 1,119,223 1,168,766 4.4%
CITY ATTORNEY Operating 297,211 289,650 236,650 ‐18.3%
CITY ATTORNEY Capital ‐ ‐ ‐ 0.0%
CITY ATTORNEY Debt Service ‐ ‐ ‐ 0.0%
CITY ATTORNEY Transfers ‐ ‐ ‐ 0.0%
TOTALS 1,373,539 1,408,873 1,405,416
Department Division FY18 Actual FY19 Budget FY20 Approved % Change
CITY ATTORNEY 1410‐ City Attorney 1,161,351 1,232,873 1,309,436 6.2%
CITY ATTORNEY 1430‐1446‐ Civil Litigation 26,747 25,000 5,000 ‐80.0%
CITY ATTORNEY1460‐ Criminal Prosecution ‐
General 441 1,000 1,000
0.0%
CITY ATTORNEY1462‐ Criminal Prosecution ‐
Victim/Witness 185,000 150,000 90,000
‐40.0%
TOTALS 1,373,539 1,408,873 1,405,436
Department Budget by Fund
Department Budget by Category
Department Budget by Division
Salaries & Benefits83%
Operating17%
Capital0%
Debt Service0%
Transfers0%
82

Finance Major Objectives: To assure efficient and effective management of
the public's resources by providing quality
financial services and safeguarding the City’s
Assets
To manage and account for the City's finances in
accordance with Generally Accepted Accounting
Principles, as set forth by the Governmental
Accounting Standards Board and prepare a
Comprehensive Annual Financial Report.
To prepare a comprehensive budget on an
annual basis that encompasses all funds of the
City.
Budget Allocation Funded by the General Fund, making up 3% of the
fund’s expenditures.
FY19 Accomplishments Government Finance Officers Association
Awards for the Comprehensive Annual Financial
Report and Budget Book
Rate and fee studies in many areas and funds
(Water, Wastewater, Cemetery, Parks &
Recreation and upcoming Solidwaste)
New Parking software implementation
FY19 Strategic Plans We worked towards item 7.1 b ‐Create a Culture
of Innovation by:
o Changing our CIP database system for project
tracking and plan development and now the
CIP merges into the annual budget for time
savings on many levels
o Trained on Lean Principals in an office setting,
making goals that are already in the testing
phase that will make us more efficient and
giving us several hours of time savings.
7.3 C Improve Departmental Collaboration‐ we
worked with many departments and efforts with
the CIP, and Parks & Trails District.
Performance Measures
Receive Awards for financial reporting; FY17
Comprehensive Annual Financial Report
received Government Finance Officer
Association’s certificate in Achieving
Excellence in Financial reporting and the
FY19 Budget received their Distinguished
Budget Award.
Through lean process eliminate waste, and
strive for efficiency while remaining
effective. FY19 progress $1,069 hard cost
savings per year and 768 hours of staff time
per year (one efficiency reporting change
saved 600 hours of staff time).
Review workload indicators to determine
performance measurements.
FY20 Strategic Plan The Finance Department supports the strategic plan efforts across the organization and will focus internally on:
We worked towards item 7.1 b ‐Create a Culture
of Innovation
7.3 C Improve Departmental Collaboration
Finance3%
General Fund
83

FY20 Budget
Personnel
No FTE changes. Note: Utility billing staff is budgeted under fund 750‐ PW Admin fund
Operating
Minor reductions made
Capital
None
Department Fund FY18 Actual FY19 Budget FY20 Approved % Change
FINANCE 010‐ General Fund 1,132,468 957,847 1,001,680 4.6%
Department Category FY18 Actual FY19 Budget FY20 Approved % Change
FINANCE DEPARTMENT Salaries & Benefits 917,538 756,309 805,392 6.5%
FINANCE DEPARTMENT Operating 214,930 199,538 196,288 ‐1.6%
FINANCE DEPARTMENT Capital ‐ 2,000 ‐ 0.0%
FINANCE DEPARTMENT Debt Service ‐ ‐ ‐ 0.0%
FINANCE DEPARTMENT Transfers ‐ ‐ ‐ 0.0%
TOTALS 1,132,468 957,847 1,001,680
Department Division FY18 Actual FY19 Budget FY20 Approved % Change
FINANCE DEPARTMENT 1510‐ Finance Administration 261,736 269,421 281,303 4.4%
FINANCE DEPARTMENT 1520‐ Accounting 426,852 434,114 457,303 5.3%
FINANCE DEPARTMENT 1530‐ Treasury 443,880 254,312 263,074 3.4%
TOTALS 1,132,468 957,847 1,001,680
Department Budget by Fund
Department Budget by Category
Department Budget by Division
Salaries & Benefits80%
Operating20%
Capital0%
Debt Service0%
Transfers0%
84

Facilities (Strategic Services)
Major Objectives: Provide a safe, comfortable, and professional
working environment in all city facilities.
Maintain all buildings and related equipment in
good working condition in a proactive manner
that will help extend useful life.
Maintain a proactive approach for long‐term
facility planning and project scheduling in order
to avoid costly problems of deferred
maintenance.
Implement building design, maintenance, and
operational practices resulting in energy saving
measures.
Budget Allocation Funded by the General Fund, making up 5% of the
fund’s expenditures.
FY19 Accomplishments Completed Phase I of City Works Retooling,
Implementation of Site Wide Electronic Service
Requests
Completed the Professional Building Electrical
Upgrade (Safety, Increased Asset Lifecycle)
Completion of Story Mill Community Center
Upgrade & Recreation Staff Relocation
FY19 Strategic Plans 3.1.a Public Safety
Preliminary Design Support
Department will be participating with TEEX &
MSU on Business Continuity
6.3.d Vulnerability Assessment & Resiliency
Framework
FD Structures Inventory & Adaptive Capacity
Interviews
Performance Measures
Monitor the ratio of preventative vs.
corrective vs. general maintenance for all
City facilities.
Track the initiation to completion time for
internal service requests.
Establish a Facility Condition Index (FCI) for
all City owned buildings to help prioritize
current and future needs.
FY20 Strategic Plan 6.3.d Vulnerability Assessment & Resiliency Framework • FD Structures Inventory & Adaptive Capacity Interviews
Facilities5%
General Fund
85

FY20 Budget
Personnel
No FTE Changes
Operating
Increase in service costs for
overall 6% increase
Capital
Division Fund FY18 Actual FY19 Budget FY20 Approved % Change
FACILITIES MANAGEMENT 010‐ General Fund 181,295 1,776,131 1,572,966 ‐11.4%
Division Category FY18 Actual FY19 Budget FY20 Approved % Change
FACILITIES MANAGEMENT Salaries & Benefits 287,122 378,572 356,169 ‐5.9%
FACILITIES MANAGEMENT Operating 884,773 1,110,528 1,183,297 6.6%
FACILITIES MANAGEMENT Capital 9,400 287,031 33,500 ‐88.3%
FACILITIES MANAGEMENT Debt Service ‐ ‐ 0.0%
FACILITIES MANAGEMENT Transfers ‐ ‐ 0.0%
TOTALS 1,181,295 1,776,131 1,572,966
Division Sub‐Division FY18 Actual FY19 Budget FY20 Approved % Change
FACILITIES MANAGEMENT 1810‐ City Hall 482,402 761,900 558,589 ‐26.7%
FACILITIES MANAGEMENT 1820‐ Fire Station #1 35,606 51,659 53,189 3.0%
FACILITIES MANAGEMENT 1830‐ Shop Complex 75,074 109,159 109,190 0.0%
FACILITIES MANAGEMENT 1840‐ Professional Building 164,537 320,504 292,825 ‐8.6%
FACILITIES MANAGEMENT 1850‐ Senior Center 85,663 83,465 83,465 0.0%
FACILITIES MANAGEMENT 1860‐ Library 281,705 368,670 383,489 4.0%
FACILITIES MANAGEMENT 1870‐ Fire Station #2 16,458 21,535 22,945 6.5%
FACILITIES MANAGEMENT 1880‐ Fire Station #3 39,850 59,239 69,274 16.9%
TOTALS 1,181,295 1,776,131 1,572,966
Department Budget by Fund
Department Budget by Category
Department Budget by Division
Salaries & Benefits22%
Operating76%
Capital2%
Debt Service0%
Transfers0%
Fund ‐ Division Project #Project Name Amount
General Fund‐ Facilities GF274 CITY HALL BOZ CREEK IMPROVEMENT 33,500
86

Information Technology Major Objectives: Support all technology related
hardware/software for the city.
Maintain antivirus and other security related
components to keep City data safe.
Design and support systems that provide
continuity of operations in the event of a system
failure.
Support Strategic plan objectives as they pertain
to City Technology and communications.
Budget Allocation Funded by the General Fund, making up 4% of the
fund’s expenditures.
FY19 Accomplishments New SAN deployed and configured for
replication
Redundant Internet Connectivity setup
Zuercher implemented on PD/Fire equipment
FY19 Strategic Plans Department involved in 22 items
Communications Plan‐Push Notifications‐1.1a
Transparency and document access‐1.1b
PD and FD Technology‐3.1d
Public Safety Center‐3.1a
Performance Measures Monitor response time related to help desk
calls to ensure adequate level of service.
Monitor the percentage of total devices
deployed compared to the total devices
scheduled for deployment to gauge
efficiency in deployments.
FY20 Strategic Plan City Communication plan and protocol 1.1a
$10,000 Granicus Gov Delivery Communications
Platform‐Push Notifications.
IT4%
General Fund
60.6
62.5
64.0
57.0
52.0
54.0
56.0
58.0
60.0
62.0
64.0
66.0
FY16 Actual FY17 Actual FY18 Actual FY19 Approved
Number of City Staff per Full Time Employee
87

FY20 Budget
Personnel
No FTE change
Operating
Increase due to software maintenance contracts
Capital
Department Fund FY18 Actual FY19 Budget FY20 Approved % Change
INFORMATION TECHNOLOGY 010‐ General Fund 986,250 1,331,185 1,336,193 0.4%
Department Category FY18 Actual FY19 Budget FY20 Approved % Change
INFORMATION TECHNOLOGY Salaries & Benefits 606,199 712,461 740,212 3.9%
INFORMATION TECHNOLOGY Operating 264,529 392,538 418,981 6.7%
INFORMATION TECHNOLOGY Capital 115,522 226,186 177,000 ‐21.7%
INFORMATION TECHNOLOGY Debt Service ‐ ‐ ‐ 0.0%
INFORMATION TECHNOLOGY Transfers ‐ ‐ ‐ 0.0%
TOTALS 986,250 1,331,185 1,336,193
Department Division FY18 Actual FY19 Budget FY20 Approved % Change
INFORMATION TECHNOLOGY 1910‐ Information Technology 986,250 1,331,185 1,336,193 0.4%
Department Budget by Fund
Department Budget by Category
Department Budget by Division
Fund ‐ Division Project #Project Name Amount
General Fund‐ Cemetery GF268 SW MT VETERAN'S CEMETERY 45,000
General Fund‐IT GF062 PERSONAL COMPUTER (PC) RE 50,000
General Fund‐IT GF080 CITY‐WIDE SWITCHES&ROUTRS 50,000
General Fund‐IT GF265 SERVER REPLACEMENT GF 20,000
General Fund‐IT GF289 SERVER FARM SOFTWARE UPGRADES 35,000
General Fund‐IT GF310 APC REPLACE FOR DATA CEN 12,000
General Fund‐IT GF312 ISCI FLASH UPGRADE CHALL 10,000
177,000
Salaries & Benefits56%
Operating31%
Capital13%
Debt Service0%
Transfers0%
88

Human Resources Major Objectives: Process the City’s payroll and process all related
payment and tax filings
Manage the City’s employee benefits
Monitor compliance with labor contracts,
employee handbook, laws, rules, and regulations
Support Strategic Plan objectives as they pertain
to the City’s workforce
Budget Allocation Funded by the General Fund, making up 2% of the
fund’s expenditures.
FY19 Accomplishments Recruitment‐ filled 136 positions
Payroll‐ 550 W‐2s issued, 480 1095s issued
Implemented Advanced Scheduling with the
Police Department
FY19 Strategic Plans 7.2a Be a “Best in Class” Employer We are
engaging in pay studies for non‐rep and open
contracts to determine market pay for our
positions. We received a Wellness Program
study of our comparators and found to offer
equivalent or better Wellness Program.
7.2b Develop and Implement an Innovative
Onboarding Program for New Employees ‐ With
our new benefits portal.
7.3a Implement Department Staffing Plans ‐ This
has been our second year utilizing Staffing Plans.
7.3d Set Diversity Goals In the past year we
focused recruitment efforts on diversity by
advertising specifically with veteran, women,
and minority groups in addition to regular
advertising
Performance Measures
Calculate the turnover rate to better
understand the costs related to staff
retention.
Use selection ratios to understand the
success of the recruitment program.
Use the recruitment cycle time (job posting
to final offer) to measure the timeliness of
the recruitment program
FY20 Strategic Plan Increase training budget to assist with achieving
“Best in Class” Employer status with professional
development offered to department employees.
(7.2a)
Increase training budget to provide leadership
development and other trainings for employees
to be considered “well‐trained” and enhance the
attractiveness of the City as a place to work.
(7.2a)
Continue to work to hire an HR Generalist in
order to help us achieve Strategic Plan goals such
as onboarding, employee recognition, and
training to strive for employee excellence. This
position requires additional office space to be
configured as well as training. (7.2b,c)
Maintain diversity advertisement budget for
focused effort on achieving diversity goals. (7.2d)
HR2%
General Fund
89

FY20 Budget
Personnel
No FTE change
Operating
Increase in training to aid in efforts for Strategic Vision 7‐ High performing organization
Capital
None
Department Fund FY18 Actual FY19 Budget FY20 Approved % Change
HUMAN RESOURCES 010‐ General Fund 395,523 540,718 568,710 5.2%
Department Category FY18 Actual FY19 Budget FY20 Approved % Change
HUMAN RESOURCES Salaries & Benefits 333,344 413,518 467,510 13.1%
HUMAN RESOURCES Operating 57,929 97,200 101,200 4.1%
HUMAN RESOURCES Capital 4,250 30,000 0.0%
HUMAN RESOURCES Debt Service ‐ ‐ 0.0%
HUMAN RESOURCES Transfers ‐ ‐ 0.0%
TOTALS 395,523 540,718 568,710 5.2%
Department Division FY18 Actual FY19 Budget FY20 Approved % Change
HUMAN RESOURCES2010‐ Human
Resources 395,523 540,718 568,710 5.2%
Department Budget by Fund
Department Budget by Category
Department Budget by Division
Salaries & Benefits82%
Operating18%
Debt Service0%
Transfers0%
90

Planning (Community Development) Major Objectives: Continually working toward making the planning
process accessible, understandable and efficient
for citizens
Evaluate and make recommendations to the
Planning Board, City Commission and the
Director of Public Works on all annexations and
subdivisions of land
Review business licenses for compliance with the
city’s zoning ordinance
Budget Allocation Planning Fund – Special Revenue Fund
FY19 Accomplishments City Projects lead by Planning Division
Community Plan Updates
NCOD Review
Downtown Bozeman Improvement Plan
FY19 Strategic Plans Increasing Outreach & Community Engagement
by working with Neighborhoods to coordinate
public events to provide general public access
(Engaged Community | Objective Items 1.1 &
1.2)
Promote informed conversation on growth
through the Community Plan (Growth Policy)Update process by offering numerous
community involvement opportunities
throughout the process. (Well Planned City |
Objective Item 4.1a)
Continuously adding data and information
available to the public through GIS tracking tools
(Well Planned City | Objective Item 4.1c)
Update the Downtown Plan (Well Planned City |
Objective 4.4a)
Performance Measures Track the median compliance time from
complaint to closure for zoning code compliance complaints to show the effectiveness of the code compliance program and gauge our public education communication efforts.
Measure the median review time for projects and plans by type to both identify where additional efficiencies can be made internally as well as infer public and design professionals understanding of the planning process.
Calculate the median number of work days to review a building permit for zoning compliance to identify planning’s influence on the total building permit review time.
FY20 Strategic Plan Community Engagement Plan – Increase
community engagement in City decision making
process
(Objective 1.2)
Public Agencies Collaboration – Foster successful
collaboration with other public agencies and
build on these successes (Objective 1.3e)
Update Historic Preservation Guidelines –
Update the NCOD Guidelines and promote
continued investment in the city’s inventory of
historic structures relative to ongoing infill and
redevelopment (Objective 4.2d)
‐
500,000
1,000,000
1,500,000
2,000,000
FY18 Actual FY19 Budget FY20 Approved
100‐Community Development Fund
91

FY20 Budget
Personnel
Addition, of a Planner II and funding half of a City Attorney position
Operating
Consulting services increase with the next round NCOD and public outreach funding
Capital
Department Fund FY18 Actual FY19 Budget FY20 Approved % Change
COMMUNITY DEVELOPMENT100‐Community Development
Fund 1,219,680 1,661,194 1,873,348 12.8%
Department Category FY18 Actual FY19 Budget FY20 Approved % Change
COMMUNITY DEVELOPMENT Salaries & Benefits 881,772 990,695 1,416,573 43.0%
COMMUNITY DEVELOPMENT Operating 337,908 369,281 421,775 14.2%
COMMUNITY DEVELOPMENT Capital ‐ 301,218 35,000 ‐88.4%
COMMUNITY DEVELOPMENT Debt Service ‐ ‐ ‐ 0.0%
COMMUNITY DEVELOPMENT Transfers ‐ ‐ ‐ 0.0%
TOTALS 1,219,680 1,661,194 1,873,348 53.6%
Department Division FY18 Actual FY19 Budget FY20 Approved % Change
COMMUNITY DEVELOPMENT 1610‐ Planning Operations 452,402 798,553 793,670 ‐0.6%
COMMUNITY DEVELOPMENT 1620‐ Development Review 441,268 513,353 633,524 23.4%
COMMUNITY DEVELOPMENT 1630‐ Long‐Range Planning 320,555 349,288 446,154 27.7%
TOTALS 1,214,225 1,661,194 1,873,348
Department Budget by Category
Department Budget by Fund
Department Budget by Division
Fund Fund ‐ Division Project # Project Name Amount
100 Planning CD06 PLANNING VEHICLE REPLACEMENT REQUEST 35,000
Salaries & Benefits76%
Operating22%
Capital2% Debt Service
0%
Transfers0%
92

Municipal Court Major Objectives: Continue providing an up‐to‐date court docket.
Plan an efficient operating space for the new
BPSC.
Begin planning for a smooth transition to the
New Bozeman Public Safety Center.
Maintain an efficient collection system
concentrating on CitepayUSA.com, Municipal
Services Bureau, and collection of fines and
restitution.
Budget Allocation Funded mainly by General Fund
The Veteran Court is provided for by a grant and
accounted for in the Special revenue fund 178‐
Veteran Treatment Grant.
Performance Measures
Municipal Court3%
General Fund
General Fund86%
Veteran Treatment
Grant Fund14%
7,0575,947 6,221 6,500 6,800
7,672
6,4367,046 7,200 7,500
0
2,000
4,000
6,000
8,000
10,000
FY16 FY17 FY18 FY19Approved
FY20Recommended
Citations
Officer Citations Total Citations
$114,060
$137,702 $125,057 $130,000 $132,500
$‐
$50,000
$100,000
$150,000
Restitution Collected
109
7 7 7
0
2
4
6
8
10
12
FY16 FY17 FY18 FY19Approved
FY20Recommended
Number of Appeals
93

FY20 Budget
Personnel
FTE increase of .10 for part time judge
Operating
Increase in grant funding operations
Capital
None
Department Fund FY18 Actual FY19 Budget FY20 Approved % Change
MUNICIPAL COURT 010‐ General Fund 829,465 867,868 908,059 4.6%
MUNICIPAL COURT 178‐ Veteran Court 40,028 87,156 152,346 74.8%
TOTALS 869,493 955,024 1,060,405
Department Category FY18 Actual FY19 Budget FY20 Approved % Change
MUNICIPAL COURT Salaries & Benefits 689,743 697,956 776,463 11.2%
MUNICIPAL COURT Operating 170,573 257,068 281,682 9.6%
MUNICIPAL COURT Capital 8,235 ‐ ‐
MUNICIPAL COURT Debt Service 942 ‐ 1,900 0.0%
MUNICIPAL COURT Transfers ‐ ‐ ‐ 0.0%
TOTALS 869,493 955,024 1,060,045 11.0%
Department Division FY18 Actual FY19 Budget FY20 Approved % Change
MUNICIPAL COURT 1310‐Municipal Court 869,493 955,024 1,060,045 11.0%
Department Budget by Category
Department Budget by Fund
Department Budget by Division
Salaries & Benefits73%
Operating27%
Capital0%
Debt Service0%
Transfers0%
94

Public Safety
95
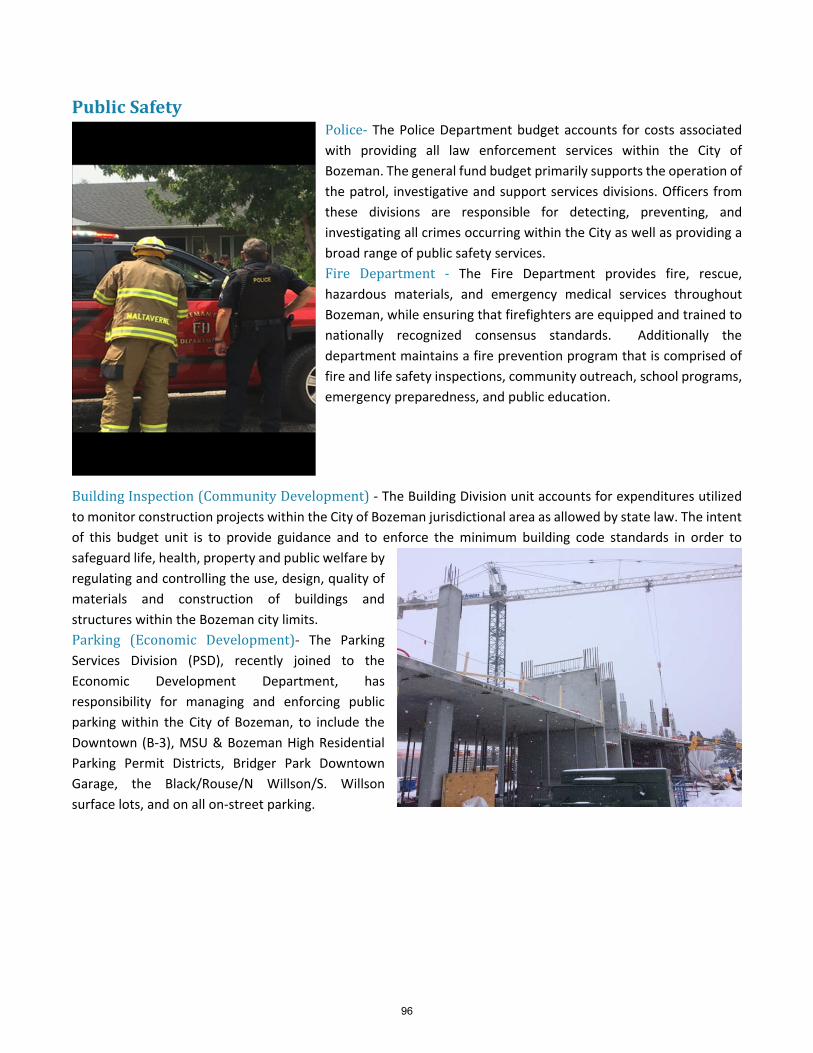
PublicSafetyPolice- The Police Department budget accounts for costs associated
with providing all law enforcement services within the City of
Bozeman. The general fund budget primarily supports the operation of
the patrol, investigative and support services divisions. Officers from
these divisions are responsible for detecting, preventing, and
investigating all crimes occurring within the City as well as providing a
broad range of public safety services.
Fire Department - The Fire Department provides fire, rescue,
hazardous materials, and emergency medical services throughout
Bozeman, while ensuring that firefighters are equipped and trained to
nationally recognized consensus standards. Additionally the
department maintains a fire prevention program that is comprised of
fire and life safety inspections, community outreach, school programs,
emergency preparedness, and public education.
Building Inspection (Community Development) ‐ The Building Division unit accounts for expenditures utilized to monitor construction projects within the City of Bozeman jurisdictional area as allowed by state law. The intent
of this budget unit is to provide guidance and to enforce the minimum building code standards in order to
safeguard life, health, property and public welfare by
regulating and controlling the use, design, quality of
materials and construction of buildings and
structures within the Bozeman city limits.
Parking (Economic Development)‐ The Parking Services Division (PSD), recently joined to the
Economic Development Department, has
responsibility for managing and enforcing public
parking within the City of Bozeman, to include the
Downtown (B‐3), MSU & Bozeman High Residential
Parking Permit Districts, Bridger Park Downtown
Garage, the Black/Rouse/N Willson/S. Willson
surface lots, and on all on‐street parking.
96

Police Major Objectives: Detect, investigate, and proactively deter
criminal activity and apprehend and hold
criminal offenders accountable.
Provide assistance to those who cannot care for
themselves or those in danger of physical harm.
Develop positive programs, in partnership with
the members of our community, to address
public safety issues through community
engagement and outreach.
Budget Allocation Funded mainly by the General Fund
Additional programs are funded by special revenue
funds. FY19 Accomplishments Continued to maximize efficiencies with non‐
sworn positions to leverage existing sworn
officer staffing for patrolling and emergency
response.
Commenced implementation of new Records
Management System replacing 20‐year‐old
legacy system.
FY19 Strategic Plans 3.1a, Develop a Criminal Justice Facility Plan:
With partners, developed a plan with Fire, Courts
and Prosecution for the Bozeman Public Safety
Center
3.1d Update Public Safety Technology Systems‐
in partnership with Gallatin County updated RMS
and CAD for public safety services
Performance Measures
FY20 Strategic Plan 3.1.d Update Public Safety Technology Systems‐
Continued implementation of records
management system.
3.2.c Develop a City/County Social Service
Network. Work with Gallatin County and other
community partners on a comprehensive
strategy for addressing mental health, substance
abuse and addiction and housing challenges.
Police26%
General Fund
50,359
47,136
50,548 51,000
51,750
44,000
45,000
46,000
47,000
48,000
49,000
50,000
51,000
52,000
53,000
FY16 FY17 FY18 FY19Approved
FY20Recommended
Total Calls for Service
95.2286.01
71.880.0 82.0
0
20
40
60
80
100
120
140
160
FY16 FY17 FY18 FY19Approved
FY20Recommended
Crime Rate per 1,000 Citizens
Average Crime Rate for Comparable MT Communities
691
673
650
625
580
600
620
640
660
680
700
FY17 FY18 FY19Approved
FY20Recommended
Mental Health‐Related Calls for Service (officer hours)
97

FY20 Budget
Personnel
One FTE added ‐ Police Officer
Operating
Additional $44,000 for Community
Therapist Program and the return of
OVW grant funding
Capital
The capital items are as approved
capital plan:
Department Fund FY18 Actual FY19 Budget FY20 Approved % Change
POLICE 010‐ General Fund 8,624,258 8,541,786 8,994,621 5.3%
POLICE 125‐ Drug Forfeiture 270,686 231,210 242,052 4.7%
POLICE 138‐ Law & Justice Ctr. Prepaid Rent 19,125 19,125 19,125 0.0%
POLICE 139‐ Police Special Revenue 35,406 ‐ 40,000 100.0%
POLICE 140‐ Police Domestic Violence 44,989 ‐ 187,040 100.0%
TOTALS 8,994,464 8,792,121 9,482,838
Department Category FY18 Actual FY19 Budget FY20 Approved % Change
POLICE Salaries & Benefits 7,926,143 7,534,344 7,866,925 4.4%
POLICE Operating 921,845 870,777 1,157,913 33.0%
POLICE Capital 114,636 387,000 458,000 18.3%
POLICE Debt Service ‐ ‐ ‐ 0.0%
POLICE Transfers ‐ ‐ ‐ 0.0%
TOTALS 8,962,624 8,792,121 9,482,838 7.9%
Department Division FY18 Actual FY19 Budget FY20 Approved % Change
POLICE 3010‐ Police Operations 6,779,742 6,250,961 7,237,004 15.8%
POLICE 3020‐ Crime Control & Investigations 1,726,254 2,069,015 1,743,165 ‐15.7%
POLICE 3040‐ Drug Forfeiture 270,686 231,210 242,052 4.7%
POLICE 3070‐ Animal Control 182,436 240,935 260,617 8.2%
TOTALS 8,959,118 8,792,121 9,482,838
Department Budget by Category
Department Budget by Fund
Department Budget by Division
Fund ‐ DivisionProject
# Project Name Amount
General Fund‐ Police GF053 PATROL CAR & EQUIP RPLCMT 118,000
General Fund‐ Police GF166 COUNTY RADIO LEASE 295,000
General Fund‐ Police GF292 MOBILE DATA EQUIP 30,000
General Fund‐ Police GF293 NON‐PATROL CAR NEW VEHICLES 15,000
458,000
Salaries & Benefits83%
Operating12%
Capital5%
Debt Service0%Transfers
0%
98

Fire Major Objectives: Continued Implementation of Fire Master Plan
Continued pursuit of Fire Department
Accreditation
Bozeman Public Safety Center
Budget Allocation Fire is supported operationally through the General
Fund.
The Fire Department is supported also by special
revenue funds with one being for its capital
replacements;
FY19 Accomplishments Bozeman Public Safety Center and Fire
Department Strategic Plan
Training Program – Blue Card IMS, Fire Instructor
I and Fire Officer I, 14 Safety Officers
FY19 Strategic Plans 1.3.c Enhance our relationship with Montana
State University
3.1.b Improve emergency preparedness plans
3.1.c Implement fire station location plan
3.1.d Update public safety technology systems
3.2.b Perform a community risk assessment
Performance Measures Calculate the emergency call response
times (call processing, turnout, and
response).
FY20 Strategic Plan 1.3.c Enhance our relationship with Montana
State University ‐ COOP / Fire Station 2
3.1.b Improve Emergency Preparedness Plans ‐
COOP / Community Program
3.1.c Implement Fire Station Location Plan ‐ BPSC
/ Fire Station 2
3.1.d Update Public Safety Technology Systems ‐
Fire Station Alerting, FY‐19 carry over project
and continue work with CAD system and 911
3.2.b Perform a Community Risk Assessment ‐
Finish work started in FY‐19
Fire16%
General Fund
010‐General Fund83%
113‐ Fire Impact Fees0%
183‐ Fire Department Special Revenue…
187‐ Fire Capital & Equipment
Replacement…
5,567
6,264 5,798 6,000 6,088
43194696 4589 4800 4700
806
1682 1642 1700 1724
0
1,000
2,000
3,000
4,000
5,000
6,000
7,000
FY16 FY17 FY18 FY19Approved
FY20Recommended
Incident Numbers
Number of Apparatus Used For All Runs
Total Calls
Number of Overlapping Incidents
214
326357
240 240
0
100
200
300
400
FY16 FY17 FY18 FY19Approved
FY20Recommended
Hours
Training Hours Per Fire Fighter
National Standard (240 hours)
99

FY20 Budget
Personnel
Addition of three Fire Fighters, per contract to make
a shift change
Operating
Operational increases due inflation and increases in
vehicle maintenance charges
Capital
Funded by special revenue fund.
Department Fund FY18 Actual FY19 Budget FY20 Approved % Change
FIRE 010‐ General Fund 6,449,144 5,327,652 5,500,325 0.0%
FIRE 113‐ Fire Impact Fees 44,984 ‐ ‐ 0.0%
FIRE183‐ Fire Department Special
Revenue 89,252 40,000 50,000 0.0%
FIRE187‐ Fire Capital & Equipment
Replacement 601,041 606,000 1,068,000 100.0%
TOTALS 7,184,421 5,973,652 6,618,325
Department Category FY18 Actual FY19 Budget FY20 Approved % Change
FIRE Salaries & Benefits 5,849,654 4,924,814 5,064,356 2.8%
FIRE Operating 751,630 442,838 485,969 9.7%
FIRE Capital 583,137 606,000 468,000 ‐22.8%
FIRE Debt Service ‐ ‐ ‐ 0.0%
FIRE Transfers ‐ ‐ 600,000 0.0%
TOTALS 7,184,421 5,973,652 6,618,325 10.8%
Department Division FY18 Actual FY19 Budget FY20 Approved % Change
FIRE 3110‐ Fire Administration 535,770 517,893 411,028 ‐20.6%
FIRE 3120‐ Fire Operations 6,586,364 5,369,959 6,119,897 14.0%
FIRE 3130‐ Operational Readiness 43,761 47,000 48,000 2.1%
FIRE 3140‐ Fire Prevention 14,850 25,400 26,000 2.4%
FIRE 3160‐ Hazardous Materials 3,676 13,400 13,400 0.0%
TOTALS 7,184,421 5,973,652 6,618,325
Department Budget by Fund
Department Budget by Category
Department Budget by Division
Salaries & Benefits77%
Operating7%
Capital7%
Debt Service0%
Transfers9%
Fund Fund ‐ Division Project # Project Name Amount
187 Fire Capital FE06 Radio Replacement Program 250,000
187 Fire Capital FE12 Personal Protective Equip 38,000
187 Fire Capital FE17 Wildlands Apparatus 55,000
187 Fire Capital FE18 Light Duty Vehicles 80,000
187 Fire Capital FE19 Utility Vehicle 45,000
468,000 187 Fire Capital & Equipment Replacement Total
100

Building Inspection (Community Development) Major Objectives: Recruit staff to provide an adequate level of
qualified staff to handle our current and
projected workload.
Build a diverse workforce in both experience and
education without sacrificing our work quality,
service and minimum performance standards.
Revaluate and adjust the Division operational
budget to eliminate any unnecessary spending
but ensure funding for all of the
necessary/required Division expenditures.
Budget Allocation Department is funded in a single fund, Building
Inspection Fund – Special Revenue Fund.
FY19 Accomplishments Continued working to improve coordination and
communications between the Building Division,
other city departments and our customers.
Provided expert technical advice and
consultation for our customers.
Continued working with other city departments
to simplify the overall permitting process.
FY19 Strategic Plans Continue to provide educational opportunities
for our customers and our staff.
Maintain the Building Division web page to keep
it functioning as a valuable tool and information
source for our customers.
Performance Measures
FY20 Strategic Plan Continue to make staff time available allowing
customers to make appointments with Plans
Examiners and the Building Official to review
plans and code requirements.
Continue with our Winter Training Program to
provide building code based classes for our staff
and our customers.
‐
500,000
1,000,000
1,500,000
2,000,000
2,500,000
3,000,000
FY18 Actual FY19 Budget FY20 Approved
115‐ Building Inspection Fund $200
$101 $176
$85
$170
$164
$130
$132
$67
$160
$0
$50
$100
$150
$200
$250
$300
$350
$400
Millions of Dollars
Building Permit Valuation
Commercial Permits Valuation
Residential Permits Valuation
661
221372
656
350
270
370
407
135
300
0
200
400
600
800
1,000
FY16 FY17 FY18 FY19Approved
FY20Recommended
Residential Permits
Multi‐Unit Single Family
101

FY20 Budget
Personnel
No changes in FTE
Operating
Increase due to overhead charges from administrative functions
Capital
No capital items for Fy20 and none currently in schedule in the CIP FY20‐FY24
Department Fund FY18 Actual FY19 Budget FY20 Approved % Change
BUILDING
INSPECTION115‐ Building Inspection Fund 2,118,822 2,660,416 2,668,026 0.3%
Department Category FY18 Actual FY19 Budget FY20 Approved % Change
BUILDING INSPECTION Salaries & Benefits 1,341,328 1,702,127 1,880,081 10.5%
BUILDING INSPECTION Operating 777,494 706,608 787,945 11.5%
BUILDING INSPECTION Capital ‐ 251,681 ‐ ‐100.0%
TOTALS 2,118,822 2,660,416 2,668,026 0.3%
Department Division FY18 Actual FY19 Budget FY20 Approved % Change
BUILDING INSPECTION Buidling Inspection 2,118,822 2,660,416 2,668,026 0.3%
Department Budget by Category
Department Budget by Fund
Department Budget by Division
Salaries & Benefits70%
Operating30%
Capital0%
102

Parking (Economic Development) Major Objectives: Regulate the use of on‐street and off‐street
public parking to the best use of our citizens
through equitable enforcement and
management practices.
Operate the Parking Services Division in an
effective and fiscally sustainable manner.
Facilitate a prosperous local economic
environment through the provision of safe,
convenient, available, and cost‐appropriate
public parking resources.
Budget Allocation Parking Fund‐ Enterprise fund
FY19 Accomplishments Implementation of industry‐best parking
technology, including fixed and mobile license‐
plate‐recognition technology, digital customer
parking portal, and new parking data platform.
Legislative adoption of Ordinance # 2013
(12/2018) updating and improving parking
regulations within the Bozeman Municipal Code, Significant progress toward satisfaction of the
2016 Strategic Parking Management Plan, to include creation of digital parking inventory (by ‘blockface’) of the Downtown, new brand‐specific parking signage, renaming all public parking lots, implementation of best practices for management and enforcement.
FY19 Strategic Plans 4.2 (c) Parking Management by District
The Parking Services Division, in collaboration with Economic Development Department, Neighborhoods, and Bozeman Parking Commission continues to pursue satisfaction of the 2016 Strategic Parking Management
Performance Measures Calculate the percent of downtown land
area devoted to off‐street parking, to
demonstrate a flat or declining trend over
time (i.e. more land available for other
uses).
Measure the effectiveness of on‐street
parking management by demonstrating
that, over time, an increasing percentage of
downtown block faces have occupancy
rates within, but not exceeding, the target
range of 75‐85%.
Measure fiscal health of the public parking
management system by tracking, over time,
a ratio of total revenue per paid public
parking space to total cost per paid public
parking space.
FY20 Strategic Plan 1.4 Business and Institutional Partnerships ‐
Explore opportunities for partnerships with key
business groups and non‐profit organizations.
4.2 High Quality Urban Approach ‐ Parking
Management by District ‐ Develop a
comprehensive, integrated approach to parking
management for the downtown, midtown,
university, and other districts. Consider a range
of solutions including both on‐street parking and
parking garages.
4.3 Strategic Infrastructure Choices ‐ Prioritize
long‐term investment and maintenance for
existing and new infrastructure.
4.4 Vibrant Downtown, Districts & Centers ‐
Promote a healthy, vibrant Downtown,
Midtown, and other commercial districts and
neighborhood centers – including higher
densities and intensification of use in these key
areas.
‐
500,000
1,000,000
1,500,000
FY18 Actual FY19 Budget FY20 Approved
650‐ Parking Enterprise Fund
103

FY20 Budget
Personnel
No FTE added
Operating
Increase in costs, such as DMV fees, postage and roof snow removal
Capital
Department Fund FY18 Actual FY19 Budget FY20 Approved % Change
PARKING 650‐ Parking Enterprise Fund 1,293,116 859,371 1,082,669 26.0%
Department Category FY18 Actual FY19 Budget FY20 Approved % Change
PARKING Salaries & Benefits 389,115 353,632 426,764 20.7%
PARKING Operating 744,665 393,708 425,905 8.2%
PARKING Capital 159,336 112,031 230,000 105.3%
PARKING Debt Service ‐ ‐ ‐ 0.0%
PARKING Transfers ‐ ‐ ‐ 0.0%
TOTALS 1,293,116 859,371 1,082,669
Department Division FY18 Actual FY19 Budget FY20 Approved % Change
PARKING 3310‐ Parking Administration 455,340 356,839 326,950 ‐8.4%
PARKING 3320‐ Parking Operations/Enforcement 310,341 284,727 380,283 33.6%
PARKING 3330‐ Parking Garage Operations 527,435 217,805 375,436 72.4%
TOTALS 1,293,116 859,371 1,082,669
Department Budget by Category
Department Budget by Fund
Department Budget by Division
Fund Fund ‐ Division Project # Project Name Amount
650 ParkingP004
SURFACE PARKING LOT HARDWARE & SOFTWARE
SYSTEMS 15,000
650 Parking P020 PARKING VEHICLE LEASES 45,000
650 Parking P023 PARKING TECHNOLOGY PHASE II 150,000
650 Parking NEW IVR ‐ Voice message system 20,000
230,000 650 Parking Total
Salaries & Benefits40%
Operating39%
Capital21%
Debt Service0%
Transfers0%
104

Public Works
105

PublicWorksPublic Works Administration- Public Works administration oversees and supports the Public Works’ divisions.
Engineering - Provide professional level technical support to the other Public Works divisions and other City
Departments.
GIS & Asset Management (Strategic Services)‐ Geographic Information System provides the foundation for data
collection, analysis and visualization for many aspects of city government. Asset Management leverages this data
to minimize risk and life‐cycle costs to effectively deliver best‐in‐class service throughout the community.
Solidwaste ‐ The Solid Waste Division (SWD) proudly serves the City of Bozeman Solid Waste customers by
providing them with a myriad of programs and services that effectively and efficiently manage municipal solid
waste generated within the Bozeman City limits.
Stormwater‐ Manage stormwater infrastructure through maintenance, improvement, and repair activities to
ensure the adequate control and conveyance of urban stormwater runoff, reducing the City’s liability associated
with flooding. Protect and improve waterway health and
treatment infrastructure projects to safeguard the public,
environment, and local waterways from pollution.
Streets Maintenance - The goal of the Street Maintenance
division is to help provide for a network of safe roadways for
the traveling public and access to desired destinations in a
quick, convenient, safe and comfortable manner while
minimizing harmful effects on the environment.
Vehicle Maintenance ‐ The Vehicle Maintenance budget unit accounts for the costs of repairing and maintaining
vehicles of the City. The budget unit operates under an internal service fund. Charges are assessed against
departments, which have vehicles repaired.
Wastewater – Operations ‐ Providing and maintaining a wastewater collection system for the City. The Division
maintains a program of inspecting, cleaning, root cutting, repairing sanitary sewer mains and manholes, and
tapping for new wastewater stubs. Wastewater operations is also responsible for maintaining the City’s eight
sanitary sewer lift stations.
Wastewater- Water Reclamation Facility (WRF) ‐ The WRF is an award‐winning plant with the main objective
being to protect and enhance the water quality of the East Gallatin River where it discharges. Through its beneficial
reuse program, the WRF maintains compliance with the Montana Pollutant Discharge Elimination System (MPDES)
discharge permit administered by the DEQ.
Water – Operations - Operating and maintaining the City’s water transmission and distribution system. We are
responsible for: locating, maintaining, and repairing existing water lines and appurtenances; overseeing
installation of new water lines; installing and rotating water meters and reading all meters monthly.
Water- Water Treatment Plant (WTP) ‐ Water Treatment Plants maintain a quality drinking water supply. The
City has 2 WTPs: 22 MGD Sourdough Plant and 3.7 MGD Lyman Creek Plant. All plants are operated 24 hours per
day, 365 days per year.
Water- Water Conservation ‐ Protect and enhance water resources through conservation in order to meet the
IWRP’s 50‐year demand reduction target.
106

Public Works Admin Major Objectives: Coordinate the activities of the Public Works
Dept. Divisions.
Establish and maintain policies, procedures, and
protocol for the department’s functions.
Provide general oversight of activities affected
by new federal and state mandates.
Assure master plan implementation is cost‐
effective and that infrastructure improvements
are constructed in a quality manner to provide
reliable service for immediate and long‐term
needs.
Budget Allocation Public Works Admin Internal Service Fund
FY19 Accomplishments The Administrative Division has functioned well with anticipation of a new Public Works Director. FY19 Strategic Plans 7.3 C Improve Departmental Collaboration‐Worked with Finance and all Public Works divisions on the CIP in a new system.
Performance Measures This function oversees the performance of all of public works. FY20 Strategic Plan Oversee all of Public Works Strategic Plan efforts in FY20
Public Works Admin24%
750‐ PW Admin
107
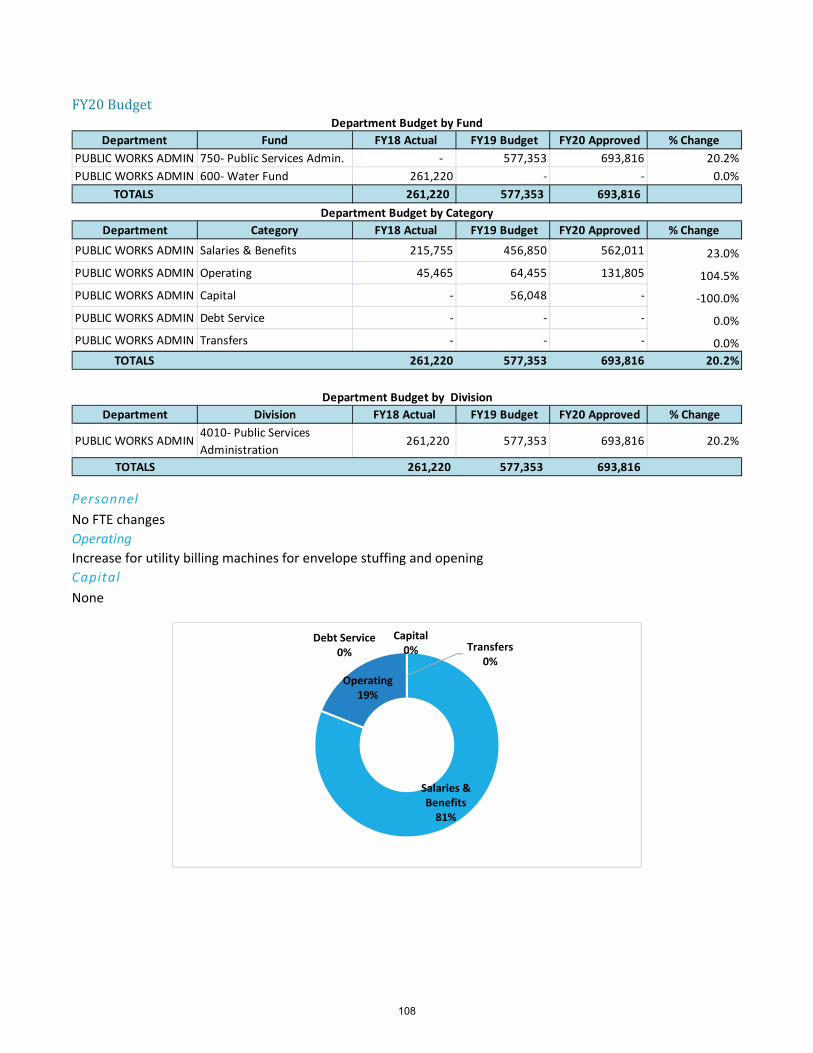
FY20 Budget
Personnel
No FTE changes
Operating
Increase for utility billing machines for envelope stuffing and opening
Capital
None
Department Fund FY18 Actual FY19 Budget FY20 Approved % Change
PUBLIC WORKS ADMIN 750‐ Public Services Admin. ‐ 577,353 693,816 20.2%
PUBLIC WORKS ADMIN 600‐ Water Fund 261,220 ‐ ‐ 0.0%
TOTALS 261,220 577,353 693,816
Department Category FY18 Actual FY19 Budget FY20 Approved % Change
PUBLIC WORKS ADMIN Salaries & Benefits 215,755 456,850 562,011 23.0%
PUBLIC WORKS ADMIN Operating 45,465 64,455 131,805 104.5%
PUBLIC WORKS ADMIN Capital ‐ 56,048 ‐ ‐100.0%
PUBLIC WORKS ADMIN Debt Service ‐ ‐ ‐ 0.0%
PUBLIC WORKS ADMIN Transfers ‐ ‐ ‐ 0.0%
TOTALS 261,220 577,353 693,816 20.2%
Department Division FY18 Actual FY19 Budget FY20 Approved % Change
PUBLIC WORKS ADMIN4010‐ Public Services
Administration 261,220 577,353 693,816 20.2%
TOTALS 261,220 577,353 693,816
Department Budget by Category
Department Budget by Fund
Department Budget by Division
Salaries & Benefits81%
Operating19%
Capital0%
Debt Service0% Transfers
0%
108

Engineering Major Objectives: Design and oversee construction of the annual
street, water, and wastewater replacement
projects
Review and ensure that public infrastructure
installed by private sector conforms to the City’s
standards
Develop and implement the City’s water,
wastewater, stormwater, water resources, and
transportation master plans and associated
capital budgets
Budget Allocation Engineering personnel and basic operating costs are
funded Public Works Admin Internal Service Fund:
The Division also oversees the Impact Fee fund and
Arterial & Collector funds, which fund large capital
expansion projects.
FY19 Accomplishments 5.30 million gallon water storage tank
Baxter Lane corridor upgrades
Completed 220 substantial development
application reviews (compared to 162 the prior
year)
FY19 Strategic Plans Strategic vision 4 many accomplishments were made to achieve this vision statement along with communication to citizens. Performance Measures
FY20 Strategic Plan Continue work with Strategic vision 4 action items along with communication to citizens. Also, focus on the vision statement 7 and working towards best practices and service delivery.
ENGINEERING43%
750‐ PW Admin
Public Works Admin Fund5%
Impact Fee funds and A&C95%
162
226 220 230 231
0
50
100
150
200
250
FY16 FY17 FY18 FY19Approved
FY20Recommended
Development Application Reviews
109

FY20 Budget
Personnel
1 FTE add‐ Engineering Inspector
Operating
Increases in outside consulting work for
the division
Capital
Oversees capital in the impact fee funds
and the Arterial & Collector fund, see
listing in the Capital section of the
budget book
Division Fund FY18 Actual FY19 Budget FY20 Approved % Change
ENGINEERING 750‐ Public Services Admin. ‐ 1,016,765 1,255,758 23.5%
ENGINEERING 600‐ Water Fund 498,128 ‐ ‐ 0.0%
ENGINEERING 114‐ Street Impact Fee 7,824,644 6,418,000 7,565,195 17.9%
ENGINEERING141‐ Street Arterial
Construction 1,741,416 3,568,000 2,396,000 ‐32.8%
ENGINEERING 610‐ Water Impact Fee 432,135 2,186,020 6,963,052 218.5%
ENGINEERING 630‐ Wastewater Impact Fee 211,611 8,625,000 7,343,417 ‐14.9%
TOTALS 10,707,934 21,813,785 25,523,422
Department Category FY18 Actual FY19 Budget FY20 Approved % Change
ENGINEERING Salaries & Benefits 401,387 812,815 973,288 19.7%
ENGINEERING Operating 528,895 363,950 683,470 87.8%
ENGINEERING Capital 9,777,652 20,037,020 22,440,729 12.0%
ENGINEERING Debt Service ‐ ‐ 530,012 0.0%
ENGINEERING Transfers ‐ 600,000 895,923 0.0%
TOTALS 10,707,934 21,813,785 25,523,422 17.0%
Department Division FY18 Actual FY19 Budget FY20 Approved % Change
PUBLIC WORKS ADMIN 4020‐ Engineering 498,128 1,016,765 1,255,758 23.5%
PUBLIC WORKS ADMIN Impact Fee funds and A&C 10,209,806 20,797,020 24,267,664 16.7%
TOTALS 10,707,934 21,813,785 25,523,422
Department Budget by Fund
Department Budget by Category
Department Budget by Division
Salaries & Benefits4%
Operating3%
Capital88%
Debt Service2%
Transfers3%
110

GIS/Asset Management(Strategic Services) Major Objectives: Reduce operations & maintenance costs by
leveraging data to be more efficient
Plan for future growth while mitigating issues
related to aging infrastructure
Measure, monitor and communicate
performance for city services
Engage citizens and provide transparency to
effectively communicate value
Budget Allocation Funded by the Public Works Admin Internal Service
Fund
FY19 Accomplishments AVL Replacements (x23 +9)
Service Requests for VM & Facilities
Forestry
o Mobile Data Collection Tool
o Work Order Management (“light”)
o Automated Dashboards
o Public Web Apps
FY19 Strategic Plans Community Risk Assessment (3.2.b)
Land Use & Infrastructure Tracking (4.1.c)
Parks & Trails Maintenance District (4.3.a)
Art Trail Map (5.2.a)
Performance Measures Track the web mapping applications: “Hours of
Use”
FY20 Strategic Plan System Integrations (7.3.b)
Data Analysis Tools (7.4.a)
Performance Measures (7.4.b & 7.4.c)
Service Delivery Expectations (7.4.d)
GIS/ ASSET
MANAGEMENT34%
750‐ PW Admin
Level of Service (defined)
Overall Risk (analyzed)
Deferred Maintenance (declining)
Preventative Maintenance (in place)
Measured Outcomes
(communicated)
75 7783
90
112
0
20
40
60
80
100
120
FY16 FY17 FY18 FY19Approved
FY20Recommended
Cityworks Users
111

FY20 Budget
Personnel
One FTE added a GIS Analyst
Operating
Increases due to software maintenance contracts and computer replacements
Capital
Division Fund FY18 Actual FY19 Budget FY20 Approved % Change
GIS/ASSET MANGT 750‐ Public Services Admin. ‐ 794,339 995,486 25.3%
GIS/ASSET MANGT 600‐ Water Fund 690,673 ‐ ‐ 0.0%
TOTALS 690,673 794,339 995,486
Department Category FY18 Actual FY19 Budget FY20 Approved % Change
GIS/ASSET MANGT Salaries & Benefits 348,498 424,238 553,949 30.6%
GIS/ASSET MANGT Operating 236,075 286,601 366,537 27.9%
GIS/ASSET MANGT Capital 106,100 83,500 75,000 ‐10.2%
GIS/ASSET MANGT Debt Service ‐ ‐ ‐ 0.0%
GIS/ASSET MANGT Transfers ‐ ‐ ‐ 0.0%
TOTALS 690,673 794,339 995,486 25.3%
Department Division FY18 Actual FY19 Budget FY20 Approved % Change
PUBLIC WORKS ADMIN 4025‐ GIS 690,673 794,339 995,486 25.3%
TOTALS 690,673 794,339 995,486
Department Budget by Fund
Department Budget by Category
Department Budget by Division
Fund Fund ‐ Division Project # Project Name Amount
750 Public Works Admin GIS03 ASSET MANAGEMENT SOFTWARE 75,000
75,000 750 Public Works Admin Total
Salaries & Benefits56%
Operating37%
Capital7%
Debt Service0%
Transfers0%
112

Solid Waste Major Objectives: Offer quality service to the residents of Bozeman
Promote waste reduction thru recycling efforts
Optimize operational efficienciesBudget Allocation Solid Waste Fund – Enterprise Fund
The Division also oversees the Landfill Post Closure
fund:
FY19 Accomplishments Streamline reports for finance to bill for services
Route Optimization currently in progress
FY19 Strategic Plans Increasing Solid Waste Recycling Services
throughout the community was identified in
6.3b Climate Action section of the Strategic Plan.
Recycling service accounts have increase by 15%
this past year.
Currently working on an automated yard
waste/food scrap collection program. Feedstock
to include food scraps & soiled paper items
(pizza boxes, napkins).
Performance Measures
FY20 Strategic Plan Increasing Solid Waste Recycling Services throughout the community was identified in 6.3b Climate Action section of the Strategic Plan.
‐
1,000,000
2,000,000
3,000,000
4,000,000
5,000,000
6,000,000
FY18 Actual FY19 Budget FY20 Approved
640‐ Solid Waste Fund
‐
100,000
200,000
300,000
400,000
FY18 Actual FY19 Budget FY20 Approved
641 ‐ Landfill Post Closure
27.7% 32.7% 34.2% 37.3% 38.3%
72.3% 67.3%65.8% 62.7% 61.7%
9,600 10,100 11,173 11,500 12,000
0
2,000
4,000
6,000
8,000
10,000
12,000
14,000
FY16 FY17 FY18 FY19Approved
FY20Recommended
Residential Customers
Recycling & Refuse Customers Refuse Only Customer
‐
5,000
10,000
15,000
20,000
25,000
30,000
FY16 FY17 FY18 FY19Approved
FY20Recommended
Tonnage Diverted From The Landfill
Residential Refuse Commercial Refuse
Roll‐Off Refuse Residential Recycling
Commercial Recycling Compost
113

FY20 Budget
Personnel
Removing two short‐term workers, .40 FTE, and adding two Solid Waste Operators for a total of 1.6 FTE increase
Operating
Increases in costs of operations for gas and recycling charges
Capital
Department Fund FY18 Actual FY19 Budget FY20 Approved % Change
SOLIDWASTE 640‐ Solid Waste Fund 4,969,132 3,764,084 5,154,777 36.9%
SOLIDWASTE 641 ‐ Landfill Post Closure 364,789 311,417 287,417 0.0%
TOTALS 5,333,921 4,075,501 5,442,194
Department Category FY18 Actual FY19 Budget FY20 Approved % Change
SOLIDWASTE Salaries & Benefits 1,463,392 1,351,142 1,465,420 8.5%
SOLIDWASTE Operating 3,072,475 2,562,942 3,025,357 18.0%
SOLIDWASTE Capital 798,054 161,417 951,417 489.4%
SOLIDWASTE Debt Service ‐ ‐ ‐ 0.0%
SOLIDWASTE Transfers ‐ ‐ ‐ 0.0%
TOTALS 5,333,921 4,075,501 5,442,194 33.5%
Department Division FY18 Actual FY19 Budget FY20 Approved % Change
SOLIDWASTE 5810‐Collection Operation 4,689,402 3,466,438 4,691,539 35.3%
SOLIDWASTE 5820‐ Recycling 279,730 297,646 463,238 55.6%
SOLIDWASTE Landfill Post Closure 364,789 311,417 287,417 ‐7.7%
TOTALS 5,333,921 4,075,501 5,442,194
Department Budget by Fund
Department Budget by Category
Department Budget by Division
Fund Fund ‐ Division Project # Project Name Amount
640 Solidwaste SW32 Front Load Truck Replacement 270,000
640 Solidwaste SW36 Side Load Truck ‐ New 290,000
640 Solidwaste SW53 Pickup Truck 30,000
640 Solidwaste SW55 Side Load Truck 300,000
890,000
641 Landfill Closure Closure Costs 61,417
61,417
640 Solidwaste Total
641 Landfill ClosureTotal
Salaries & Benefits27%
Operating56%
Capital17%
Debt Service0%
Transfers0%
114

Stormwater Major Objectives: Protect the public from flooding and pipe failures
Improve stream health
Comply with environmental regulations
Budget Allocation Stormwater Fund – Enterprise Fund
FY19 Accomplishments Inspected and maintained 22% of the public
storm sewer
Emergency ordinance update, providing broader
authority
Completed 5 capital projects, initiated 15
FY19 Strategic Plans Worked towards strategic vision 4 for a well‐
planned City
FY20 Strategic Plan Continue working towards strategic vision 4 for
a well‐planned City
Work towards vision statement 7 High
Performing Organization
Performance Measures
‐
500,000
1,000,000
1,500,000
2,000,000
2,500,000
FY18 Actual FY19 Budget FY20 Approved
670‐ Storm Water Fund
FY17 Actual
n/a
FY18 Actual
D‐
FY19 Approved
D+
FY20 Recom.
C‐
** See the City of Bozeman and Montana State University Stormwater Management Plan for more information at https://www.bozeman.net/government/stormwater/learn‐about‐stormwater.
115

FY20 Budget
Personnel
Adding one FTE Stormwater Technician
Operating
Increases in costs of operations and initial costs for new employee.
Capital
Department Fund FY18 Actual FY19 Budget FY20 Approved % Change
STORM WATER 670‐ Storm Water Fund 1,918,645 1,444,302 1,660,521 15.0%
Department Category FY18 Actual FY19 Budget FY20 Approved % Change
STORM WATER Salaries & Benefits 548,094 408,583 580,938 42.2%
STORM WATER Operating 286,662 240,373 268,372 11.6%
STORM WATER Capital 889,821 635,000 650,000 2.4%
STORM WATER Debt Service 194,068 160,346 161,211 0.5%
STORM WATER Transfers ‐ ‐ ‐ 0.0%
TOTALS 1,918,645 1,444,302 1,660,521
Department Division FY18 Actual FY19 Budget FY20 Approved % Change
STORM WATER 4510‐ Admin., Enforc. & Mapping 845,025 646,678 720,299 11.4%
STORM WATER 4520‐ Operations & Mtc. 215,929 197,624 290,222 46.9%
STORM WATER 4530‐ Construction 857,691 600,000 650,000 8.3%
TOTALS 1,918,645 1,444,302 1,660,521
Department Budget by Category
Department Budget by Division
Department Budget by Fund
Fund Fund ‐ Division Project # Project Name Amount
670 Stormwater STDM01 DOWNTOWN TRUNK LINE REHAB 400,000
670 Stormwater STDM02 MANLEY DITCH REHAB 100,000
670 Stormwater STUO01 STORMWATER FACILITY PLAN 150,000
650,000 670 Stormwater Total
Salaries & Benefits35%
Operating16%
Capital39%
Debt Service10%
Transfers0%
116

Street Maintenance Major Objectives: Implement an efficient pavement management
plan, in turn creating yearly maintenance
programs for failing street infrastructure.
Utilize pavement condition assessment for
planning and scheduling our repairs from
potholes to complete reconstruction
Maintain streets and alley right‐of‐ways to allow
traffic to move in a safe and prudent manner.
Improve the quality of summer and winter street
maintenance work and communicate to the
citizens so that they may be better informed and
plan for it.
Budget Allocation The main source of funding is the Street
Maintenance Fund‐ Special Revenue Fund, there are
other special revenue funds and a construction fund
that make up the total funding:
FY19 Accomplishments Milled and Overlay In House‐ Lindley Place, Ice
Pond Road, 3 blocks of S. 4th and Interior Landfill
Road.
Working with MRL, replaced crossing at
Broadway and Mendenhall.
Maintained and cleared City streets during
record snowfall year with no school or road
closures
FY19 Strategic Plans 1.1 Outreach‐ Use of Next Door, Facebook and
Twitter to keep our citizens informed where we
are working.
3.3e Friendly Community‐ Be aware of
pedestrian facilities in our snow operations such
as clearing ADA ramps and HC parking spaces.
4.5c,d Housing and Transportation Choices‐
Enhancing the Pedestrian and Cycling System.
Sweeping and cleaning bike lanes year round.
Infrastructure for Non‐motorized
Transportation.
Performance Measures Calculate the materials swept per mile
traveled.
Monitor the citywide Pavement Condition
Index (PCI).
Strategic Plan 2.1 Business Growth‐ Support access to
businesses by customers and employees by
having a 3AM Commercial Snow Route getting
routes plowed and snow removed before 8AM.
4.4 Vibrant Downtown, Districts & Centers‐
Sweep Downtown and Midtown weekly.
Prioritize Downtown snow removal to facilitate
ease of parking during winter months.
4.5c,d Housing and Transportation Choices‐ Enhancing the Pedestrian and Cycling System. Sweeping and cleaning bike lanes year round.
110‐ Gas Tax Fund
21%
111‐ Street Mainenance
Fund64%
146‐170, 181‐182, 200‐243‐Lighting Districts
5%
504‐ Construction Funds10%
15.0
15.7
14.8
14.4
13.8
12.5
13.0
13.5
14.0
14.5
15.0
15.5
16.0
FY16 FY17 FY18 FY19Approved
FY20Recommended
Street Mileage per Full Time Employee
117

FY20 Budget
Personnel
1.20 FTE added and decreasing .25 for a total increase of .95 FTE ‐ Adding a City Streets worker and a short‐term
worker, and removing a seasonal worker
Operating
Operational costs increasing with maintaining more roads and an increase in general construction costs.
Capital
Many replacement and new vehicles and annual street projects, see Capital section for all the detailed capital
listing for the Street maintenance fund and Gas tax fund
Department Fund FY18 Actual FY19 Budget FY20 Approved % Change
STREETS 010‐ General Fund 186,331 ‐ ‐ 0.0%
STREETS 108‐ Community Transportaion Fund ‐ ‐ ‐ 0.0%
STREETS 110‐ Gas Tax Fund 1,155,422 1,171,500 2,120,350 81.0%
STREETS 111‐ Street Mainenance Fund 5,958,135 5,974,325 6,462,343 8.2%
STREETS146‐170, 181‐182, 200‐243‐ Lighting
Districts 474,089 472,517 477,499
1.1%
STREETS 504‐ Construction Funds 747,589 284,011 1,072,000 277.5%
TOTALS 8,521,566 7,902,353 10,132,192
Department Category FY18 Actual FY19 Budget FY20 Approved % Change
STREETS Salaries & Benefits 1,676,893 1,629,339 1,756,594 7.8%
STREETS Operating 3,100,433 2,736,818 3,810,135 39.2%
STREETS Capital 2,206,475 2,525,511 2,822,080 11.7%
STREETS Debt Service 223,985 315,207 310,800 ‐1.4%
STREETS Transfers 1,313,800 695,478 1,432,583 106.0%
TOTALS 8,521,586 7,902,353 10,132,192
Department Division FY18 Actual FY19 Budget FY20 Approved % Change
STREETS 4110‐ Street Operations 3,864,945 4,526,247 5,090,270 12.5%
STREETS 4130‐ Street Construction 3,590,831 2,284,665 4,045,083 77.1%
STREETS 4150‐ Street Lighting 562,969 530,517 535,499 0.9%
STREETS 4171‐ Traffic Signs & Markers 502,821 560,924 461,340 ‐17.8%
TOTALS 8,521,566 7,902,353 10,132,192
Department Budget by Category
Department Budget by Division
Department Budget by Fund
Salaries & Benefits17%
Operating38%
Capital28%
Debt Service3%
Transfers14%
118

Vehicle Maintenance Major Objectives: To maintain vehicles and equipment in good
running condition thereby enabling various City
personnel to perform daily assignments safely
and without delay due to mechanical failure or
breakdown.
The Division emphasizes the importance of
having a well‐structured preventative
maintenance program online for all equipment
and vehicles.
Budget Allocation Internal Service Fund‐ Vehicle Maintenance Internal
Service Fund
FY19 Accomplishments Worked with the Fire Department on a
maintenance and repair plan including supplying
a mechanic on site during large events to
monitor equipment.
Schedule seasonal equipment months before
season starts.
Kept Library bookmobile in service with zero
complaints of illiteracy.
FY19 Strategic Plans 6.3 Climate Action‐ Reduce community and
municipal Greenhouse Gas (GHG) emissions,
increase the supply of clean and renewable
energy: foster related businesses. Vehicle
Maintenance staff addresses vehicle emissions
concerns a soon as we are aware of it. No “just drive it with the check engine light on”. One of our mechanics is a certified alternative fuel
technician.
Performance Measures
Calculate and monitor preventative vs
reactive maintenance
Measure the percentage of uptime that
vehicles are operational
o FY18 Water/Sewer: 98%
o FY18 Streets: 91%
o FY18 Police: 94%
FY20 Strategic Plan 6.3 Climate Action‐ Reduce community and
municipal Greenhouse Gas (GHG) emissions,
increase the supply of clean and renewable
energy: foster related businesses. Vehicle
Maintenance staff addresses vehicle emissions
concerns a soon as we are aware of it. No “just drive it with the check engine light on”. One of our mechanics is a certified alternative fuel
technician.
1,150,000
1,200,000
1,250,000
1,300,000
1,350,000
1,400,000
FY18 Actual FY19 Budget FY20Approved
710‐ Vehicle Maintenance Fund
4 4 4
5 6 7
7.48.5
9.5
0
5
10
15
20
25
FY18 FY19Approved
FY20Recommended
Days From Initiation to Completion for Internal Vehicle Service Requests (by priority)
High Medium Low
119

FY20 Budget
Personnel
Adding 1 FTE a City Service Worker
Operating
Increase in fleet has increased operating costs
Capital
None
Department Fund FY18 Actual FY19 Budget FY20 Approved % Change
VEHICLE MAINTENANCE 710‐ Vehicle Maintenance Fund 1,382,402 1,259,462 1,387,800 10.2%
Department Category FY18 Actual FY19 Budget FY20 Approved % Change
VEHICLE MAINTENANCE Salaries & Benefits 492,099 481,127 541,468 12.5%
VEHICLE MAINTENANCE Operating 890,303 778,335 846,332 8.7%
VEHICLE MAINTENANCE Capital ‐ ‐ ‐ 0.0%
VEHICLE MAINTENANCE Debt Service ‐ ‐ ‐ 0.0%
VEHICLE MAINTENANCE Transfers ‐ ‐ ‐ 0.0%
TOTALS 1,382,402 1,259,462 1,387,800 10.2%
Department Division FY18 Actual FY19 Budget FY20 Approved % Change
VEHICLE MAINTENANCE 6010‐ Vehicle Maintenance Shop 1,382,402 1,259,462 1,387,800 10.2%
Department Budget by Category
Department Budget by Division
Department Budget by Fund
Salaries & Benefits59%
Operating41%
Capital0%Debt Service
0%Transfers
0%
120

Wastewater‐ Operations Major Objectives: Adequately maintain and locate the City’s
wastewater system including manholes,
wastewater collection and transmission systems
and lift stations
Clean our entire collections system annually to
minimize stoppages
Televise the existing sewer infrastructure to
determine problems and overall condition of
sewer mains, enabling repairs in a timely manner
and helping to prioritize renovation projects
funded through CIP
Budget Allocation Funded by the Wastewater Enterprise Fund
FY19 Accomplishments More aggressively engaging educating and
inspecting businesses for Fats Oils and Grease
issues.
Lower than median sewer backups caused by
blockages in the main. ‐ 1.3 / 100 miles of pipe /
year.
Started to plan for replacing root bound sewer
connections in New Hyaliteview.
FY19 Strategic Plans 1.3C Enhance our relationship with MSU‐ We
now meet quarterly with Montana State to
communicate water and sewer information. We
are assisting them with goal setting and utility
maintenance programs and they are helping us
by working on cross connection control and
sewer infiltration issues.
Performance Measures
FY20 Strategic Plan 7.4 a Develop Data Analysis tools‐ This was a
pilot year where we used Cityworks data pushed
to an excel spreadsheet to schedule
maintenance. All sewer maintenance that we do
had a rate and pace determined and a number of
days scheduled to complete.
Wastewater
Operations
44%
Wastewater Fund
0.14
1.3 1.3
0.5
1
0
0.5
1
1.5
2
FY16 FY17 FY18 FY19Approved
FY20Recommended
Number of Overflow Events per 100 Miles of Main
National Standard
47.58 50
61.2
50 50
0
10
20
30
40
50
60
70
FY16 FY17 FY18 FY19Approved
FY20Recommended
Miles of Root Cut Mains
60
30.926
60
50
0
10
20
30
40
50
60
70
FY16 FY17 FY18 FY19Approved
FY20Recommended
Miles of Flushed Mains
121

FY20 Budget
Personnel
Adding 1 FTE‐ Sewer Operator
Operating
Minor adjustments showing a reduction in operating costs
Capital
Division Fund FY18 Actual FY19 Budget FY20 Approved % Change
WASTEWATER OPERATIONS 620‐ Wastewater Fund 3,881,356 3,472,368 3,505,788 1.0%
Department Category FY18 Actual FY19 Budget FY20 Approved % Change
WASTEWATER OPERATIONS Salaries & Benefits 852,401 856,835 926,727 8.2%
WASTEWATER OPERATIONS Operating 2,204,492 1,513,033 1,456,561 ‐3.7%
WASTEWATER OPERATIONS Capital 824,463 1,102,500 1,122,500 1.8%
WASTEWATER OPERATIONS Debt Service ‐ ‐ ‐ 0.0%
WASTEWATER OPERATIONS Transfers ‐ ‐ ‐ 0.0%
TOTALS 3,881,356 3,472,368 3,505,788
Department Division FY18 Actual FY19 Budget FY20 Approved % Change
WASTEWATER 5210‐ Wastewater Operations 2,689,658 2,309,868 2,343,288 1.4%
WASTEWATER 5220‐ Utilities Locates 2,282 92,900 92,900 0.0%
WASTEWATER 5230‐ Wastewater Services 1,025 5,000 5,000 0.0%
WASTEWATER 5240‐ Wastewater Construction 1,149,623 1,022,500 1,022,500 0.0%
WASTEWATER 5250‐ Manholes 28,495 25,000 25,000 0.0%
WASTEWATER 5260‐ Televising 6,058 12,100 12,100 0.0%
WASTEWATER 5280‐ Main Repairs 4,215 5,000 5,000 0.0%
TOTALS 3,881,356 3,472,368 3,505,788
Department Budget by Category
Department Budget by Fund
Department Budget by Division
Salaries & Benefits26%
Operating42%
Capital32%
Debt Service0%
Transfers0%
Fund Fund ‐ Division Project # Project Name Amount
620 Wastewater ‐ OperationsWW07
ANNUAL WASTEWATER PIPE REPLACEMENT
PROGRAM‐DESIGN 22,500
620 Wastewater ‐ OperationsWW08
WASTEWATER PIPE REPLACEMENT PROGRAM‐
CONSTRUCTION 1,000,000
122

Wastewater‐ Water Reclamation Facility Major Objectives: Protect and enhance the water quality of the
East Gallatin River
Consistently achieve compliance with all aspects
of the city’s Discharge permit (MPDES) and in
most cases be below allotted limit.
Comply with all EPA 503 Bio‐solids requirements
and regulations, minimizing unpleasant orders.
Budget Allocation
FY19 Accomplishments Continued with asset maintenance management
through CIP program and operating budget.
Including,
Meeting Montana Department of Environmental
Quality discharge permit requirements.
Continued with staff education. Three
employees passed State of Montana
Wastewater Certification.
FY19 Strategic Plans 1.3e) Enhance our relationship with State and
Federal Agencies: Ongoing permit negotiation
with DEQ and EPA requesting discharge variance.
6.4d) Climate Change Adaption and Mitigation:
Completed Digesters #1 and #2 clean and
refurbishment. To increase methane production
used as primary heat for the WRF.
7.2a) Be a “Best in Class” Employer: 10 out of 15
WRF employees are State of Montana
Wastewater Certified. One took test in Feb.
three are actively studying for certification test.
Performance Measures Calculate and monitor preventative vs
corrective maintenance.
FY20 Strategic Plan 1.1a) Outreach – 3.4) Active Recreation ‐There is
a fishing access off the WRF parking lot. The river
joined the WRF discharge and continued on.
1.1a) Outreach ‐the WRF puts out a superior
effluent discharge. Having the river back to the
original location help communicate to the public
through the fishing access the quality of the
WRFs effluent discharge.
3.4) Active Recreation: ‐The fishing access was a
very popular spot for not only fishing but also
dog walking and short hiking. Fish have been
caught literally feet from the WRFs discharge.
Water Reclamation
Facility56%
Wastewater Fund
$1,300
$1,600 $1,749
$2,040 $2,162
$0
$500
$1,000
$1,500
$2,000
$2,500
FY16 FY17 FY18 FY19Approved
FY20Recommended
Cost per Million Gallons of Wastewater Flow Treated
123

FY20 Budget
Personnel
No change
Operating
Inflationary costs to operations
Capital
Debt Service
There was an assumption made for a
possible debt issuance in FY19. The
debt service is actually occurring in the
Impact Fee fund and will be budgeted
for payment there going forward.
Division Fund FY18 Actual FY19 Budget FY20 Approved % Change
WATER RECLAIMATION FACILITY 620‐ Wastewater Fund 3,949,129 7,443,304 5,618,824 ‐24.5%
Division Category FY18 Actual FY19 Budget FY20 Approved % Change
WATER RECLAIMATION FACILITY Salaries & Benefits 1,134,935 1,144,278 1,202,252 5.1%
WATER RECLAIMATION FACILITY Operating 2,224,923 2,572,967 2,677,572 4.1%
WATER RECLAIMATION FACILITY Capital 589,271 2,250,000 500,000 ‐77.8%
WATER RECLAIMATION FACILITY Debt Service ‐ 1,476,059 1,239,000 ‐16.1%
WATER RECLAIMATION FACILITY Transfers ‐ ‐ ‐ 0.0%
TOTALS 3,949,129 7,443,304 5,618,824
Department Division FY18 Actual FY19 Budget FY20 Approved % Change
WASTEWATER 5610‐ WRF Operations 2,990,112 4,861,605 4,474,372 ‐8.0%
WASTEWATER 5620‐ Laboratory 440,783 487,490 511,052 4.8%
WASTEWATER 5630‐ Sludge Injection 430,554 553,400 568,000 2.6%
WASTEWATER 5640‐ Pretreatment 4,115 64,750 65,400 1.0%
WASTEWATER 5650‐ WRF Construction 83,565 1,476,059 ‐ ‐100.0%
TOTALS 3,949,129 7,443,304 5,618,824
Department Budget by Fund
Department Budget by Category
Department Budget by Division
Fund Fund ‐ Division Project # Project Name Amount
620 Wastewater WW54 REPLACE #1783 ‐ 1995 FORD DUMP TRUNK 100,000
620 Wastewater WW69 SMALL WORKS PROJECTS 100,000
620 Wastewater WW96 EAST GALLATIN RIVER AVULSION RESTORATION 300,000
Salaries & Benefits21%
Operating48%
Capital9%
Debt Service22%
Transfers0%
124

Water ‐ Operations Major Objectives: Maintain the City’s 288 miles of the water
distribution system, hydrants, valves, meters
and pressure reducing valves.
Respond to water distribution problems 24 hrs a
day 7 days a week.
Budget Allocation Funded by the Water Enterprise fund
FY19 Accomplishments Selected and trained a contractor to perform
one call locates during business hours.
Achieved a near perfect score in the ISO
evaluation 38.66 out of 40 possible points.
FY19 Strategic Plans 6.1 Clean Water Supplies Continued Lead Service Line removal both within the department and outside contractors down to 70 known lead service lines.
Performance Measures
FY20 Strategic Plan 6.2 Protect Local Air Quality Purchase another meter gateway will eliminate some of the driving we now do getting meter reads.
Water Operation
s45%
Water Fund
125

FY20 Budget
Personnel
Adding 1 FTE‐ Water Operator
Operating
Inflationary increases in the costs of operations
Capital
Division Fund FY18 Actual FY19 Budget FY20 Approved % Change
WATER OPERATIONS 600‐ Water Fund 3,769,696 6,651,133 4,533,824 ‐31.8%
Division Category FY18 Actual FY19 Budget FY20 Approved % Change
WATER OPERATIONS Salaries & Benefits 1,247,340 1,145,232 1,196,370 4.5%
WATER OPERATIONS Operating 1,784,898 2,016,892 2,114,954 4.9%
WATER OPERATIONS Capital 737,458 3,489,009 1,222,500 ‐65.0%
WATER OPERATIONS Debt Service ‐ ‐ ‐ 0.0%
WATER OPERATIONS Transfers ‐ ‐ ‐ 0.0%
TOTALS 3,769,696 6,651,133 4,533,824
Department Division FY18 Actual FY19Budget FY20 Approved % Change
WATER 5010‐ Uwater Operations 2,751,971 2,366,084 2,477,727 4.7%
WATER 5020‐ Utility Locates 4,484 95,450 93,750 ‐1.8%
WATER 5030‐ Water Services 39,181 35,000 35,000 0.0%
WATER 5040‐ Water Construction 242,744 3,469,009 1,222,500 ‐64.8%
WATER 5060‐ Meter Reading 664,942 568,090 587,347 3.4%
WATER 5070‐ Hydrants 35,926 80,000 80,000 0.0%
WATER 5080‐ Water Valves 11,468 17,500 17,500 0.0%
WATER 5090‐ Main Repairs 1,890 20,000 20,000 0.0%
TOTALS 3,752,606 6,651,133 4,533,824
Department Budget by Category
Department Budget by Fund
Department Budget by Division
Salaries & Benefits26%
Operating47%
Capital27%
Debt Service0%
Transfers0%
Fund Fund ‐ Division Project # Project Name Amount
600 Water ‐ Operations W03 ANNUAL WATER PIPE REPLACEMENT 22,500
600 Water ‐ OperationsW04‐20
WATER PIPE REPLACEMENT PROGRAM ‐
CONSTRUCTION 1,200,000
126

Water‐ Water Treatment Plant Major Objectives: Protect public health through optimization of the
Sourdough and Lyman Creek Plants.
Maintain high‐quality drinking water of low
turbidity, void of contaminants, and meeting
water supply demands of the City.
Monitoring and maintaining WTP facilities to
ensure current needs are met and to anticipate
future water quality and quantity needs.
Budget Allocation Funded by the Water Enterprise fund
FY19 Accomplishments 5.3 MG finished water storage tank online before
end of FY19
Lyman Creek spring overflow monitoring
equipment completed
Hilltop tank mixer will be installed before the end
of FY19
FY19 Strategic Plans 6.1 Clean Water Supplies
Performance Measures
FY20 Strategic Plan 6.1 Clean Water Supplies
Water Treatment
Plant50%
Water Fund
127

FY20 Budget
Personnel
No changes
Operating
Reduction in consulting services for capital projects for the prior year
Capital
Division Fund FY18 Actual FY19 Budget FY20 Approved % Change
WATER PLANT 600‐ Water Fund 2,562,029 5,013,637 5,088,729 1.5%
Division Category FY18 Actual FY19 Budget FY20 Approved % Change
WATER PLANT Salaries & Benefits 887,562 792,975 827,179 4.3%
WATER PLANT Operating 1,573,809 2,340,032 2,091,920 ‐10.6%
WATER PLANT Capital 100,658 715,000 1,004,000 40.4%
WATER PLANT Debt Service ‐ 1,165,630 1,165,630 0.0%
WATER PLANT Transfers ‐ ‐ ‐
TOTALS 2,562,029 5,013,637 5,088,729
Department Division FY18 Actual FY19Budget FY20 Approved % Change
WATER 4610‐ Water Plant Operations 2,526,029 5,013,637 5,088,729 1.5%
Department Budget by Fund
Department Budget by Category
Department Budget by Division
Fund Fund ‐ Division Project # Project Name Amount
600 Water W62 REPLACE #3446 ‐ WTP GMC SIERRA PICKUP 45,000
600 WaterW66
SCADA METERS, TRANSDUCERS &
COMMUNICATIONS 10,000
600 Water W84 SOURDOUGH TANK INSPECTION & IMPROVEMENTS 600,000
600 Water W91 TURBIDIMETER REPLACEMENT 14,000
600 Water W94 MYSTIC LAKE BEAVER DECEIVER 35,000
600 WaterW96
SOURDOUGH RAW TRANSMISSION MAIN FLOW
CONTROL VALVE AND METER 300,000
Salaries & Benefits16%
Operating41%
Capital20%
Debt Service23%
Transfers0%
128

Water Conservation Major Objectives: Establishing and strengthening the community’s
water conservation ethic.
Ensuring adequate water supplies are available;
to meet current and future demands, in times of
drought, for emergency response and long term
drought mitigation
Budget Allocation Funded by the Water Enterprise Fund
FY19 Accomplishments Grant extension approval & construction
contract for the Sunset Hills Cemetery Water
Conservation Project
Drought tolerant demonstration garden
installation at Museum of the Rockies
Increased participation in sprinkler system
assessments by 65%.
FY19 Strategic Plans 1.3.c.d Enhanced Relationships ‐Outreach
Program, Demo Garden, MSU Student Masters
Project (Drought Communication)
A Well Planned City: 4.3.d Explore Sustainable
Technology ‐ Dropcountr customer water use
portal development
A Sustainable Environment: 6.1.a Watershed
Management ‐Municipal watershed data
collection, improvements to drought monitoring
to
Performance Measures
FY20 Strategic Plan An Engaged Community: 1.1 Outreach and 1.2
Community Engagement
A Well Planned City: 4.3.d Explore Sustainable
Technology ‐CIP WC02: Subscription to
Customer Water Use Portal, Dropcountr
A Sustainable Environment: 6.1.a Watershed
Management – CIP WC05 and WC06, along with
outreach and incentive programs.
Water Conservat
ion5%
Water Fund
385
216 300 275 300
127
133
137 135 140
107
60
128 150 160
32
48
67
70 70
0
100
200
300
400
500
600
700
800
FY16 FY17 FY18 FY19Approved
FY20Recommended
Water Conservation Rebates
Toilets Clothes Washers
Showerheads Landscape & Irrigation System
24
42
65 60
70
0
20
40
60
80
FY16 FY17 FY18 FY19Approved
FY20Recommended
Number of Outdoor Sprinkler System Assessments
0
20
40
60
80
100
120
140
‐
10,000
20,000
30,000
40,000
50,000
60,000
FY09FY10FY11FY12FY13FY14FY15FY16FY17FY18
GPCD
Population
Gallons Per Capita Per Day (GPCD) Water Demand & Population
Total Water Demand (GPCD) Population
111 GPCD Avg.
121 GPCD Avg.
129
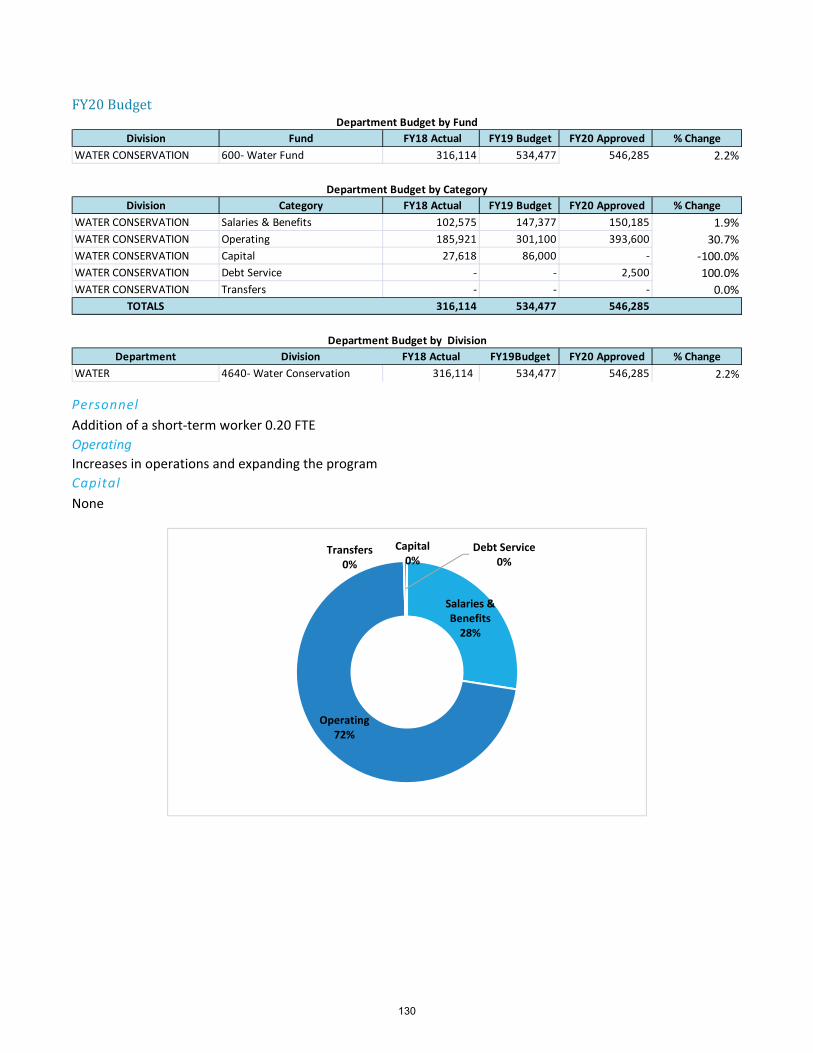
FY20 Budget
Personnel
Addition of a short‐term worker 0.20 FTE
Operating
Increases in operations and expanding the program
Capital
None
Division Fund FY18 Actual FY19 Budget FY20 Approved % Change
WATER CONSERVATION 600‐ Water Fund 316,114 534,477 546,285 2.2%
Division Category FY18 Actual FY19 Budget FY20 Approved % Change
WATER CONSERVATION Salaries & Benefits 102,575 147,377 150,185 1.9%
WATER CONSERVATION Operating 185,921 301,100 393,600 30.7%
WATER CONSERVATION Capital 27,618 86,000 ‐ ‐100.0%
WATER CONSERVATION Debt Service ‐ ‐ 2,500 100.0%
WATER CONSERVATION Transfers ‐ ‐ ‐ 0.0%
TOTALS 316,114 534,477 546,285
Department Division FY18 Actual FY19Budget FY20 Approved % Change
WATER 4640‐ Water Conservation 316,114 534,477 546,285 2.2%
Department Budget by Fund
Department Budget by Category
Department Budget by Division
Salaries & Benefits28%
Operating72%
Capital0%
Debt Service0%
Transfers0%
130

Public Welfare
131

PublicWelfareRecreation (Parks & Recreation)- The Recreation Division is responsible for identifying the recreation needs of our growing community and offering quality
programs in diverse interest areas that satisfy those
needs. The division has a committed staff that
remains focused on program quality and customer
satisfaction while offering all‐inclusive opportunities
in outdoor recreation, sports, fitness, and cultural
arts. The Aquatics Division is comprised of one year‐
round indoor facility, the Swim Center and one
outdoor seasonal facility, Bogert Pool. Forestry (Parks & Recreation)- The Forestry
Division is committed to providing a healthy, safe, and aesthetically pleasing community forest. Environmental,
economic, and social benefits from the urban forest raise the standard of living for Bozeman residents.
Parks (Parks & Recreation)- The Parks Division is responsible for the overall development and maintenance of
44 public parks, 52 + miles of trails and associated sports fields and open space within the City limits.
Cemetery (Parks & Recreation)- The 73+acre Sunset Hills Cemetery, the only City owned and maintained
cemetery, is a virtual arboretum of stately pine, fir, spruce, ash, maple, cedar and various ornamental trees, which
are maintained by the Forestry Division with assistance from the Cemetery Division. The cemetery currently
contains over 16,000 burial sites, three columbariums, nine dedicated affiliation areas and ample room for
expansion.
Library- The Bozeman Public Library creates
opportunities that inspire curiosity, exploration and
connection. The Library is the community cultural center
that connects all Bozeman citizens to their neighbors
and the world.
Economic Development - Our community strengthens
and diversifies the local economy by supporting business
sectors that create & sustain mid‐ to high‐paying jobs,
enhancing the high quality of life in the greater Bozeman Sustainability (Strategic Services) - Coordinates with city departments and community stakeholders to
promote a sustainable environment and reduce greenhouse gas emissions.
Affordable Housing (Community Development) ‐ As Bozeman grows, the city is working to develop a long‐term
plan to meet the housing needs of its residents through the Affordable Housing Program.
132
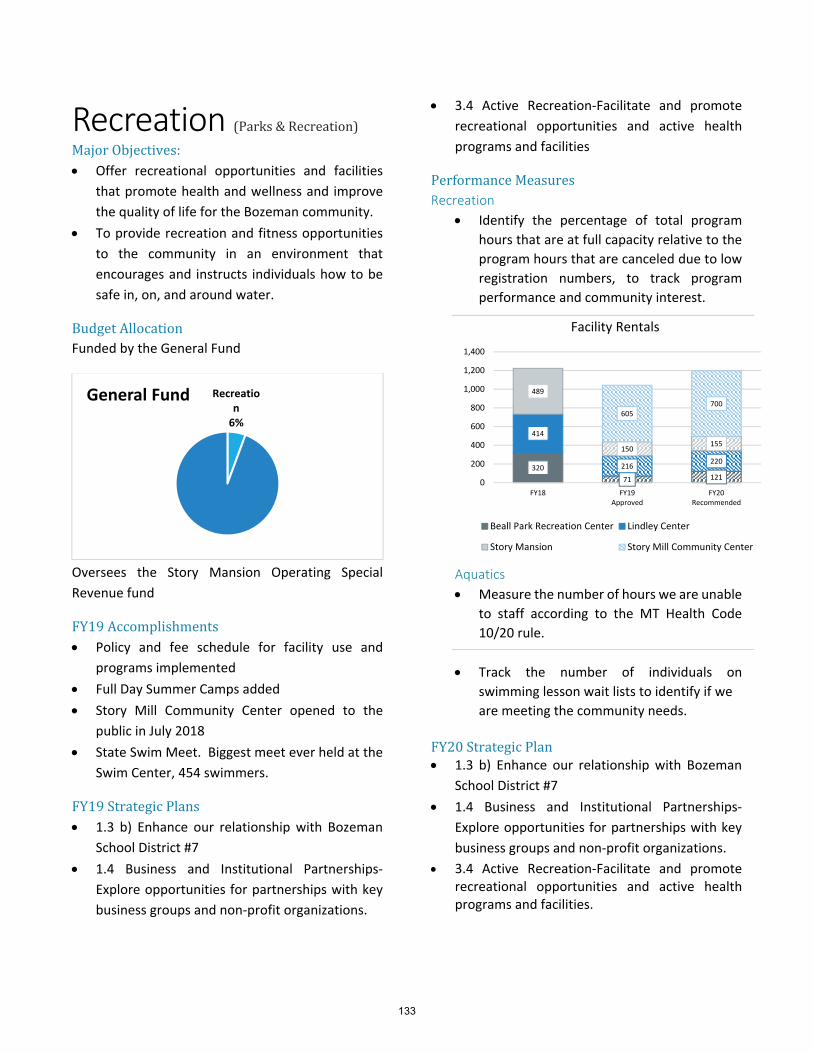
Recreation (Parks & Recreation) Major Objectives: Offer recreational opportunities and facilities
that promote health and wellness and improve
the quality of life for the Bozeman community.
To provide recreation and fitness opportunities
to the community in an environment that
encourages and instructs individuals how to be
safe in, on, and around water.
Budget Allocation Funded by the General Fund
Oversees the Story Mansion Operating Special
Revenue fund
FY19 Accomplishments Policy and fee schedule for facility use and
programs implemented
Full Day Summer Camps added
Story Mill Community Center opened to the
public in July 2018
State Swim Meet. Biggest meet ever held at the
Swim Center, 454 swimmers.
FY19 Strategic Plans 1.3 b) Enhance our relationship with Bozeman
School District #7
1.4 Business and Institutional Partnerships‐
Explore opportunities for partnerships with key
business groups and non‐profit organizations.
3.4 Active Recreation‐Facilitate and promote
recreational opportunities and active health
programs and facilities
Performance Measures Recreation
Identify the percentage of total program
hours that are at full capacity relative to the
program hours that are canceled due to low
registration numbers, to track program
performance and community interest.
Aquatics
Measure the number of hours we are unable
to staff according to the MT Health Code
10/20 rule.
Track the number of individuals on
swimming lesson wait lists to identify if we
are meeting the community needs.
FY20 Strategic Plan 1.3 b) Enhance our relationship with Bozeman
School District #7
1.4 Business and Institutional Partnerships‐
Explore opportunities for partnerships with key
business groups and non‐profit organizations.
3.4 Active Recreation‐Facilitate and promote recreational opportunities and active health programs and facilities.
Recreation6%
General Fund
320
71 121
414
216220
489
150155
605700
0
200
400
600
800
1,000
1,200
1,400
FY18 FY19Approved
FY20Recommended
Facility Rentals
Beall Park Recreation Center Lindley Center
Story Mansion Story Mill Community Center
133
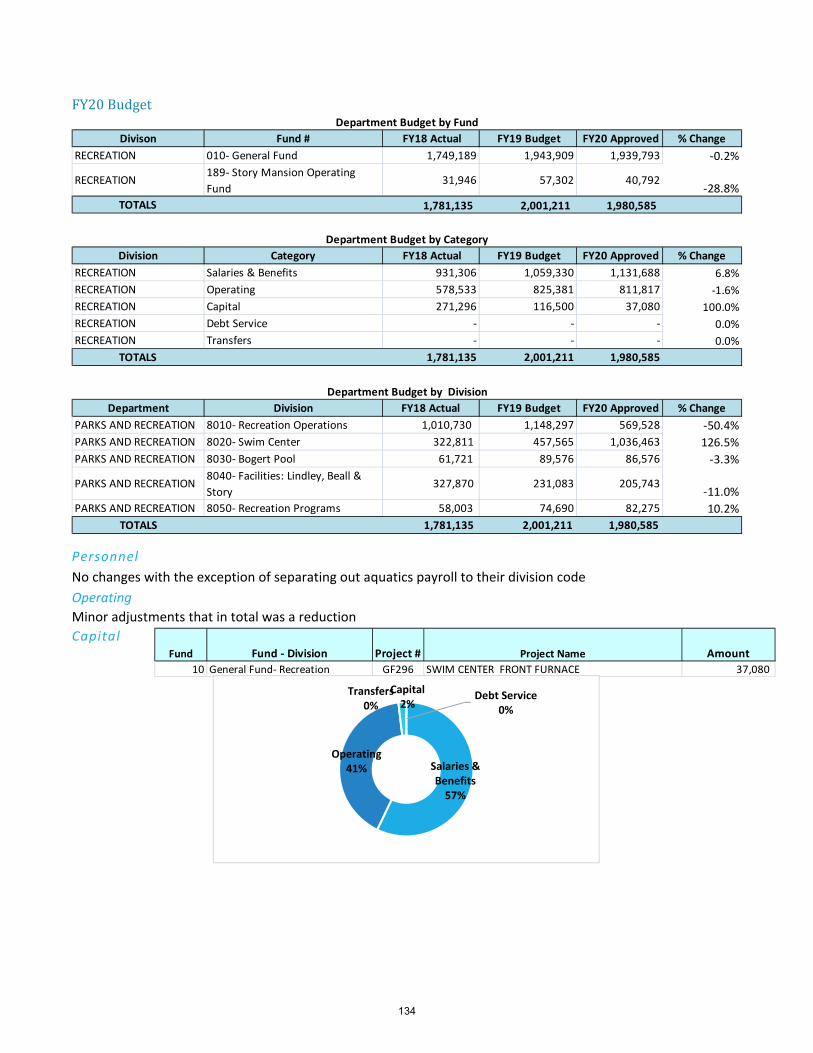
FY20 Budget
Personnel
No changes with the exception of separating out aquatics payroll to their division code
Operating
Minor adjustments that in total was a reduction
Capital
Divison Fund # FY18 Actual FY19 Budget FY20 Approved % Change
RECREATION 010‐ General Fund 1,749,189 1,943,909 1,939,793 ‐0.2%
RECREATION189‐ Story Mansion Operating
Fund 31,946 57,302 40,792
‐28.8%
TOTALS 1,781,135 2,001,211 1,980,585
Division Category FY18 Actual FY19 Budget FY20 Approved % Change
RECREATION Salaries & Benefits 931,306 1,059,330 1,131,688 6.8%
RECREATION Operating 578,533 825,381 811,817 ‐1.6%
RECREATION Capital 271,296 116,500 37,080 100.0%
RECREATION Debt Service ‐ ‐ ‐ 0.0%
RECREATION Transfers ‐ ‐ ‐ 0.0%
TOTALS 1,781,135 2,001,211 1,980,585
Department Division FY18 Actual FY19 Budget FY20 Approved % Change
PARKS AND RECREATION 8010‐ Recreation Operations 1,010,730 1,148,297 569,528 ‐50.4%
PARKS AND RECREATION 8020‐ Swim Center 322,811 457,565 1,036,463 126.5%
PARKS AND RECREATION 8030‐ Bogert Pool 61,721 89,576 86,576 ‐3.3%
PARKS AND RECREATION8040‐ Facilities: Lindley, Beall &
Story 327,870 231,083 205,743
‐11.0%
PARKS AND RECREATION 8050‐ Recreation Programs 58,003 74,690 82,275 10.2%
TOTALS 1,781,135 2,001,211 1,980,585
Department Budget by Category
Department Budget by Division
Department Budget by Fund
Fund Fund ‐ Division Project # Project Name Amount
10 General Fund‐ Recreation GF296 SWIM CENTER FRONT FURNACE 37,080
Salaries & Benefits57%
Operating41%
Capital2%
Debt Service0%
Transfers0%
134
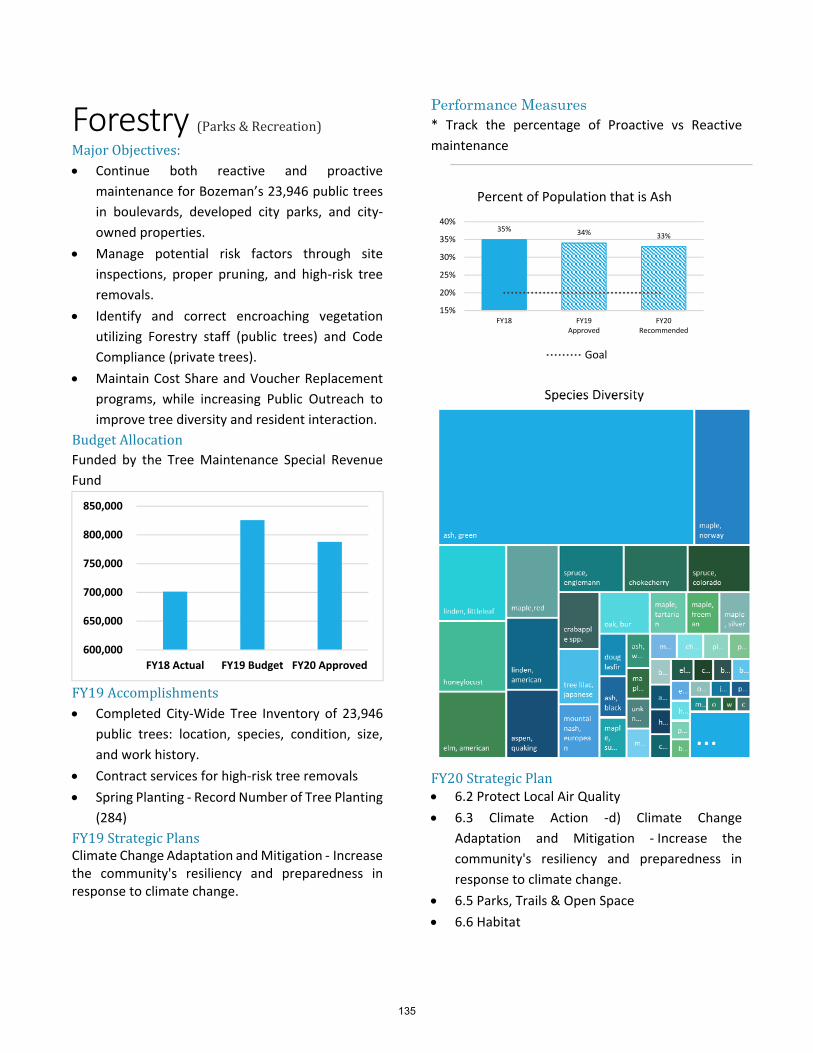
Forestry (Parks & Recreation) Major Objectives: Continue both reactive and proactive
maintenance for Bozeman’s 23,946 public trees
in boulevards, developed city parks, and city‐
owned properties.
Manage potential risk factors through site
inspections, proper pruning, and high‐risk tree
removals.
Identify and correct encroaching vegetation
utilizing Forestry staff (public trees) and Code
Compliance (private trees).
Maintain Cost Share and Voucher Replacement
programs, while increasing Public Outreach to
improve tree diversity and resident interaction.
Budget Allocation Funded by the Tree Maintenance Special Revenue
Fund
FY19 Accomplishments Completed City‐Wide Tree Inventory of 23,946
public trees: location, species, condition, size,
and work history.
Contract services for high‐risk tree removals
Spring Planting ‐ Record Number of Tree Planting
(284)
FY19 Strategic Plans Climate Change Adaptation and Mitigation ‐ Increase the community's resiliency and preparedness in response to climate change.
Performance Measures * Track the percentage of Proactive vs Reactive
maintenance
FY20 Strategic Plan 6.2 Protect Local Air Quality
6.3 Climate Action ‐d) Climate Change
Adaptation and Mitigation ‐ Increase the
community's resiliency and preparedness in
response to climate change.
6.5 Parks, Trails & Open Space
6.6 Habitat
600,000
650,000
700,000
750,000
800,000
850,000
FY18 Actual FY19 Budget FY20 Approved
35% 34% 33%
15%
20%
25%
30%
35%
40%
FY18 FY19Approved
FY20Recommended
Percent of Population that is Ash
Goal
135

FY20 Budget
Personnel
No changes
Operating
Only minor adjustment for a small reduction
Capital
Division Fund FY18 Actual FY19 Budget FY20 Approved % Change
FORESTRY 112‐ Tree Maintenance Fund 701,164 825,577 787,767 ‐4.6%
Division Category FY18 Actual FY19 Budget FY20 Approved % Change
FORRESTRY Salaries & Benefits 432,444 435,400 455,103 4.5%
FORRESTRY Operating 143,947 244,177 242,664 ‐0.6%
FORRESTRY Capital 124,773 146,000 90,000 ‐38.4%
FORRESTRY Debt Service ‐ ‐ ‐ 0.0%
FORRESTRY Transfers ‐ ‐ ‐ 0.0%
TOTALS 701,164 825,577 787,767 ‐4.6%
Department Division FY18 Actual FY19 Budget FY20 Approved % Change
PARKS AND RECREATION 7710‐ Tree Maintenance 701,164 825,577 787,767 ‐4.6%
Department Budget by Category
Department Budget by Division
Department Budget by Fund
Fund Fund ‐ Division Project # Project Name Amount
112 Forestry FOR14 Forestry Chip Truck 90,000
Salaries & Benefits58%
Operating31%
Capital11%
Debt Service0%
Transfers0%
136

Parks (Parks & Recreation) Major Objectives: Continue adding, upgrading, and maintaining
safe and quality sports fields, trail corridors,
community gathering areas, and playground
equipment.
Provide expanded maintenance and care to
restrooms, litter control, pet waste disposal, turf
care, and water conservation efforts.
Improve, maintain, and expand the trail system
in coordination with development and our
partners.
Continue to upgrade park signage for uniformity
and less maintenance.
Budget Allocation Funded mainly with the General Fund
Special Revenue fund also fund project operations
and projects
FY19 Accomplishments Opening on the Bozeman Sports Park in April of
2019. Installation of two synthetic turf fields in
spring/summer of 2019.
Assumed maintenance responsibilities of the
Story Mill Community Center grounds, with the
Story Mill Community Park slated to open later
this coming July.
Continued work, research and development of a
Parks and Trails District model for the City of
Bozeman.
FY19 Strategic Plans 3.4 Active Recreation
4.3 Strategic Infrastructure (Parks and Trails
District.)
Performance Measures Track the total number of users &
agreements (Park & Rec. programs, special
events, community teams, traveling teams,
etc.)
FY20 Strategic Plan 6.5 Parks, Trails & Open Space (PROST update)
3.4‐ Active Recreation‐ Facilitate and promote
recreational opportunities and active health
programs and facilities.
4.3‐ Prioritize long‐term investment and
maintenance for existing and new infrastructure.
A.) Develop a comprehensive parks maintenance
and facilities plan.
Parks7%
General Fund
137
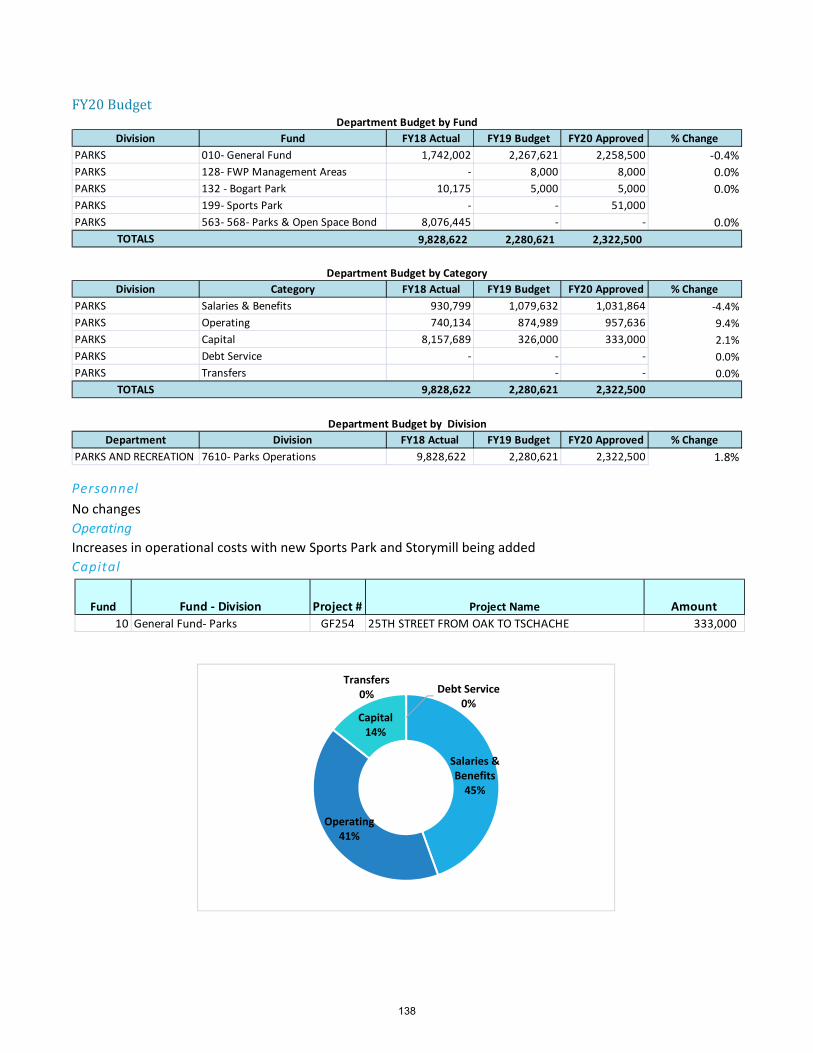
FY20 Budget
Personnel
No changes
Operating
Increases in operational costs with new Sports Park and Storymill being added
Capital
Division Fund FY18 Actual FY19 Budget FY20 Approved % Change
PARKS 010‐ General Fund 1,742,002 2,267,621 2,258,500 ‐0.4%
PARKS 128‐ FWP Management Areas ‐ 8,000 8,000 0.0%
PARKS 132 ‐ Bogart Park 10,175 5,000 5,000 0.0%
PARKS 199‐ Sports Park ‐ ‐ 51,000
PARKS 563‐ 568‐ Parks & Open Space Bond 8,076,445 ‐ ‐ 0.0%
TOTALS 9,828,622 2,280,621 2,322,500
Division Category FY18 Actual FY19 Budget FY20 Approved % Change
PARKS Salaries & Benefits 930,799 1,079,632 1,031,864 ‐4.4%
PARKS Operating 740,134 874,989 957,636 9.4%
PARKS Capital 8,157,689 326,000 333,000 2.1%
PARKS Debt Service ‐ ‐ ‐ 0.0%
PARKS Transfers ‐ ‐ 0.0%
TOTALS 9,828,622 2,280,621 2,322,500
Department Division FY18 Actual FY19 Budget FY20 Approved % Change
PARKS AND RECREATION 7610‐ Parks Operations 9,828,622 2,280,621 2,322,500 1.8%
Department Budget by Category
Department Budget by Division
Department Budget by Fund
Salaries & Benefits45%
Operating41%
Capital14%
Debt Service0%
Transfers0%
Fund Fund ‐ Division Project # Project Name Amount
10 General Fund‐ Parks GF254 25TH STREET FROM OAK TO TSCHACHE 333,000
138
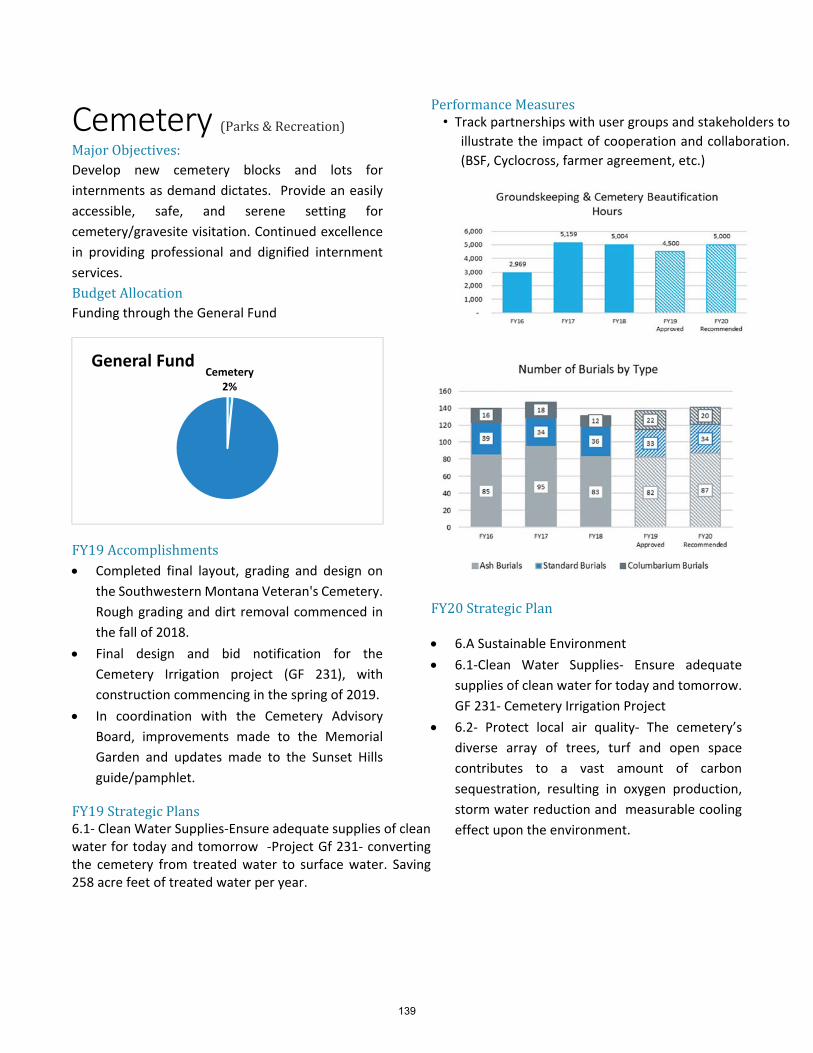
Cemetery (Parks & Recreation) Major Objectives: Develop new cemetery blocks and lots for
internments as demand dictates. Provide an easily
accessible, safe, and serene setting for
cemetery/gravesite visitation. Continued excellence
in providing professional and dignified internment
services.
Budget Allocation Funding through the General Fund
FY19 Accomplishments Completed final layout, grading and design on
the Southwestern Montana Veteran's Cemetery.
Rough grading and dirt removal commenced in
the fall of 2018.
Final design and bid notification for the
Cemetery Irrigation project (GF 231), with
construction commencing in the spring of 2019.
In coordination with the Cemetery Advisory
Board, improvements made to the Memorial
Garden and updates made to the Sunset Hills
guide/pamphlet.
FY19 Strategic Plans 6.1‐ Clean Water Supplies‐Ensure adequate supplies of clean water for today and tomorrow ‐Project Gf 231‐ converting the cemetery from treated water to surface water. Saving 258 acre feet of treated water per year.
Performance Measures • Track partnerships with user groups and stakeholders to
illustrate the impact of cooperation and collaboration.
(BSF, Cyclocross, farmer agreement, etc.)
FY20 Strategic Plan 6.A Sustainable Environment
6.1‐Clean Water Supplies‐ Ensure adequate
supplies of clean water for today and tomorrow.
GF 231‐ Cemetery Irrigation Project
6.2‐ Protect local air quality‐ The cemetery’s
diverse array of trees, turf and open space
contributes to a vast amount of carbon
sequestration, resulting in oxygen production,
storm water reduction and measurable cooling
effect upon the environment.
Cemetery2%
General Fund
139

FY20 Budget
Personnel
No changes
Operating
Slight increase in operational costs
Capital
Division Fund FY18 Actual FY19 Budget FY20 Approved % Change
CEMETERY 010‐ General Fund 521,580 821,433 541,628 ‐34.1%
Division Category FY18 Actual FY19 Budget FY20 Approved % Change
CEMETERY Salaries & Benefits 326,694 329,669 354,994 7.7%
CEMETERY Operating 150,019 137,764 141,634 2.8%
CEMETERY Capital 44,867 354,000 45,000 ‐87.3%
CEMETERY Debt Service ‐ ‐ ‐ 0.0%
CEMETERY Transfers ‐ ‐ ‐ 0.0%
TOTALS 521,580 821,433 541,628 ‐34.1%
Department Division FY18 Actual FY19 Budget FY20 Approved % Change
PARKS AND RECREATION 7210‐ Cemetery Operations 521,580 821,433 541,628 ‐34.1%
Department Budget by Category
Department Budget by Division
Department Budget by Fund
Fund Fund ‐ Division Project # Project Name Amount
10 General Fund‐ Cemetery GF268 SW MT VETERAN'S CEMETERY 45,000
Salaries & Benefits66%
Operating26%
Capital8%
Debt Service0%
Transfers0%
140

Library Major Objectives: Space ‐ Design & Implement an expansion to
ensure that the Library has adequate space to
Bozeman's growing needs.
Technology ‐ Use technology & digital resources
to enhance the Library experience.
Programming ‐ Provide unique programming to
inform & enrich the lives of target audiences of
Library users.
Outreach ‐ Engage new & broader audiences in
taking advantage of the Library's resources.
Budget Allocation Funded through the General fund
A construction fund is setup for Library Maintenance
which is funded by up to 2% of unspent
appropriation from the prior year.
FY19 Accomplishments Library Strategic Plan for 2018‐2021 ‐ Continue
to implement the strategic plan: making
progress on increasing Library Space,
Technology, Programming and Outreach.
Bookmobile –”Information on the Go” ‐ In our first year on the road, the Bookmobile checked out 23,586 items in FY2018. This was 12% of the total items checked out at Bozeman Public Library. Out of the 23,586 total checkouts, 17,527 items were children’s books.
FY19 Strategic Plans 5.1 a) Library Expansion Planning ‐Currently working on an RFQ for a Master Plan of the existing building and grounds. Partnership with the Bozeman Public Schools for a BPL presence in the new High School Library.
Performance Measures
Measure children’s use of the Bookmobile
over time to track the mobile library’s
effectiveness in helping to raise the rate of
early childhood literacy within the Bozeman
community.
FY20 Strategic Plan 5.1 a) Library Expansion Planning ‐Currently
working on an RFQ for a Master Plan of the existing building and grounds. Partnership with the Bozeman Public Schools for a BPL presence in the new High School Library.
Partner with Economic Development to make progress on City Strategic Plan number 2.1 – Business Growth.
Library7%
General Fund
0
200
400
600
800
1000
0
5,000
10,000
15,000
20,000
25,000 Program
s Provid
ed
Program
Atten
dan
ce
Library Programs Offered vs Attendance
Adult Programs Attendance
Children's Programs Attendance
Adult Programs Provided
Children's Programs Provided
141

FY20 Budget
Personnel
No change
Operating
Increase in subscriptions and updating the carpet throughout the Library
Capital
None
Department Fund FY18 Actual FY19 Budget FY20 Approved % Change
LIBRARY 010‐ General Fund 2,024,518 2,181,510 2,244,974 2.9%
LIBRARY561‐ Library Depreciation
Fund 18,612 32,000 280,000
775.0%
TOTALS 2,043,130 2,213,510 2,524,974
Department Category FY18 Actual FY19 Budget FY20 Approved % Change
LIBRARY Salaries & Benefits 1,545,603 1,606,758 1,687,401 5.0%
LIBRARY Operating 497,527 606,752 837,573 38.0%
LIBRARY Capital ‐ ‐ ‐ 0.0%
LIBRARY Debt Service ‐ ‐ ‐ 0.0%
LIBRARY Transfers ‐ ‐ ‐ 0.0%
TOTALS 2,043,130 2,213,510 2,524,974
Department Division FY18 Actual FY19 Budget FY20 Approved % Change
LIBRARY 7810‐ Library Operations 739,014 894,028 1,037,157 16.0%
LIBRARY 7820‐ Technical Services 300,147 310,913 318,245 2.4%
LIBRARY 7830‐ Information Services 418,587 439,099 495,148 12.8%
LIBRARY 7840‐ Children's Services 164,777 157,009 193,661 23.3%
LIBRARY 7850‐ Circulation Services 420,605 412,461 480,763 16.6%
TOTALS 2,043,130 2,213,510 2,524,974
Department Budget by Category
Department Budget by Division
Department Budget by Fund
Salaries & Benefits67%
Operating33%
Capital0% Debt Service
0%
Transfers0%
142

Economic Development Major Objectives: Increasing economic activity that improves our
community’s prosperity;
Supporting innovation and encouraging growth
in mid‐to‐high wage sectors; and
Facilitating the creation of mid‐to‐high paying
jobs/high quality employment to match the high
quality of life.
Budget Allocation Funded Operationally from the General Fund
Oversees the programming of Special Revenue Fund,
which includes Urban Renewal Districts.
FY19 Accomplishments Big Sky Trust Fund ‐ $442,500 Awarded, 75 bobs
(49 created to date)
Collaboration with the Bozeman Public Library ‐
Business Consultation Hours (Blackstone
Launchpad and SBDC), MicroMegas Podcats, and
Economic Impact Analysis
Urban renewal projects
Performance Measures Track the Big Sky Trust Fund grant values and
associated number of jobs created.
FY20 Strategic Plan 2.1 Business Growth ‐ Support retention and
growth of both the traded and local business
sectors while welcoming and encouraging new
and existing businesses.
2.2 Infrastructure Investments ‐ Strategically
invest in infrastructure as a mechanism to
encourage economic development.
2.3 Workforce Development ‐ Support education
and workforce development initiatives to
improve the skills of our citizens.
Economic Development1%
General Fund
010‐General Fund10%
116‐Dowtown TIF District
36%143‐ North 7th
Corridor TIF District
33%
144‐North East Urban Renewal TIF District
10%
176‐Downtown
BID3%
191‐Tourism BID6%
$985,532 $1,081,545 $1,232,868 $1,254,091 $1,321,823
$686,023 $651,949 $600,687 $600,000 $600,000
$‐
$500,000
$1,000,000
$1,500,000
$2,000,000
$2,500,000
FY16 FY17 FY18 FY19Approved
FY20Recommended
Urban Renewal District Increment Value
South Bozeman Technology District
Northeast Neighborhood URD
North Park URD
Midtown URD
Downtown TIF
$15.4
$7.0 $6.9
$1.7
$2.6
$5.3 $5.9
$6.7$7.5
$0.8
$2.5 $0.9
$1.6$1.8
$3.2
$3.6 $4.6
$‐
$5
$10
$15
$20
FY16 FY17 FY18 FY19Approved
FY20Recommended
Millions of Dollars
Urban Renewal District Building Permit Valuations
(Millions of Dollars)
South Bozeman Technology District
Northeast Neighborhood URD
North Park URD
Midtown URD
Downtown TIF
143
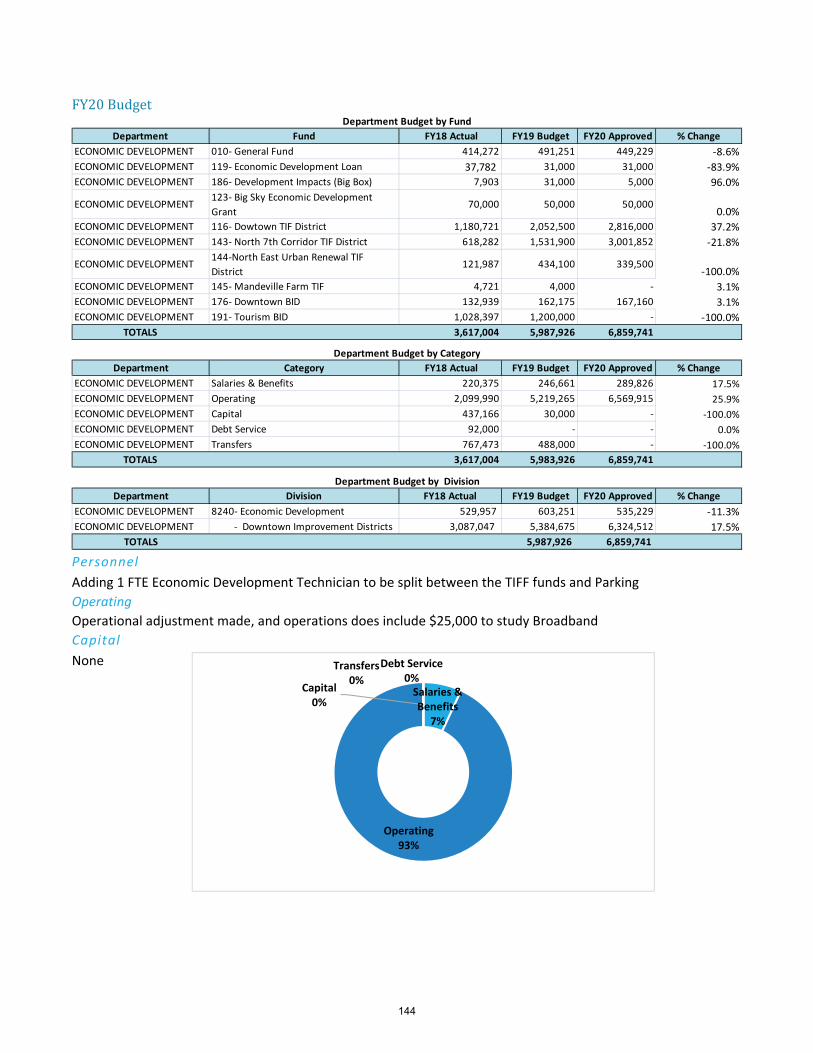
FY20 Budget
Personnel
Adding 1 FTE Economic Development Technician to be split between the TIFF funds and Parking
Operating
Operational adjustment made, and operations does include $25,000 to study Broadband
Capital
None
Department Fund FY18 Actual FY19 Budget FY20 Approved % Change
ECONOMIC DEVELOPMENT 010‐ General Fund 414,272 491,251 449,229 ‐8.6%
ECONOMIC DEVELOPMENT 119‐ Economic Development Loan 37,782 31,000 31,000 ‐83.9%
ECONOMIC DEVELOPMENT 186‐ Development Impacts (Big Box) 7,903 31,000 5,000 96.0%
ECONOMIC DEVELOPMENT123‐ Big Sky Economic Development
Grant 70,000 50,000 50,000
0.0%
ECONOMIC DEVELOPMENT 116‐ Dowtown TIF District 1,180,721 2,052,500 2,816,000 37.2%
ECONOMIC DEVELOPMENT 143‐ North 7th Corridor TIF District 618,282 1,531,900 3,001,852 ‐21.8%
ECONOMIC DEVELOPMENT144‐North East Urban Renewal TIF
District 121,987 434,100 339,500
‐100.0%
ECONOMIC DEVELOPMENT 145‐ Mandeville Farm TIF 4,721 4,000 ‐ 3.1%
ECONOMIC DEVELOPMENT 176‐ Downtown BID 132,939 162,175 167,160 3.1%
ECONOMIC DEVELOPMENT 191‐ Tourism BID 1,028,397 1,200,000 ‐ ‐100.0%
TOTALS 3,617,004 5,987,926 6,859,741
Department Category FY18 Actual FY19 Budget FY20 Approved % Change
ECONOMIC DEVELOPMENT Salaries & Benefits 220,375 246,661 289,826 17.5%
ECONOMIC DEVELOPMENT Operating 2,099,990 5,219,265 6,569,915 25.9%
ECONOMIC DEVELOPMENT Capital 437,166 30,000 ‐ ‐100.0%
ECONOMIC DEVELOPMENT Debt Service 92,000 ‐ ‐ 0.0%
ECONOMIC DEVELOPMENT Transfers 767,473 488,000 ‐ ‐100.0%
TOTALS 3,617,004 5,983,926 6,859,741
Department Division FY18 Actual FY19 Budget FY20 Approved % Change
ECONOMIC DEVELOPMENT 8240‐ Economic Development 529,957 603,251 535,229 ‐11.3%
ECONOMIC DEVELOPMENT ‐ Downtown Improvement Districts 3,087,047 5,384,675 6,324,512 17.5%
TOTALS 5,987,926 6,859,741
Department Budget by Category
Department Budget by Division
Department Budget by Fund
Salaries & Benefits
7%
Operating93%
Capital0%
Debt Service0%
Transfers0%
144

Sustainability (Strategic Services) Major Objectives: Advance our utility tracking capabilities and
reporting
Develop a Climate Action & Resiliency Plan
Implement the 2019 Climate Vulnerability
Assessment & Resiliency Strategy
Explore a building energy stretch code Budget Allocation Funded by the General Fund (only 0.48% of the fund
expenditures)
FY19 Accomplishments New outreach materials for residential efficiency
Expanded partnerships with local stakeholders
to support solar powered transportation
FY19 Strategic Plans Climate Vulnerability Assessment & Resiliency
Strategy (Climate Change Adaptation &
Mitigation, 6.3.d)
Performance Measures Track the savings realized from upgrades
made to commercial buildings through the
Bozeman Energy Project.
o FY15‐19: $19,792 incentives
distributed
o 165,256 kWh saved (equivalent to
removing 25 passenger vehicles for
one year)
o 38,220 gallons of water saved
o $17,854 in annual small business
savings
Measure and communicate municipal
energy consumption including buildings,
infrastructure, and fleet.
Monitor community greenhouse gas
emissions to inform adopted goals for
reduction.
FY20 Strategic Plan Update the Climate Action Plan 6.3.a ‐ Builds
upon Vulnerability Assessment & Resiliency
Strategy
Create Solar Energy Policies 6.3.c ‐ Review
Bozeman Solar Project three‐year data, and use
data to advise City goals for solar project and
engage with NorthWestern Energy
Explore Sustainable Technology 7.3.b ‐ Advanced
metering at WRF & WTP and dashboarding
performance matrix.
Sustainability 0%
Genral Fund
145
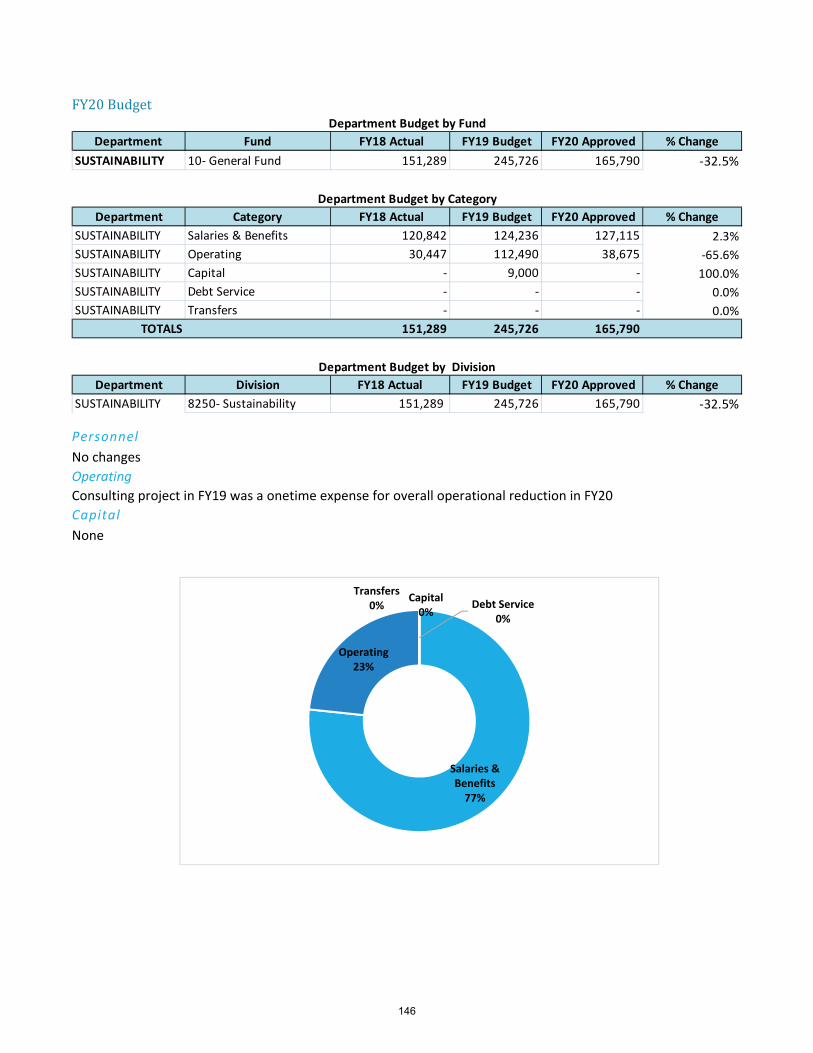
FY20 Budget
Personnel
No changes
Operating
Consulting project in FY19 was a onetime expense for overall operational reduction in FY20
Capital
None
Department Fund FY18 Actual FY19 Budget FY20 Approved % Change
SUSTAINABILITY 10‐ General Fund 151,289 245,726 165,790 ‐32.5%
Department Category FY18 Actual FY19 Budget FY20 Approved % Change
SUSTAINABILITY Salaries & Benefits 120,842 124,236 127,115 2.3%
SUSTAINABILITY Operating 30,447 112,490 38,675 ‐65.6%
SUSTAINABILITY Capital ‐ 9,000 ‐ 100.0%
SUSTAINABILITY Debt Service ‐ ‐ ‐ 0.0%
SUSTAINABILITY Transfers ‐ ‐ ‐ 0.0%
TOTALS 151,289 245,726 165,790
Department Division FY18 Actual FY19 Budget FY20 Approved % Change
SUSTAINABILITY 8250‐ Sustainability 151,289 245,726 165,790 ‐32.5%
Department Budget by Category
Department Budget by Fund
Department Budget by Division
Salaries & Benefits77%
Operating23%
Capital0%
Debt Service0%
Transfers0%
146

Affordable Housing (Community Development) Major Objectives: Provide down‐payment assistance & low‐
interest loans
Offer impact fee reimbursement for affordable
housing projects
Match funds for low‐interest tax credit project
applications.
Budget Allocation Funded by the Workforce Housing Special Revenue
Fund
FY19 Accomplishments Construction and sale of eight affordable
Housing Units in 2018.
Adoption of affordable housing Ordinance No.
2012 amending provisions of Chapter 38, Article
380 of the Bozeman Municipal Code in order to
further the city’s affordable housing goals.
Creation of Affordable Housing Manual and
education material.
FY19 Strategic Plans Develop a Comprehensive Affordable Housing Action Plan that does the following: (Objective 4.5b)
Mandates the creation of affordable housing across all dwelling unit types.
Provides the prescribed flexibility in the manner in which the mandate can be accomplished
Provides a substantial, broad‐based and reliable source of funding for the construction of affordable housing and for affordable housing loans
Actively encourages Bozeman’s major employers to develop workforce housing programs for their employees (Ongoing meetings and efforts regarding this issue)
Performance Measures
Track the number of Affordable units Constructed that were mandated by Inclusionary Zoning Ordinance as well as other units facilitated or incentivized.
Monitor the number of units in approved housing plans.
Track the Cash‐in‐Lieu funds received. FY20 Strategic Plan A Well Planned City | Housing & Transportation Choices (Objective 4.5b, 1‐4)
Affordable Housing Action Plan Consultant Fund Request | $30K
HRDC Homebuyer Education Contract | $20K
HRDC Pre‐purchase Counseling Contract | $20K
Impact Fee or Down Payment Assistance | $200K
Funding for Salary and Training of Affordable Housing Manager | ~$60K Salary & $5K Training
‐
200,000
400,000
600,000
800,000
1,000,000
FY18 Actual FY19 Budget FY20Approved
147
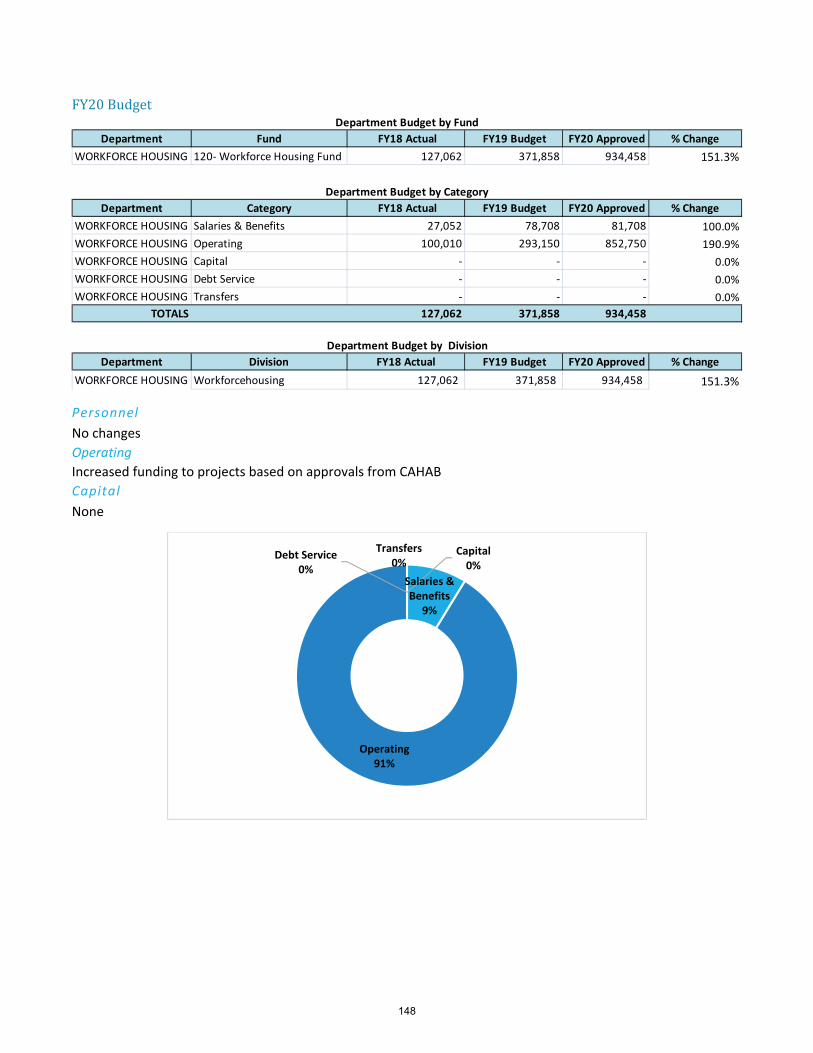
FY20 Budget
Personnel
No changes
Operating
Increased funding to projects based on approvals from CAHAB
Capital
None
Department Fund FY18 Actual FY19 Budget FY20 Approved % Change
WORKFORCE HOUSING 120‐ Workforce Housing Fund 127,062 371,858 934,458 151.3%
Department Category FY18 Actual FY19 Budget FY20 Approved % Change
WORKFORCE HOUSING Salaries & Benefits 27,052 78,708 81,708 100.0%
WORKFORCE HOUSING Operating 100,010 293,150 852,750 190.9%
WORKFORCE HOUSING Capital ‐ ‐ ‐ 0.0%
WORKFORCE HOUSING Debt Service ‐ ‐ ‐ 0.0%
WORKFORCE HOUSING Transfers ‐ ‐ ‐ 0.0%
TOTALS 127,062 371,858 934,458
Department Division FY18 Actual FY19 Budget FY20 Approved % Change
WORKFORCE HOUSING Workforcehousing 127,062 371,858 934,458 151.3%
Department Budget by Category
Department Budget by Fund
Department Budget by Division
Salaries & Benefits
9%
Operating91%
Capital0%
Debt Service0%
Transfers0%
148

Non‐DepartmentalAbout:
The Non‐Departmental unit accounts for expenditures that are not associated with a specific city department.
Examples include insurance premiums paid by the City, costs of leave pay‐outs for terminating employees,
contingency funds, etc.
Major Objectives:
To accurately budget and account for non‐departmental costs.
Budget Issues and Details
General Fund General fund allocation of liability & property insurance ‐ $491,391;
General fund
o Contribution to the band ‐ $10,440; Professional services for the landfill, $25,000; Contingency
appropriation ‐ $150,000; HRDC Streamline $150,000; HRDC Streamline Grant match of $20,000
and HRDC Fork & Spoon $25,000
Police & Fire state share retirement (non‐cash) ‐ $2,668,262;
Debt service fund for Intercap loan for Bronken and Storymill projects ‐ $40,480
Transfer to Landfill Monitoring Fund ‐ $280,000; Transfer to Stormwater Fund for Landfill Loan payments
‐ $75,000;
Debt items
Fund Category Division FY18 Actual FY19 Budget FY20 Approved
10 Operating Insurance 455,208 298,182 491,391
10 Operating General 99,643 457,684 380,440
10 Operating General (non‐Cash) ‐ 2,400,348 2,668,262
10 Debt Debt Service Intercap ‐ ‐ 40,480
10 Transfers Transfers 632,084 491,188 355,000
1,186,935 3,647,402 3,935,573
103 Transfers Transfers ‐ Insurance 2,407,104 2,654,566 2,815,384
175 Operating General ‐ Galavan 100,678 104,321 108,490
501 Construction BPSC ‐ ‐ 40,115,362
720 Operating Insurance 4,814,465 4,820,912 5,044,794
Fund Category Fun Name FY18 Actual FY19 Budget FY20 Approved
300 Transfers SID Revolving Loan Fund ‐ 224,011 867,070
303 Debt Service G.O. Refunding Series 2012 276,500 276,900 273,300
304 Debt Service Parks and Open Space Bond 1,081,238 1,088,138 1,076,788
305 Debt Service 2007 Downtown TIF Bonds 422,288 423,673 418,898
307 Debt Service Bozeman Public Safety Center ‐ ‐ 1,641,716
307 Transfers Bozeman Public Safety Center ‐ ‐ 36,735,000
310‐448 Debt Service SID funds 972 385,800 1,000
450 Debt Service Sports Park Turf Loan ‐ 32,000
** Estimated in the process of issuing first part of FY20
149

Below are the budget details followed by the debt schedules (Note: Bozeman Public Safety Center bonds have
yet to be issued so the schedule is not included and half year payment is an estimate).
Payment Principal Interest Interest Semi‐Annual Principal
Due Payment Rate Payment Payment Balance
7/1/2019 215,000.00 2.000% 77,706.25 292,706.25 4,360,000.00
1/1/2020 ‐ 75,556.25 75,556.25
7/1/2020 215,000.00 2.000% 75,556.25 290,556.25 4,145,000.00
1/1/2021 ‐ 73,406.25 73,406.25
7/1/2021 220,000.00 2.250% 73,406.25 293,406.25 3,925,000.00
1/1/2022 ‐ 71,206.25 71,206.25
7/1/2022 225,000.00 2.250% 71,206.25 296,206.25 3,700,000.00
1/1/2023 ‐ 68,675.00 68,675.00
7/1/2023 230,000.00 2.500% 68,675.00 298,675.00 3,470,000.00
1/1/2024 ‐ 65,800.00 65,800.00
7/1/2024 235,000.00 2.500% 65,800.00 300,800.00 3,235,000.00
1/1/2025 ‐ 62,862.50 62,862.50
7/1/2025 245,000.00 2.500% 62,862.50 307,862.50 2,990,000.00
1/1/2026 ‐ 59,800.00 59,800.00
7/1/2026 250,000.00 4.000% 59,800.00 309,800.00 2,740,000.00
1/1/2027 ‐ 54,800.00 54,800.00
7/1/2027 260,000.00 4.000% 54,800.00 314,800.00 2,480,000.00
1/1/2028 ‐ 49,600.00 49,600.00
7/1/2028 270,000.00 4.000% 49,600.00 319,600.00 2,210,000.00
1/1/2029 ‐ 44,200.00 44,200.00
7/1/2029 280,000.00 4.000% 44,200.00 324,200.00 1,930,000.00
1/1/2030 ‐ 38,600.00 38,600.00
7/1/2030 290,000.00 4.000% 38,600.00 328,600.00 1,640,000.00
1/1/2031 ‐ 32,800.00 32,800.00
7/1/2031 305,000.00 4.000% 32,800.00 337,800.00 1,335,000.00
1/1/2032 ‐ 26,700.00 26,700.00
7/1/2032 315,000.00 4.000% 26,700.00 341,700.00 1,020,000.00
1/1/2033 ‐ 20,400.00 20,400.00
7/1/2033 325,000.00 4.000% 20,400.00 345,400.00 695,000.00
1/1/2034 ‐ 13,900.00 13,900.00
7/1/2034 340,000.00 4.000% 13,900.00 353,900.00 355,000.00
1/1/2035 ‐ 7,100.00 7,100.00
7/1/2035 355,000.00 4.000% 7,100.00 362,100.00 ‐
TOTALS 5,100,000.00 2,266,840.63 7,366,840.63
CITY OF BOZEMAN
General Obligation Refunding Bonds, Trails, Open Space & Parks, Series 2014
DEBT SERVICE SCHEDULE
150

Payment Principal Interest Interest Semi‐Annual Principal
Due Payment Rate Payment Payment Balance
7/1/2019 420,000.00 2.000% 146,362.50 566,362.50 8,045,000.00
1/1/2020 ‐ 142,162.50 142,162.50
7/1/2020 430,000.00 2.250% 142,162.50 572,162.50 7,615,000.00
1/1/2021 ‐ 137,325.00 137,325.00
7/1/2021 435,000.00 2.500% 137,325.00 572,325.00 7,180,000.00
1/1/2022 ‐ 131,887.50 131,887.50
7/1/2022 450,000.00 2.750% 131,887.50 581,887.50 6,730,000.00
1/1/2023 ‐ 125,700.00 125,700.00
7/1/2023 460,000.00 3.000% 125,700.00 585,700.00 6,270,000.00
1/1/2024 ‐ 118,800.00 118,800.00
7/1/2024 475,000.00 2.800% 118,800.00 593,800.00 5,795,000.00
1/1/2025 ‐ 112,150.00 112,150.00
7/1/2025 490,000.00 3.250% 112,150.00 602,150.00 5,305,000.00
1/1/2026 ‐ 104,187.50 104,187.50
7/1/2026 505,000.00 3.500% 104,187.50 609,187.50 4,800,000.00
1/1/2027 ‐ 95,350.00 95,350.00
7/1/2027 520,000.00 3.750% 95,350.00 615,350.00 4,280,000.00
1/1/2028 ‐ 85,600.00 85,600.00
7/1/2028 540,000.00 4.000% 85,600.00 625,600.00 3,740,000.00
1/1/2029 ‐ 74,800.00 74,800.00
7/1/2029 565,000.00 4.000% 74,800.00 639,800.00 3,175,000.00
1/1/2030 ‐ 63,500.00 63,500.00
7/1/2030 585,000.00 4.000% 63,500.00 648,500.00 2,590,000.00
1/1/2031 ‐ 51,800.00 51,800.00
7/1/2031 610,000.00 4.000% 51,800.00 661,800.00 1,980,000.00
1/1/2032 ‐ 39,600.00 39,600.00
7/1/2032 635,000.00 4.000% 39,600.00 674,600.00 1,345,000.00
1/1/2033 ‐ 26,900.00 26,900.00
7/1/2033 660,000.00 4.000% 26,900.00 686,900.00 685,000.00
1/1/2034 ‐ 13,700.00 13,700.00
7/1/2034 685,000.00 4.000% 13,700.00 698,700.00 ‐
TOTALS 9,900,000.00 4,355,805.28 14,255,805.28
CITY OF BOZEMAN
General Obligation Refunding Bonds, Trails, Open Space & Parks, Series 2013
DEBT SERVICE SCHEDULE
151

Payment Principal Interest Interest Semi‐Annual Principal
Due Payment Rate Payment Payment Balance
7/1/2019 260,000.00 2.000% 7,950.00 267,950.00 535,000.00
1/1/2020 ‐ 5,350.00 5,350.00
7/1/2020 265,000.00 2.000% 5,350.00 270,350.00 270,000.00
1/1/2021 ‐ 2,700.00 2,700.00
7/1/2021 270,000.00 2.000% 2,700.00 272,700.00 ‐
TOTALS 3,080,000.00 250,394.38 3,330,394.38
CITY OF BOZEMAN
General Obligation Refunding Bonds, Series 2012
DEBT SERVICE SCHEDULE
Payment Principal Interest Interest Semi-Annual PrincipalDate Payment Rate Payment Payment Balance
7/1/2019 220,000.00 4.25 101,786.25 321,786.25 3,995,000.00
1/1/2020 - - 97,111.25 97,111.25
7/1/2020 230,000.00 4.40 97,111.25 327,111.25 3,765,000.00
1/1/2021 - - 92,051.25 92,051.25
7/1/2021 240,000.00 4.50 92,051.25 332,051.25 3,525,000.00
1/1/2022 - - 86,651.25 86,651.25
7/1/2022 250,000.00 4.60 86,651.25 336,651.25 3,275,000.00
1/1/2023 - - 80,901.25 80,901.25
7/1/2023 260,000.00 4.70 80,901.25 340,901.25 3,015,000.00
1/1/2024 - - 74,791.25 74,791.25
7/1/2024 275,000.00 4.80 74,791.25 349,791.25 2,740,000.00
1/1/2025 - - 68,191.25 68,191.25
7/1/2025 290,000.00 4.95 68,191.25 358,191.25 2,450,000.00
1/1/2026 - - 61,013.75 61,013.75
7/1/2026 300,000.00 4.95 61,013.75 361,013.75 2,150,000.00
1/1/2027 - - 53,588.75 53,588.75
7/1/2027 315,000.00 4.95 53,588.75 368,588.75 1,835,000.00
1/1/2028 - - 45,792.50 45,792.50
7/1/2028 330,000.00 4.95 45,792.50 375,792.50 1,505,000.00
1/1/2029 - - 37,625.00 37,625.00
7/1/2029 350,000.00 5.00 37,625.00 387,625.00 1,155,000.00
1/1/2030 - - 28,875.00 28,875.00
7/1/2030 365,000.00 5.00 28,875.00 393,875.00 790,000.00
1/1/2031 - - 19,750.00 19,750.00
7/1/2031 385,000.00 5.00 19,750.00 404,750.00 405,000.00
1/1/2032 - - 10,125.00 10,125.00
7/1/2032 405,000.00 5.00 10,125.00 415,125.00 -
TOTALS 4,215,000.00 1,614,721.25 5,829,721.25
CITY OF BOZEMANTAX INCREMENT URBAN RENEWAL REVENUE BONDS, SERIES 2007
(DOWNTOWN BOZEMAN IMPROVEMENT DISTRICT)DEBT SERVICE SCHEDULE
152

CAPITAL EXPENDITURES
SUMMARY
153

Capital Expenditure Summary The CIP includes any planned expenditure of $10,000 or greater, that results in the acquisition of an asset with a
useful life of 3 years or more. There is a couple of “exceptions” or “extensions” of this definition that we have
found helpful and necessary in past years:
General Planning Documents (master plans, community surveys, etc.) are NOT included in our CIP.
Specific plans that involve pre‐engineering or preliminary design of facilities are often (but not always)
included in the CIP.
Software purchases that could potentially be “software as a service”. Cloud based services are beginning
to replace our purchase of outright software and hardware. In the CIP, we have treated the software
projects as a capital outlay purchase; although a “service” type, solution may actually be chosen during
the bidding/proposal process.
State law and City charter require the City to prepare the CIP. State Law requires the City to maintain a Capital
Improvement Plan for our Development Impact Fee programs. Under Montana Code Annotated (MCA), this
Capital Improvement Plan provides the schedules and cost projections required under MCA §7‐6‐1602(2)(k)(i‐iv).
In Article 5.06 of the adopted City Charter, the City Manager is responsible for preparing and submitting a multi‐
year capital program to the City Commission no later than December 15 for the ensuing fiscal year.
This five‐year plan includes long‐range plans for our current facilities while keeping in mind level of service
standards. In a community with relatively high cost of living, the ability of citizens to afford the needed utility rate,
fee, and assessment levels is of concern. At the same time, the City strives to keep existing facilities properly
maintained — and not pass deferred maintenance costs and problems on to future generations. The staff have
taken a lot of time and care in preparing this document. The efforts toward our Strategic Plan when developing
our plan.
StrategicPlan Engaged Community: By making technology improvements we have been able to make this Capital
Improvement Plan more concise, informative and citizen‐user friendly. The Lasher Fiche upgrade (GF337) will
aid in our efforts for 1.1 b‐Dramatically increase transparency and create access to all city documents.
InnovativeEconomy: The General fund includes a project for Fiber Optic Conduit this aids in our efforts for 2.2 a Identify Commercial/ Industrial Infrastructure Needs.
Safe,WelcomingCommunity: o 3.1 a‐Develop a Criminal Justice Facility Plan and 3.1 c‐Implement the Fire Station Location Plan with
the Bozeman Public Safety Center and later in the capital plan Fire Station 2 relocation is scheduled
for FY23.
o Both Police and Fire FY20 has the second payment for the radio lease with Gallatin County as part of
3.1 d Update Public Safety Technology Systems.
o 3.4 Active Recreation is included throughout the General fund plan with many projects that encourage
and promote active recreation such as the proposed aquatics/recreation center (GF056). We have
several park amenities proposed with splashpads and pickleball courts in the plan as well.
Well‐PlannedCity:
154

o Software investment in the Public Works administration Fund works towards 4.1 c ‐GIS Land Use &
Infrastructure Development Tracking. o The Wastewater fund and Wastewater Impact fund have many projects that achieve 4.3 b Increase
Capacity of Sewer Pipes to Accommodate Development Projects. o We have proposed the creation of a Parks and Trails Maintenance District that works towards 4.3 a
Develop a Comprehensive Parks Maintenance Facilities Funding Program that would provide funding
for Parks’ capital needs. o All the road projects funded by the Street Impact Fee fund and Arterial & Collector fund will include
bike lanes and aid in our efforts towards 4.5 a Enhance Non‐motorized Transportation. In addition,
every year the Street Maintenance fund has allocation of $25,000 annually for bike path
improvements and some additional project are planned n FY20 increase the amount.
Creative,LearningCulture: As other efforts work towards this visions efforts and identify projects they will be added to this plan when they meet the capital plan definition.
SustainableEnvironment: The Water fund with the Water Conservation have a project to create a water
conservation and efficiency plan in 2020 to achieve 6.2 a Watershed Management, which is to develop and
implement a regional watershed approach.
HighPerformanceOrganization: o This year we worked towards item 7.1 b ‐Create a Culture of Innovation by changing our CIP database
system for project tracking and plan development. We are now using our city‐wide budgeting
system’s project module for all CIP items. This will make it easier to merge approved projects into the
approved budget, begin tracking projects in their initial stages, and give us increased project cost
reporting. We are also recommending that we continue to innovate the plan for next year by
increasing the CIP threshold from its current level of $10,000 to a new minimum level of $25,000. For
the FY21 to FY25 CIP we recommend using a $25,000 threshold. This will align us with best practices
and allow us to make better capital decisions by focusing on true capital items and less maintenance
and operational expenses.
o This year we started earlier specifically with Finance and Public Works to improve the process, this
aids in our efforts towards strategic plan item 7.3 C Improve Departmental Collaboration.
Using this plan adopted in December the City incorporates the first year of the plan into the budget.
FY20CapitalProjectswithMaterialOperationalImpacts The Bozeman Public Safety Center will begin construction in FY20. This exciting advancement of the City’s
public safety services and the strategic plan moves Police, Courts, Prosecutors and Fire Station 1 into one
building. This
project does add
large operational
and maintenance
costs going
forward.
Operational costs
are estimated to be
at least $360k. As
155

we finish design we can finalize these numbers and will need to included in the future General fund mill
levy.
Sewer capacity‐expanding project The Norton East Ranch Outfall Diversion (WWIF38) is $5,200,000.
Major roads funded through the Street Impact Fee Fund and Arterial Collector fund a good portion is for
building of the roads surrounding the new high school.
Road maintenance, vehicle replacements and building improvements are in the plan as well. Most capital
projects have some sort of impact on ongoing operational costs.
FY20 Capital impacts on operational costs:
The larger infrastructure projects have an impact on our operational costs, which can include increased
cost for maintenance, additional monitoring, and additional services such as more roads to plow with the
street construction scheduled. The major wastewater projects discussed earlier will add maintenance
time and monitoring. The streets that will be constructed will affect the Street Maintenance fund’s
operational budgets in FY20 with the additional snow plowing and into the future for repairs and
maintenance.
Expanding the vehicle fleet increases maintenance and gas expenditures. This budget year there are some
vehicles and other mobile equipment replacements that will not have as big of impact as the new vehicles
expanding the number in the fleet.
We are not constructing any major building in this budget but there are some remodels but their
operational impact is minimal since there is not additional need for cleaning and utilities. This includes
the Professional building remodel and the City Commission room.
156

Includedintheplanlookingouttowardsthefuture:
2021 ‐ This includes a water fund major project for the Lyman Tank and
Transmission Main Construction W88, which will be funded through financing for
$10million. Griffin 7th to Rouse SIF113 funded by Street Impact Fees and Arterial
collector funds is scheduled in FY21 for a project total of $3.7 million.
2022 ‐ The Indoor/Outdoor aquatics center is planned for FY22 and
will be funded through bonds going to the citizens for a vote. The
Water fund has an over $6million projects, PRV Phase 2 ‐
Automation and Instrumentation Upgrades W71 which will provide
necessary water system maintenance work. Routine vehicle
replacements, pipe replacements and road maintenance is planned.
2023 ‐ Fowler connection (Huffine to Oak) SIF114 funded by Street Impact Fees and
Arterial collector funds is scheduled in FY23 for a project total of $7.5 million.
Wastewater Impact Fees has a capacity project N Frontage Rd Interceptor WWIF20
scheduled for just under $5.3 million. The relocation of Fire Station 2 is scheduled
to align with service needs as outlined in the adopted master plan.
2024‐ Water fund and Street Impact Fee fund have added improvements to their time
lines. Street Impacts Fee fund sees Kagy improvements for the South side of town with
SIF009. The Water fund adds W71, which is the second phase of automation and
instrumentation upgrades for the treatment plant.
157

FY20 Capital Project Listing
Fund Fund ‐ Division Project # Project Name Amount
10 General Fund‐ Cemetery GF268 SW MT VETERAN'S CEMETERY 45,000
10 General Fund‐ Facilities GF274 CITY HALL BOZ CREEK IMPRV 33,500
10 General Fund‐ Parks GF254 25TH STREET FROM OAK TO TSCHACHE 333,000
10 General Fund‐ Parks NEW BOGART PARK PAVILLION REPAIRS 200,000
10 General Fund‐ Police GF053 PATROL CAR & EQUIP RPLCMT 118,000
10 General Fund‐ Police GF166 COUNTY RADIO LEASE 295,000
10 General Fund‐ Police GF292 MOBILE DATA EQUIP 30,000
10 General Fund‐ Police GF293 NON‐PATROL CAR NEW VEHICLES 15,000
10 General Fund‐ Recreation GF296 SWIM CENTER FRONT FURNACE 37,080
10 General Fund‐IT GF062 PERSONAL COMPUTER (PC) RE 50,000
10 General Fund‐IT GF080 CITY‐WIDE SWITCHES&ROUTRS 50,000
10 General Fund‐IT GF265 SERVER REPLACEMENT GF 20,000
10 General Fund‐IT GF289 SERVER FARM SOFTWARE UPGRADES 35,000
10 General Fund‐IT GF310 APC REPLACE FOR DATA CEN 12,000
10 General Fund‐IT GF312 ISCI FLASH UPGRADE CHALL 10,000
1,283,580
100 Planning CD06 PLANNING VEHICLE REPLACEMENT REQUEST 35,000
35,000
110 Gas Tax‐ Street Maintenance STR30 Annual Median & Boulevard 60,000
110 Gas Tax‐ Street Maintenance STR75 Annual Pedestrian Ramp Repair 100,000
110 Gas Tax‐ Street Maintenance STR91 MSU Kagy Pedestrian Crossing 80,000
240,000
111 Street Maintenance STR20 Annual Bike Path Improvement 53,080
111 Street Maintenance STR22 Grader Lease 60,000
111 Street Maintenance STR34 Sweepers 100,000
111 Street Maintenance STR39 Truck Mounted Tack Oil Distributor 210,000
111 Street Maintenance STR49 Sanders 27,000
111 Street Maintenance STR50 Snowplows 12,000
111 Street Maintenance STR68 Rectangular Rapid Flashing Beacon 10,000
111 Street Maintenance STR71 Maintenance & Rehabilitation (Mill & Overlay) 575,000
111 Street Maintenance STR73 Replace Skid Steer 90,000
111 Street Maintenance STR78 Replace #2748 ‐Truck 35,000
111 Street MaintenanceSTR83
N 27TH Median Landscaping & Irrigation (Oak to
Baxter) 50,000
111 Street Maintenance STR85 Replace 1992 Wheel Loader 180,000
111 Street MaintenanceSTR92
Oak St Median Landscaping & irrigation (Davis to
Ferguson) 60,000
111 Street Maintenance STR95 Signal Conflict Monitor Tester 13,000
111 Street Maintenance STR97 REPLACE #3149‐LIGHT DUTY 35,000
1,510,080
112 Forestry FOR14 Forestry Chip Truck 90,000
90,000
10 General Fund Total
100 Community Development Total
110 Gas Tax Total
111 Street Maintenance Total
112 Forestry Total
158

Fund Fund ‐ Division Project # Project Name Amount
114 Street Impact Fee SIF001 RIGHT OF WAY ACQUISITION 250,000
114 Street Impact FeeSIF057
OAK (FLANDERS MILL TO RYUN SUN WAY) ‐
CONSTRUCTION 1,000,000
114 Street Impact Fee SIF076 FOWLER CONNECTION (HUFFINE TO OAK) ‐ DESIGN 500,000
114 Street Impact FeeSIF098
OAK & COTTONWOOD (INTERSECTION
IMPROVEMENTS) ‐ ROUNDABOUT CONSTRUCTION 2,192,000
114 Street Impact FeeSIF105
COTTONWOOD (DURSTON TO OAK) ‐ CONSTRUCTION 1,250,000
114 Street Impact FeeSIF110
MANLEY & GRIFFIN (INTERSECTION IMPROVEMENTS)
‐ CONSTRUCTION 1,600,000
114 Street Impact FeeSIF123
BRIDGER DR & STORY MILL RD (INTERSECTION
IMPROVEMENTS) ‐ DESIGN 100,000
114 Street Impact Fee SIF132 STORY MILL (GRIFFIN TO BRIDGER) ‐ DESIGN 50,000
114 Street Impact FeeSIF134
OAK (COTTONWOOD TO FLANDERS MILL) ‐
CONSTRUCTION 434,000
7,376,000
141 Arterial & CollectorSIF057
OAK (FLANDERS MILL TO RYUN SUN WAY) ‐
CONSTRUCTION 500,000
141 Arterial & Collector SIF076 FOWLER CONNECTION (HUFFINE TO OAK) ‐ DESIGN 500,000
141 Arterial & CollectorSIF098
OAK & COTTONWOOD (INTERSECTION
IMPROVEMENTS) ‐ROUNDABOUT CONSTRUCTION 548,000
141 Arterial & CollectorSIF110
MANLEY & GRIFFIN (INTERSECTION IMPROVEMENTS)
‐ CONSTRUCTION 400,000
141 Arterial & CollectorSIF134
OAK (COTTONWOOD TO FLANDERS MILL) ‐
CONSTRUCTION 433,000
2,381,000
187 Fire Capital FE06 Radio Replacement Program 250,000
187 Fire Capital FE12 Personal Protective Equip 38,000
187 Fire Capital FE17 Wildlands Apparatus 55,000
187 Fire Capital FE18 Light Duty Vehicles 80,000
187 Fire Capital FE19 Utility Vehicle 45,000
468,000
500's Construction Funds BPSC Bozeman Public Safety Center 40,115,362
500's Construction FundsSCR01
ANNUAL CURB REPLACEMENT & CONCRETE REPAIR
PROGRAM 60,000
500's Construction FundsSCR16
N 17TH (DURSTON TO END) ‐ DESIGN AND
CONSTRUCTION 1,012,000
41,187,362
141 Arterial & Collector Total
187 Fire Capital & Equipment Replacement Total
500's Construction Funds Total
114 Street Impact Fee Total
159

Fund Fund ‐ Division Project # Project Name Amount
600 Water W62 REPLACE #3446 ‐ WTP GMC SIERRA PICKUP 45,000
600 WaterW66
SCADA METERS, TRANSDUCERS &
COMMUNICATIONS 10,000
600 Water W84 SOURDOUGH TANK INSPECTION & IMPROVEMENTS 600,000
600 Water W91 TURBIDIMETER REPLACEMENT 14,000
600 Water W94 MYSTIC LAKE BEAVER DECEIVER 35,000
600 WaterW96
SOURDOUGH RAW TRANSMISSION MAIN FLOW
CONTROL VALVE AND METER 300,000
600 Water ‐ Operations W03 ANNUAL WATER PIPE REPLACEMENT 22,500
600 Water ‐ OperationsW04‐20
WATER PIPE REPLACEMENT PROGRAM ‐
CONSTRUCTION 1,200,000
2,226,500
610 Water Impact FeeWIF25
DAVIS 12" WATER MAIN & VALLEY CENTER
16"WATER MAIN 725,729
610 Water Impact Fee WIF40 SOURDOUGH TRANSMISSION MAIN PHASE 2 4,320,000
610 Water Impact FeeWIF47
GRAF AND S. 27TH WATER TRANSMISSION MAIN
OVERSIZE 150,000
610 Water Impact Fee WIF50 I‐90 WATER MAIN EXTENSION 1,100,000
6,295,729
620 Wastewater WW54 REPLACE #1783 ‐ 1995 FORD DUMP TRUNK 100,000
620 Wastewater WW69 SMALL WORKS PROJECTS 100,000
620 Wastewater WW70 WRF FACILITY ENGINEERING & OPTIMIZATION 60,000
620 Wastewater WW88 RE‐TUBE BOILER 25,000
620 Wastewater WW91 UPDATE CONTROLS NETWORK 20,000
620 Wastewater WW96 EAST GALLATIN RIVER AVULSION RESTORATION 300,000
620 Wastewater ‐ OperationsWW07
ANNUAL WASTEWATER PIPE REPLACEMENT
PROGRAM‐DESIGN 22,500
620 Wastewater ‐ OperationsWW08
WASTEWATER PIPE REPLACEMENT PROGRAM‐
CONSTRUCTION 1,000,000
1,627,500
630 Wastewater Impact Fee WWIF22 DAVIS‐FOWLER INTERCEPTOR 125,000
630 Wastewater Impact Fee WWIF35 BABCOCK SANITARY SEWER UPGRADE 245,000
630 Wastewater Impact Fee WWIF37 HUNTERS WAY SEWER CAPACITY UPGRADE 350,000
630 Wastewater Impact Fee WWIF38 NORTON EAST RANCH OUTFALL DIVERSION 5,200,000
630 Wastewater Impact Fee WWIF42 MANLEY ROAD SEWER UPGRADE 504,000
6,424,000
640 Solidwaste SW32 Front Load Truck Replacement 270,000
640 Solidwaste SW36 Side Load Truck ‐ New 290,000
640 Solidwaste SW53 Pickup Truck 30,000
640 Solidwaste SW55 Side Load Truck 300,000
890,000
630 Wastewater Impact Fee Total
640 Solidwaste Total
600 Water Total
610 Water Impact FeeTotal
620 Wastewater Total
160

Fund Fund ‐ Division Project # Project Name Amount
641 Landfill Closure Closure Costs 61,417
61,417
650 ParkingP004
SURFACE PARKING LOT HARDWARE & SOFTWARE
SYSTEMS 15,000
650 Parking P020 PARKING VEHICLE LEASES 45,000
650 Parking P023 PARKING TECHNOLOGY PHASE II 150,000
650 Parking NEW IVR ‐ Voice message system 20,000
230,000
670 Stormwater STDM01 DOWNTOWN TRUNK LINE REHAB 400,000
670 Stormwater STDM02 MANLEY DITCH REHAB 100,000
670 Stormwater STUO01 STORMWATER FACILITY PLAN 150,000
650,000
750 Public Works Admin GIS03 ASSET MANAGEMENT SOFTWARE 75,000
75,000
73,051,168 Total Capital Expenditures
641 Landfill ClosureTotal
650 Parking Total
670 Stormwater Total
750 Public Works Admin Total
161

162

Appendices
AppendixA‐StatisticalInformation
AppendixB‐BudgetFinancialPolices
AppendixC‐LongRangePlanning
AppendixD‐GeneralFundMinimumReserveAnalysis
AppendixE‐Glossary
163

164

Appendix A: Statistical Information StatisticalInformation
ConsumerPriceIndexThe City uses the Consumer Price Index as a general gauge of price inflation this includes all Items, Unadjusted, Urban Consumers (CPI‐U). The City’s living wage ordinance bases increases on CPI‐U for Western States. Source: Bureau of Labor Statistics, US Department of Labor
Year Ending
December,CPI‐U % Change
2008 210.2 0.10%
2009 216 2.70%
2010 219.2 1.50%
2011 225.7 3.00%
2012 229.6 1.70%
2013 233 1.50%
2014 234.8 0.80%
2015 236.5 0.70%
2016 241.4 2.10%
2017 246.5 2.11%
2018 251.1 1.87%
United States CPI
210.2
216219.2
225.7229.6
233.0 234.8 236.5241.4
246.5251.1
219.6
218.8221.2
227.5
232.4236.1
239.1243.0
247.7
257.3265.2
200
210
220
230
240
250
260
270
2008 2009 2010 2011 2012 2013 2014 2015 2016 2017 2018
CPI‐U
United States CPI Western States CPI
165

PopulationBozeman’s population has been growing steadily since 2000. The rate of population has shown a larger increase the last three years. The Bozeman Population has median age that has held steady at 27 and has a high percentage of residents holding a bachelor’s degree or higher at 55.5%. Source: US Census Bureau:
People QuickFacts Bozeman Montana
Bozeman as %
of Montana
Data
Population: 2018 estimate 46,596 1,074,167 4.34%
Population: 2010 (April 1) estimates base 37,282 989,417 3.77%
Population: Percent change 4/01/10 to 7/01/16 21.40% 4.40%
Population: 2010 census 37,280 989,415 3.77%
Fiscal Yr
Estimated
Population
Bozeman's
Estimated Annual
% Change in
Population
Accumulated %
Growth Since
2007
2008 35,944 3.19% 7.69%
2009 36,933 2.75% 10.44%
2010 37,280 0.94% 11.38%
2011 37,314 0.09% 11.47%
2012 38,116 2.15% 13.62%
2013 38,753 1.67% 15.30%
2014 38,860 0.28% 15.57%
2015 41,660 7.21% 22.78%
2016 43,405 4.19% 26.97%
2017 45,250 4.25% 31.22%
2018 46,595 4.25% 35.47%
Year
% Change in
Population
Per capita
Income Median Age
% Residents w/
Bachelors K‐12 enrollment
Unemployment
rate
2008 3.1% 23,387$ 27.2 53.7% 5,432 2.7%
2009 2.7% 26,313$ 27.0 52.7% 5,463 4.6%
2010 0.9% 25,909$ 26.0 50.6% 5,509 5.8%
2011 0.1% 25,611$ 27.2 50.1% 5,679 5.6%
2012 2.1% 24,709$ 27.2 53.9% 5,810 5.2%
2013 1.6% 25,608$ 27.1 55.4% 5,994 4.3%
2014 0.3% 26,427$ 26.8 53.3% 6,216 3.5%
2015 6.7% 26,335$ 27.3 53.6% 6,294 2.9%
2016 4.0% 26,350$ 27.5 54.4% 6,533 2.8%
2017 4.1% 26,506$ 27.7 56.5% 6,770 2.8%
2018 4.1% 28,748$ 27.9 56.5% 6,908 2.8%
166

Business:Private Employers: The Montana Department of Labor and Industry reports the following largest private
employers within the City’s boundaries (2018 data).
Public Employers: The Montana Department of Labor and Industry reports the following largest public
employers within the City’s boundaries, one of which is the City.
Private Employers Size
Bozeman Deaconess Hospital 1,000+ Employees
Oracle America 500 to 999 Employees
Kenyon Noble Lumber & Hardware 250 to 499 Employees
Town Pump Convenience Stores 250 to 499 Employees
Wal Mart 250 to 499 Employees
Albertson's 100 to 249 Employees
Balckhawk Industries 100 to 249 Employees
Bridger Bowl 100 to 249 Employees
Community Food Co‐Op 100 to 249 Employees
Costco 100 to 249 Employees
First Student 100 to 249 Employees
JC Billion 100 to 249 Employees
McDonalds 100 to 249 Employees
Murdoch's Ranch & Home Supply 100 to 249 Employees
Ressler Motor 100 to 249 Employees
Simms Fishing Products 100 to 249 Employees
Town & Country Foods 100 to 249 Employees
Williams Plumbing & Heating 100 to 249 Employees
Zoot Enterprises 100 to 249 Employees
Public Employers Size
Montana State University 1,000+ Employees
School District #7 500 to 999 Employees
Belgrade School District 500 to 999 Employees
City of Bozeman 500 to 999 Employees
Gallatin County 250 to 499 Employees
167

PrincipalTaxPayers:The annual certified valuation of taxable real and personal property is completed by the Montana Department of
Revenue and transmitted to the City each August. For fall of 2017, the top taxpayers within the City were as
follows. These ten taxpayers comprised a total of 9.4% of our property tax base.
CityStaffingPerCapita
DebtLimits
Tax Payer
Assessed
Value % of Total
Northwestern Energy ‐ Transmission & Distribution 5,379,804 57.10%
Verizon Wireless 583,961 6.20%
Centurylink, Inc. (Qwest) 524,350 5.57%
Charter Communitcation 498,174 5.29%
NB Staduim View District 460,554 4.89%
Harry Daum ‐ Gallatin Mall 446,722 4.74%
Stone Ridge Partners LLC 423,820 4.50%
Mitchell Development & Investment 376,921 4.00%
Bridger Peaks Holding LLC 375,052 3.98%
First Security Bank 352,421 3.74%
2015 2016 2017 2018
Debt limit* 84,500,000 142,464,717 147,500,000 168,633,783
Total net debt applicable to limit (15,356,726)$ (16,454,841)$ (18,613,264)$ (14,598,588)$
Legal debt margin 69,143,274$ 126,009,876$ 128,886,736$ 154,035,195$
Total net debt applicable to the limi 18.2% 11.6% 12.6% 8.7%
as a percentage of debt limit
Fiscal Years
168

Appendix B: Budget and Financial Policies The overall goal of the City's financial policies is to establish and maintain effective management of the City's
financial resources. Formal policy statements and major objectives provide the foundation for achieving this goal.
Accordingly, this section outlines the policies used in guiding the preparation and management of the City's overall
budget and the major objectives to be accomplished. In addition, the rationale, which led to the establishment
of the fiscal policy statements, is also identified.
Budget Development & Administration
1. A comprehensive annual budget will be prepared for all funds expended by the City.
State law provides that "no money shall be drawn from the treasury of the municipality nor shall any obligation
for the expenditure of money be incurred except pursuant to the appropriation made by the commission."
Inclusion of all funds in the budget enables the commission, the administration, and the public to consider all
financial aspects of city government when preparing, modifying, and monitoring the budget, rather than deal with
the City's finances on a "piece meal" basis.
2. The budget will be prepared in such a manner as to facilitate its understanding by citizens and elected
officials.
One of the stated purposes of the budget is to present a picture of the City government operations and intentions
for the year to the citizens of Bozeman. Presenting a budget document that is understandable to the citizens
furthers the goal of effectively communicating local government finance issues to both elected officials and the
public.
3. Budgetary emphasis will focus on providing those basic municipal services which provide the maximum level
of services, to the most citizens, in the most cost effective manner, with due consideration being given to all
costs‐‐economic, fiscal, and social.
Adherence to this basic philosophy provides the citizens of Bozeman assurance that its government and elected
officials are responsive to the basic needs of the citizens and that its government is operated in an economical
and efficient manner.
4. The budget will provide for adequate maintenance of capital, plant, and equipment and for their orderly
replacement.
All governments experience prosperous times as well as periods of economic decline. In periods of economic
decline, proper maintenance and replacement of capital, plant, and equipment is generally postponed or
eliminated as a first means of balancing the budget. Recognition of the need for adequate maintenance and
replacement of capital, plant, and equipment, regardless of the economic conditions, will assist in maintaining the
government's equipment and infrastructure in good operating condition.
5. The City will avoid budgetary practices that balance current expenditures at the expense of meeting future
years' expenses.
169

Budgetary practices such as postponing capital expenditures, accruing future years' revenues, or rolling over
short‐term debt are budgetary practices which can solve short‐term financial problems; however, they can create
much larger financial problems for future administrations and commissions. Avoidance of these budgetary
practices will assure citizens that current problems are not simply being delayed to a future year.
6. The City will give highest priority in the use of one‐time revenues to the funding of capital assets or other
non‐recurring expenditures.
Utilizing one‐time revenues to fund on‐going expenditures results in incurring annual expenditure obligations
which may be unfunded in future years. Using one‐time revenues to fund capital assets or other non‐recurring
expenditures better enables future administrations and commissions to cope with the financial problems when
these revenue sources are discontinued, since these types of expenditures can more easily be eliminated.
7. The City will maintain a budgetary control system to help it adhere to the established budget.
The budget passed by the Commission establishes the legal spending limits for the City. A budgetary control
system is essential in order to insure legal compliance with the City's budget.
8. The City will exercise budgetary control (maximum spending authority) through City Commission approval
of appropriation authority for each appropriated budget unit.
Exercising budgetary control for each appropriated budget unit satisfies requirements of State law. It also assists
the commission in monitoring current year operations and acts as an early warning mechanism when departments
deviate in any substantive way from the original budget.
9. Reports comparing actual revenues and expenditures to budgeted amounts will be prepared monthly.
The City's budget is ineffective without a system to regularly monitor actual spending and revenue collections
with those anticipated at the beginning of the year. Monthly reports comparing actual revenues and expenditures
to budget amounts provide the mechanism for the Commission and the administration to regularly monitor
compliance with the adopted budget.
Revenue Collection
1. The City will seek to maintain a diversified and stable revenue base.
A city dependent upon a few volatile revenue sources is frequently forced to suddenly adjust tax rates or alter
expenditure levels to coincide with revenue collections. Establishment of a diversified and stable revenue base,
however, serves to protect the City from short‐term fluctuations in any one major revenue source.
2. The City will estimate revenues in a realistic and conservative manner.
Aggressive revenue estimates significantly increase the chances of budgetary shortfalls occurring during the year‐
‐resulting in either deficit spending or required spending reductions. Realistic and conservative revenue
estimates, on the other hand, will serve to minimize the adverse impact of revenue shortfalls and will also reduce
the need for mid‐year spending reductions.
3. The City will pursue an aggressive policy of collecting revenues.
An aggressive policy of collecting revenues will help to ensure the City's revenue estimates are met, all taxpayers
are treated fairly and consistently, and delinquencies are kept to a minimum.
170

4. The City will aggressively pursue opportunities for Federal or State grant funding.
An aggressive policy of pursuing opportunities for federal or state grant funding provides citizens assurance that
the City is striving to obtain all state and federal funds to which it is entitled, thereby reducing dependence on
local taxpayers for the support of local public services.
5. User fees and charges will be used, as opposed to general taxes, when distinct beneficiary populations or
interest groups can be identified.
User fees and charges are preferable to general taxes because user charges can provide clear demand signals
which assist in determining what services to offer, their quantity, and their quality. User charges are also more
equitable, since only those who use the service must pay‐‐thereby eliminating the subsidy provided by nonusers
to users, which is inherent in general tax financing.
6. User fees will be collected only if it is cost‐effective and administratively feasible to do so.
User fees are often times costly to administer. Prior to establishing user fees, the costs to establish and administer
the fees will be considered in order to provide assurance that the city's collection mechanisms are being operated
in an efficient manner.
Expenditures and Payments
1. On‐going expenditures will be limited to levels which can be supported by current revenues.
Utilization of reserves to fund on‐going expenditures will produce a balanced budget; however, this practice will
eventually cause severe financial problems. Once reserve levels are depleted, the City would face elimination of
on‐going costs in order to balance the budget. Therefore, the funding of on‐going expenditures will be limited to
current revenues.
2. Minor capital projects or recurring capital projects, which primarily benefit current residents, will be
financed from current revenues.
Minor capital projects or recurring capital projects represent relatively small costs of an on‐going nature, and
therefore, should be financed with current revenues rather than utilizing debt financing. This policy also reflects
the view that those who benefit from a capital project should pay for the project.
3. Major capital projects, which benefit future as well as current residents, will be financed with current
revenues as well as other financing sources (e.g. debt financing).
This policy reflects the view that those who benefit from a capital project should pay for the project.
4. Major capital projects, which benefit future residents, will be financed with other financing sources (e.g.
debt financing).
Major capital projects represent large expenditures of a non‐recurring nature which primarily benefit future
residents. Debt financing provides a means of generating sufficient funds to pay for the costs of major projects.
Debt financing also enables the costs of the project to be supported by those who benefit from the project, since
debt service payments will be funded through charges to future residents.
171

5. Construction projects and capital purchases of $10,000 or more will be included in the Capital Improvement
Plan (CIP); minor capital outlays of less than $10,000 will be included in the regular operating budget.
The Capital Improvement Plan (CIP) differentiates the financing of high cost long‐lived physical improvements
from low cost "consumable" equipment items contained in the operating budget. CIP items may be funded
through debt financing or current revenues while operating budget items are annual or routine in nature and
should only be financed from current revenues.
6. Spending Policy:
The City will spend its resources in the following order. Resources will be categorized according to Generally
Accepted Accounting Principles (GAAP) for state and local governments, with the following general definitions:
Restricted ‐‐ Amounts constrained to specific purposes by their providers (such as grantors, bondholders,
and higher levels of government) through constitutional provisions or by enabling legislation.
Committed ‐‐ Amounts constrained to specific purposes by the City Commission; to be reported as
committed, amounts cannot be used for any other purpose unless the City Commission takes action to
remove or change the constraint.
Assigned ‐‐ Amounts the City intends to use for a specific purpose; intent can be expressed by the
Commission or by an official or body to which the Commission delegates the authority. The City
Commission delegates this authority to the City Manager.
Unassigned ‐‐ Amounts that are available for any purpose; these amounts are reported only in the General
Fund.
When both restricted and unrestricted resources are available, spending will occur in the following order, for the
identified fund types:
Fund Type Order of Spending
General Fund 1. Restricted 2. Committed 3. Assigned 4. Unassigned The City Commission and the City Manager, individually, have the authority to express assignments in the General Fund.
Special Revenue Funds
1. Restricted 2. Committed 3. Assigned The City Commission and the City Manager, individually, have the authority to express assignments in Special Revenue Funds.
Debt Service Funds 1. Assigned 2. Committed 3. Restricted The City Commission and the City Manager, individually, have the authority to express assignments in Debt Service Funds.
172

Fund Type Order of Spending
Capital Projects Funds
1. Restricted 2. Committed 3. Assigned The City Commission and the City Manager, individually, have the authority to express assignments in Capital Project Funds.
Debt Administration
1. The City will limit long‐term debt to capital improvements, which cannot be financed from current revenues.
Incurring long‐term debt serves to obligate future taxpayers. Excess reliance on long‐term debt can cause debt
levels to reach or exceed the government's ability to pay. Therefore, conscientious use of long‐term debt will
provide assurance that future residents will be able service the debt obligations left by former residents.
2. The City will repay borrowed funds, used for capital projects, within a period not to exceed the expected
useful life of the project.
This policy reflects the view that those residents who benefit from a project should pay for the project. Adherence
to this policy will also help prevent the government from over‐extending itself with regard to the incurrence of
future debt.
3. The City will not use long‐term debt for financing current operations.
This policy reflects the view that those residents who benefit from a service should pay for the service. Utilization of
long‐term debt to support current operations would result in future residents supporting services provided to current
residents.
4. The City of Bozeman will adhere to a policy of full public disclosure with regard to the issuance of debt.
Full public disclosure with regard to the issuance of debt provides assurance that the incurrence of debt, for which
the public is responsible, is based upon a genuine need and is consistent with underwriters’ guidelines.
Reserves and Fund Balances
1. Reserves and Fund Balances will be properly designated into the following categories:
Nonspendable fund balance ‐‐ Amounts that are not in a spendable form (such as inventory) or are
required to be maintained intact (such as the corpus of an endowment fund).
Restricted fund balance ‐‐ Amounts constrained to specific purposes by their providers (such as
grantors, bondholders, and higher levels of government) through constitutional provisions or by
enabling legislation.
Committed fund balance ‐‐ Amounts constrained to specific purposes by the City Commission; to be
reported as committed, amounts cannot be used for any other purpose unless the City Commission
takes action to remove or change the constraint.
173

Assigned fund balance ‐‐ Amounts the City intends to use for a specific purpose; intent can be
expressed by the Commission or by an official or body to which the Commission delegates the
authority.
Unassigned fund balance ‐‐ Amounts that are available for any purpose; these amounts are reported
only in the General Fund.
2. A minimum level of General Fund reserve equal to 16.67% of annual revenues will be maintained by the City.
This reserve is committed to be used for: cash flow purposes, accrued employee payroll benefits which are not
shown as a liability, unanticipated equipment acquisition and replacement, and to enable the city to meet
unexpected expenditure demands or revenue shortfalls. (See Appendix D for recommendation)
Property taxes represent the City's primary source of general fund revenue. Property taxes are collected in
November and May of each fiscal year. Since the City's fiscal year begins on July 1st, the City must maintain an
adequate cash balance in order to meet its expenditure obligations between July 1st and the commencement of
the collection of property taxes in November.
Accrued employee payroll benefits represent a bona fide obligation of the City. The City will maintain sufficient
reserves to meet its annual expenditure obligations.
The City recognizes the need to maintain adequate equipment in order to carry out required public services.
Equipment acquisition and replacement represent on‐going costs of a relatively minor nature, as compared to
major capital purchases. We plan for equipment replacement within our Capital Improvement Program.
However, unforeseen equipment problems will arise. The reserve will provide resources for the immediate,
unanticipated replacement of critical equipment.
The City is subject to revenue shortfalls and unexpected expenditure demands during the fiscal year. An
undesignated General Fund reserve will be maintained to be able to offset these revenue shortfalls or meet
unexpected demands occurring during the year, without suddenly adjusting tax rates or reducing expenditures.
Financial Reporting & Accounting
1. The City will manage and account for its financial activity in accordance with Generally Accepted Accounting
Principles (GAAP), as set forth by the Governmental Accounting Standards Board (GASB).
GASB is recognized as the authority with respect to governmental accounting. Managing the City's finances in
accordance with GAAP and in accordance with the rules set forth by GASB provides Bozeman citizens assurance
that their public funds are being accounted for in a proper manner.
2. The City will maintain its accounting records for general governmental operations on a modified accrual
basis, with revenues recorded when available and measurable, and expenditures recorded when services or
goods are received and liabilities incurred. Accounting records for proprietary fund types and similar trust funds
will be maintained on an accrual basis, with all revenues recorded when earned and expenses recorded at the
time liabilities are incurred, without regard to receipt or payment of cash.
Adherence to this policy will enable the City to prepare its financial statements in accordance with GAAP as set
forth by the GASB.
174

3. The City of Bozeman will prepare a Comprehensive Annual Financial Report (CAFR) in conformity with
Generally Accepted Accounting Principles (GAAP). The report will be made available to the general public. The
CAFR shall be prepared in accordance with the standards established by the GFOA for the Certificate of
Achievement for Excellence in Financial Reporting Program
The Certificate of Achievement represents a significant accomplishment for a government and its financial
management. The program encourages governments to prepare and publish an easily readable and
understandable comprehensive annual financial report covering all funds and financial transactions of the
government during the year. The CAFR provides users with a wide variety of information useful in evaluating the
financial condition of a government. The program also encourages continued improvement in the City's financial
reporting practices.
4. The City will ensure the conduct of timely, effective, and annual audit coverage of all financial records in
compliance the local, state, and federal law.
Audits of the City's financial records provide the public assurance that its funds are being expended in accordance
with Local, State, and Federal law and in accordance with GAAP. Audits also provide management and the
Commission with suggestions for improvement in its financial operations from independent experts in the
accounting field.
5. The City of Bozeman will maintain a policy of full and open public disclosure of all financial activity.
Full and open public disclosure of all financial activity provides the public with assurance that its elected officials
and administrators communicate fully all financial matters affecting the public.
6. The modified accrual basis of accounting and budgeting is used for the governmental funds. Under the
modified accrual basis of accounting, revenues are recorded when susceptible to accrual, i.e., both measurable
and available. Available means collectible within the current period or soon enough thereafter to be used to
pay liabilities of the current period. Expenditures are recorded when the related liability is incurred. Employee
compensated absences and principal and interest on long‐term debt expenditures are recorded when due in
the current period. The accrual basis of accounting is used for proprietary funds. Under this method, revenues
are recorded when earned and expenses are recorded when the related liability is incurred. For budget
preparation and presentation, the proprietary funds’ expenses are converted to expenditures and follow the
same budget format as the government fund types. Capital outlays in the enterprise funds are presented as
expenses for budget basis, but are recorded as assets along with associated depreciation expense on the GAAP
basis. Debt service principal payments in the enterprise funds are accounted for as expenses for budget
purposes, but are reported as reduction of long‐term debt liability on the GAAP basis.
Recording capital outlays as expenditures and principal payments on long‐term debt for budget purposes,
presents a clearer picture of the City’s financial operations, is easier to administer for cash flow purposes, and is
easier for the lay person to understand.
175

176

Appendix C: Long Range Financial Planning 5‐year Financial Plans: Each year, the City also prepares and maintains financial plans for the current year and the
ensuing 5 years for the following funds:
SpecialRevenueFunds Street Maintenance Fund
Arterial & Collector Fund
Tree Maintenance Fund
EnterpriseFunds Water Fund
Wastewater Fund
Stormwater Fund
Solid Waste Fund (Rate study being conducted no Plan for FY20)
These plans are developed as a part of the annual budget process and are based on current and future estimates
of staffing levels, estimated increases in operating costs such as supplies, fuel, and chemicals, and approved the
capital plans. The plans project revenue requirements, expenditure levels, and estimated reserve levels for each
of the five years.
SpecialRevenueFundsSTREET MAINTENANCE:
The Street Maintenance long‐term plan continues to show increases in assessment to meet the needs of the
capital plan and growth. We are showing stabilization in rates and achievement of our desired reserve level
established in FY19.
‐
1,000,000
2,000,000
3,000,000
4,000,000
5,000,000
6,000,000
7,000,000
8,000,000
9,000,000
2019 Budget 2020Recommend
2021Projection
2022Projection
2023Projection
2024Projections
Street Maintenance Fund Projection
Revenue Expenditures Fund Balance
177

Street Maintenance District - 5 year ProjectionFY2020 Budget Preparation
Approved Proposed Projected Projected Projected Projected
Customer Increase - sq ft 2% 2% 2% 2% 2% 2%Rate Increase - General 5% 8% 10% 12% 0% 0%Rate Increase - Added Maintenance 0% 0% 0% 0% 0% 0%Rate Increase - Street Reconstruction 0% 0% 0% 0% 0% 0%
5.0% 8.0% 10.0% 12.0% 0.0% 0.0%
General Street Maintenance FY19 FY20 FY21 FY22 FY23 FY24Proportional Assessment Share 85.0% 85.0% 85.0% 85.0% 85.0% 85.0%
Beginning Fund Balance - Projected 528,760 334,733 76,733 360,445 238,514 1,067,050
Estimated Revenues:Assessments: Undesignated 4,008,541.29 4,402,821 4,925,436 5,610,269 5,705,644 5,802,639
Assessments: Added Maintenance 1,026,782 1,026,782 1,026,782 1,026,782 1,026,782 1,026,782 Street Cut Permits 18,000 18,000 18,000 18,000 18,000 18,000 Interest Earnings 10,000 10,000 10,000 10,000 10,000 10,000
Penalty & Interest 11,500 12,000 12,000 12,000 12,000 12,000 Other Revnue 10,000 25,000 25,000 25,000 25,000 25,000
Total Estimated Revenues: 5,084,823 5,494,603 5,992,218 6,677,051 6,772,425 6,869,421
Proposed Expenditures:Personnel 1,629,339 1,756,594 1,756,594 1,910,074 1,948,275 1,987,241
Staffing plan PW allocation FY21 and 22 - 153,480 210,834 - - Operations 2,019,804 2,175,129 2,218,631.58 2,416,484.21 2,464,814 2,514,110
Debt Service, incl Intercap 315,207 310,800 310,800 310,800 310,800 310,800 Approved CIP *with adjustments 1,314,500 1,510,080 1,269,000 1,950,789 1,220,000 1,234,000 Total Proposed Expenditures: 5,278,850 5,752,603 5,708,506 6,798,981 5,943,889 6,046,151
Ending Fund Balance - Projected 334,733 76,733 360,445 238,514 1,067,050 1,890,320
Street & Curb Reconstruction FY19 FY20 FY21 FY22 FY23 FY24Accumulated Assessment Amount 15.0% 15.0% 15.0% 15.0% 15.0% 15.0%
Beginning Designated Fund Balance - Projected 39,149 40,195 40,195 40,195 40,195 40,195
Estimated Revenues: Assessments Designated: Reconstruction & Curbs 696,525 709,733 724,510 741,340 758,457 775,865
Proposed Expenditures: Transfers to Construction Fund 695,478 709,733 724,510 741,340 758,457 775,865
Ending Designated Fund Balance - Projected 40,195$ 40,195$ 40,195$ 40,195$ 40,195$ 40,195$
Reserve Policy:30 build Day Operating Reserve (15,15, 20,20,30) 162,918$ 174,350$ 243,261$ 265,654$ 323,554$ 395,519$
162,918$ 174,350$ 243,261$ 265,654$ 323,554$ 395,519$
diff 212,009.74$ (57,422)$ 157,380$ 13,055$ 783,691$ 1,534,996$
Total Annual Assessments: Small Lot, 5,000 sq ft. 138.59$ 149.67$ 164.64$ 184.40$ 184.40$ 184.40$ Average Lot, 7,500 sq ft. 207.92$ 224.55$ 247.01$ 276.65$ 276.65$ 276.65$ Large Lot, 10,000 sq ft. 277.22$ 299.40$ 329.34$ 368.86$ 368.86$ 368.86$ Capped Residential, 15,000 sq ft. 415.83$ 449.10$ 494.01$ 553.29$ 553.29$ 553.29$
178

ARTERIAL AND COLLECTOR
The assessment is predicted to stay at the FY20 rate and need slight increases of 2% to fund the capital program.
This fund also relies on the gas tax remaining at current levels as well.
(2,000,000)
(1,000,000)
‐
1,000,000
2,000,000
3,000,000
4,000,000
5,000,000
6,000,000
Budget FY19 RecommendedFY20
Projected FY21 Projected FY22 Projected FY23 Projected FY24
Arterial & Collector Projection
Total Estimated Revenues: Total Proposed Expenditures:
Ending Fund Balance ‐ Projected
Arterial & Collector District - 5 year ProjectionFY2020 Budget Preparation
Adopted Proposed Projected Projected Projected Projected
Customer Increase - sq ftg 2% 2% 2% 2% 2% 2%Rate Increase - General -28% 0% 2% 2% 2% 2%
-26% 2% 4% 4% 4% 4%
Arterial & Collector Maintenance & Cap Budget FY19Recommended
FY20 Projected
FY21 Projected
FY22 Projected
FY23 Projected
FY24
Beginning Fund Balance - Projected 1,781,963 627,223 818,725 2,087,077 2,103,636 (854,888)
Estimated Revenues:Assessments: 1,306,466 1,332,595 1,386,432 1,442,444 1,500,719 1,561,348
Gas Tax Funding from fund 110 708,000 722,850 737,307 752,053 767,094 782,436 Interest Earnings 17,820 7,000 8,187 20,871 21,036 (8,549)
Penalty & Interest 2,286 2,500 2,426 2,524 2,626 2,732 Revenue - Payback Districts 378,688 522,557 300,667 300,667 - -
Developer contributions - - 1,683,333 - - - Total Estimated Revenues: 2,413,260 2,587,502 4,118,353 2,518,559 2,291,475 2,337,967
Proposed Expenditures:Personnel - - - - -
Operations 115,000 15,000 - - - - Debt Service, incl Intercap - - - - - -
Approved CIP 3,453,000 2,381,000 2,850,000 2,502,000 5,250,000 - Total Proposed Expenditures: 3,568,000 2,396,000 2,850,000 2,502,000 5,250,000 -
Ending Fund Balance - Projected 627,223 818,725 2,087,077 2,103,636 (854,888) 1,483,079
Total Annual Assessments: Small Lot, 5,000 sq ft. 34.52$ 34.52$ 35.90$ 37.34$ 38.83$ 40.38$ Average Lot, 7,500 sq ft. 51.78$ 51.78$ 53.85$ 56.01$ 58.25$ 60.58$ Large Lot, 10,000 sq ft. 69.03$ 69.03$ 71.79$ 74.66$ 77.65$ 80.76$ Capped Residential, 15,000 sq ft. 103.55$ 103.55$ 107.69$ 112.00$ 116.48$ 121.14$
179

TREE MAINTENANCE FUND
The Tree maintenance fund needs to continue to build a fund balance to be able to address capital needs and
emergency funds.
‐ 100,000 200,000 300,000 400,000 500,000 600,000 700,000 800,000 900,000
1,000,000
Budget FY19
RecommendFY20
Projected FY21 Projected FY22 Projected FY23 Projected FY24
Tree Maintenance Fund Projection
Total Estimated Revenues: Total Proposed Expenditures: Ending Fund Balance ‐ Projected
Tree Maintenance District - 5 year ProjectionFY2020 Budget Preparation
Approved Recommend Projected Projected Projected ProjectedProposed Rate Increase 5% 2% 2% 2% 0% 0%
Estimated Growth in Assessable SqFt 2% 2% 2% 2% 2% 2%
Budget FY19Beginning Fund Balance - Projected 345,584 271,260 266,437 361,190 321,954 357,287
Estimated Revenues:Assessments 744,853 774,945 806,252 838,825 855,602 872,714
Penalty and Interest 1,200 2,000 2,000 2,000 2,000 2,000 Interest Earnings 2,200 3,000 2,200 2,200 2,200 2,200
Sale of Cost-Share-Trees 3,000 3,000 3,000 3,000 3,000 3,000 Total Estimated Revenues: 751,253 782,945 813,452 846,025 862,802 879,914
Proposed Expenditures:Existing Personnel 435,400 455,103 468,756 482,819 497,303 512,222
Operations -- 244,177 242,664 249,944 257,442 265,166 273,120 Capital 146,000 90,000 - 145,000 65,000 75,000
Total Proposed Expenditures: 825,577 787,767 718,700 885,261 827,469 860,343
Ending Fund Balance - Projected 271,260 266,437 361,190 321,954 357,287 376,857
Reserve Policy:General Capital reserve 65,000 72,000 78,000 85,000 90,000 90,000 Working Capital for Emerald Ash Incidents 100,000 100,000 100,000 100,000 100,000 100,000 45 Days Pers & Ops 83,783 86,026 88,607 91,265 94,003 96,823
248,783 258,026 266,607 276,265 284,003 286,823 Remaing Fund Balance 22,476 8,411 94,583 45,689 73,284 90,034
Annual Assessments: Small Lot, 5,000 sq ft. 15.73 16.05 16.37 16.70 16.70 16.70 Average Lot, 7,500 sq ft. 23.61 24.08 24.56 25.05 25.05 25.05 Large Lot, 10,000 sq ft. 31.48 32.11 32.75 33.41 33.41 33.41 Extra Large, 15,000 sq ft 47.21 48.16 49.12 50.10 50.10 50.10
Recommend FY20
Projected FY21
Projected FY22
Projected FY23
Projected FY24
180

EnterpriseFundsWATER FUND
Recently, the City had a rate study
completed for the Water fund.
Rates and reserve levels were
designed to ensure proper
revenue coverage and reserve
amounts, including a drought
reserve.
‐
5,000,000
10,000,000
15,000,000
20,000,000
25,000,000
Water Fund Projections
Revenues Expenditures Fund Balance
181

WASTEWATER FUND
Recently, the City had a rate study completed for the Wastewater fund. Rates and reserve levels were designed
to ensure proper revenue coverage and reserve amounts.
‐
5,000,000
10,000,000
15,000,000
2019 Budgeted 2020Recommended
FY21 Projected FY22 Projected FY23 Projected FY24 Projected
Wastewater Fund Projections
Revenues Expenditures Fund Balance
182

STORM WATER FUND
Projected with 2% growth
assumption and increases in
rates are needed to further
compensate in growth and
higher construction costs to
continue to maintain and
replace infrastructure.
Storm Water Utility - 5 Year Budget & Rate ProjectionFY2020 Budget Preparation
Approved Proposed Projected Projected Projected ProjectedRate Increase 0% 4% 4% 5% 5% 5%Customer Increase 2% 2% 2% 2% 2% 2%
Budget FY19Recommended
FY20Projected
FY21Projected
FY22Projected
FY23Projected
FY24Beginning Fund Balance - Projected 706,361 660,247 478,134 346,735 238,660 214,508
Estimated Revenues:Storm Water Utility Charges 1,322,688 1,403,107 1,488,416 1,594,094 1,707,275 1,828,491
Low Income Discount (5,000) (5,200) (5,408) (5,678) (5,962) (6,260) Interest Earnings 5,500 5,500 5,500 5,500 5,500 5,500
Transfers from Other Funds 75,000 75,000 75,000 75,000 75,000 75,000 Total Estimated Revenues: 1,398,188 1,478,407 1,563,508 1,668,916 1,781,812 1,902,731
Proposed Expenditures:Personnel 408,583 580,938 580,938 631,001 701,496 726,048
Staffing Plan FY21-22 26,335 50,063 Operating 240,373 268,372 276,423 284,716 293,257 302,055
CIP 635,000 650,000 650,000 650,000 650,000 650,000 Debt Service (includes Landfill) 160,346 161,211 161,211 161,211 161,211 161,211
Transfers - - - 1,403 - - Total Proposed Expenditures: 1,444,302 1,660,521 1,694,907 1,776,991 1,805,964 1,839,314
Ending Fund Balance - Projected 660,247 478,134 346,735 238,660 214,508 277,924
Reserve Policy:45 Day Operating Reserve 80,008 104,709 105,702 112,897 122,641 126,752 Depreciation Reserve Est 120,000 120,000 120,000 120,000 120,000 120,000
200,008 224,709 225,702 232,897 242,641 246,752
Remaining Fund Balance 460,239$ 253,424$ 121,033$ 5,763$ (28,133)$ 31,172$
‐
500,000
1,000,000
1,500,000
2,000,000
Storm Water Fund Projections
Total Estimated Revenues: Total Proposed Expenditures:
Ending Fund Balance ‐ Projected
183

184

Appendix D- General Fund Balance Minimum Analysis Background Fund balance is a critical for financial stability and flexibility. Reserves aid in governments being able to respond
to events, buffer against economic down turns and are a factor for bond ratings. The City of Bozeman adopted
its current General fund reserve policy April 26, 2010 via ordinance.1 The minimum fund reserve is “16 2/3
percent of estimated general fund revenues” and was adopted based on the GFOA’s best practice
recommendation at the time. GFOA has since revised its best practices and recommend a policy be developed
articulating “a framework and process for how the government would increase or decrease the level of
unrestricted fund balance over a specific time period. In particular, governments should provide broad
guidance in the policy for how resources will be directed to replenish fund balance should the balance fall
below the level prescribed.”2
Appropriate Level ‐ The amount of reserve needed is unique to every local government since all deal
with different revenue streams, live in areas with higher risk of natural disaster, and have different aged
infrastructure. At a minimum, the GFOA recommends, “at a minimum, that general‐purpose
governments, regardless of size, maintain unrestricted budgetary fund balance in their general fund of
no less than two months of regular general fund operating revenues or regular general fund operating
expenditures.” Then based on a review of the governments risk factors determine what is beyond the
minimum.
Use and Replenishment‐ The reserve policy should include the conditions and/or circumstances where
the funds can be used and if the balance goes below the desired level, there should be a plan to relish
the reserve
We have reviewed GFOA’s best practice, and its referenced material, as well as GFOA case studies and examples
of polices from other cities. We have performed analysis to determine factors for the appropriate level. When
looking at our reserve we followed GFOA’s methodology used in their study done on the City of Colorado
Springs.3 Based on the research and analysis we are recommending the expansion of the General fund reserve
policy as stated in the adopted budget book and of the ordinance.
1 https://library.municode.com/mt/bozeman/codes/code_of_ordinances?nodeId=PTIICOOR_CH2AD_ART6FI_DIV2BU_S2.06.180MILEBUGEFUUNFUBA 2 http://www.gfoa.org/fund‐balance‐guidelines‐general‐fund 3 http://www.gfoa.org/sites/default/files/Colorado%20Springs_FINAL_0.pdf
185

Analysis Using GFOA’s best practice and their own analysis, we examined the City’s risk factors in regards to the General
fund. We reviewed revenue volatility, infrastructure upkeep, Vulnerability to Extreme Events and Public Safety
Concerns, Expenditure Volatility,
Risk Factors
Revenue Volatility
The more volatile a government’s revenue sources the higher a risk for fast changes and the need to respond to
down turns. This type of risk requires higher reserve to be in place to be able to respond to revenue drops
instead of suddenly reducing service levels. The City’s General fund revenues are mainly from four sources:
property taxes, charges for services, intergovernmental revenues and other financing sources. Other financing
sources are typically for debt issuance so it does not need to be included in the analysis.
Property taxes‐ Property taxes make up about 50‐52% of the General fund’s revenues. Traditionally property
taxes are not as volatile as others taxes are, such as sales tax. Based on the linear increase in actuals this
revenue is currently not showing signs of volatility.
‐ 5,000,000
10,000,000 15,000,000 20,000,000 25,000,000 30,000,000 35,000,000
Historical Revenues and Fund balance
Revenue Fund balance
9,395,059
11,764,184 11,544,728 11,751,346 12,513,690
14,512,728 14,904,243 15,268,625 15,689,266
16,621,534
‐
2,000,000
4,000,000
6,000,000
8,000,000
10,000,000
12,000,000
14,000,000
16,000,000
18,000,000
FY2010 FY2011 FY2012 FY2013 FY2014 FY2015 FY2016 FY2017 FY2018 BudgetFY2019
Property tax
186

Intergovernmental Revenues ‐ The largest part of this revenue stream is the State entitlement share, which
increases based on the average change of the last 3 years of CPI. There have been talks at the legislature to
reduce these funds and the economy could have an impact. Grants would be included in this revenue item and
that could increase this revenue, as the City grows larger and qualifies for more funding. Based on the linear
increase in actuals this revenue is currently not showing signs of volatility.
Charges for Services ‐ Charges for services has shown volatility. The City has increased fees recently to align
better with cost of services, specifically in Parks and Recreations. With it being only 9% of revenues and the
recent efforts these just require monitoring and cost recovery analysis but no reserve fund changes are needed
to cover possible down turns beyond the current minimum.
5,323,697
6,046,956 6,139,548 6,277,896 6,570,978 6,807,755
7,056,466 7,393,702
7,686,022 7,642,511
‐
1,000,000
2,000,000
3,000,000
4,000,000
5,000,000
6,000,000
7,000,000
8,000,000
9,000,000
FY2010 FY2011 FY2012 FY2013 FY2014 FY2015 FY2016 FY2017 FY2018 BudgetFY2019
Intergovernmental Revenues
2,324,185 2,382,714 2,166,750 2,139,772
2,395,464
1,928,343 2,165,642
2,295,677
2,760,256 2,925,871
‐
500,000
1,000,000
1,500,000
2,000,000
2,500,000
3,000,000
3,500,000
FY2010 FY2011 FY2012 FY2013 FY2014 FY2015 FY2016 FY2017 FY2018 BudgetFY2019
Charges for services
187

Infrastructure Upkeep
Worn infrastructure holds a potential risk of failure and General fund reserves maybe needed to repair and
replace unexpected failures of assets. The City’s infrastructure is vast and is planned for in many different fund
reserves, for example, water and wastewater reserves are part of the rate study and the model to plan for
replacement and maintenance. The General fund infrastructure is the facilities accounted for in the General
fund including administrative buildings and parks and recreation facilities. This winter Bozeman saw record
heavy snowfall and had a partial collapse at Bogart Park. The Pavilion is about $3.4 million to replace. MSU saw
a bigger catastrophe due to the snowfall and older buildings. The City is having our other structure examined but
there should be some funding set aside in the reserve for the infrastructure and next year with the further study
and expansion of our asset management program we can better quantify this risk going forward. The FY20
Reserve should include 0.4% to address this risk.
Vulnerability to Extreme Events and Public Safety Concerns
Extreme events require public safety programs that must continue to be funded while waiting for any state and
federal aid. “For example, reimbursement from the Federal Emergency Management Agency (FEMA) does not
always occur right away, so it is important to have reserves to absorb the cost in the meantime, and FEMA does
not necessarily reimburse 100 percent of the cost of responding to an event.”4 The City has taken measures to
prepare for events with the Climate Action Plan and the joint project with MSU for Continuity of operations
planning. Montana is prone wildfires, heavy snowfall and flooding. As we developed these plans, we can
further examine the need for a reserve beyond our minimum.
Expenditure Volatility
Unexpected expenditures or non‐reoccurring expenditures are often funded by reserves, unlike re‐occurring
that should be funded by reoccurring revenues and not reserves. Reoccurring should be part of the operating
budget and the risk of non‐reoccurring can be planned for in the reserve. We have limited our funding for
capital expenditures and in the future either reserve should be built up for items or debt financing might have to
increase.
We have not seen a rise of such expenditures but the City has relied upon the prior year spending not to happen
and use carryforward of 4% to balance operating expenditures. The trend has been decreasing but one‐time
4 http://www.gfoa.org/sites/default/files/Colorado%20Springs_FINAL_0.pdf
0%
20%
40%
60%
80%
100%
FY10 FY11 FY12 FY13 FY14 FY15 FY16 FY17 FY18 FY19BUDGET
Expenditures by Type
PERSONNEL OPERATING CAPITAL DEBT SERVICE TRANSFERS
188

monies have off set it, which will not always be the case. The budget can only rely on 2.5% carryforward but at
this time the need for more reserve is not needed, however the reserve calculation should be based on
expenditures rather than revenues due to this trend (highlighted with stars below).
The exception should be made for non‐cash items that are required to be shown in the budget because they are
shown as revenue coming and expenditures going out. The city has one of these for the State retirement
contribution for Police and fire that is around $2.4 million. This item should be excluded from the minimum
since in essence, it is a wash and there is no actual cash coming or going from the City.
Growth of the Community
“Rapid growth of the community could call for larger levels of reserves, lest service requirements expand
beyond the City’s ability to continue services in the face of revenue interruption. For instance, property tax
revenues may not be received until a couple of years after development occurs, yet the government will still
need to provide for the public safety, health, and welfare of these members of the community in the
meantime.”5 The City has seen an average of 4% growth over the last 4 years. The General fund faces level of
service constraints as the City grows. Infrastructure is paid for through other means such as impact fees. Level
service are operating expenses and reoccurring so this will not impact the need for addition minimum reserve
amounts but rather impact operating budget decisions in regards to the General Fund.
5 http://www.gfoa.org/sites/default/files/Colorado%20Springs_FINAL_0.pdf
$‐
$5,000,000.00
$10,000,000.00
$15,000,000.00
$20,000,000.00
$25,000,000.00
$30,000,000.00
$35,000,000.00
$40,000,000.00
FY10 FY11 FY12 FY13 FY14 FY15 FY16 FY17 FY18 FY19BUDGET
Total Expenditures Total Revenues
189

Recommendations
Begin working towards the following recommendations and revise the City Ordinance once the City has achieved
this objective, evaluated the method, and the City Commission has approved this approach.
Appropriate Level Based on the above analysis, 17% of budgeted expenditures (appropriations), this will be set at budget time
where both the current fund balance and projected fund balance will meet this minimum unless it has been
used as described below.
Use and Replenishment Available fund balances shall not be used for ongoing operating expenditures, unless a determination has been
made that available balances are in excess of required guidelines and that plans have been established to
address any future operating budget shortfalls. Emphasis shall be placed on one‐time uses that achieve future
operating cost reductions.
Uses that would cause going below the minimum should be limited to:
Unanticipated expenditures of a non‐reoccurring nature
Meet unexpected increases in service delivery costs
Replenishment plan should be established when dropping below the minimum and should be replenished at a
maximum of three years.
190

Appendix E: Glossary of Key Terms ACCRUAL BASIS ‐ A basis of accounting in which transactions are recognized at the time they are incurred, as opposed to when cash is received or spent. APPROPRIATION‐ Legal authorization granted by City Commission to make expenditures and incur obligations. ASSESSED VALUATION ‐ A value that is established for real and personal property for use as a basis for levying property taxes. (For the City of Bozeman, the Montana Department of Revenue establishes Property values.) ASSET ‐ Resources owned or held by a government having monetary value. BALANCED BUDGET ‐ Refers to a government budget with revenues equal to expenditures. BOND ‐ A written promise to pay a sum of money on a specific date at a specified interest rate. The most common types of bonds are general obligation, revenue, and special assessment district bonds. These are most frequently used for construction of large capital projects such as buildings, streets, and water and waste water lines. BOND RATING ‐ An evaluation of a bond issuer’s credit quality and perceived ability to pay the principal and interest on time and in full. BOND REFINANCING ‐ The payoff and re‐issuance of bonds, to obtain better interest rates and/or bond conditions. BUDGET ‐ Plan of financial operation, embodying an estimate of proposed expenditures for a given period (City of Bozeman’s budget is for a fiscal year July 1—June 30) and the proposed means of financing them. Upon approval by Commission, the appropriation ordinance is the legal basis for incurring expenditures. BUDGET AMENDMENT‐ A procedure to revise the appropriation ordinance through action by the City Commission. BUDGET CALENDAR ‐ The schedule of key dates or milestones which the City follows in the preparation, adoption, and administration of the budget. BUDGET MESSAGE ‐ The opening section of the budget which provides the City Commission and the public with a general summary of the most important aspects of the budget, changes from the current and previous fiscal years, and recommendations regarding the financial policy for the upcoming period. BUDGETARY BASIS ‐ This refers to the form of accounting utilized throughout the budget process. These generally take one of three forms: GAAP, Cash, and Modified Accrual. BUDGETARY CONTROL ‐ The control or management of a government or enterprise in accordance with an approved budget for the purpose of keeping expenditures within the limitations of available appropriations and available revenues.
191

CAPITAL BUDGET ‐ The Capital Budget comprises the capital improvements that are funded in the current budget year. CAPITAL EXPENDITURE ‐ The item has a unit cost over $5,000, benefits future periods, has a normal useful life of 1 year or more, has an identity that does not change with use (i.e. retains its identity throughout its useful life), and s identifiable and can be separately accounted for. Improvements to existing assets must add life and value to be included as a capital item. CAPITAL IMPROVEMENTS ‐ Expenditures related to the acquisition, expansion, or rehabilitation of an element of the government’s physical plant; sometimes referred to as infrastructure. CAPITAL IMPROVEMENTS PROGRAM (CIP) ‐ A plan for capital expenditures needed to maintain, replace, and expand the City’s heavy equipment and public infrastructure (for example streets, parks, buildings, etc.) The CIP projects these capital equipment and infrastructure needs for a set number of years (5 years for City of Bozeman’s Program) and is updated annually to reflect the latest priorities, cost estimates and changing financial estimates or strategies. The first year of the adopted CIP becomes the basis of the City’s capital budget. CAPITAL OUTLAY ‐ Items that cost more than $5,000 and have a useful life of one year or more. CAPITAL PROJECT ‐ New facility, technology system, land or equipment acquisition, or improvements to existing facilities beyond routine maintenance. Capital projects are included in the CIP and become fixed assets. CASH BASIS ‐ A basis of accounting in which transactions are recognized only when cash is increased or decreased. CDBG ‐ Community Development Block Grant. CONTINGENCY ‐ A budgetary reserve set aside for emergencies or unforeseen expenditures not otherwise budgeted. CONTRACTED SERVICES ‐ Expenditures for services performed by firms, individuals, not other city departments. DEBT LIMIT ‐ The maximum amount of gross or net debt which is legally permitted. DEBT RATIO ‐ Ratios which provide a method of assessing debt load and the ability to repay debt which plays a part in the determination of credit ratings. They are also used to evaluate the City’s debt position over time and against its own standards and policies. DEBT SERVICE ‐ Payment of principal and interest related to long term loans or bonds. DEBT SERVICE FUND ‐ A fund established to account for the accumulation of resources for, and the payment of, general long‐term debt principal and interest. DEBT SERVICE FUND REQUIREMENT ‐ The amounts of revenue which must be provided for a Debt Service Fund so that all principal and interest payments can be made in full on schedule.
192

DEFICIT ‐ The excess of an entity’s liabilities over its assets or the excess of expenditures over revenues during a single accounting period. DEPARTMENT‐ A major administrative division of the City which indicates overall management responsibility for an operation or a group of related operations within a functional area. DEPRECIATION ‐ Expiration in the service life of fixed assets, attributable to wear and tear, deterioration, action of physical elements, inadequacy, and obsolescence. DESTINGUISHED BUDGET PRESENTATION AWARD ‐ A voluntary awards program administered by the Government Finance Officers Association to encourage governments to prepare effective budget documents. DIVISION ‐ A group of homogenous cost centers within a department. ENTERPRISE FUND ‐ A fund established to account for operations that are financed and operated in a manner similar to private business enterprises ‐ where the intent of the governing body is that the costs (expenses, including depreciation) of providing goods or services to the general public on a continuing basis be financed or recovered primarily through user charges. ESTIMATE ‐ The most recent prediction of current year revenue and expenditures. Estimates are based upon many months of actual expenditure and revenue information and are prepared to consider the impact of unanticipated costs or other economic changes. ESTIMATED REVENUE ‐ The amount of projected revenue to be collected during the fiscal year. EXPENDITURES ‐ Decreases in net financial resources. FISCAL YEAR ‐ The time period signifying the beginning and ending period for recording financial transactions. The City's fiscal year begins on July 1 and ends on June 30 of each year. FIXED ASSETS ‐ Assets of long‐term character which are intended to continue to be held or used, such as land, buildings, machinery, furniture and other equipment. FTE ‐ See Full Time Equivalent. FULL FAITH AND CREDIT‐ A pledge of a government’s taxing power to repay debt obligations. FULL TIME EQUIVALENT Also referred to as FTE. The yearly personnel hours worked by a position divided by the total available work hours for a full year (2080). FUND ‐ An accounting entity with a self‐balancing set of accounts which are segregated for the purpose of carrying on specific activities or attaining certain objectives in accordance with special regulations, restrictions or limitations. FUND BALANCE ‐ The excess of assets over liabilities. The beginning fund balance is the residual funds brought forward from the previous fiscal year.
Nonspendable fund balance ‐‐ Amounts that are not in a spendable form (such as inventory) or are
193
required to be maintained intact (such as the corpus of an endowment fund).
Restricted fund balance ‐‐ Amounts constrained to specific purposes by their providers (such as
grantors, bondholders, and higher levels of government) through constitutional provisions or by
enabling legislation.
Committed fund balance ‐‐ Amounts constrained to specific purposes by a government itself using its
highest level of decision‐making authority; to be reported as committed, amounts cannot be used for
any other purpose unless the government takes the same highest‐level action to remove or change the
constraint.
Assigned fund balance ‐‐ Amounts a government intends to use for a specific purpose; intent can be
expressed by the governing body or by an official or body to which the governing body delegates the
authority.
Unassigned fund balance ‐‐ Amounts that are available for any purpose; these amounts are reported
only in the General Fund. GAAP ‐ See Generally Accepted Accounting Principles. GENERAL FUND ‐ The fund used to account for all of the City’s financial resources except those required to be accounted for in another fund. GENERAL OBLIGATION BONDS (G.O. Bonds) ‐ Bonds for the payment of which the full faith and credit of the issuing government are pledged. These bonds usually require voter approval and finance a variety of public projects such as roads, buildings, parks and improvements. GOAL ‐ A statement of broad direction, purpose or intent based on the needs of the community. G.O. BONDS ‐ See General Obligation Bonds. GOVERNMENTAL FUNDS ‐ Funds generally used to account for tax‐supported activities. Governmental funds include: general, special revenue, debt service, capital projects, and permanent funds. GRANT ‐ A contribution by one government unit or funding source to another. The contribution is usually made to aid in the support of a specified function (e.g. public safety or drug enforcement,) but is sometimes for general purposes. IMPROVEMENT DISTRICT ‐ Special assessment districts formed by property owners who desire and are willing to pay for mutually enjoyed improvements such as lighting or street maintenance. INFRASTRUCTURE ‐ Facilities that support the daily life and growth of the city, for example, streets, public buildings, wastewater treatment, parks. INTERGOVERNMENT REVENUE ‐ Funds received from federal, state, and other local government sources in the form of grants, shared revenues, and payments in lieu of taxes. INTERNAL SERVICE FUND ‐ A fund used to account for the financing of goods or services provided by one department or agency to other departments on a cost‐reimbursement basis.
194

LEASE‐PURCHASE AGREEMENT ‐ Contractual agreements, which are termed “leases”, but which in substance, amount to purchase contracts for equipment and machinery. LEVY ‐ (Verb) To impose taxes, special assessments, or service charges for the support of governmental activities. (Noun) The total amount of taxes, special assessments, or service charges imposed by a government. LINE‐ITEM BUDGET ‐ A budget that lists each expenditure category (salary, materials, telephone service, travel, etc.) separately, along with the dollar amount budgeted for each specific category. LONG‐TERM DEBT ‐ Debt with a maturity of more than one year after the date of issuance. MANDATE ‐ Legislation passed by the state or federal government requiring action or provision of services and/or programs by the City. Examples include the Americans with Disabilities Act, which requires such actions as physical facility improvements and provision of specialized equipment for public recreation and transportation. MILL LEVY ‐ Rate applied to Assessed Valuation to determine property taxes. A mill is 1/10th of a penny or $1.00 of tax for each $1,000 of assessed valuation. OBJECT ‐ As used in expenditure classification, this term applies to the article purchased or the service obtained (as distinguished from the results obtained from expenditures). Examples are personnel services, contracted services, and supplies and materials. OBJECTIVE ‐ Desired outcome‐oriented accomplishments that can be measured and achieved within a given time frame, and advances the activity or organization toward a corresponding goal. OPERATING BUDGET ‐ The portion of the budget pertaining to daily operations that provides basic governmental services. The operating budget contains appropriations for such expenditures as personnel, supplies, utilities, materials, and services. ORDINANCE ‐ A formal legislative enactment by the City Commission. If it is not in conflict with any higher form of law, such as state statute or constitutional provision, it has the full force and effect of law within the boundaries of the City. OUTSTANDING BONDS ‐ Bonds not yet retired through principal payment. OVERLAPPING DEBT ‐ The City’s proportionate share of the debt of other local governmental units, which either overlap it or underlie it. The debt is generally apportioned based on relative assessed value PAYMENT IN LIEU OF TAXES ‐ Also referred to as PILT. Payments made in lieu of taxes from another government or entity. PERFORMANCE BUDGET ‐ A budget that focuses on departmental goals and objectives rather than line items, programs, or funds. Workload and unit cost data are collected in order to assess effectiveness and efficiency of services.
195

PERSONNEL SERVICES ‐ Items of expenditures in the operating budget for salaries and wages paid for services performed by City employees, as well as the fringe benefit costs. PROPERTY TAX ‐ A levy upon each $100 of assessed valuation of real and personal property within the City of Bozeman. PROPRIETARY FUND‐ Funds that focus on the determination of operating income, changes in net position (or cost recovery) financial position, and cash flows. Proprietary funds include enterprise and internal service funds. RESOLUTION‐ A special or temporary order of a legislative body (City Commission) requiring less legal formality than an ordinance or statute. RESOURCES ‐ Total amounts available for appropriation including estimated revenues, fund transfers, and beginning fund balances. REVENUE ‐ Funds that the government receives as income. It includes items such as tax payments, fees for specific services, receipts from other governments, fines, forfeitures, grants, shared revenues and interest income. REVENUE BONDS ‐ Bonds sold for constructing a project that will produce revenue for the government. That revenue is pledged to pay the principal and interest of the bond. RISK MANAGEMENT ‐ An organized attempt to protect a government’s assets against accidental loss in the most economical method. SPECIAL IMPROVEMENT DISTRICT (SID) ‐ An area defined and designated for improvements, often financed with bond proceeds that specifically benefit the property owners within the area of the district. Debt is repaid through annual assessments to property owners. SPECIAL REVENUE FUND ‐ A fund used to account for the proceeds of specific revenue sources (other than special assessments, expendable trusts, or of major capital projects) that are legally restricted to expenditure for specified purposes. STATE SHARED REVENUE ‐ Revenues levied and collected by the state but shared with local governments as determined by state government. Entitlement funds received by the City form the state of Montana is the largest State Shared Revenue. TAXES ‐ Compulsory charges levied by a government for the purpose of financing services performed for the common benefit. This term does not refer to specific charges made against particular property for current or permanent benefits, such as special assessments. TIF‐ Tax Increment Financing. A method of using incremental increases in property tax values to fund the improvements or efforts of a designated area. TRANSFERS IN/OUT‐ Amounts transferred from one fund to another to assist in financing the services from the recipient fund.
196

UNRESERVED FUND BALANCE ‐ The portion of a fund’s balance that is not restricted for a specific purpose and is available for general appropriation.
USER CHARGES OR FEES ‐ The payment of a fee for direct receipt of a public service by the party benefiting from the service.
WORKING CAPITAL ‐ The different between current assets and current liabilities.
WORKLOAD INDICATOR ‐ A unit of work to be done (e.g. number of permit applications received for the number of burglaries to be investigated.)
WRF ‐ Water Reclamation Facility; commonly referred to in the past as a Wastewater Treatment Plant.
197