fiscal year 2019 -20 annual budget proposal · fiscal year 2019 -20 annual budget proposal 2nd...
TRANSCRIPT

Agenda Item 6b - Attachment 1 Page 1 of 23
California Public Employees’ Retirement System Fiscal Year 2019-20 Annual Budget Proposal 2nd Reading May 14, 2019

Agenda Item 6b - Attachment 1 Page 2 of 23
Table of Contents
A. Executive Summary and Highlights .................................................................................... 3
B. 2018-19 Current Year Update ............................................................................................... 5
C. CalPERS Budget Process .................................................................................................... 7
D. 2019-20 Proposed Budget ................................................................................................... .8
I. Administrative Operating Costs ...................................................................................... 10
II. Investment Operating Costs ........................................................................................... 13
III. Investment External Management Fees ......................................................................... 15
IV. Third Party Administrator Fees....................................................................................... 17
V. Enterprise Project Costs ................................................................................................ 18
VI. Headquarters Building Costs ......................................................................................... 20
E. Appendix
I. Administrative Operating Costs by Branch ..................................................................... 22
II. Administrative Budget by Trust Fund ............................................................................. 23

Agenda Item 6b - Attachment 1 Page 3 of 23
A. Executive Summary and Highlights
Executive Summary and Highlights CalPERS’ proposed budget represents the financial resources needed to achieve strategic priorities and initiatives, meet core business needs, and further the mission of delivering retirement and health care benefits to members and their beneficiaries. The budget supports CalPERS’ five strategic goals:
• Fund Sustainability • Health Care Affordability • Reduce Complexity • Risk Management • Talent Management
The total 2019-20 proposed budget is $1.898 billion; an increase of $199.4 million, or 11.7 percent, over the 2018-19 authorized budget. Total authorized positions remain unchanged at 2,875.
Following are the major highlights of the 2019-20 proposed budget:
• Administrative Operating Costs include $6.3 million to conform with the Board’s February 2019 action to increase Investment Office salaries in alignment with the strategic goal of Talent Management and promoting a high-performing workforce.
• Administrative Operating Costs include $19.7 million to fund compensation increases negotiated through the State’s collective bargaining process.
• All permanent positions funded in the temporary help blanket are eliminated.
2017-18Actual
$ Increase / (Decrease)
% Increase / (Decrease)
Administrative Operating Costs $ 444,065 $ 498,107 $ 530,299 $ 32,192 6.5%
Investment Operating Costs 68,425 93,421 120,436 27,015 28.9%
Investment External Management Fees 727,208 767,009 899,791 132,782 17.3%
Third Party Administrator Fees 288,652 305,612 319,273 13,660 4.5%
Total: Operating Costs $ 1,528,350 $ 1,664,149 $ 1,869,798 $ 205,650 12.4%
Enterprise Project Costs 22,366 9,591 3,352 (6,240) (65.1%)
Headquarters Building Costs 23,603 24,372 24,374 1 0.0%
CalPERS Total Budget $ 1,574,319 $ 1,698,112 $ 1,897,524 $ 199,411 11.7%
Authorized Positions 2,875.0 2,875.0 2,875.0 - 0.0%
2019-20 Total Budget2018 to 2019 Change2018-19
AuthorizedBudget
2019-20 Proposed
Budget(in thousands)
Agenda Item 6b - Attachment 1 Page 4 of 23
A. Executive Summary and Highlights
• Investment Operating Costs include $16 million to implement new trading platforms, and $4.9 million for Data and Analytics software subscriptions to improve Fund Sustainability.
• Investment External Management Fees increased $132.8 million as compared to 2018-19 and reflects asset allocation strategies and asset class market assumptions to improve Fund Sustainability.
• In accordance with Senate Bill (SB) 1413, Chapter 665, Statutes of 2018, CalPERS will implement the California Employers Pension Prefunding Trust (CEPPT) program to provide an investment strategy to assist local governments plan for and fund their pension obligations.
• Enterprise Project Costs include $3.4 million for three projects to improve Fund Sustainability and Reduce Complexity within the organization. The projects will complete the final phase of the Actuarial Valuation System Redesign and Enhancement Project, continue development of the new Human Resources Management Solution, and implement a new online Member Electronic Payment System.
.

B. 2018 Current Year Update Agenda Item 6b - Attachment 1
Page 5 of 23
2018-19 Current-Year Update CalPERS’ 2018-19 total authorized budget is $1.698 billion. Of this amount, $750.4 million, or 44.2 percent, was expended as of December 31, 2018. Based on an analysis of resource utilization, CalPERS forecasts that it will end the 2018-19 fiscal year with approximately $26.8 million in unexpended funds, which equals 1.6 percent of the total budget.
The expenditure categories tracking well below 50 percent at mid-year include: • Investment Operating Costs – These expenses historically track at less than 50 percent due
to a lag in vendor invoicing. • Investment External Management Fees – These expenses historically track at less than 50
percent due to the timing of fee payments and market fluctuations. • Enterprise Project Costs – At mid-year, contract negotiations for the Contact Center Cloud
Migration and Human Resources Management System projects were delayed and funds had not been encumbered. The contract for the Contact Center Cloud Migration was subsequently executed in January 2019, and CalPERS expects to execute the contract for the Human Resources Management System by the end of the fiscal year.
• Headquarters Building Costs – Headquarters Building expenditures that were below 50 percent at mid-year were largely due to improvement projects that were in progress or yet to begin. For example, the project to convert HVAC controls began in October 2018 with an estimated completion date in June 2019. Similarly, the flooring project to accommodate the Call Center’s return from West Sacramento to Lincoln Plaza’s East building started in late November 2018, with an April 2019 completion date. Finally, the project to bring Lincoln Plaza North Building’s emergency lighting and notification systems up to current fire code is still in the design phase. The completion date for this project is dependent on the State Fire Marshal’s approval of design documents.
Forecast Savings
Administrative Operating Costs $498,107 $243,815 48.9% $476,691 $21,415Investment Operating Costs 93,421 28,788 30.8% 93,421 - Investment External Mgmt Fees 767,009 323,289 42.1% 767,009 - Third Party Administrator Fees 305,612 143,168 46.8% 300,575 5,037Total Operating Costs $1,664,149 $739,060 44.4% $1,637,696 $26,453Enterprise Projects Costs 9,591 2,671 27.9% 9,265 327Headquarters Building Costs 24,372 8,663 35.5% 24,372 - CalPERS Total Budget $1,698,112 $750,395 44.2% $1,671,333 $26,779
(in thousands)
2018-19 Expenditures and
Encumbrancesthru 12-31-18
Percent Expended
2018-19 Authorized
Budget

B. 2018 Current Year Update Agenda Item 6b - Attachment 1
Page 6 of 23
Of the $26.8 million forecasted savings, $21.4 million is in Administrative Operating Costs and is largely driven by $15.0 million in vacancy-related salary savings. There is also $5 million in savings in Operating Expense and Equipment (OE&E) categories, including general office expenses, data processing, and consultant services. In addition to projected savings in Administrative Operating Costs, CalPERS estimates $5.0 million in Third Party Administrator Fee savings resulting from actual enrollment data that identifies fewer enrollments in higher fee health plans than originally estimated.

B. 2017-18 Budget Message
C. CalPERS Budget Process Agenda Item 6b - Attachment 1
Page 7 of 23
CalPERS Budget Process For each fiscal year, CalPERS engages in two formal budget processes - an annual budget process and a mid-year review. The annual budget process is designed to develop the twelve-month budget for Board approval prior to the start of a new fiscal year on July 1st. In contrast, the mid-year budget review is to address new, critical, unforeseen, and emergency resource needs not included in the annual budget. The annual budget development process includes a review of existing budgeted resources as well as new funding requests to maintain, improve, or implement services, initiatives, and projects. Financial Office budget staff work collaboratively with each division to understand their organizational structures and business objectives as a basis for maintaining existing funding levels and approving requests for new resources. CalPERS utilizes a formal budget request process to consider, prioritize, and approve new resource requests. Pursuant to the CalPERS Budget Policy, the main criteria used to prioritize requests include:
• Mitigating risk • Identifying opportunities for cost efficiencies • Aligning with the Strategic Plan and Business Plan • Implementing CalPERS Board of Administration decisions and directives • Complying with legal mandates
Divisional senior management and executive leadership review and discuss all formal budget requests before final funding decisions are made. Development of the annual budget also includes a position pooling process that redirects vacancies to where they are most critically needed within the organization. The objective of this process is to limit unnecessary staffing and related budgetary increases, and to provide new staff resources to divisions with the highest needs.

C. 2016-17 Budget Forecast
D. 2019-20 Proposed Budget Agenda Item 6b - Attachment 1
Page 8 of 23
2019-20 Proposed Budget CalPERS’ total 2019-20 proposed budget is $1.898 billion; an increase of $199.4 million, or 11.7 percent, over the 2018-19 authorized budget.
As reflected below, the 2019-20 proposed budget reflects a $266.6 million increase in expenditures over the past five years.
2017-18Actual
$ Increase / (Decrease)
% Increase / (Decrease)
Administrative Operating Costs $ 444,065 $ 498,107 $ 530,299 $ 32,192 6.5%
Investment Operating Costs 68,425 93,421 120,436 27,015 28.9%
Investment External Management Fees 727,208 767,009 899,791 132,782 17.3%
Third Party Administrator Fees 288,652 305,612 319,273 13,660 4.5%
Total: Operating Costs $ 1,528,350 $ 1,664,149 $ 1,869,798 $ 205,650 12.4%
Enterprise Project Costs 22,366 9,591 3,352 (6,240) (65.1%)
Headquarters Building Costs 23,603 24,372 24,374 1 0.0%
CalPERS Total Budget $ 1,574,319 $ 1,698,112 $ 1,897,524 $ 199,411 11.7%
Authorized Positions 2,875.0 2,875.0 2,875.0 - 0.0%
2019-20 Total Budget2018 to 2019 Change2018-19
AuthorizedBudget
2019-20 Proposed
Budget(in thousands)
(in thousands)2015-16 Actual
2016-17 Actual
2017-18 Actual
2018-19 Authorized
Budget
2019-20 Proposed
Budget
Five-Year Change
Administrative Operating Costs $421,534 $437,809 $444,065 $498,107 $ 530,299 $108,765Investment Operating Costs 72,601 69,486 68,425 93,421 120,436 47,835Investment External Management Fees 794,486 613,509 727,208 767,009 899,791 105,305Third Party Administrator Fees 282,584 286,401 288,652 305,612 319,273 36,689
Total: Operating Costs $1,571,204 $1,407,206 $1,528,350 $1,664,149 $1,869,798 $298,594
Enterprise Projects Costs 32,074 34,088 22,366 9,591 3,352 (28,723)Headquarters Building Costs 27,682 26,230 23,603 24,372 24,374 (3,308)
CalPERS Total Budget $ 1,630,961 $ 1,467,524 $ 1,574,319 $ 1,698,112 $ 1,897,524 $ 266,563
Authorized Positions 2,765.0 2,880.0 2,875.0 2,875.0 2,875.0 110.00
Total Budget 2015-16 through 2019-20

C. 2016-17 Budget Forecast
D. 2019-20 Proposed Budget Agenda Item 6b - Attachment 1
Page 9 of 23
The major factors driving cost increases over the past five years include:
• Collectively bargained employee compensation increases added $53.6 million to Administrative Operating Costs.
• Investment-related technology expenses for data and analytical tools and new portfolio management platforms increased Investment Operating Costs by $32.3 million, and increased use of investment-related consultants for real estate and sustainable investment activities contributed an additional $5.2 million.
• Improved market performance increased the amount of Investment and External Management fees paid by $105 million. More specifically, assets in the Public Employees Retirement Fund (PERF) grew $56 billion between June 30, 2016, and June 30, 2018.
• Expanded health plan options, increased enrollments, and new Third Party Administrator contracts added $36.7 million in Third Party Administrator Fees.
Over this same timeframe, CalPERS actively engaged in efforts to streamline internal operations and achieve savings. As a result, CalPERS:
• Eliminated 98 permanent blanket positions by transitioning team members into authorized position vacancies.
• Reduced temporary help expenditures by $8.6 million. • Reduced Headquarters (HQ) Building expenses by $3.3 million.
The following pages detail the 2019-20 proposed budget by expenditure category.

I. Headquarters
D. 2019-20 Proposed Budget Agenda Item 6b - Attachment 1
Page 10 of 23
I. Administrative Operating Costs Administrative Operating Costs include personal services expenditures (i.e. salaries, wages, and benefits for permanent and temporary help staff) and other Operating Equipment and Expenses (OE&E) for each branch within CalPERS. Administrative Operating Costs in 2019-20 are proposed at $530.3 million. This is an increase of $32.2 million, or 6.5 percent, as compared to the 2018-19 authorized budget.
$ Increase / (Decrease)
% Increase / (Decrease)
[1] PERSONAL SERVICESSalaries & Wages $ 224,827 $ 254,581 $ 264,944 $ 10,363 4.1%Temporary Help 7,183 7,315 5,138 (2,177) (29.8% )Overtime 1,827 2,100 2,048 (51) (2.4% )Benefits 109,566 137,502 143,520 6,017 4.4%
Total Personal Services $ 343,402 $ 401,498 $ 415,650 $ 14,152 3.5%Vacancy Savings (18,738) 18,738 (100.0% )
Revised Total Personal Services $ 343,402 $ 382,759 $ 415,650 $ 32,891 8.6%
[2] OPERATING EXPENSES & EQUIPMENT General Expense $ 7,110 $ 9,552 $ 11,358 $ 1,806 18.9%Software 1,263 2,205 1,842 (363) (16.5% )Printing 2,085 1,963 1,990 27 1.4%Postage 3,899 3,336 2,843 (493) (14.8% )Communications 1,255 1,816 1,845 29 1.6%Data Processing Services 15,599 15,802 15,362 (440) (2.8% )Travel 2,311 3,257 3,580 323 9.9%Training 1,044 1,730 1,732 2 0.1%Medical Exam/Disability Travel 1,208 1,916 1,451 (466) (24.3% )Facilities Operations 5,724 5,464 5,390 (74) (1.4% )Central Administrative Services 24,411 26,195 25,567 (628) (2.4% )University Enterprises, Inc. 149 415 521 106 25.6%External Legal Counsel 3,246 6,007 5,877 (130) (2.2% )Professional Services 5,336 5,993 6,075 82 1.4%Consultants 18,524 21,946 20,025 (1,921) (8.8% )Audit Services 1,152 695 1,969 1,274 183.3%Federal Legislative Rep 870 600 600 0.0%Admin Hearings 1,391 1,300 1,418 118 9.1%Consolidated Data Centers 87 90 105 15 16.7%Equipment (Includes EDP) 4,000 5,064 5,098 34 0.7%
Total Operating Expenses & Equipment $ 100,663 $ 115,348 $ 114,649 $ (699) (0.6%)
Total Costs $ 444,065 $ 498,107 $ 530,299 $ 32,192 6.5%
2018 to 2019 Change
Administrative Operating Costs by Object of Expenditure
2017-18Actual
2018-19Authorized
Budget
2019-20Proposed
Budget(in thousands)

I. Headquarters
D. 2019-20 Proposed Budget Agenda Item 6b - Attachment 1
Page 11 of 23
The net increase in Administrative Operating Costs reflects a $32.9 million increase in Personal Services expenditures, slightly offset by a net $0.7 million decrease in OE&E. The Personal Services increase includes $19.7 million in estimated general salary and benefit increases negotiated through the State’s collective bargaining processes, and $6.3 million resulting from the Board’s February 2019 approval of salary increases for specific Investment Officer, Manager, and Director classifications. The net decrease in OE&E includes an increase in General Expenses of $1.8 million driven by a $0.7 million increase in legal expenses and a $1.0 million increase for fiduciary insurance coverage. CalPERS is evaluating the purchase of commercial fiduciary insurance for the Public Employees’ Retirement Fund (PERF) and related retirement fund operations. This insurance would eventually replace the existing fiduciary liability self-insurance program if the commercial policy is determined to be in the best interests of CalPERS. At present, the proposed commercial fiduciary insurance policy contemplates $100 million of coverage with an annual premium of approximately $1 million. CalPERS will separately review the current commercial fiduciary insurance policy for its health related funds and operations in the near future. These General Expense increases are offset by reductions in various other OE&E categories, the largest of which is a $1.9 million decrease in consultant expenditures. Of this decrease, $1.2 million reflects reduced consultant expenditures for the my|CalPERS system. Please refer to Appendix I for Administrative Operating Costs by branch. Authorized Positions CalPERS’ proposed budget holds the authorized position count at 2,875 and does not include any funding for permanent positions in the blanket. At its peak in 2012-13, there were 335 positions in the temporary help blanket that were for permanent, ongoing workload. Before the start of the 2019-20 fiscal year, CalPERS will transition the remainder of these blanket positions into vacant authorized positions. The following chart provides data on total authorized and permanent blanket positions over the past eight years.
2,571 2,696 2,727 2,765 2,880 2,875 2,875 2,875
335.0 234.0 160.0 98.0 59.0 40.0 16.0 0.0
1,000
1,500
2,000
2,500
3,000
3,500
2012-13 2013-14 2014-15 2015-16 2016-17 2017-18 2018-19 2019-20
Authorized Positions vs. Permanent BlanketsAs of July 1st of each year
Authorized Positions Permanent Blankets

I. Headquarters
D. 2019-20 Proposed Budget Agenda Item 6b - Attachment 1
Page 12 of 23
In its continuing effort to achieve efficiencies and cost savings, CalPERS implemented a position pooling process that coincides with developing the annual budget. Through this process, CalPERS redirects vacancies to where they are most critically needed in the organization. The following chart displays year-over-year position changes among CalPERS’ branches, and identifies the pooled positions available for redirection during the budget year.
Social Security Administration Since 1955, CalPERS has served as the designated State Social Security Administrator for California. In short, this entails overseeing contracts and reporting between the Federal Social Security Administration and approximately 2,300 state and local government employers. The Administrative Operating Costs budget includes personal services and OE&E for CalPERS to perform this work, and historically, residual interest earned on Social Security taxes deposited in the Old Age and Survivors’ Insurance (OASI) Trust Fund covered the expenditures. In 2019-20 however, there will be insufficient funding in the OASI Trust Fund to fund costs incurred. As a result, pursuant to Government Code Section 22551, CalPERS will begin charging an administrative fee to public employers that provide social security coverage to their employees. CalPERS is currently seeking Department of Finance approval of the fee structure, and will work with employer groups to notify them of this new fee.
Branch 2018-19 2019-20 Change
Actuarial Office 58.0 62.0 4.0
Communications & Stakeholder Relations 79.0 80.0 1.0
Customer Services and Support 866.5 868.5 2.0
Enterprise Compliance 26.0 24.0 (2.0)
Executive Office 16.0 18.0 2.0
Financial Office 217.0 204.0 (13.0)
General Counsel 141.0 141.0 0.0
Health Policy and Benefits 211.0 210.0 (1.0)
Investment Office 350.0 344.0 (6.0)
Operations and Technology 910.5 911.0 0.5
Position Pool 0.0 12.5 12.5
Total Authorized Positions 2,875.0 2,875.0 0.0
Authorized Positions by Branch

I. Headquarters
D. 2019-20 Proposed Budget Agenda Item 6b - Attachment 1
Page 13 of 23
II. Investment Operating Costs Investment Operating Costs include specific expenditures incurred for investment activities, such as consultants to inform the Board of investment initiatives or to support the implementation of investment technologies and platforms; external audit, legal, and appraisal services related to asset valuations; fund administration and custody; data and analytics software; and maintaining or implementing trading and portfolio management systems. Investment Operating Costs in 2019-20 are proposed at $120.4 million. This is an increase of $27 million, or 28.9 percent, as compared to the 2018-19 authorized budget.
$ Increase / (Decrease)
%Increase / (Decrease)
Investment Consultants $3,301 $9,300 $9,860 $560 6.0%
Board Consultants 4,817 4,633 5,221 588 12.7%
Technology Consultants 3,750 5,567 7,600 2,033 36.5%
Total Consultant Expenses $11,868 $19,501 $22,681 $3,180 16.3%
Audits $65 $705 $705 - 0.0%
Tax Advisory Services 1,001 1,200 1,200 - 0.0%
Master Custodian Fee 4,951 7,657 11,453 3,796 49.6%
Fund Administration Services / Fees 2,680 2,898 3,900 1,002 34.6%
External Legal 2,516 5,800 5,800 - 0.0%
Appraisal Fees 5,759 10,000 10,000 - 0.0%
Company Expense 854 890 950 60 6.7%
Miscellanous Operating Expense 2,309 300 300 - 0.0%
Total Operating Expenses $20,135 $29,450 $34,308 $4,858 16.5%
Data $4,678 $6,600 $7,500 $900 13.6%
Analytics 9,251 11,000 15,000 4,000 36.4%
Trading and Portfolio Management Systems 20,637 24,692 38,769 14,077 57.0%
Business Operations Tool 1,849 2,000 2,000 - 0.0%
Other Technology Expense 8 178 178 - 0.0%
Total Technology Expenses $36,422 $44,470 $63,447 $18,977 42.7%
Total Investment Operating Expenses $68,425 $93,421 $120,436 $27,015 28.9%
2017-18Actual
2018-19 Authorized
Budget
2019-20 Proposed
Budget
2018 to 2019 ChangeInvestment Operating Costs
(in thousands)

I. Headquarters
D. 2019-20 Proposed Budget Agenda Item 6b - Attachment 1
Page 14 of 23
Major Investment Operating Cost increases include:
• $1.1 million in Investment and Board Consultants related to contract fee increases and Global Fixed Income and Sustainable Investment strategies.
• $2.0 million for Technology Consultants to assist with the implementation of new platform solutions to improve fund sustainability.
• $3.8 million increase in Master Custodian Fees resulting from a higher fee structure for the new five-year contract beginning in 2018-19. The $7.6 million budgeted in 2018-19 did not reflect the new contract terms and is approximately $3.0 million lower than actual costs. Savings in other Investment Operating Expenses categories will cover this shortfall.
• $4.9 million increase in Data and Analytics subscription costs due to increased usage to internalize more investment functions related to the Total Fund strategy and provide enhanced analysis and reporting.
• $14.1 million increase to implement new portfolio management systems and platforms to provide better access to and utilization of data, and to monitor risk and performance across the Total Fund. The platforms include new multi-asset order management and trading, data strategy, active risk management, and liability modeling.

I. Headquarters
D. 2019-20 Proposed Budget Agenda Item 6b - Attachment 1
Page 15 of 23
III. Investment External Management Fees Investment External Management Fees represent amounts that CalPERS pays to external investment advisors with whom it contracts to manage specific portfolios. The Board approves Investment Advisor Contract extensions on an annual basis, and the contracts typically range from seven to twelve years. Details on investment fees paid are included in the Comprehensive Annual Financial Report (CAFR). CalPERS estimates annual Investment External Management Fees based on market assumptions and investment diversification strategies. Total Fees in 2019-20 are estimated at $899.8 million. This is an increase of $132.8 million, or 17.3 percent, as compared to the 2018-19 authorized budget. The drivers of this increase are in Private Equity base fees for the Pillars I and II asset allocation plans, and in Real Assets performance fees resulting from a strong market.
Basis Points Trend To evaluate the relation of investment-related expenditures to the total investments, CalPERS calculates expense ratios using basis points. The estimated expense ratio for the 2019-20 Proposed Budget is
$ Increase / (Decrease)
%Increase / (Decrease)
Global Equity $86,508 $93,000 $126,719 $33,719 36.3%
Fixed Income 7,890 10,003 13,793 3,790 37.9%
Real Assets 191,815 185,201 188,213 3,013 1.6%
Absolute Return Strategy 487 332 305 (27) (8.1%)
Private Equity 247,678 258,000 295,000 37,000 14.3%
Activist Funds 6,594 - - - -
Multi Asset Class 20,487 30,900 40,800 9,900 32.0%
Opportunistic Strategies - - 1,500 1,500 100%
External Mgmt - Base Fees $561,460 $577,436 $666,331 $88,895 15.4%
Global Equity $26,750 $84,896 $52,224 ($32,671) (38.5%)
Fixed Income 3,366 2,908 3,214 306 10.5%
Real Assets 123,998 100,969 176,021 75,052 74.3%
Absolute Return Strategy 1,647 800 - (800) (100.0%)
Multi Asset Class 9,987 - 2,000 2,000 100%
External Mgmt - Performance Fees $165,748 $189,573 $233,460 $43,887 23.2%
Total External Mgmt Fees $727,208 $767,009 $899,791 $132,782 17.3%
2017-18Actual
2018-19 Authorized
Budget
2019-20 Proposed
Budget
2018 to 2019 ChangeInvestment External Management Fees
(in thousands)

I. Headquarters
D. 2019-20 Proposed Budget Agenda Item 6b - Attachment 1
Page 16 of 23
26.8 basis points. As detailed in the next chart, the ratio is increasing as compared to prior years. While Administration and Investment Operating Costs are relatively flat, estimated increases in External Management Fees are driving the ratio higher.
$336,457$369,613
$391,474$414,627
$748
$865$936
$1,111
$135 $138 $169 $211
$0
$500
$1,000
$1,500
$2,000
$2,500
$0
$50,000
$100,000
$150,000
$200,000
$250,000
$300,000
$350,000
$400,000
$450,000
$500,000
2016-17Actual
2017-18Actual
2018-19Authorized
2019-20Proposed
Inves
tmen
t Exp
ense
s ($m
illions
)
Total
Inve
stmen
ts ($
millio
ns)
Total Investments vs. Investment Expenses2016-17 thru 2019-20
Total Investments Total Investment Expenses Investment Admin & Operating CostsNote: The bps calculation reflects Total Investment Expenses in relation to Total Inv estments.
Total Inv estment Expenses includes Inv estment External Management fees and Inv estment Admin & Operating Costs.
22.2 bps23.4 bps
23.9 bps
26.8 bps

I. Headquarters
D. 2019-20 Proposed Budget Agenda Item 6b - Attachment 1
Page 17 of 23
IV. Third Party Administrator Fees CalPERS contracts with Third Party Administrators to support the delivery of health and pension services with a focus on strengthening and improving long-term sustainability for its members. The Board approves the Third Party contracts with terms that typically extend five years and include annual fee increases. Third Party Administrator Fee expenses cover administration, recordkeeping, and participant communication services for the following programs:
• CalPERS Health Benefits Program • Long-Term Care Program • Supplemental Income Plan Program • California Employers’ Retiree Benefit Trust Fund Program (CERBT) • California Employers’ Pension Prefunding Trust Program (CEPPT)
Total Third Party Administrator Fees estimated in 2019-20 are $319.3 million. This is an increase of $13.7 million, or 4.5 percent, as compared to the 2018-19 authorized budget. The estimate is based on enrollment projections, including enrollments by plan type, and is typically revised during the mid-year budget process after the Board approves new health plan rates.
The year-over-year increase in Third Party Administrator Fees reflects annual fee increases included in the executed contracts. The California Employers Pension Prefunding Trust (CEPPT) program is a new program authorized by Senate Bill (SB) 1413, Chapter 665, Statutes of 2018. Expenditures for the CEPPT program in 2019-20 are funded by a General Fund appropriation authorized by SB 1413.
$ Increase / (Decrease)
%Increase / (Decrease)
Health Program $ 244,082 $ 259,495 $ 272,613 $ 13,118 5.1%Pharmacy Benefit Manager 19,677 21,682 22,451 769 3.5%
Total, Health $ 263,759 $ 281,178 $ 295,064 $ 13,887 4.9%
Long Term Care Program 21,221 20,732 20,151 (581) (2.8%)
Supplemental Income Plan 3,565 3,585 3,922 337 9.4%
California Employers' Retiree Benefit T rust (CERBT) 107 118 115 (3) (2.5%)
California Employers' Pension Prefunding Trust (CEPPT) - - 20 20 -
Total Third Party Administrator Fees $288,652 $305,612 $319,273 $13,660 4.5%
Third Party Administrator Fees
(in thousands) 2017-18Actual
2018-19Authorized
Budget
2019-20Proposed
Budget
2018 to 2019 Change
I. Headquarters
D. 2019-20 Proposed Budget Agenda Item 6b - Attachment 1
Page 18 of 23
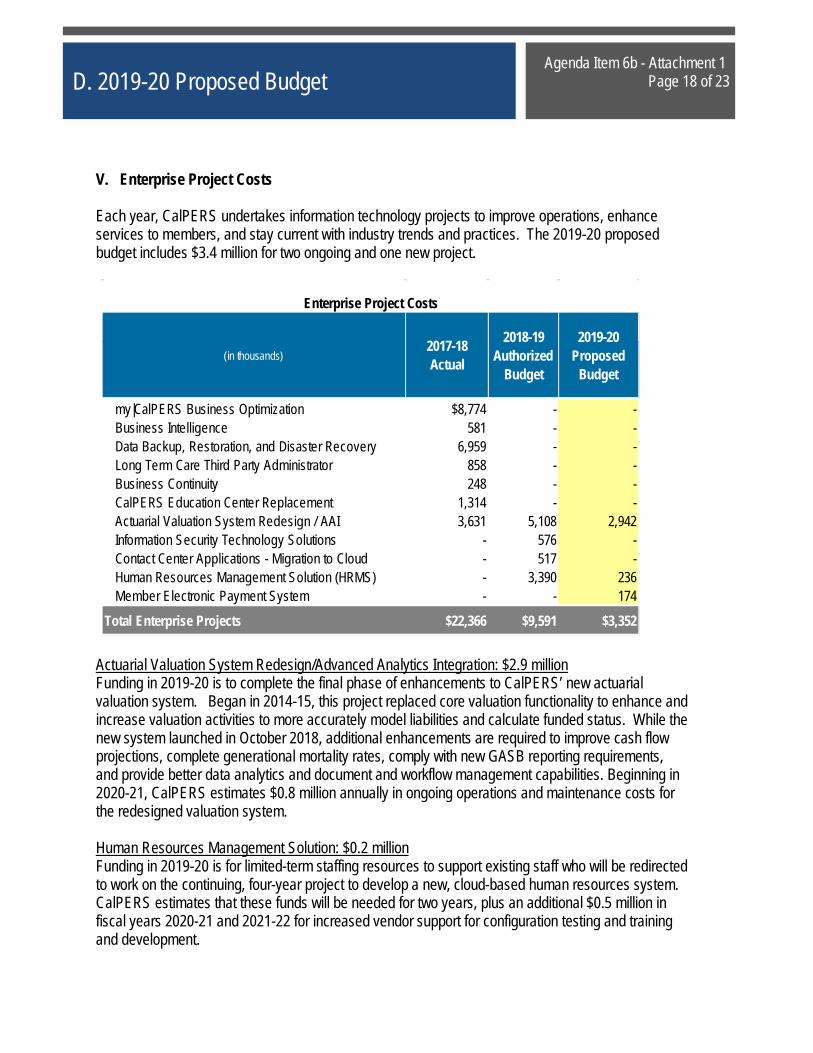
V. Enterprise Project Costs Each year, CalPERS undertakes information technology projects to improve operations, enhance services to members, and stay current with industry trends and practices. The 2019-20 proposed budget includes $3.4 million for two ongoing and one new project.
Actuarial Valuation System Redesign/Advanced Analytics Integration: $2.9 million Funding in 2019-20 is to complete the final phase of enhancements to CalPERS’ new actuarial valuation system. Began in 2014-15, this project replaced core valuation functionality to enhance and increase valuation activities to more accurately model liabilities and calculate funded status. While the new system launched in October 2018, additional enhancements are required to improve cash flow projections, complete generational mortality rates, comply with new GASB reporting requirements, and provide better data analytics and document and workflow management capabilities. Beginning in 2020-21, CalPERS estimates $0.8 million annually in ongoing operations and maintenance costs for the redesigned valuation system.
Human Resources Management Solution: $0.2 million Funding in 2019-20 is for limited-term staffing resources to support existing staff who will be redirected to work on the continuing, four-year project to develop a new, cloud-based human resources system. CalPERS estimates that these funds will be needed for two years, plus an additional $0.5 million in fiscal years 2020-21 and 2021-22 for increased vendor support for configuration testing and training and development.
my|CalPERS Business Optimization $8,774 - -Business Intelligence 581 - -Data Backup, Restoration, and Disaster Recovery 6,959 - -Long Term Care Third Party Administrator 858 - -Business Continuity 248 - -CalPERS Education Center Replacement 1,314 - -Actuarial Valuation System Redesign / AAI 3,631 5,108 2,942Information Security Technology Solutions - 576 -Contact Center Applications - Migration to Cloud - 517 -Human Resources Management Solution (HRMS) - 3,390 236Member Electronic Payment System - - 174
Total Enterprise Projects $22,366 $9,591 $3,352
(in thousands)2018-19
Authorized Budget
2019-20Proposed
Budget
2017-18 Actual
Enterprise Project Costs

I. Headquarters
D. 2019-20 Proposed Budget Agenda Item 6b - Attachment 1
Page 19 of 23
Member Electronic Payment System: $0.2 million The 2019-20 proposed budget includes funds to develop and implement a new electronic payment system to enable members and beneficiaries to make credit or debit card payments online. Implementation of an online payment system will result in improved collections and a reduction in staff resources to manually process the 34,000 paper checks received each year. CalPERS estimates that the new system will be functional by March 2020. Ongoing annual maintenance and operations expenditures are negligible.

I. Headquarters
D. 2019-20 Proposed Budget Agenda Item 6b - Attachment 1
Page 20 of 23
VI. Headquarters Building Costs
The HQ Building Budget reflects expenses incurred to operate, maintain, and improve the Lincoln Plaza Buildings. The budget also includes other expenses such as security and maintenance for regional offices, the offsite emergency operations center, the Front Street parking lot, and warehouse space. Also displayed are offsetting rent revenues earned. Total proposed HQ Building expenses in 2019-20 are $25.8 million. This is an increase of $0.3 million, or 1.2 percent, as compared to 2018-19.
$Increase/(Decrease)
%Increase/(Decrease)
Operating:Utilities $2,390 $2,291 $2,365 $74 3.2%Engineering Services 2,922 3,372 4,038 666 19.8%Janitorial 3,144 3,288 3,439 151 4.6%Landscaping 796 855 865 10 1.1%General Maintenance 1,234 1,447 1,215 (232) (16.1%)Security 2,399 2,598 2,911 313 12.1%Property Mgmt. & Administrative Fees 1,308 1,509 1,512 3 0.2%Café Plaza 306 176 247 71 40.2%Offsite Expenses1 634 642 961 320 49.8%Emergency Operations Center (EOC) 2 722 455 451 (4) (0.8%)Operating Other 3 1,946 1,860 2,022 162 8.7%
Total Operating Expenses 17,800 18,493 20,026 1,533 8.3%
Non-Operating:Owner Improvements 4 2,776 3,919 3,187 (732) (18.7%)Building Improvements 5 4,261 3,338 3,614 276 8.3%Furniture & Fixtures 1,810 563 300 (263) (46.7%)Building Insurance 4 610 360 (250) (41.0%)
Total Non-Operating Expenses 8,851 8,429 7,461 (968) (11.5%)
Subtotal Expenses $26,650 $26,923 $27,487 $565 2.1%
Less: Revenue6 1,636 1,404 1,655 250 17.8%
Total HQ Building Expenses $25,015 $25,519 $25,833 $314 1.2%
Less: Amount included in Admin. Budget 1,411 1,146 1,459 313 27.3%
Total Headquarters Building Budget $23,603 $24,372 $24,374 $1 0.0%
2018 to 2019 Change2019-20Proposed
Budget
2018-19Authorized
Budget
2017-18Actual
2019-20 Headquarters Building Account Budget
6 Estimated revenue from parking and the Subway, Chocolate Fish, and Montessori daycare leases.
(in thousands)
1 Offsite expenses include Front Street parking, warehouse space, and regional office security and maintenance. In 2019-20, CalPERS shifted $0.2 million in regional office security expenses from General Maintenance to Offsite Expenses to more accurately categorize these costs.2 EOC expenses include leasing costs, utilities, janitorial, security , landscaping, and generator maintenance.3 Other Operating expenses includes specialized maintenance, permitting, and testing of building electrical and HVAC systems, and green building initiatives.4 Owner Improvements include enhancements made to support operations and the movement of div isions, units, and/or staff within CalPERS. In 2019-20, CalPERS shifted $0.5 million in engineering salaries from this line item to Engineering Serv ices to more accurately categorize these costs.5 Building Improvements include structural alterations and repairs and related project management.

I. Headquarters
D. 2019-20 Proposed Budget Agenda Item 6b - Attachment 1
Page 21 of 23
Of the $25.8 million total costs, $1.5 million is budgeted as Facilities Operations expenses within the Administrative Operating Costs budget and represents the affiliate funds’ share of building expenses. The net $0.3 million year-over-year increase is due to the following:
• $1.5 million increase in Operating Expenses driven by contract wages for engineering, janitorial, and security staff, and for specialized maintenance of electrical and HVAC systems, including green building initiatives. The increase also reflects a shift in engineering staff salaries from Non-Operating Expenses to Operating Expenses to more accurately and consistently categorize the expenses.
• $1.0 million decrease in non-operating expenses resulting from the removal of one-time expenses to relocate the Call Center from West Sacramento to Lincoln Plaza, and the shift of engineering staff salaries to Operating Expenses.
• $0.3 million increase in estimated rent revenue that offsets expenditures. The proposed HQ Building Budget includes $3.4 million for building improvement projects in 2019-20, the largest of which is $2.1 million for water intrusion repairs. Also included are fire and life safety upgrades and other minor building alterations.

J. Appendix
E. Appendix Agenda Item 6b - Attachment 1
Page 22 of 23
I. Administrative Operating Costs by Branch
Following is the allocation of proposed Administrative Operating Costs by Branch. As discussed in Section D.1, salary increases are the primary drivers of the year-over-year changes.
$Increase / (Decrease)
%Increase / (Decrease)
Actuarial Office $ 9,987 $ 11,353 $ 12,465 $ 1,111 9.8%
Communications and Stakeholder Relations 14,885 15,489 17,046 1,557 10.1%
Customer Services and Support 92,797 104,023 107,245 3,222 3.1%
Enterprise Compliance Office 2,794 3,191 3,359 168 5.3%
Executive Office 6,849 6,570 7,719 1,149 17.5%
Financial Office1 24,411 31,863 37,251 5,387 16.9%
General Counsel 24,518 28,552 31,627 3,075 10.8%
Health Policy and Benefits Branch 27,194 32,398 33,908 1,510 4.7%
Investment Office 69,812 75,422 91,026 15,605 20.7%
Operations and Technology 146,407 163,051 163,086 35 0.0%
Pro-Rata Assessment 24,411 26,195 25,567 (628) (2.4%)
CalPERS Total Budget $ 444,065 $ 498,107 $ 530,299 $ 32,192 6.5%1 Includes unallocated expenses such as Executive incentive payments, a reserve for retirement payouts, and pooled positions and related funding.
Administrative Budget by Branch2018 to 2019 Change2017-18
Actual
2018-19Authorized
Budget
2019-20Proposed
Budget(in thousands)

J. Appendix
E. Appendix Agenda Item 6b - Attachment 1
Page 23 of 23
II. Administrative Operating Costs by Fund
Following is the allocation of proposed Administrative Operating Costs to each trust fund based on a combined direct and indirect methodology. In general, the year-over-year increases to the funds reflect overall salary increases as discussed in Section D.I. For some trusts, decreases for specific circumstances offset the increases. More specifically, the Health Care Fund decreases because of a reduced pro-rata assessment as well as a shift in health plan participant enrollment. In addition, the Judges and Legislators Retirement Funds have decreases due to a reduction in legal expenses.
Actual 2018-19Authorized
2019-20 Proposed
$Increase / (Decrease)
% Increase / (Decrease)
Public Employees' Retirement Fund (PERF) 358,893$ 397,317$ 425,603$ 28,286$ 7.1%
Public Employees' Contingency Reserve Fund (CRF)1 28,665 32,088 33,792 1,704 5.3%
Public Employees' Health Care Fund (HCF)1 39,907 47,109 46,963 (146) (0.3%)
Long-Term Care Fund (LTCF) 5,163 6,036 7,607 1,571 26.0%
Annuitants' Health Care Coverage Fund (AHCCF) 3,434 4,808 5,493 685 14.2%
Deferred Compensation Fund (IRC 457) 1,598 1,884 1,768 (116) (6.2%)
Supplemental Contributions Program Fund (SCP) 137 140 123 (17) (12.1%)
Judges' Retirement Fund (JRF) 1,680 2,546 1,997 (549) (21.6%)
Judges' Retirement Fund II (JRF II) 2,082 2,841 2,277 (564) (19.9%)
Legislators' Retirement Fund (LRF) 556 578 509 (69) (11.9%)
Replacement Benefit Custodial Fund (RBF) 450 450 537 87 19.3%
California Employers' Pension Prefunding Trust Fund (CEPPT) - - 423 423 100.0%
Old-Age & Survivors Insurance Fund (OASI) - - 988 988 100.0%
Reimbursements2 1,500 2,310 2,219 (91) (3.9%)
444,065$ 498,107$ 530,299$ 32,192$ 6.5%
Statewide Pro-Rata Assessment 24,411$ 26,195$ 25,567$ (628)$ (2.4%)
CalPERS Administrative Costs 419,654$ 471,912$ 504,732$ 32,820$ 7.0%
Total Administrative Operating Costs
1 These amounts include estimates for statewide employee compensation pending Department of Finance approval.2 Reimbursements include specialized actuarial valuations prepared for public agencies, cost of photocopies/postage related to the Public Records Act requests, annual employer conferences, and administrative assessments for employers' delinquent payroll.
Administrative Operating Costs by Fund 2018 to 2019 Change
(in thousands)