fiscal year 2013 subcommittee book department of fish … · fiscal year 2013 subcommittee book...
TRANSCRIPT
Fiscal Year 2013Subcommittee Book
Department of Fish and GameGovernor's Operating Budget Request
Legislative Finance DivisionBox 113200Juneau, AK 99811-3200(907) 465-3795www.legfin.state.ak.us
Column Definitions
11Actual (FY11 LFD Actual) - FY11 actual expenditures as adjusted by LFD.
12 CC (FY12 Conference Committee) - The FY2012 operating budget as approved by the Conference Committee on the Operating and Mental Health appropriation bills. The columndoes not include fiscal notes, special legislation or reappropriations. Appropriations in the language sections of the FY2012 operating budget bills are included in the ConferenceCommittee column.
12 Auth (FY12 Authorized) - The Conference Committee operating budget (adjusted for vetoes) plus fiscal notes, updated CC language estimates, operating appropriations made by otherbills, reappropriations, and funding carried forward from previous fiscal years.
12MgtPln (FY12 Management Plan) - Authorized level of expenditures at the beginning of FY2012 plus position adjustments and transfers (made at an agency's discretion) withinappropriations.
Adj Base (FY13 Adjusted Base) - FY2012 Management Plan less one-time items, plus FY2013 adjustments for position counts, funding transfers, line item transfers, temporaryincrements (IncT) from prior years, and additions for statewide items (risk management and most salary and benefit increases). The Adjusted Base is the "first cut" of the FY2013 budget;it is the base to which the Governor's and the Legislature's increments, decrements, and fund changes are added.
Gov (FY13 Governor Request) - Includes FY13 Adjusted Base plus the Governor's operating budget bill requests for increases (increments), decreases (decrements), fund sourcechanges, and language transactions.
TABLE OF CONTENTSOverview of Governor's Budget 1 . . . . . . . . . . . . . . . . . . . . . . . . . . . . . . . . . . . . . . . . . . . . . . . . . . . . . . . . . . . . . . . . . . . . . . . .
Budget SummaryAllocation Summary - All Funds 5 . . . . . . . . . . . . . . . . . . . . . . . . . . . . . . . . . . . . . . . . . . . . . . . . . . . . . . . . . . . . . . . . . . . . . . Allocation Summary - General Funds 7 . . . . . . . . . . . . . . . . . . . . . . . . . . . . . . . . . . . . . . . . . . . . . . . . . . . . . . . . . . . . . . . . . . . Agency Totals 9 . . . . . . . . . . . . . . . . . . . . . . . . . . . . . . . . . . . . . . . . . . . . . . . . . . . . . . . . . . . . . . . . . . . . . . . . . . . . . . . .
Department of Fish and GameCommercial Fisheries
Southeast Region Fisheries Management 12 . . . . . . . . . . . . . . . . . . . . . . . . . . . . . . . . . . . . . . . . . . . . . . . . . . . . . . . . . . . . . Central Region Fisheries Management 16 . . . . . . . . . . . . . . . . . . . . . . . . . . . . . . . . . . . . . . . . . . . . . . . . . . . . . . . . . . . . . . . AYK Region Fisheries Management 18 . . . . . . . . . . . . . . . . . . . . . . . . . . . . . . . . . . . . . . . . . . . . . . . . . . . . . . . . . . . . . . . . Westward Region Fisheries Management 20 . . . . . . . . . . . . . . . . . . . . . . . . . . . . . . . . . . . . . . . . . . . . . . . . . . . . . . . . . . . . . Headquarters Fisheries Management 22 . . . . . . . . . . . . . . . . . . . . . . . . . . . . . . . . . . . . . . . . . . . . . . . . . . . . . . . . . . . . . . . . Commercial Fisheries Special Projects 24 . . . . . . . . . . . . . . . . . . . . . . . . . . . . . . . . . . . . . . . . . . . . . . . . . . . . . . . . . . . . . . .
Sport FisheriesSport Fisheries 28 . . . . . . . . . . . . . . . . . . . . . . . . . . . . . . . . . . . . . . . . . . . . . . . . . . . . . . . . . . . . . . . . . . . . . . . . . . . Sport Fish Hatcheries 32 . . . . . . . . . . . . . . . . . . . . . . . . . . . . . . . . . . . . . . . . . . . . . . . . . . . . . . . . . . . . . . . . . . . . . . . .
Wildlife ConservationWildlife Conservation 34 . . . . . . . . . . . . . . . . . . . . . . . . . . . . . . . . . . . . . . . . . . . . . . . . . . . . . . . . . . . . . . . . . . . . . . . . Wildlife Conservation Special Projects 38 . . . . . . . . . . . . . . . . . . . . . . . . . . . . . . . . . . . . . . . . . . . . . . . . . . . . . . . . . . . . . . . Hunter Education Public Shooting Ranges 42 . . . . . . . . . . . . . . . . . . . . . . . . . . . . . . . . . . . . . . . . . . . . . . . . . . . . . . . . . . . . .
Administration and SupportCommissioner's Office 44 . . . . . . . . . . . . . . . . . . . . . . . . . . . . . . . . . . . . . . . . . . . . . . . . . . . . . . . . . . . . . . . . . . . . . . . Administrative Services 46 . . . . . . . . . . . . . . . . . . . . . . . . . . . . . . . . . . . . . . . . . . . . . . . . . . . . . . . . . . . . . . . . . . . . . . . Fish and Game Boards and Advisory Committees 48 . . . . . . . . . . . . . . . . . . . . . . . . . . . . . . . . . . . . . . . . . . . . . . . . . . . . . . . . . State Subsistence 50 . . . . . . . . . . . . . . . . . . . . . . . . . . . . . . . . . . . . . . . . . . . . . . . . . . . . . . . . . . . . . . . . . . . . . . . . . . EVOS Trustee Council 54 . . . . . . . . . . . . . . . . . . . . . . . . . . . . . . . . . . . . . . . . . . . . . . . . . . . . . . . . . . . . . . . . . . . . . . . State Facilities Maintenance 56 . . . . . . . . . . . . . . . . . . . . . . . . . . . . . . . . . . . . . . . . . . . . . . . . . . . . . . . . . . . . . . . . . . . . Fish and Game State Facilities Rent 58 . . . . . . . . . . . . . . . . . . . . . . . . . . . . . . . . . . . . . . . . . . . . . . . . . . . . . . . . . . . . . . . .
HabitatHabitat 60 . . . . . . . . . . . . . . . . . . . . . . . . . . . . . . . . . . . . . . . . . . . . . . . . . . . . . . . . . . . . . . . . . . . . . . . . . . . . . . . .
Commercial Fisheries Entry CommissionCommercial Fisheries Entry Commission 64 . . . . . . . . . . . . . . . . . . . . . . . . . . . . . . . . . . . . . . . . . . . . . . . . . . . . . . . . . . . . . .

This Page Intentionally Left Blank
Department of Fish and GameAll Dollars in Thousands
(GF Only) Change % Change See Note:FY12 Conference Committee (GF Only) $80,442.1
FY12 Fiscal Notes - CarryForward - Special Appropriations, Multi-Years & Contingents - Agency Transfers 175.8 Misc Adjustments - Vetoes -
FY12 Management Plan (GF only) $80,617.9 $175.8 0.2%One-time Items removed (845.7) Miscellaneous Adjustments - Short-Term Increments 570.0 FY13 Contractual Salary and Health Increases 2,135.1
FY13 Adjusted Base Budget (GF only) $82,477.3 $1,859.4 2.3%Lang/Lang OTIs/MiscAdj/Carryforward/MultiYears/Contingent - FY13 Governor's GF Increments/Decrements/Fund Changes 2,802.1
FY13 Governor's Agency Request (GF only) $85,279.4 $2,802.1 3.4%
FY13 Governor's Increments, Decrements, Fund Changes and Language FY13 Adjusted
Base Budget (GF Only)
FY13 Governor's
Request (GF only)
Change from FY13 Adj
Base to FY13 Governor's
Request See Note:Allocation $2,802.1SE Commercial Fisheries Management 8,584.2 8,844.2 260.0 3AYK Commercial Fisheries Management 7,311.1 7,901.1 590.0 4Headquarters Fisheries Management 11,094.1 11,284.1 190.0 8Commercial Fisheries Special Projects 4,006.4 4,256.4 250.0 9Sport Fisheries 6,034.2 6,534.2 500.0 1Wildlife Conservation 6,944.0 7,094.0 150.0 5Boards and Advisory Committee 1,444.1 1,635.6 191.5 11State Subsistence 2,586.7 2,903.8 317.1 2Habitat 3,850.8 4,204.3 353.5 6, 7, 10
Non-General Fund Agency SummaryFY13 Adjusted Base Budget
FY13 Governor's
Request
Change from FY13 Adj
Base to FY13 Governor's
Request See Note:Other State Funds (all allocations) 57,383.9 61,684.1 4,300.2Federal Funds (all allocations) 63,346.0 62,346.0 (1,000.0)Total Non-General Funds (all allocations) $120,729.9 $124,030.1 $3,300.2
Position Changes (From FY12 Management Plan to Gov) 1,749 1,690 (59)PFT 924 911 (13) PPT 757 711 (46) Temp 68 68 -
Governor's Capital Request State Funds (GF + Other)
Federal Funds Total See Note:
Planning and Research 5,464.0 7,500.0 12,964.0 Maintenance and Repairs 2,900.0 - 2,900.0 Remodel, Reconstruction and Upgrades 4,400.0 - 4,400.0 New Construction and Land Acquisition 1,266.3 1,875.0 3,141.3 Equipment and Materials 2,113.0 - 2,113.0 Information Systems and Technology - - - Other - - - 12
TOTAL CAPITAL $16,143.3 $9,375.0 $25,518.3
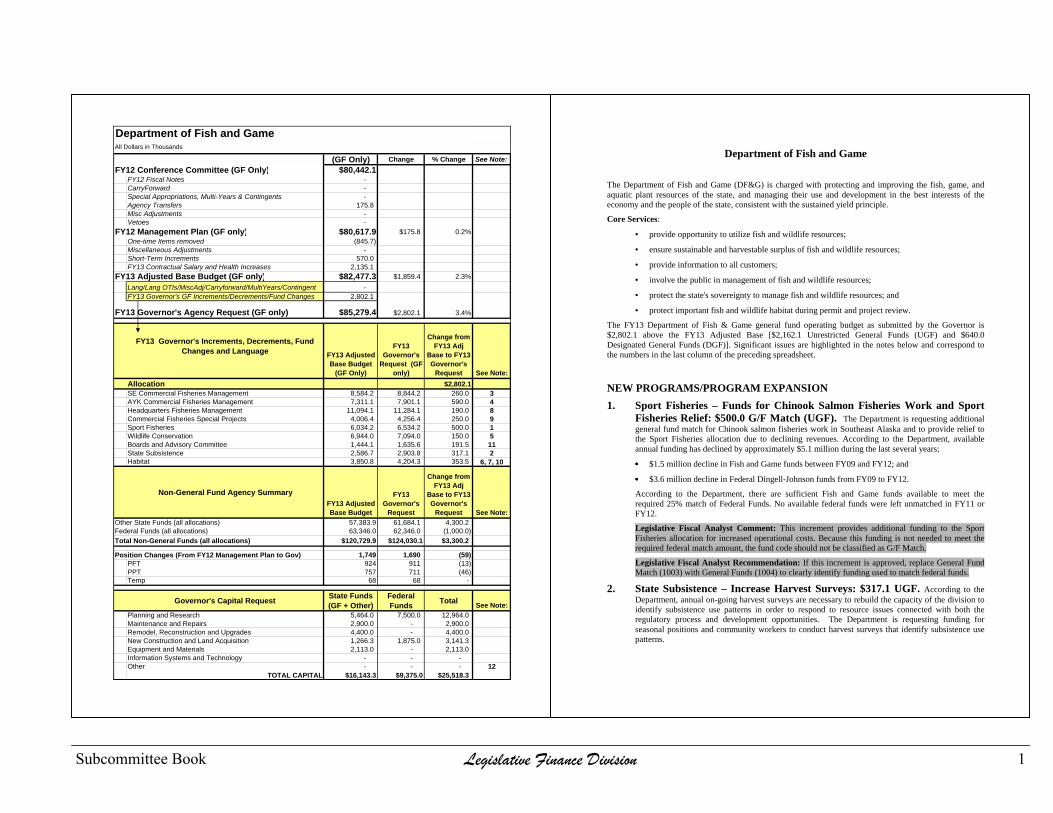
Department of Fish and Game The Department of Fish and Game (DF&G) is charged with protecting and improving the fish, game, and aquatic plant resources of the state, and managing their use and development in the best interests of the economy and the people of the state, consistent with the sustained yield principle.
Core Services:
• provide opportunity to utilize fish and wildlife resources;
• ensure sustainable and harvestable surplus of fish and wildlife resources;
• provide information to all customers;
• involve the public in management of fish and wildlife resources;
• protect the state's sovereignty to manage fish and wildlife resources; and
• protect important fish and wildlife habitat during permit and project review.
The FY13 Department of Fish & Game general fund operating budget as submitted by the Governor is $2,802.1 above the FY13 Adjusted Base [$2,162.1 Unrestricted General Funds (UGF) and $640.0 Designated General Funds (DGF)]. Significant issues are highlighted in the notes below and correspond to the numbers in the last column of the preceding spreadsheet.
NEW PROGRAMS/PROGRAM EXPANSION 1. Sport Fisheries – Funds for Chinook Salmon Fisheries Work and Sport
Fisheries Relief: $500.0 G/F Match (UGF). The Department is requesting additional general fund match for Chinook salmon fisheries work in Southeast Alaska and to provide relief to the Sport Fisheries allocation due to declining revenues. According to the Department, available annual funding has declined by approximately $5.1 million during the last several years; •••• $1.5 million decline in Fish and Game funds between FY09 and FY12; and •••• $3.6 million decline in Federal Dingell-Johnson funds from FY09 to FY12. According to the Department, there are sufficient Fish and Game funds available to meet the required 25% match of Federal Funds. No available federal funds were left unmatched in FY11 or FY12. Legislative Fiscal Analyst Comment: This increment provides additional funding to the Sport Fisheries allocation for increased operational costs. Because this funding is not needed to meet the required federal match amount, the fund code should not be classified as G/F Match.
Legislative Fiscal Analyst Recommendation: If this increment is approved, replace General Fund Match (1003) with General Funds (1004) to clearly identify funding used to match federal funds.
2. State Subsistence – Increase Harvest Surveys: $317.1 UGF. According to the Department, annual on-going harvest surveys are necessary to rebuild the capacity of the division to identify subsistence use patterns in order to respond to resource issues connected with both the regulatory process and development opportunities. The Department is requesting funding for seasonal positions and community workers to conduct harvest surveys that identify subsistence use patterns.
Subcommittee Book Legislative Finance Division 1

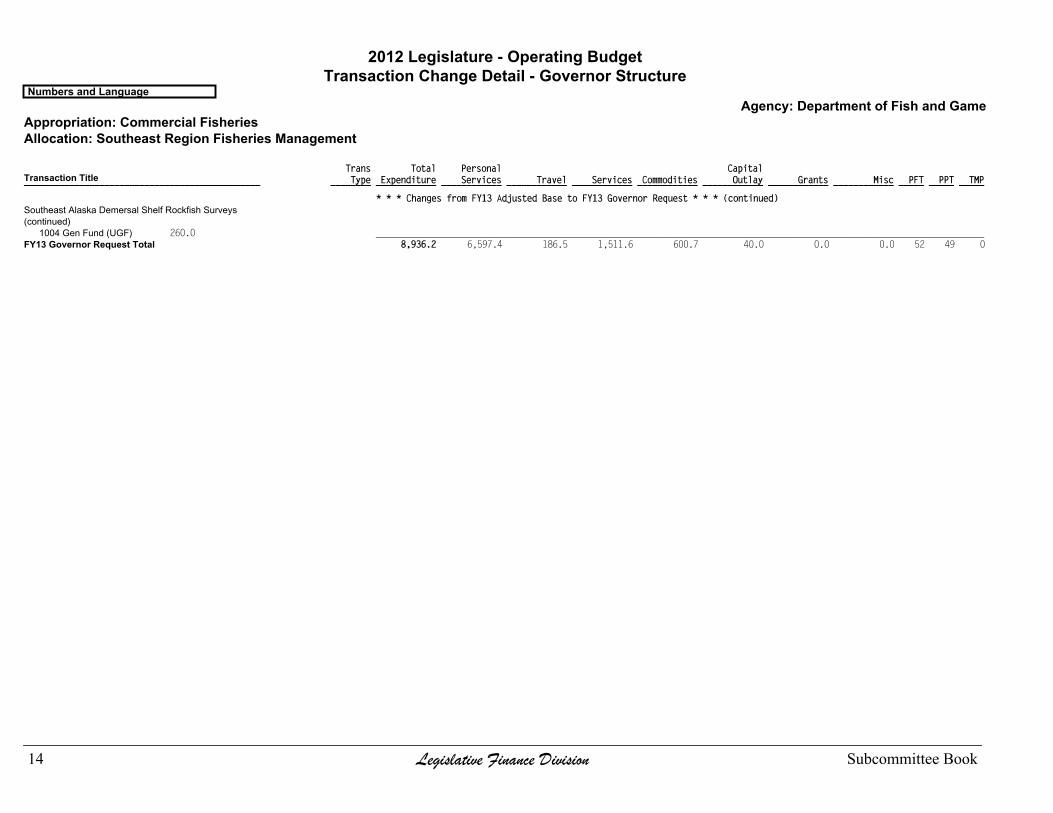
3. Commercial Fisheries SE Region Fisheries Mgmt – Southeast Alaska Demersal Shelf Rockfish Surveys: $260.0 UGF. This funding will provide an on-going demersal shelf rockfish stock assessment program in Southeast Alaska. According to the Department, there has been a lapse in surveys for many Southeast Alaska sub areas and the Gulf of Alaska Plan Team is requesting that additional surveys be conducted. Without these surveys, this fishery may be subject to more conservative management.
4. Commercial Fisheries AYK Region Fisheries Mgmt – Tanana River Sonar Project Operating & Equipment Costs: $200.0 UGF/ $390.0 GF/Program Receipts (DGF). The Department is requesting funding to implement a Tanana River Sonar project. This project will allow for daily estimates of king, chum, and coho salmon entering the Tanana River for in-season and post-season use to manage Tanana River fisheries, and by extension, provide additional information toward managing overall Yukon River salmon fisheries.
• $200.0 UGF for partial year on-going operational costs associated with this project (including seasonal employees and contractual costs). In FY14, the Department will request an additional $175.0 UGF for total annual estimated operating costs of $375.0; and
• $390.0 General Fund Program Receipts (DGF) as a one-time increment to purchase sonar equipment and supplies. The program receipts for this request have been identified as commercial crew member license fees.
5. Wildlife Conservation – Expand Spatial Analysis of Fish and Wildlife Data: $150.0 UGF. The Department is requesting additional funds to expand spatial data analysis capability. The Information Services program provides a public service to hunters, but currently there is no statewide spatial approach for consolidating, managing and disseminating wildlife data and information. The requested funding will allow the division to provide the Habitat Division, industry, federal agencies, non-governmental organizations and the public with information on subjects like important big game areas, wildlife corridors, wintering areas and calving grounds summarized in a useable, geospatial format and provide online tools that can display summary fish and wildlife information concurrent with development projects.
6. Habitat – Oil and Gas Related Pre-Permitting Activities: $103.5 UGF. Additional general funds are requested to support an existing vacant position to conduct pre-permitting science and planning for oil and gas development activities.
Legislative Fiscal Analyst Comment: In FY12 the legislature denied a similar request to fund an existing vacant full-time position (Habitat Biologist IV) to participate in planning and permitting of gasline projects.
7. Habitat – Title 16 & Title 41 Increased Workload & Permit Streamlining and Reform: $65.0 UGF. Habitat provides pre-project review, permitting, monitoring and compliance for a variety of projects, including mining, public works, oil and gas and transportation. The Department is requesting additional funds to cover personal services costs associated with an increasing workload related to these Title 16 & Title 41 activities. This funding will also allow for participation in the Governor’s initiative relating to permit streamlining and reform.
MAINTENANCE OF SERVICES 8. Commercial Fisheries Headquarters Management – Pacific Salmon
Treaty Chinook Technical Committee Support: $190.0 UGF. This request will fund a Fisheries Scientist I position to implement the current Chinook salmon annex of the Pacific Salmon Treaty and serve on the Chinook Technical Committee. A vacant position was transferred
from the Commercial Fisheries Special Projects allocation to replace the previous long-term nonpermanent positions that performed this function. The long-term nonpermanent positions were funded through various federal funding sources that are no longer available.
9. Commercial Fisheries Special Projects – Additional Dive Fishery Revenue: $250.0 GF/Program Receipts (DGF). Additional program receipt authorization is being requested to allow for the pass-through of dive tax assessment revenue. Revenue is collected from a seven percent assessment on the landed value of geoducks and red sea urchins and a five percent assessment on sea cucumbers. Money is passed on to the Southeast Alaska Regional Dive Fisheries Association (SARDFA) and is also retained in the Department for fishery management costs. This increment will increase the receipt authority for SARDFA from $555.7 to $805.7 and is due to projected increases in both price and harvest level over FY12.
10. Habitat – Continue Title 16 & Title 41 Pre-Project Review, Permitting, Monitoring and Compliance: $185.0 UGF. Habitat provides pre-project review, permitting, monitoring and compliance for a variety of projects, including mining, public works, oil and gas and transportation. Some of these Title 16 & Title 41 activities were previously federally funded by Alaska Coastal Management Program funds ($100.0) and Forest Resources and Practices Act funds ($85.0) which are no longer available. These federal funds were previously received as Inter-agency Receipts and the Department is requesting additional general funds to continue the current permit workload.
11. Fish and Game Boards and Advisory Committees – Board Member Honorarium and Meeting Costs: $191.5 UGF. The Department is requesting additional funding to cover increased Board Member honorarium costs, to fully fund all advisory committee positions, and to meet increased travel costs for additional board meetings. During the past few years, increased costs have been absorbed. For instance, board member pay is tied to a range 20A in the state pay system, but funding for annual cost-of-living increases has not been added to the budget and additional board meetings and teleconferences have resulted in additional travel costs. During the past few years, the Department kept two positions vacant (a Bethel coordinator position in FY11 and a Dillingham coordinator position in FY12) to offset these increased costs.
OTHER ISSUES 12. Fish and Game Fund Shortfall. The Governor’s capital budget request includes a $5
million deposit of general funds into the Fish and Game fund. Although this approach addresses the declining balance of the Fish & Game fund, it raises several concerns:
• According to the Department, this funding will be deposited into the Sport Fish subfund. However, unless the appropriation is more specific, it will be difficult to know whether the general funds are going into the Wildlife Conservation subfund or the Sport Fish subfund.
• An appropriation of general funds to the Fish and Game fund would cause the fund to be reclassified from a dedicated fund to a duplicated state fund. See discussion in section 12 of the analysis of language in the Governor’s capital budget (Overview publication) for details.
• The proposed approach is likely to absorb substantial time in subcommittee as members discuss whether the amount of Fish and Game funds requested in the FY13 budget can be sustained if the balance of the fund is not increased as requested in subsection 12(b) of the capital bill.
Legislative Fiscal Analyst Recommendation: If the legislature wishes to provide additional general funds for departmental operations, direct appropriations would be far less complicated and more transparent than the method proposed.
2 Legislative Finance Division Subcommittee Book
Legislative Fiscal Analyst Comment: In addition to a general fund deposit to the Fish and Game Fund, section 12 of the Governor’s capital budget amends the appropriation made for facility upgrades, improvements and construction for the sport fish hatchery in Anchorage to include operating costs. The proposal would hide the true cost of operating the sport fish hatchery in Anchorage until the capital funds have been exhausted. At that time, the Department may request money to operate the Anchorage Sport Fish Hatchery in the operating budget.
13. Commercial Fisheries Entry Commission (CFEC). The Governor’s operating budget request includes open-ended language allowing the CFEC to carry forward program receipts from licenses, permits and other fees. Similar language in recent years has allowed the carryforward balance to exceed $4 million. The Governor’s capital budget request proposes spending $3.9 million of “surplus” CFEC Receipts for capital projects.
Legislative Fiscal Analyst Recommendation: The legislature may wish to consider removing the carryforward language or limiting the amount of carryforward. The excess receipts collected will lapse to the general fund.
ORGANIZATIONAL CHANGES There are no significant organizational changes requested.
CAPITAL REQUEST The Governor’s FY13 Department of Fish and Game capital budget totals $25.5 million ($10.8 million UGF/ $3.9 DGF/ $9.4 million Federal Receipts/ $1.5 Other Funds). A few of the projects requested include:
• $3.7 million for Replacement of the Research Vessel (R/V) Resolution ($3,700.0 UGF);
• $1.813 million for a Kenai River King Salmon Sonar Assessment Program ($1,813.0 UGF);
• $2.5 million for Wild/Hatchery Salmon Hatchery Tools [$2,500.0 CFEC Receipts (DGF)];
• $1.55 million for Endangered Species Act Candidate Species: ($1,550.0 UGF);
• $1.4 million for Statewide Facility Deferred Maintenance Projects ($1,400.0 UGF);
• $1 million for Facilities, Vessels, and Aircraft Maintenance, Repair and Upgrades ($1,000.0 UGF);
• $7.5 million for Pacific Coastal Salmon Recovery Fund ($7,500.0 Federal Receipts); and
• $2.5 million for Sport Fish Recreational Boating Access [$1,875.0 Federal Receipts/ $625.0 F&G Funds (Other)].
Subcommittee Book Legislative Finance Division 3
This Page Intentionally Left Blank
4 Legislative Finance Division Subcommittee Book
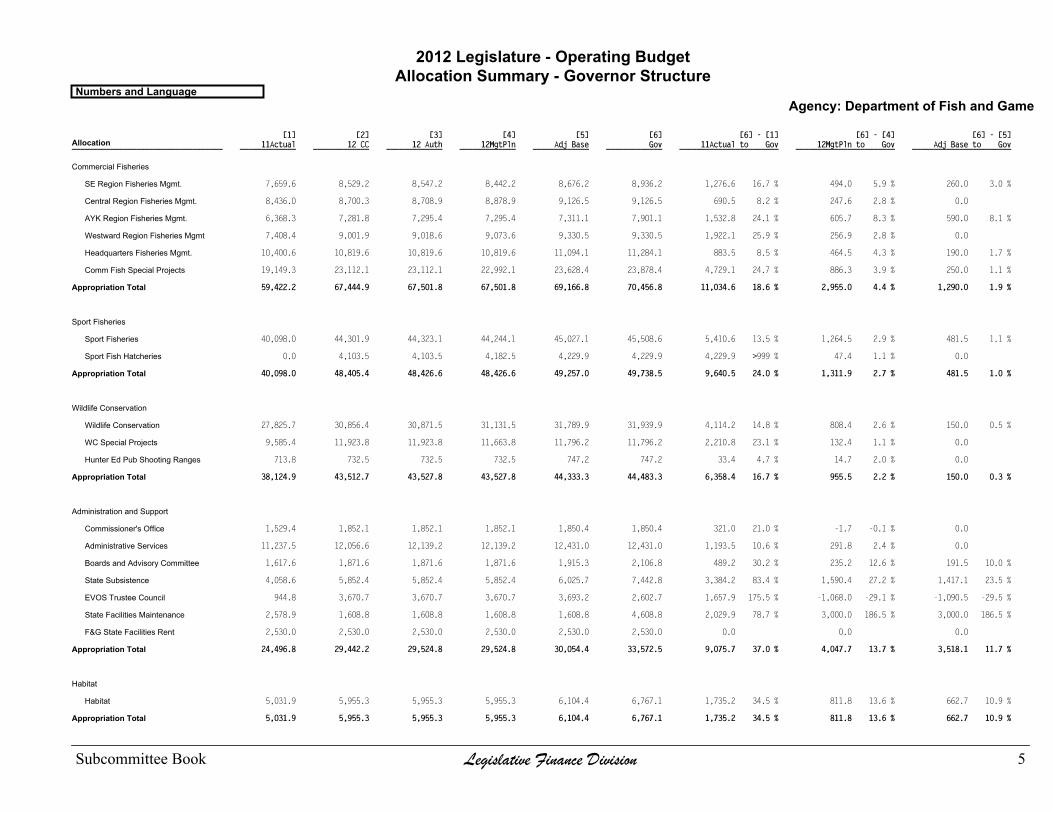
2012 Legislature - Operating BudgetAllocation Summary - Governor Structure
Numbers and LanguageAgency: Department of Fish and Game
[1] [2] [3] [4] [5] [6] [6] - [1] [6] - [4] [6] - [5] 11Actual 12 CC 12 Auth 12MgtPln Adj Base Gov 11Actual to Gov 12MgtPln to Gov Adj Base to Gov _____________ _____________ _____________ _____________ _____________ _____________ _______________________ _______________________ _______________________Allocation___________________________________
Commercial Fisheries
7,659.6 8,529.2 8,547.2 8,442.2 8,676.2 8,936.2 1,276.6 16.7 % 494.0 5.9 % 260.0 3.0 %SE Region Fisheries Mgmt.
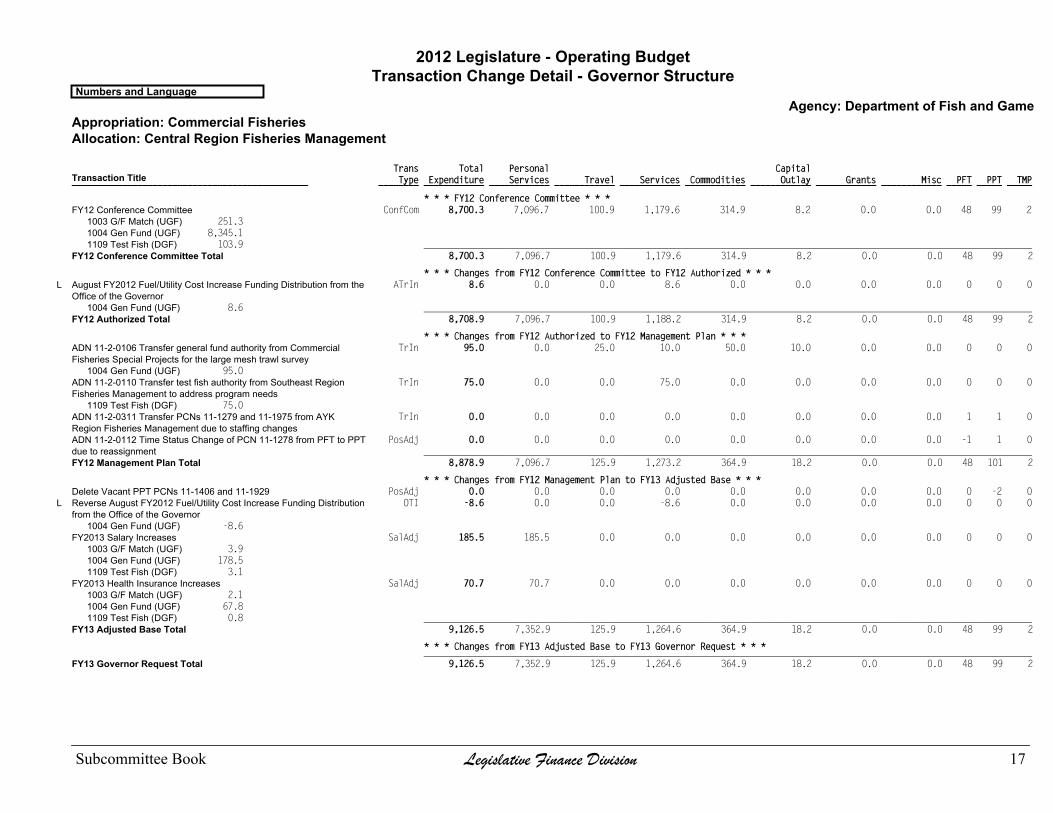
8,436.0 8,700.3 8,708.9 8,878.9 9,126.5 9,126.5 690.5 8.2 % 247.6 2.8 % 0.0 Central Region Fisheries Mgmt.
6,368.3 7,281.8 7,295.4 7,295.4 7,311.1 7,901.1 1,532.8 24.1 % 605.7 8.3 % 590.0 8.1 %AYK Region Fisheries Mgmt.
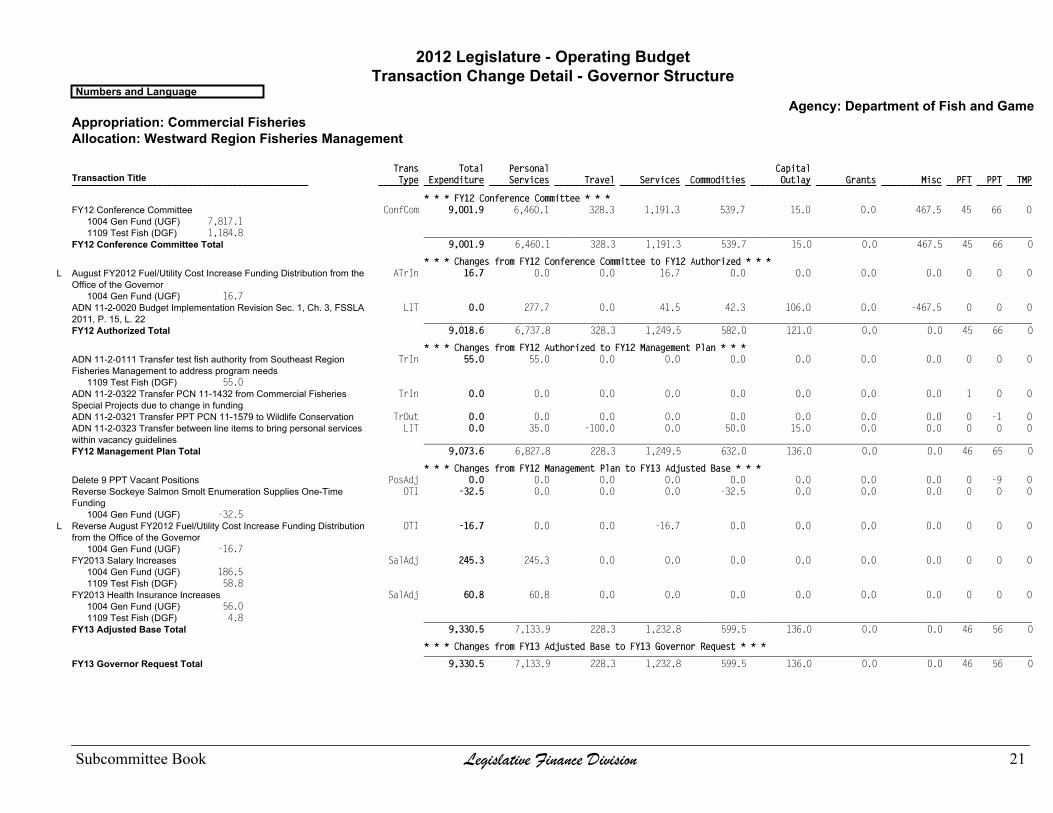
7,408.4 9,001.9 9,018.6 9,073.6 9,330.5 9,330.5 1,922.1 25.9 % 256.9 2.8 % 0.0 Westward Region Fisheries Mgmt
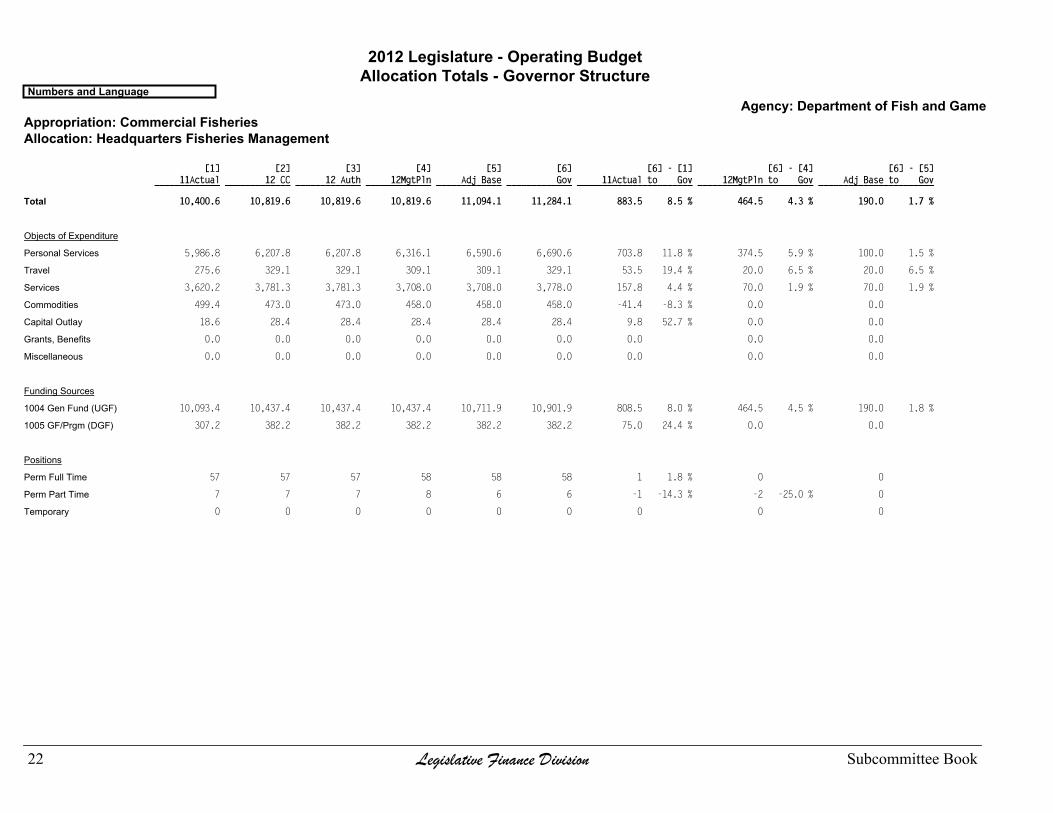
10,400.6 10,819.6 10,819.6 10,819.6 11,094.1 11,284.1 883.5 8.5 % 464.5 4.3 % 190.0 1.7 %Headquarters Fisheries Mgmt.
19,149.3 23,112.1 23,112.1 22,992.1 23,628.4 23,878.4 4,729.1 24.7 % 886.3 3.9 % 250.0 1.1 %Comm Fish Special Projects
59,422.2 67,444.9 67,501.8 67,501.8 69,166.8 70,456.8 11,034.6 18.6 % 2,955.0 4.4 % 1,290.0 1.9 %Appropriation Total
Sport Fisheries
40,098.0 44,301.9 44,323.1 44,244.1 45,027.1 45,508.6 5,410.6 13.5 % 1,264.5 2.9 % 481.5 1.1 %Sport Fisheries
0.0 4,103.5 4,103.5 4,182.5 4,229.9 4,229.9 4,229.9 >999 % 47.4 1.1 % 0.0 Sport Fish Hatcheries
40,098.0 48,405.4 48,426.6 48,426.6 49,257.0 49,738.5 9,640.5 24.0 % 1,311.9 2.7 % 481.5 1.0 %Appropriation Total
Wildlife Conservation
27,825.7 30,856.4 30,871.5 31,131.5 31,789.9 31,939.9 4,114.2 14.8 % 808.4 2.6 % 150.0 0.5 %Wildlife Conservation
9,585.4 11,923.8 11,923.8 11,663.8 11,796.2 11,796.2 2,210.8 23.1 % 132.4 1.1 % 0.0 WC Special Projects
713.8 732.5 732.5 732.5 747.2 747.2 33.4 4.7 % 14.7 2.0 % 0.0 Hunter Ed Pub Shooting Ranges
38,124.9 43,512.7 43,527.8 43,527.8 44,333.3 44,483.3 6,358.4 16.7 % 955.5 2.2 % 150.0 0.3 %Appropriation Total
Administration and Support
1,529.4 1,852.1 1,852.1 1,852.1 1,850.4 1,850.4 321.0 21.0 % -1.7 -0.1 % 0.0 Commissioner's Office
11,237.5 12,056.6 12,139.2 12,139.2 12,431.0 12,431.0 1,193.5 10.6 % 291.8 2.4 % 0.0 Administrative Services
1,617.6 1,871.6 1,871.6 1,871.6 1,915.3 2,106.8 489.2 30.2 % 235.2 12.6 % 191.5 10.0 %Boards and Advisory Committee
4,058.6 5,852.4 5,852.4 5,852.4 6,025.7 7,442.8 3,384.2 83.4 % 1,590.4 27.2 % 1,417.1 23.5 %State Subsistence
944.8 3,670.7 3,670.7 3,670.7 3,693.2 2,602.7 1,657.9 175.5 % -1,068.0 -29.1 % -1,090.5 -29.5 %EVOS Trustee Council
2,578.9 1,608.8 1,608.8 1,608.8 1,608.8 4,608.8 2,029.9 78.7 % 3,000.0 186.5 % 3,000.0 186.5 %State Facilities Maintenance
2,530.0 2,530.0 2,530.0 2,530.0 2,530.0 2,530.0 0.0 0.0 0.0 F&G State Facilities Rent
24,496.8 29,442.2 29,524.8 29,524.8 30,054.4 33,572.5 9,075.7 37.0 % 4,047.7 13.7 % 3,518.1 11.7 %Appropriation Total
Habitat
5,031.9 5,955.3 5,955.3 5,955.3 6,104.4 6,767.1 1,735.2 34.5 % 811.8 13.6 % 662.7 10.9 %Habitat
5,031.9 5,955.3 5,955.3 5,955.3 6,104.4 6,767.1 1,735.2 34.5 % 811.8 13.6 % 662.7 10.9 %Appropriation Total
Subcommittee Book Legislative Finance Division 5

2012 Legislature - Operating BudgetAllocation Summary - Governor Structure
Numbers and LanguageAgency: Department of Fish and Game
[1] [2] [3] [4] [5] [6] [6] - [1] [6] - [4] [6] - [5] 11Actual 12 CC 12 Auth 12MgtPln Adj Base Gov 11Actual to Gov 12MgtPln to Gov Adj Base to Gov _____________ _____________ _____________ _____________ _____________ _____________ _______________________ _______________________ _______________________Allocation___________________________________
Commercial Fisheries Entry Com
3,473.3 4,198.5 4,198.5 4,198.5 4,291.3 4,291.3 818.0 23.6 % 92.8 2.2 % 0.0 Commercial Fish Entry Com
3,473.3 4,198.5 4,198.5 4,198.5 4,291.3 4,291.3 818.0 23.6 % 92.8 2.2 % 0.0 Appropriation Total
170,647.1 198,959.0 199,134.8 199,134.8 203,207.2 209,309.5 38,662.4 22.7 % 10,174.7 5.1 % 6,102.3 3.0 %Agency Total
Funding Summary
65,009.1 72,070.9 72,246.7 72,246.7 73,910.6 76,072.7 11,063.6 17.0 % 3,826.0 5.3 % 2,162.1 2.9 %Unrestricted General (UGF)
6,834.6 8,371.2 8,371.2 8,371.2 8,566.7 9,206.7 2,372.1 34.7 % 835.5 10.0 % 640.0 7.5 %Designated General (DGF)
47,215.6 56,317.2 56,317.2 56,317.2 57,383.9 61,684.1 14,468.5 30.6 % 5,366.9 9.5 % 4,300.2 7.5 %Other State Funds (Other)
51,587.8 62,199.7 62,199.7 62,199.7 63,346.0 62,346.0 10,758.2 20.9 % 146.3 0.2 % -1,000.0 -1.6 %Federal Receipts (Fed)
6 Legislative Finance Division Subcommittee Book

2012 Legislature - Operating BudgetAllocation Summary - Governor Structure
Numbers and LanguageFund Groups: General Funds
Agency: Department of Fish and Game
[1] [2] [3] [4] [5] [6] [6] - [1] [6] - [4] [6] - [5] 11Actual 12 CC 12 Auth 12MgtPln Adj Base Gov 11Actual to Gov 12MgtPln to Gov Adj Base to Gov _____________ _____________ _____________ _____________ _____________ _____________ _______________________ _______________________ _______________________Allocation___________________________________
Commercial Fisheries
7,507.7 8,359.6 8,377.6 8,352.6 8,584.2 8,844.2 1,336.5 17.8 % 491.6 5.9 % 260.0 3.0 %SE Region Fisheries Mgmt.
8,436.0 8,700.3 8,708.9 8,878.9 9,126.5 9,126.5 690.5 8.2 % 247.6 2.8 % 0.0 Central Region Fisheries Mgmt.
6,368.3 7,281.8 7,295.4 7,295.4 7,311.1 7,901.1 1,532.8 24.1 % 605.7 8.3 % 590.0 8.1 %AYK Region Fisheries Mgmt.
7,408.4 9,001.9 9,018.6 9,073.6 9,330.5 9,330.5 1,922.1 25.9 % 256.9 2.8 % 0.0 Westward Region Fisheries Mgmt
10,400.6 10,819.6 10,819.6 10,819.6 11,094.1 11,284.1 883.5 8.5 % 464.5 4.3 % 190.0 1.7 %Headquarters Fisheries Mgmt.
3,058.6 4,113.8 4,113.8 3,913.8 4,006.4 4,256.4 1,197.8 39.2 % 342.6 8.8 % 250.0 6.2 %Comm Fish Special Projects
43,179.6 48,277.0 48,333.9 48,333.9 49,452.8 50,742.8 7,563.2 17.5 % 2,408.9 5.0 % 1,290.0 2.6 %Appropriation Total
Sport Fisheries
4,745.2 5,939.0 5,960.2 5,881.2 6,034.2 6,534.2 1,789.0 37.7 % 653.0 11.1 % 500.0 8.3 %Sport Fisheries
0.0 46.0 46.0 125.0 128.2 128.2 128.2 >999 % 3.2 2.6 % 0.0 Sport Fish Hatcheries
4,745.2 5,985.0 6,006.2 6,006.2 6,162.4 6,662.4 1,917.2 40.4 % 656.2 10.9 % 500.0 8.1 %Appropriation Total
Wildlife Conservation
5,607.5 6,729.2 6,744.3 6,809.3 6,944.0 7,094.0 1,486.5 26.5 % 284.7 4.2 % 150.0 2.2 %Wildlife Conservation
895.7 998.5 998.5 933.5 944.7 944.7 49.0 5.5 % 11.2 1.2 % 0.0 WC Special Projects
284.5 295.8 295.8 295.8 303.9 303.9 19.4 6.8 % 8.1 2.7 % 0.0 Hunter Ed Pub Shooting Ranges
6,787.7 8,023.5 8,038.6 8,038.6 8,192.6 8,342.6 1,554.9 22.9 % 304.0 3.8 % 150.0 1.8 %Appropriation Total
Administration and Support
793.9 841.0 841.0 841.0 864.3 864.3 70.4 8.9 % 23.3 2.8 % 0.0 Commissioner's Office
2,954.1 3,029.0 3,111.6 3,111.6 3,216.7 3,216.7 262.6 8.9 % 105.1 3.4 % 0.0 Administrative Services
1,287.0 1,400.9 1,400.9 1,400.9 1,444.1 1,635.6 348.6 27.1 % 234.7 16.8 % 191.5 13.3 %Boards and Advisory Committee
2,530.9 2,519.4 2,519.4 2,519.4 2,586.7 2,903.8 372.9 14.7 % 384.4 15.3 % 317.1 12.3 %State Subsistence
2,530.0 2,530.0 2,530.0 2,530.0 2,530.0 2,530.0 0.0 0.0 0.0 F&G State Facilities Rent
10,095.9 10,320.3 10,402.9 10,402.9 10,641.8 11,150.4 1,054.5 10.4 % 747.5 7.2 % 508.6 4.8 %Appropriation Total
Habitat
3,562.0 3,752.2 3,752.2 3,752.2 3,850.8 4,204.3 642.3 18.0 % 452.1 12.0 % 353.5 9.2 %Habitat
3,562.0 3,752.2 3,752.2 3,752.2 3,850.8 4,204.3 642.3 18.0 % 452.1 12.0 % 353.5 9.2 %Appropriation Total
Subcommittee Book Legislative Finance Division 7

2012 Legislature - Operating BudgetAllocation Summary - Governor Structure
Numbers and LanguageFund Groups: General Funds
Agency: Department of Fish and Game
[1] [2] [3] [4] [5] [6] [6] - [1] [6] - [4] [6] - [5] 11Actual 12 CC 12 Auth 12MgtPln Adj Base Gov 11Actual to Gov 12MgtPln to Gov Adj Base to Gov _____________ _____________ _____________ _____________ _____________ _____________ _______________________ _______________________ _______________________Allocation___________________________________
Commercial Fisheries Entry Com
3,473.3 4,084.1 4,084.1 4,084.1 4,176.9 4,176.9 703.6 20.3 % 92.8 2.3 % 0.0 Commercial Fish Entry Com
3,473.3 4,084.1 4,084.1 4,084.1 4,176.9 4,176.9 703.6 20.3 % 92.8 2.3 % 0.0 Appropriation Total
71,843.7 80,442.1 80,617.9 80,617.9 82,477.3 85,279.4 13,435.7 18.7 % 4,661.5 5.8 % 2,802.1 3.4 %Agency Total
Funding Summary
65,009.1 72,070.9 72,246.7 72,246.7 73,910.6 76,072.7 11,063.6 17.0 % 3,826.0 5.3 % 2,162.1 2.9 %Unrestricted General (UGF)
6,834.6 8,371.2 8,371.2 8,371.2 8,566.7 9,206.7 2,372.1 34.7 % 835.5 10.0 % 640.0 7.5 %Designated General (DGF)
8 Legislative Finance Division Subcommittee Book
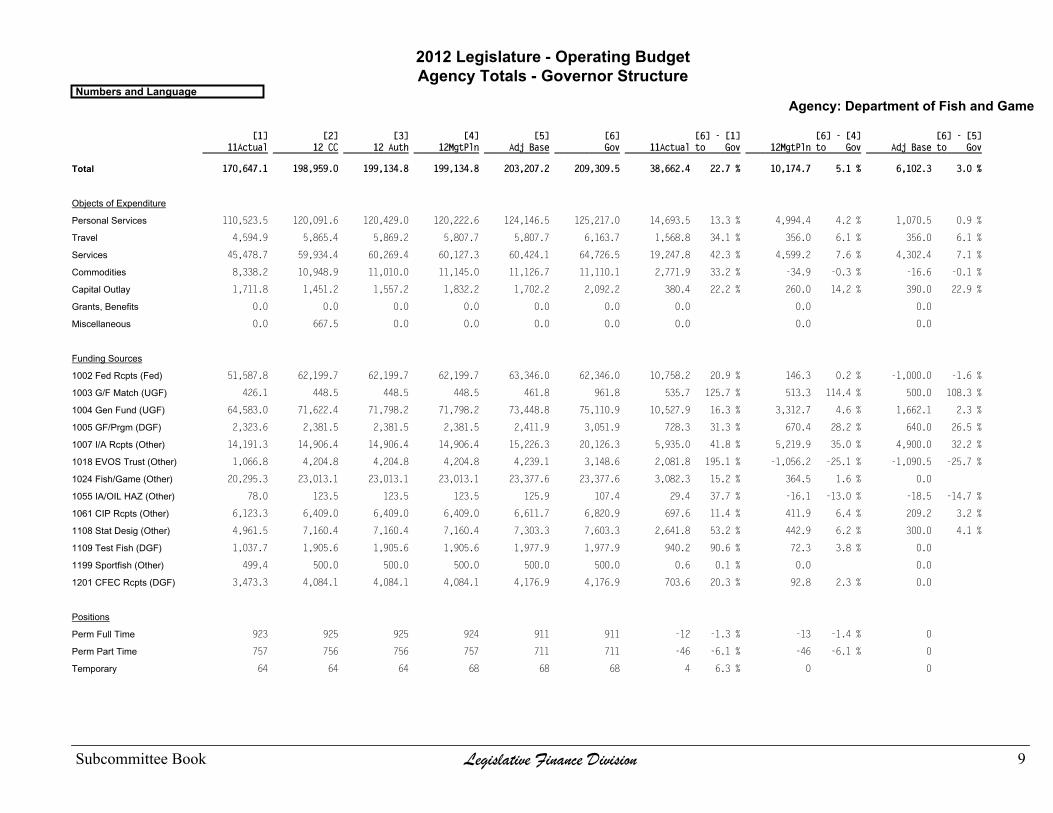
2012 Legislature - Operating BudgetAgency Totals - Governor Structure
Numbers and LanguageAgency: Department of Fish and Game
[1] [2] [3] [4] [5] [6] [6] - [1] [6] - [4] [6] - [5] 11Actual 12 CC 12 Auth 12MgtPln Adj Base Gov 11Actual to Gov 12MgtPln to Gov Adj Base to Gov _____________ _____________ _____________ _____________ _____________ _____________ _______________________ _______________________ _______________________
Total 170,647.1 198,959.0 199,134.8 199,134.8 203,207.2 209,309.5 38,662.4 22.7 % 10,174.7 5.1 % 6,102.3 3.0 %
Objects of Expenditure
Personal Services 110,523.5 120,091.6 120,429.0 120,222.6 124,146.5 125,217.0 14,693.5 13.3 % 4,994.4 4.2 % 1,070.5 0.9 %
Travel 4,594.9 5,865.4 5,869.2 5,807.7 5,807.7 6,163.7 1,568.8 34.1 % 356.0 6.1 % 356.0 6.1 %
Services 45,478.7 59,934.4 60,269.4 60,127.3 60,424.1 64,726.5 19,247.8 42.3 % 4,599.2 7.6 % 4,302.4 7.1 %
Commodities 8,338.2 10,948.9 11,010.0 11,145.0 11,126.7 11,110.1 2,771.9 33.2 % -34.9 -0.3 % -16.6 -0.1 %
Capital Outlay 1,711.8 1,451.2 1,557.2 1,832.2 1,702.2 2,092.2 380.4 22.2 % 260.0 14.2 % 390.0 22.9 %
Grants, Benefits 0.0 0.0 0.0 0.0 0.0 0.0 0.0 0.0 0.0
Miscellaneous 0.0 667.5 0.0 0.0 0.0 0.0 0.0 0.0 0.0
Funding Sources
1002 Fed Rcpts (Fed) 51,587.8 62,199.7 62,199.7 62,199.7 63,346.0 62,346.0 10,758.2 20.9 % 146.3 0.2 % -1,000.0 -1.6 %
1003 G/F Match (UGF) 426.1 448.5 448.5 448.5 461.8 961.8 535.7 125.7 % 513.3 114.4 % 500.0 108.3 %
1004 Gen Fund (UGF) 64,583.0 71,622.4 71,798.2 71,798.2 73,448.8 75,110.9 10,527.9 16.3 % 3,312.7 4.6 % 1,662.1 2.3 %
1005 GF/Prgm (DGF) 2,323.6 2,381.5 2,381.5 2,381.5 2,411.9 3,051.9 728.3 31.3 % 670.4 28.2 % 640.0 26.5 %
1007 I/A Rcpts (Other) 14,191.3 14,906.4 14,906.4 14,906.4 15,226.3 20,126.3 5,935.0 41.8 % 5,219.9 35.0 % 4,900.0 32.2 %
1018 EVOS Trust (Other) 1,066.8 4,204.8 4,204.8 4,204.8 4,239.1 3,148.6 2,081.8 195.1 % -1,056.2 -25.1 % -1,090.5 -25.7 %
1024 Fish/Game (Other) 20,295.3 23,013.1 23,013.1 23,013.1 23,377.6 23,377.6 3,082.3 15.2 % 364.5 1.6 % 0.0
1055 IA/OIL HAZ (Other) 78.0 123.5 123.5 123.5 125.9 107.4 29.4 37.7 % -16.1 -13.0 % -18.5 -14.7 %
1061 CIP Rcpts (Other) 6,123.3 6,409.0 6,409.0 6,409.0 6,611.7 6,820.9 697.6 11.4 % 411.9 6.4 % 209.2 3.2 %
1108 Stat Desig (Other) 4,961.5 7,160.4 7,160.4 7,160.4 7,303.3 7,603.3 2,641.8 53.2 % 442.9 6.2 % 300.0 4.1 %
1109 Test Fish (DGF) 1,037.7 1,905.6 1,905.6 1,905.6 1,977.9 1,977.9 940.2 90.6 % 72.3 3.8 % 0.0
1199 Sportfish (Other) 499.4 500.0 500.0 500.0 500.0 500.0 0.6 0.1 % 0.0 0.0
1201 CFEC Rcpts (DGF) 3,473.3 4,084.1 4,084.1 4,084.1 4,176.9 4,176.9 703.6 20.3 % 92.8 2.3 % 0.0
Positions
Perm Full Time 923 925 925 924 911 911 -12 -1.3 % -13 -1.4 % 0
Perm Part Time 757 756 756 757 711 711 -46 -6.1 % -46 -6.1 % 0
Temporary 64 64 64 68 68 68 4 6.3 % 0 0
Subcommittee Book Legislative Finance Division 9

2012 Legislature - Operating BudgetAgency Totals - Governor Structure
Numbers and LanguageAgency: Department of Fish and Game
[1] [2] [3] [4] [5] [6] [6] - [1] [6] - [4] [6] - [5] 11Actual 12 CC 12 Auth 12MgtPln Adj Base Gov 11Actual to Gov 12MgtPln to Gov Adj Base to Gov _____________ _____________ _____________ _____________ _____________ _____________ _______________________ _______________________ _______________________
Funding Summary
Unrestricted General (UGF) 65,009.1 72,070.9 72,246.7 72,246.7 73,910.6 76,072.7 11,063.6 17.0 % 3,826.0 5.3 % 2,162.1 2.9 %
Designated General (DGF) 6,834.6 8,371.2 8,371.2 8,371.2 8,566.7 9,206.7 2,372.1 34.7 % 835.5 10.0 % 640.0 7.5 %
Other State Funds (Other) 47,215.6 56,317.2 56,317.2 56,317.2 57,383.9 61,684.1 14,468.5 30.6 % 5,366.9 9.5 % 4,300.2 7.5 %
Federal Receipts (Fed) 51,587.8 62,199.7 62,199.7 62,199.7 63,346.0 62,346.0 10,758.2 20.9 % 146.3 0.2 % -1,000.0 -1.6 %
10 Legislative Finance Division Subcommittee Book

This Page Intentionally Left Blank
Subcommittee Book Legislative Finance Division 11

2012 Legislature - Operating BudgetAllocation Totals - Governor Structure
Numbers and LanguageAgency: Department of Fish and Game
Appropriation: Commercial FisheriesAllocation: Southeast Region Fisheries Management
[1] [2] [3] [4] [5] [6] [6] - [1] [6] - [4] [6] - [5] 11Actual 12 CC 12 Auth 12MgtPln Adj Base Gov 11Actual to Gov 12MgtPln to Gov Adj Base to Gov _____________ _____________ _____________ _____________ _____________ _____________ _______________________ _______________________ _______________________
Total 7,659.6 8,529.2 8,547.2 8,442.2 8,676.2 8,936.2 1,276.6 16.7 % 494.0 5.9 % 260.0 3.0 %
Objects of Expenditure
Personal Services 5,628.7 6,158.4 6,158.4 6,245.4 6,497.4 6,597.4 968.7 17.2 % 352.0 5.6 % 100.0 1.5 %
Travel 182.3 173.0 173.0 166.5 166.5 186.5 4.2 2.3 % 20.0 12.0 % 20.0 12.0 %
Services 1,090.5 1,537.1 1,555.1 1,389.6 1,371.6 1,511.6 421.1 38.6 % 122.0 8.8 % 140.0 10.2 %
Commodities 636.4 620.7 620.7 600.7 600.7 600.7 -35.7 -5.6 % 0.0 0.0
Capital Outlay 121.7 40.0 40.0 40.0 40.0 40.0 -81.7 -67.1 % 0.0 0.0
Grants, Benefits 0.0 0.0 0.0 0.0 0.0 0.0 0.0 0.0 0.0
Miscellaneous 0.0 0.0 0.0 0.0 0.0 0.0 0.0 0.0 0.0
Funding Sources
1002 Fed Rcpts (Fed) 151.9 169.6 169.6 89.6 92.0 92.0 -59.9 -39.4 % 2.4 2.7 % 0.0
1003 G/F Match (UGF) 187.8 197.2 197.2 197.2 204.5 204.5 16.7 8.9 % 7.3 3.7 % 0.0
1004 Gen Fund (UGF) 7,036.6 7,586.5 7,604.5 7,709.5 7,929.6 8,189.6 1,153.0 16.4 % 480.1 6.2 % 260.0 3.3 %
1109 Test Fish (DGF) 283.3 575.9 575.9 445.9 450.1 450.1 166.8 58.9 % 4.2 0.9 % 0.0
Positions
Perm Full Time 52 52 52 52 52 52 0 0 0
Perm Part Time 50 50 50 50 49 49 -1 -2.0 % -1 -2.0 % 0
Temporary 0 0 0 0 0 0 0 0 0
12 Legislative Finance Division Subcommittee Book

2012 Legislature - Operating BudgetTransaction Change Detail - Governor Structure
Numbers and LanguageAgency: Department of Fish and Game
Appropriation: Commercial FisheriesAllocation: Southeast Region Fisheries Management
Trans Total Personal Capital Type Expenditure Services Travel Services Commodities Outlay Grants Misc PFT PPT TMP ________ ____________ ____________ ____________ ____________ ____________ ____________ ____________ ____________ _____ _____ _____Transaction Title_______________________________________________
* * * FY12 Conference Committee * * * ConfCom 8,529.2 6,158.4 173.0 1,537.1 620.7 40.0 0.0 0.0 52 50 0FY12 Conference Committee
1002 Fed Rcpts (Fed) 169.61003 G/F Match (UGF) 197.21004 Gen Fund (UGF) 7,586.51109 Test Fish (DGF) 575.9 _________________________________________________________________________________________________________________________
FY12 Conference Committee Total 8,529.2 6,158.4 173.0 1,537.1 620.7 40.0 0.0 0.0 52 50 0
* * * Changes from FY12 Conference Committee to FY12 Authorized * * * ATrIn 18.0 0.0 0.0 18.0 0.0 0.0 0.0 0.0 0 0 0L August FY2012 Fuel/Utility Cost Increase Funding Distribution from the
Office of the Governor1004 Gen Fund (UGF) 18.0 _________________________________________________________________________________________________________________________
FY12 Authorized Total 8,547.2 6,158.4 173.0 1,555.1 620.7 40.0 0.0 0.0 52 50 0
* * * Changes from FY12 Authorized to FY12 Management Plan * * * TrIn 105.0 87.0 3.5 14.5 0.0 0.0 0.0 0.0 0 0 0ADN 11-2-0107 Transfer general fund authority from Commercial
Fisheries Special Projects for two survey projects1004 Gen Fund (UGF) 105.0
TrOut -80.0 0.0 -10.0 -50.0 -20.0 0.0 0.0 0.0 0 0 0ADN 11-2-0105 Transfer excess federal authority to CommercialFisheries Special Projects
1002 Fed Rcpts (Fed) -80.0 TrOut -75.0 0.0 0.0 -75.0 0.0 0.0 0.0 0.0 0 0 0ADN 11-2-0110 Transfer test fish authority to Central Region Fish
Management to address program needs1109 Test Fish (DGF) -75.0
TrOut -55.0 0.0 0.0 -55.0 0.0 0.0 0.0 0.0 0 0 0ADN 11-2-0111 Transfer test fish authority to Westward Region FishManagement to address program needs
1109 Test Fish (DGF) -55.0 _________________________________________________________________________________________________________________________FY12 Management Plan Total 8,442.2 6,245.4 166.5 1,389.6 600.7 40.0 0.0 0.0 52 50 0
* * * Changes from FY12 Management Plan to FY13 Adjusted Base * * * PosAdj 0.0 0.0 0.0 0.0 0.0 0.0 0.0 0.0 0 -1 0Delete Vacant PPT PCN 11-1790 OTI -18.0 0.0 0.0 -18.0 0.0 0.0 0.0 0.0 0 0 0L Reverse August FY2012 Fuel/Utility Cost Increase Funding Distribution
from the Office of the Governor1004 Gen Fund (UGF) -18.0
SalAdj 191.3 191.3 0.0 0.0 0.0 0.0 0.0 0.0 0 0 0FY2013 Salary Increases1002 Fed Rcpts (Fed) 1.71003 G/F Match (UGF) 5.01004 Gen Fund (UGF) 182.01109 Test Fish (DGF) 2.6
SalAdj 60.7 60.7 0.0 0.0 0.0 0.0 0.0 0.0 0 0 0FY2013 Health Insurance Increases1002 Fed Rcpts (Fed) 0.71003 G/F Match (UGF) 2.31004 Gen Fund (UGF) 56.11109 Test Fish (DGF) 1.6 _________________________________________________________________________________________________________________________
FY13 Adjusted Base Total 8,676.2 6,497.4 166.5 1,371.6 600.7 40.0 0.0 0.0 52 49 0
* * * Changes from FY13 Adjusted Base to FY13 Governor Request * * * Inc 260.0 100.0 20.0 140.0 0.0 0.0 0.0 0.0 0 0 0Southeast Alaska Demersal Shelf Rockfish Surveys
Subcommittee Book Legislative Finance Division 13
2012 Legislature - Operating BudgetTransaction Change Detail - Governor Structure
Numbers and LanguageAgency: Department of Fish and Game
Appropriation: Commercial FisheriesAllocation: Southeast Region Fisheries Management
Trans Total Personal Capital Type Expenditure Services Travel Services Commodities Outlay Grants Misc PFT PPT TMP ________ ____________ ____________ ____________ ____________ ____________ ____________ ____________ ____________ _____ _____ _____Transaction Title_______________________________________________
* * * Changes from FY13 Adjusted Base to FY13 Governor Request * * * (continued)Southeast Alaska Demersal Shelf Rockfish Surveys(continued)
1004 Gen Fund (UGF) 260.0 _________________________________________________________________________________________________________________________FY13 Governor Request Total 8,936.2 6,597.4 186.5 1,511.6 600.7 40.0 0.0 0.0 52 49 0
14 Legislative Finance Division Subcommittee Book

This Page Intentionally Left Blank
Subcommittee Book Legislative Finance Division 15

2012 Legislature - Operating BudgetAllocation Totals - Governor Structure
Numbers and LanguageAgency: Department of Fish and Game
Appropriation: Commercial FisheriesAllocation: Central Region Fisheries Management
[1] [2] [3] [4] [5] [6] [6] - [1] [6] - [4] [6] - [5] 11Actual 12 CC 12 Auth 12MgtPln Adj Base Gov 11Actual to Gov 12MgtPln to Gov Adj Base to Gov _____________ _____________ _____________ _____________ _____________ _____________ _______________________ _______________________ _______________________
Total 8,436.0 8,700.3 8,708.9 8,878.9 9,126.5 9,126.5 690.5 8.2 % 247.6 2.8 % 0.0
Objects of Expenditure
Personal Services 6,778.1 7,096.7 7,096.7 7,096.7 7,352.9 7,352.9 574.8 8.5 % 256.2 3.6 % 0.0
Travel 151.8 100.9 100.9 125.9 125.9 125.9 -25.9 -17.1 % 0.0 0.0
Services 1,091.3 1,179.6 1,188.2 1,273.2 1,264.6 1,264.6 173.3 15.9 % -8.6 -0.7 % 0.0
Commodities 407.1 314.9 314.9 364.9 364.9 364.9 -42.2 -10.4 % 0.0 0.0
Capital Outlay 7.7 8.2 8.2 18.2 18.2 18.2 10.5 136.4 % 0.0 0.0
Grants, Benefits 0.0 0.0 0.0 0.0 0.0 0.0 0.0 0.0 0.0
Miscellaneous 0.0 0.0 0.0 0.0 0.0 0.0 0.0 0.0 0.0
Funding Sources
1003 G/F Match (UGF) 238.3 251.3 251.3 251.3 257.3 257.3 19.0 8.0 % 6.0 2.4 % 0.0
1004 Gen Fund (UGF) 7,873.1 8,345.1 8,353.7 8,448.7 8,686.4 8,686.4 813.3 10.3 % 237.7 2.8 % 0.0
1109 Test Fish (DGF) 324.6 103.9 103.9 178.9 182.8 182.8 -141.8 -43.7 % 3.9 2.2 % 0.0
Positions
Perm Full Time 48 48 48 48 48 48 0 0 0
Perm Part Time 99 99 99 101 99 99 0 -2 -2.0 % 0
Temporary 2 2 2 2 2 2 0 0 0
16 Legislative Finance Division Subcommittee Book
2012 Legislature - Operating BudgetTransaction Change Detail - Governor Structure
Numbers and LanguageAgency: Department of Fish and Game
Appropriation: Commercial FisheriesAllocation: Central Region Fisheries Management
Trans Total Personal Capital Type Expenditure Services Travel Services Commodities Outlay Grants Misc PFT PPT TMP ________ ____________ ____________ ____________ ____________ ____________ ____________ ____________ ____________ _____ _____ _____Transaction Title_______________________________________________
* * * FY12 Conference Committee * * * ConfCom 8,700.3 7,096.7 100.9 1,179.6 314.9 8.2 0.0 0.0 48 99 2FY12 Conference Committee
1003 G/F Match (UGF) 251.31004 Gen Fund (UGF) 8,345.11109 Test Fish (DGF) 103.9 _________________________________________________________________________________________________________________________
FY12 Conference Committee Total 8,700.3 7,096.7 100.9 1,179.6 314.9 8.2 0.0 0.0 48 99 2
* * * Changes from FY12 Conference Committee to FY12 Authorized * * * ATrIn 8.6 0.0 0.0 8.6 0.0 0.0 0.0 0.0 0 0 0L August FY2012 Fuel/Utility Cost Increase Funding Distribution from the
Office of the Governor1004 Gen Fund (UGF) 8.6 _________________________________________________________________________________________________________________________
FY12 Authorized Total 8,708.9 7,096.7 100.9 1,188.2 314.9 8.2 0.0 0.0 48 99 2
* * * Changes from FY12 Authorized to FY12 Management Plan * * * TrIn 95.0 0.0 25.0 10.0 50.0 10.0 0.0 0.0 0 0 0ADN 11-2-0106 Transfer general fund authority from Commercial
Fisheries Special Projects for the large mesh trawl survey1004 Gen Fund (UGF) 95.0
TrIn 75.0 0.0 0.0 75.0 0.0 0.0 0.0 0.0 0 0 0ADN 11-2-0110 Transfer test fish authority from Southeast RegionFisheries Management to address program needs
1109 Test Fish (DGF) 75.0 TrIn 0.0 0.0 0.0 0.0 0.0 0.0 0.0 0.0 1 1 0ADN 11-2-0311 Transfer PCNs 11-1279 and 11-1975 from AYK
Region Fisheries Management due to staffing changes PosAdj 0.0 0.0 0.0 0.0 0.0 0.0 0.0 0.0 -1 1 0ADN 11-2-0112 Time Status Change of PCN 11-1278 from PFT to PPT
due to reassignment _________________________________________________________________________________________________________________________FY12 Management Plan Total 8,878.9 7,096.7 125.9 1,273.2 364.9 18.2 0.0 0.0 48 101 2
* * * Changes from FY12 Management Plan to FY13 Adjusted Base * * * PosAdj 0.0 0.0 0.0 0.0 0.0 0.0 0.0 0.0 0 -2 0Delete Vacant PPT PCNs 11-1406 and 11-1929 OTI -8.6 0.0 0.0 -8.6 0.0 0.0 0.0 0.0 0 0 0L Reverse August FY2012 Fuel/Utility Cost Increase Funding Distribution
from the Office of the Governor1004 Gen Fund (UGF) -8.6
SalAdj 185.5 185.5 0.0 0.0 0.0 0.0 0.0 0.0 0 0 0FY2013 Salary Increases1003 G/F Match (UGF) 3.91004 Gen Fund (UGF) 178.51109 Test Fish (DGF) 3.1
SalAdj 70.7 70.7 0.0 0.0 0.0 0.0 0.0 0.0 0 0 0FY2013 Health Insurance Increases1003 G/F Match (UGF) 2.11004 Gen Fund (UGF) 67.81109 Test Fish (DGF) 0.8 _________________________________________________________________________________________________________________________
FY13 Adjusted Base Total 9,126.5 7,352.9 125.9 1,264.6 364.9 18.2 0.0 0.0 48 99 2
* * * Changes from FY13 Adjusted Base to FY13 Governor Request * * * _________________________________________________________________________________________________________________________FY13 Governor Request Total 9,126.5 7,352.9 125.9 1,264.6 364.9 18.2 0.0 0.0 48 99 2
Subcommittee Book Legislative Finance Division 17

2012 Legislature - Operating BudgetAllocation Totals - Governor Structure
Numbers and LanguageAgency: Department of Fish and Game
Appropriation: Commercial FisheriesAllocation: AYK Region Fisheries Management
[1] [2] [3] [4] [5] [6] [6] - [1] [6] - [4] [6] - [5] 11Actual 12 CC 12 Auth 12MgtPln Adj Base Gov 11Actual to Gov 12MgtPln to Gov Adj Base to Gov _____________ _____________ _____________ _____________ _____________ _____________ _______________________ _______________________ _______________________
Total 6,368.3 7,281.8 7,295.4 7,295.4 7,311.1 7,901.1 1,532.8 24.1 % 605.7 8.3 % 590.0 8.1 %
Objects of Expenditure
Personal Services 4,805.7 5,507.4 5,507.4 5,357.4 5,536.7 5,636.7 831.0 17.3 % 279.3 5.2 % 100.0 1.8 %
Travel 239.9 240.0 240.0 280.0 280.0 280.0 40.1 16.7 % 0.0 0.0
Services 748.4 924.3 937.9 977.9 954.3 1,054.3 305.9 40.9 % 76.4 7.8 % 100.0 10.5 %
Commodities 413.1 447.8 447.8 517.8 507.8 507.8 94.7 22.9 % -10.0 -1.9 % 0.0
Capital Outlay 161.2 162.3 162.3 162.3 32.3 422.3 261.1 162.0 % 260.0 160.2 % 390.0 >999 %
Grants, Benefits 0.0 0.0 0.0 0.0 0.0 0.0 0.0 0.0 0.0
Miscellaneous 0.0 0.0 0.0 0.0 0.0 0.0 0.0 0.0 0.0
Funding Sources
1004 Gen Fund (UGF) 6,368.3 7,240.8 7,254.4 7,254.4 7,269.5 7,469.5 1,101.2 17.3 % 215.1 3.0 % 200.0 2.8 %
1005 GF/Prgm (DGF) 0.0 0.0 0.0 0.0 0.0 390.0 390.0 >999 % 390.0 >999 % 390.0 >999 %
1109 Test Fish (DGF) 0.0 41.0 41.0 41.0 41.6 41.6 41.6 >999 % 0.6 1.5 % 0.0
Positions
Perm Full Time 37 37 37 36 35 35 -2 -5.4 % -1 -2.8 % 0
Perm Part Time 62 63 63 62 63 63 1 1.6 % 1 1.6 % 0
Temporary 0 0 0 0 0 0 0 0 0
18 Legislative Finance Division Subcommittee Book

2012 Legislature - Operating BudgetTransaction Change Detail - Governor Structure
Numbers and LanguageAgency: Department of Fish and Game
Appropriation: Commercial FisheriesAllocation: AYK Region Fisheries Management
Trans Total Personal Capital Type Expenditure Services Travel Services Commodities Outlay Grants Misc PFT PPT TMP ________ ____________ ____________ ____________ ____________ ____________ ____________ ____________ ____________ _____ _____ _____Transaction Title_______________________________________________
* * * FY12 Conference Committee * * * ConfCom 7,281.8 5,507.4 240.0 924.3 447.8 162.3 0.0 0.0 37 63 0FY12 Conference Committee
1004 Gen Fund (UGF) 7,240.81109 Test Fish (DGF) 41.0 _________________________________________________________________________________________________________________________
FY12 Conference Committee Total 7,281.8 5,507.4 240.0 924.3 447.8 162.3 0.0 0.0 37 63 0
* * * Changes from FY12 Conference Committee to FY12 Authorized * * * ATrIn 13.6 0.0 0.0 13.6 0.0 0.0 0.0 0.0 0 0 0L August FY2012 Fuel/Utility Cost Increase Funding Distribution from the
Office of the Governor1004 Gen Fund (UGF) 13.6 _________________________________________________________________________________________________________________________
FY12 Authorized Total 7,295.4 5,507.4 240.0 937.9 447.8 162.3 0.0 0.0 37 63 0
* * * Changes from FY12 Authorized to FY12 Management Plan * * * TrOut 0.0 0.0 0.0 0.0 0.0 0.0 0.0 0.0 -1 -1 0ADN 11-2-0311 Transfer PCNs 11-1279 and 11-1975 to Central
Region Fisheries Management due to staffing changes LIT 0.0 -150.0 40.0 40.0 70.0 0.0 0.0 0.0 0 0 0ADN 11-2-0319 Transfer between line items to bring personal services
within vacancy guidelines _________________________________________________________________________________________________________________________FY12 Management Plan Total 7,295.4 5,357.4 280.0 977.9 517.8 162.3 0.0 0.0 36 62 0
* * * Changes from FY12 Management Plan to FY13 Adjusted Base * * * TrIn 0.0 0.0 0.0 0.0 0.0 0.0 0.0 0.0 0 3 0Transfer PPT PCNs 11-1773, 11-1905 and 11-1948 from Commercial
Fisheries Special Projects for Tanana River Sonar Project PosAdj 0.0 0.0 0.0 0.0 0.0 0.0 0.0 0.0 -1 -2 0Delete Vacant PFT PCN 11-1356 and PPT PCNs 11-1462 and
11-5345 OTI -150.0 0.0 0.0 -10.0 -10.0 -130.0 0.0 0.0 0 0 0Reverse Southeastern Norton Sound Salmon Assessment Equipment
One-Time Funding1004 Gen Fund (UGF) -150.0
OTI -13.6 0.0 0.0 -13.6 0.0 0.0 0.0 0.0 0 0 0L Reverse August FY2012 Fuel/Utility Cost Increase Funding Distributionfrom the Office of the Governor
1004 Gen Fund (UGF) -13.6 SalAdj 127.5 127.5 0.0 0.0 0.0 0.0 0.0 0.0 0 0 0FY2013 Salary Increases
1004 Gen Fund (UGF) 127.01109 Test Fish (DGF) 0.5
SalAdj 51.8 51.8 0.0 0.0 0.0 0.0 0.0 0.0 0 0 0FY2013 Health Insurance Increases1004 Gen Fund (UGF) 51.71109 Test Fish (DGF) 0.1 _________________________________________________________________________________________________________________________
FY13 Adjusted Base Total 7,311.1 5,536.7 280.0 954.3 507.8 32.3 0.0 0.0 35 63 0
* * * Changes from FY13 Adjusted Base to FY13 Governor Request * * * Inc 200.0 100.0 0.0 100.0 0.0 0.0 0.0 0.0 0 0 0Tanana River Sonar Project Operational Costs
1004 Gen Fund (UGF) 200.0 IncOTI 390.0 0.0 0.0 0.0 0.0 390.0 0.0 0.0 0 0 0Tanana River Sonar Project Equipment. Fund source is commercial
crew member license fees.1005 GF/Prgm (DGF) 390.0 _________________________________________________________________________________________________________________________
FY13 Governor Request Total 7,901.1 5,636.7 280.0 1,054.3 507.8 422.3 0.0 0.0 35 63 0
Subcommittee Book Legislative Finance Division 19

2012 Legislature - Operating BudgetAllocation Totals - Governor Structure
Numbers and LanguageAgency: Department of Fish and Game
Appropriation: Commercial FisheriesAllocation: Westward Region Fisheries Management
[1] [2] [3] [4] [5] [6] [6] - [1] [6] - [4] [6] - [5] 11Actual 12 CC 12 Auth 12MgtPln Adj Base Gov 11Actual to Gov 12MgtPln to Gov Adj Base to Gov _____________ _____________ _____________ _____________ _____________ _____________ _______________________ _______________________ _______________________
Total 7,408.4 9,001.9 9,018.6 9,073.6 9,330.5 9,330.5 1,922.1 25.9 % 256.9 2.8 % 0.0
Objects of Expenditure
Personal Services 6,018.5 6,460.1 6,737.8 6,827.8 7,133.9 7,133.9 1,115.4 18.5 % 306.1 4.5 % 0.0
Travel 177.8 328.3 328.3 228.3 228.3 228.3 50.5 28.4 % 0.0 0.0
Services 641.7 1,191.3 1,249.5 1,249.5 1,232.8 1,232.8 591.1 92.1 % -16.7 -1.3 % 0.0
Commodities 565.3 539.7 582.0 632.0 599.5 599.5 34.2 6.0 % -32.5 -5.1 % 0.0
Capital Outlay 5.1 15.0 121.0 136.0 136.0 136.0 130.9 >999 % 0.0 0.0
Grants, Benefits 0.0 0.0 0.0 0.0 0.0 0.0 0.0 0.0 0.0
Miscellaneous 0.0 467.5 0.0 0.0 0.0 0.0 0.0 0.0 0.0
Funding Sources
1004 Gen Fund (UGF) 6,978.6 7,817.1 7,833.8 7,833.8 8,027.1 8,027.1 1,048.5 15.0 % 193.3 2.5 % 0.0
1109 Test Fish (DGF) 429.8 1,184.8 1,184.8 1,239.8 1,303.4 1,303.4 873.6 203.3 % 63.6 5.1 % 0.0
Positions
Perm Full Time 46 45 45 46 46 46 0 0 0
Perm Part Time 68 66 66 65 56 56 -12 -17.6 % -9 -13.8 % 0
Temporary 0 0 0 0 0 0 0 0 0
20 Legislative Finance Division Subcommittee Book
2012 Legislature - Operating BudgetTransaction Change Detail - Governor Structure
Numbers and LanguageAgency: Department of Fish and Game
Appropriation: Commercial FisheriesAllocation: Westward Region Fisheries Management
Trans Total Personal Capital Type Expenditure Services Travel Services Commodities Outlay Grants Misc PFT PPT TMP ________ ____________ ____________ ____________ ____________ ____________ ____________ ____________ ____________ _____ _____ _____Transaction Title_______________________________________________
* * * FY12 Conference Committee * * * ConfCom 9,001.9 6,460.1 328.3 1,191.3 539.7 15.0 0.0 467.5 45 66 0FY12 Conference Committee
1004 Gen Fund (UGF) 7,817.11109 Test Fish (DGF) 1,184.8 _________________________________________________________________________________________________________________________
FY12 Conference Committee Total 9,001.9 6,460.1 328.3 1,191.3 539.7 15.0 0.0 467.5 45 66 0
* * * Changes from FY12 Conference Committee to FY12 Authorized * * * ATrIn 16.7 0.0 0.0 16.7 0.0 0.0 0.0 0.0 0 0 0L August FY2012 Fuel/Utility Cost Increase Funding Distribution from the
Office of the Governor1004 Gen Fund (UGF) 16.7
LIT 0.0 277.7 0.0 41.5 42.3 106.0 0.0 -467.5 0 0 0ADN 11-2-0020 Budget Implementation Revision Sec. 1, Ch. 3, FSSLA2011, P. 15, L. 22 _________________________________________________________________________________________________________________________FY12 Authorized Total 9,018.6 6,737.8 328.3 1,249.5 582.0 121.0 0.0 0.0 45 66 0
* * * Changes from FY12 Authorized to FY12 Management Plan * * * TrIn 55.0 55.0 0.0 0.0 0.0 0.0 0.0 0.0 0 0 0ADN 11-2-0111 Transfer test fish authority from Southeast Region
Fisheries Management to address program needs1109 Test Fish (DGF) 55.0
TrIn 0.0 0.0 0.0 0.0 0.0 0.0 0.0 0.0 1 0 0ADN 11-2-0322 Transfer PCN 11-1432 from Commercial FisheriesSpecial Projects due to change in funding
TrOut 0.0 0.0 0.0 0.0 0.0 0.0 0.0 0.0 0 -1 0ADN 11-2-0321 Transfer PPT PCN 11-1579 to Wildlife Conservation LIT 0.0 35.0 -100.0 0.0 50.0 15.0 0.0 0.0 0 0 0ADN 11-2-0323 Transfer between line items to bring personal services
within vacancy guidelines _________________________________________________________________________________________________________________________FY12 Management Plan Total 9,073.6 6,827.8 228.3 1,249.5 632.0 136.0 0.0 0.0 46 65 0
* * * Changes from FY12 Management Plan to FY13 Adjusted Base * * * PosAdj 0.0 0.0 0.0 0.0 0.0 0.0 0.0 0.0 0 -9 0Delete 9 PPT Vacant Positions OTI -32.5 0.0 0.0 0.0 -32.5 0.0 0.0 0.0 0 0 0Reverse Sockeye Salmon Smolt Enumeration Supplies One-Time
Funding1004 Gen Fund (UGF) -32.5
OTI -16.7 0.0 0.0 -16.7 0.0 0.0 0.0 0.0 0 0 0L Reverse August FY2012 Fuel/Utility Cost Increase Funding Distributionfrom the Office of the Governor
1004 Gen Fund (UGF) -16.7 SalAdj 245.3 245.3 0.0 0.0 0.0 0.0 0.0 0.0 0 0 0FY2013 Salary Increases
1004 Gen Fund (UGF) 186.51109 Test Fish (DGF) 58.8
SalAdj 60.8 60.8 0.0 0.0 0.0 0.0 0.0 0.0 0 0 0FY2013 Health Insurance Increases1004 Gen Fund (UGF) 56.01109 Test Fish (DGF) 4.8 _________________________________________________________________________________________________________________________
FY13 Adjusted Base Total 9,330.5 7,133.9 228.3 1,232.8 599.5 136.0 0.0 0.0 46 56 0
* * * Changes from FY13 Adjusted Base to FY13 Governor Request * * * _________________________________________________________________________________________________________________________FY13 Governor Request Total 9,330.5 7,133.9 228.3 1,232.8 599.5 136.0 0.0 0.0 46 56 0
Subcommittee Book Legislative Finance Division 21
2012 Legislature - Operating BudgetAllocation Totals - Governor Structure
Numbers and LanguageAgency: Department of Fish and Game
Appropriation: Commercial FisheriesAllocation: Headquarters Fisheries Management
[1] [2] [3] [4] [5] [6] [6] - [1] [6] - [4] [6] - [5] 11Actual 12 CC 12 Auth 12MgtPln Adj Base Gov 11Actual to Gov 12MgtPln to Gov Adj Base to Gov _____________ _____________ _____________ _____________ _____________ _____________ _______________________ _______________________ _______________________
Total 10,400.6 10,819.6 10,819.6 10,819.6 11,094.1 11,284.1 883.5 8.5 % 464.5 4.3 % 190.0 1.7 %
Objects of Expenditure
Personal Services 5,986.8 6,207.8 6,207.8 6,316.1 6,590.6 6,690.6 703.8 11.8 % 374.5 5.9 % 100.0 1.5 %
Travel 275.6 329.1 329.1 309.1 309.1 329.1 53.5 19.4 % 20.0 6.5 % 20.0 6.5 %
Services 3,620.2 3,781.3 3,781.3 3,708.0 3,708.0 3,778.0 157.8 4.4 % 70.0 1.9 % 70.0 1.9 %
Commodities 499.4 473.0 473.0 458.0 458.0 458.0 -41.4 -8.3 % 0.0 0.0
Capital Outlay 18.6 28.4 28.4 28.4 28.4 28.4 9.8 52.7 % 0.0 0.0
Grants, Benefits 0.0 0.0 0.0 0.0 0.0 0.0 0.0 0.0 0.0
Miscellaneous 0.0 0.0 0.0 0.0 0.0 0.0 0.0 0.0 0.0
Funding Sources
1004 Gen Fund (UGF) 10,093.4 10,437.4 10,437.4 10,437.4 10,711.9 10,901.9 808.5 8.0 % 464.5 4.5 % 190.0 1.8 %
1005 GF/Prgm (DGF) 307.2 382.2 382.2 382.2 382.2 382.2 75.0 24.4 % 0.0 0.0
Positions
Perm Full Time 57 57 57 58 58 58 1 1.8 % 0 0
Perm Part Time 7 7 7 8 6 6 -1 -14.3 % -2 -25.0 % 0
Temporary 0 0 0 0 0 0 0 0 0
22 Legislative Finance Division Subcommittee Book

2012 Legislature - Operating BudgetTransaction Change Detail - Governor Structure
Numbers and LanguageAgency: Department of Fish and Game
Appropriation: Commercial FisheriesAllocation: Headquarters Fisheries Management
Trans Total Personal Capital Type Expenditure Services Travel Services Commodities Outlay Grants Misc PFT PPT TMP ________ ____________ ____________ ____________ ____________ ____________ ____________ ____________ ____________ _____ _____ _____Transaction Title_______________________________________________
* * * FY12 Conference Committee * * * ConfCom 10,819.6 6,207.8 329.1 3,781.3 473.0 28.4 0.0 0.0 57 7 0FY12 Conference Committee
1004 Gen Fund (UGF) 10,437.41005 GF/Prgm (DGF) 382.2 _________________________________________________________________________________________________________________________
FY12 Conference Committee Total 10,819.6 6,207.8 329.1 3,781.3 473.0 28.4 0.0 0.0 57 7 0
* * * Changes from FY12 Conference Committee to FY12 Authorized * * * _________________________________________________________________________________________________________________________FY12 Authorized Total 10,819.6 6,207.8 329.1 3,781.3 473.0 28.4 0.0 0.0 57 7 0
* * * Changes from FY12 Authorized to FY12 Management Plan * * * TrIn 0.0 0.0 0.0 0.0 0.0 0.0 0.0 0.0 1 1 0ADN 11-2-0157 Transfer PFT PCN 11-7009 and PPT PCN 11-4099
from Sport Fisheries LIT 0.0 108.3 -20.0 -73.3 -15.0 0.0 0.0 0.0 0 0 0ADN 11-2-0320 Transfer between line items to bring personal services
within vacancy guidelines _________________________________________________________________________________________________________________________FY12 Management Plan Total 10,819.6 6,316.1 309.1 3,708.0 458.0 28.4 0.0 0.0 58 8 0
* * * Changes from FY12 Management Plan to FY13 Adjusted Base * * * TrIn 0.0 0.0 0.0 0.0 0.0 0.0 0.0 0.0 1 0 0Transfer PCN 11-1167 from Commercial Fisheries Special Projects for
Pacific Salmon Treaty Chinook Program PosAdj 0.0 0.0 0.0 0.0 0.0 0.0 0.0 0.0 -1 -2 0Delete Vacant PFT PCN 11-1779 and PPT PCNs 11-1313 and
11-1629 SalAdj 218.9 218.9 0.0 0.0 0.0 0.0 0.0 0.0 0 0 0FY2013 Salary Increases
1004 Gen Fund (UGF) 218.9 SalAdj 55.6 55.6 0.0 0.0 0.0 0.0 0.0 0.0 0 0 0FY2013 Health Insurance Increases
1004 Gen Fund (UGF) 55.6 _________________________________________________________________________________________________________________________FY13 Adjusted Base Total 11,094.1 6,590.6 309.1 3,708.0 458.0 28.4 0.0 0.0 58 6 0
* * * Changes from FY13 Adjusted Base to FY13 Governor Request * * * Inc 190.0 100.0 20.0 70.0 0.0 0.0 0.0 0.0 0 0 0Pacific Salmon Treaty Chinook Technical Committee Support
1004 Gen Fund (UGF) 190.0 _________________________________________________________________________________________________________________________FY13 Governor Request Total 11,284.1 6,690.6 329.1 3,778.0 458.0 28.4 0.0 0.0 58 6 0
Subcommittee Book Legislative Finance Division 23
2012 Legislature - Operating BudgetAllocation Totals - Governor Structure
Numbers and LanguageAgency: Department of Fish and Game
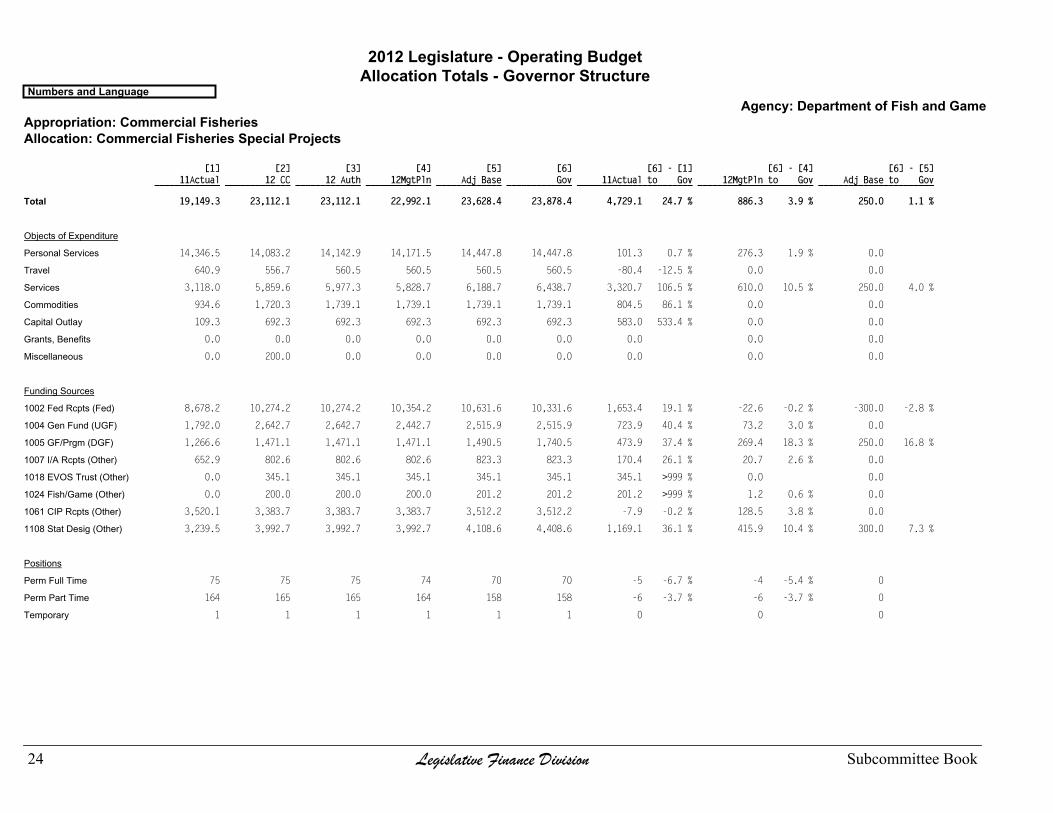
Appropriation: Commercial FisheriesAllocation: Commercial Fisheries Special Projects
[1] [2] [3] [4] [5] [6] [6] - [1] [6] - [4] [6] - [5] 11Actual 12 CC 12 Auth 12MgtPln Adj Base Gov 11Actual to Gov 12MgtPln to Gov Adj Base to Gov _____________ _____________ _____________ _____________ _____________ _____________ _______________________ _______________________ _______________________
Total 19,149.3 23,112.1 23,112.1 22,992.1 23,628.4 23,878.4 4,729.1 24.7 % 886.3 3.9 % 250.0 1.1 %
Objects of Expenditure
Personal Services 14,346.5 14,083.2 14,142.9 14,171.5 14,447.8 14,447.8 101.3 0.7 % 276.3 1.9 % 0.0
Travel 640.9 556.7 560.5 560.5 560.5 560.5 -80.4 -12.5 % 0.0 0.0
Services 3,118.0 5,859.6 5,977.3 5,828.7 6,188.7 6,438.7 3,320.7 106.5 % 610.0 10.5 % 250.0 4.0 %
Commodities 934.6 1,720.3 1,739.1 1,739.1 1,739.1 1,739.1 804.5 86.1 % 0.0 0.0
Capital Outlay 109.3 692.3 692.3 692.3 692.3 692.3 583.0 533.4 % 0.0 0.0
Grants, Benefits 0.0 0.0 0.0 0.0 0.0 0.0 0.0 0.0 0.0
Miscellaneous 0.0 200.0 0.0 0.0 0.0 0.0 0.0 0.0 0.0
Funding Sources
1002 Fed Rcpts (Fed) 8,678.2 10,274.2 10,274.2 10,354.2 10,631.6 10,331.6 1,653.4 19.1 % -22.6 -0.2 % -300.0 -2.8 %
1004 Gen Fund (UGF) 1,792.0 2,642.7 2,642.7 2,442.7 2,515.9 2,515.9 723.9 40.4 % 73.2 3.0 % 0.0
1005 GF/Prgm (DGF) 1,266.6 1,471.1 1,471.1 1,471.1 1,490.5 1,740.5 473.9 37.4 % 269.4 18.3 % 250.0 16.8 %
1007 I/A Rcpts (Other) 652.9 802.6 802.6 802.6 823.3 823.3 170.4 26.1 % 20.7 2.6 % 0.0
1018 EVOS Trust (Other) 0.0 345.1 345.1 345.1 345.1 345.1 345.1 >999 % 0.0 0.0
1024 Fish/Game (Other) 0.0 200.0 200.0 200.0 201.2 201.2 201.2 >999 % 1.2 0.6 % 0.0
1061 CIP Rcpts (Other) 3,520.1 3,383.7 3,383.7 3,383.7 3,512.2 3,512.2 -7.9 -0.2 % 128.5 3.8 % 0.0
1108 Stat Desig (Other) 3,239.5 3,992.7 3,992.7 3,992.7 4,108.6 4,408.6 1,169.1 36.1 % 415.9 10.4 % 300.0 7.3 %
Positions
Perm Full Time 75 75 75 74 70 70 -5 -6.7 % -4 -5.4 % 0
Perm Part Time 164 165 165 164 158 158 -6 -3.7 % -6 -3.7 % 0
Temporary 1 1 1 1 1 1 0 0 0
24 Legislative Finance Division Subcommittee Book
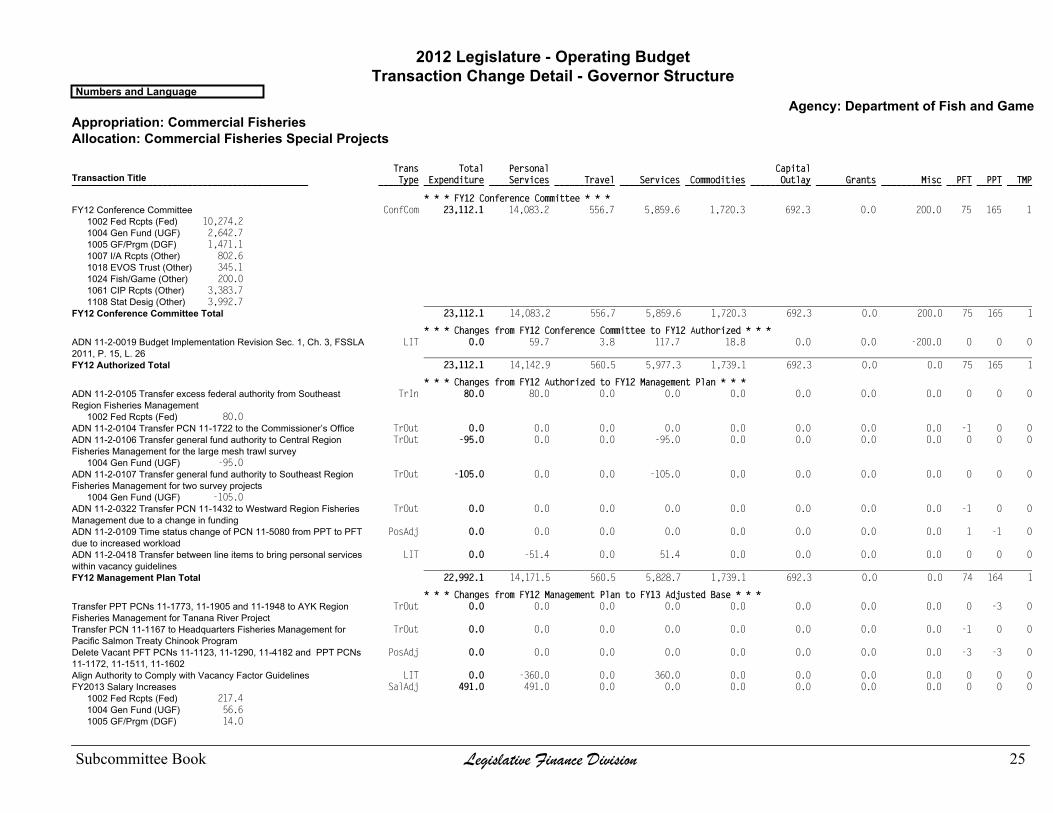
2012 Legislature - Operating BudgetTransaction Change Detail - Governor Structure
Numbers and LanguageAgency: Department of Fish and Game
Appropriation: Commercial FisheriesAllocation: Commercial Fisheries Special Projects
Trans Total Personal Capital Type Expenditure Services Travel Services Commodities Outlay Grants Misc PFT PPT TMP ________ ____________ ____________ ____________ ____________ ____________ ____________ ____________ ____________ _____ _____ _____Transaction Title_______________________________________________
* * * FY12 Conference Committee * * * ConfCom 23,112.1 14,083.2 556.7 5,859.6 1,720.3 692.3 0.0 200.0 75 165 1FY12 Conference Committee
1002 Fed Rcpts (Fed) 10,274.21004 Gen Fund (UGF) 2,642.71005 GF/Prgm (DGF) 1,471.11007 I/A Rcpts (Other) 802.61018 EVOS Trust (Other) 345.11024 Fish/Game (Other) 200.01061 CIP Rcpts (Other) 3,383.71108 Stat Desig (Other) 3,992.7 _________________________________________________________________________________________________________________________
FY12 Conference Committee Total 23,112.1 14,083.2 556.7 5,859.6 1,720.3 692.3 0.0 200.0 75 165 1
* * * Changes from FY12 Conference Committee to FY12 Authorized * * * LIT 0.0 59.7 3.8 117.7 18.8 0.0 0.0 -200.0 0 0 0ADN 11-2-0019 Budget Implementation Revision Sec. 1, Ch. 3, FSSLA
2011, P. 15, L. 26 _________________________________________________________________________________________________________________________FY12 Authorized Total 23,112.1 14,142.9 560.5 5,977.3 1,739.1 692.3 0.0 0.0 75 165 1
* * * Changes from FY12 Authorized to FY12 Management Plan * * * TrIn 80.0 80.0 0.0 0.0 0.0 0.0 0.0 0.0 0 0 0ADN 11-2-0105 Transfer excess federal authority from Southeast
Region Fisheries Management1002 Fed Rcpts (Fed) 80.0
TrOut 0.0 0.0 0.0 0.0 0.0 0.0 0.0 0.0 -1 0 0ADN 11-2-0104 Transfer PCN 11-1722 to the Commissioner’s Office TrOut -95.0 0.0 0.0 -95.0 0.0 0.0 0.0 0.0 0 0 0ADN 11-2-0106 Transfer general fund authority to Central Region
Fisheries Management for the large mesh trawl survey1004 Gen Fund (UGF) -95.0
TrOut -105.0 0.0 0.0 -105.0 0.0 0.0 0.0 0.0 0 0 0ADN 11-2-0107 Transfer general fund authority to Southeast RegionFisheries Management for two survey projects
1004 Gen Fund (UGF) -105.0 TrOut 0.0 0.0 0.0 0.0 0.0 0.0 0.0 0.0 -1 0 0ADN 11-2-0322 Transfer PCN 11-1432 to Westward Region Fisheries
Management due to a change in funding PosAdj 0.0 0.0 0.0 0.0 0.0 0.0 0.0 0.0 1 -1 0ADN 11-2-0109 Time status change of PCN 11-5080 from PPT to PFT
due to increased workload LIT 0.0 -51.4 0.0 51.4 0.0 0.0 0.0 0.0 0 0 0ADN 11-2-0418 Transfer between line items to bring personal services
within vacancy guidelines _________________________________________________________________________________________________________________________FY12 Management Plan Total 22,992.1 14,171.5 560.5 5,828.7 1,739.1 692.3 0.0 0.0 74 164 1
* * * Changes from FY12 Management Plan to FY13 Adjusted Base * * * TrOut 0.0 0.0 0.0 0.0 0.0 0.0 0.0 0.0 0 -3 0Transfer PPT PCNs 11-1773, 11-1905 and 11-1948 to AYK Region
Fisheries Management for Tanana River Project TrOut 0.0 0.0 0.0 0.0 0.0 0.0 0.0 0.0 -1 0 0Transfer PCN 11-1167 to Headquarters Fisheries Management for
Pacific Salmon Treaty Chinook Program PosAdj 0.0 0.0 0.0 0.0 0.0 0.0 0.0 0.0 -3 -3 0Delete Vacant PFT PCNs 11-1123, 11-1290, 11-4182 and PPT PCNs
11-1172, 11-1511, 11-1602 LIT 0.0 -360.0 0.0 360.0 0.0 0.0 0.0 0.0 0 0 0Align Authority to Comply with Vacancy Factor Guidelines SalAdj 491.0 491.0 0.0 0.0 0.0 0.0 0.0 0.0 0 0 0FY2013 Salary Increases
1002 Fed Rcpts (Fed) 217.41004 Gen Fund (UGF) 56.61005 GF/Prgm (DGF) 14.0
Subcommittee Book Legislative Finance Division 25
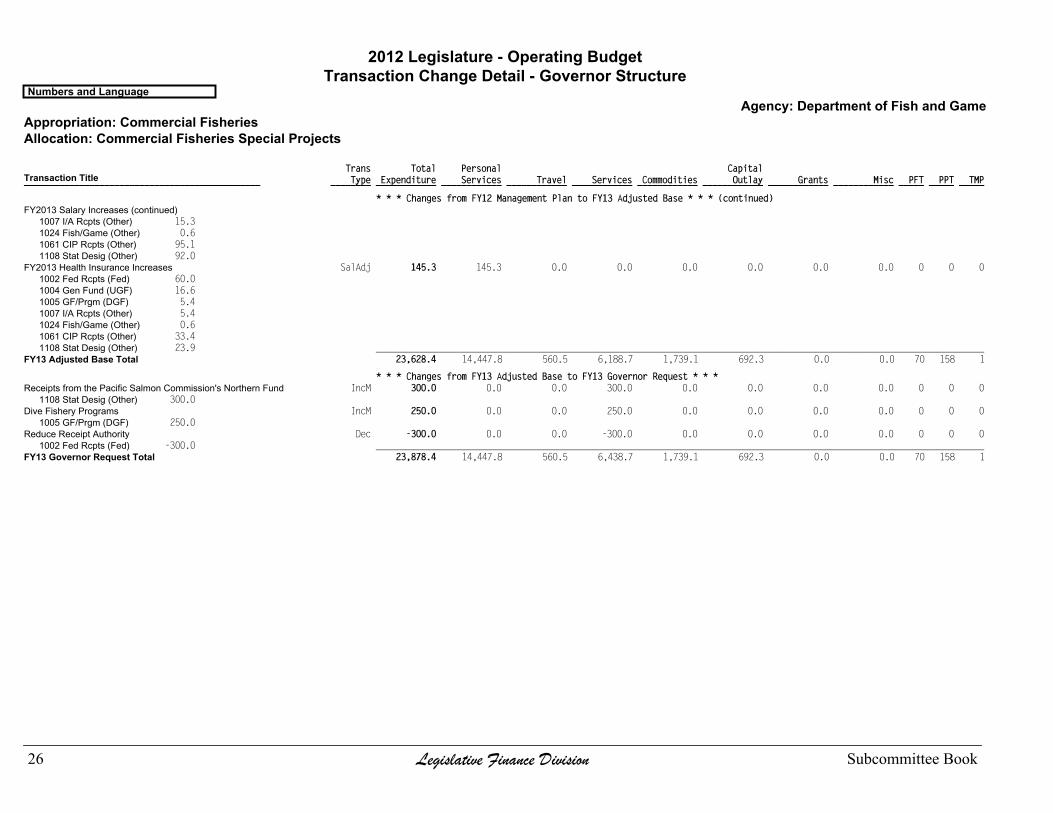
2012 Legislature - Operating BudgetTransaction Change Detail - Governor Structure
Numbers and LanguageAgency: Department of Fish and Game
Appropriation: Commercial FisheriesAllocation: Commercial Fisheries Special Projects
Trans Total Personal Capital Type Expenditure Services Travel Services Commodities Outlay Grants Misc PFT PPT TMP ________ ____________ ____________ ____________ ____________ ____________ ____________ ____________ ____________ _____ _____ _____Transaction Title_______________________________________________
* * * Changes from FY12 Management Plan to FY13 Adjusted Base * * * (continued)FY2013 Salary Increases (continued)
1007 I/A Rcpts (Other) 15.31024 Fish/Game (Other) 0.61061 CIP Rcpts (Other) 95.11108 Stat Desig (Other) 92.0
SalAdj 145.3 145.3 0.0 0.0 0.0 0.0 0.0 0.0 0 0 0FY2013 Health Insurance Increases1002 Fed Rcpts (Fed) 60.01004 Gen Fund (UGF) 16.61005 GF/Prgm (DGF) 5.41007 I/A Rcpts (Other) 5.41024 Fish/Game (Other) 0.61061 CIP Rcpts (Other) 33.41108 Stat Desig (Other) 23.9 _________________________________________________________________________________________________________________________
FY13 Adjusted Base Total 23,628.4 14,447.8 560.5 6,188.7 1,739.1 692.3 0.0 0.0 70 158 1
* * * Changes from FY13 Adjusted Base to FY13 Governor Request * * * IncM 300.0 0.0 0.0 300.0 0.0 0.0 0.0 0.0 0 0 0Receipts from the Pacific Salmon Commission's Northern Fund
1108 Stat Desig (Other) 300.0 IncM 250.0 0.0 0.0 250.0 0.0 0.0 0.0 0.0 0 0 0Dive Fishery Programs
1005 GF/Prgm (DGF) 250.0 Dec -300.0 0.0 0.0 -300.0 0.0 0.0 0.0 0.0 0 0 0Reduce Receipt Authority
1002 Fed Rcpts (Fed) -300.0 _________________________________________________________________________________________________________________________FY13 Governor Request Total 23,878.4 14,447.8 560.5 6,438.7 1,739.1 692.3 0.0 0.0 70 158 1
26 Legislative Finance Division Subcommittee Book

This Page Intentionally Left Blank
Subcommittee Book Legislative Finance Division 27

2012 Legislature - Operating BudgetAllocation Totals - Governor Structure
Numbers and LanguageAgency: Department of Fish and Game
Appropriation: Sport FisheriesAllocation: Sport Fisheries
[1] [2] [3] [4] [5] [6] [6] - [1] [6] - [4] [6] - [5] 11Actual 12 CC 12 Auth 12MgtPln Adj Base Gov 11Actual to Gov 12MgtPln to Gov Adj Base to Gov _____________ _____________ _____________ _____________ _____________ _____________ _______________________ _______________________ _______________________
Total 40,098.0 44,301.9 44,323.1 44,244.1 45,027.1 45,508.6 5,410.6 13.5 % 1,264.5 2.9 % 481.5 1.1 %
Objects of Expenditure
Personal Services 25,985.0 27,363.4 27,363.4 26,284.4 27,088.6 27,088.6 1,103.6 4.2 % 804.2 3.1 % 0.0
Travel 662.2 1,126.7 1,126.7 1,126.7 1,126.7 1,126.7 464.5 70.1 % 0.0 0.0
Services 11,315.7 13,636.6 13,657.8 14,407.8 14,386.6 14,868.1 3,552.4 31.4 % 460.3 3.2 % 481.5 3.3 %
Commodities 1,712.9 1,983.0 1,983.0 1,983.0 1,983.0 1,983.0 270.1 15.8 % 0.0 0.0
Capital Outlay 422.2 192.2 192.2 442.2 442.2 442.2 20.0 4.7 % 0.0 0.0
Grants, Benefits 0.0 0.0 0.0 0.0 0.0 0.0 0.0 0.0 0.0
Miscellaneous 0.0 0.0 0.0 0.0 0.0 0.0 0.0 0.0 0.0
Funding Sources
1002 Fed Rcpts (Fed) 19,266.8 19,268.5 19,268.5 19,268.5 19,613.9 19,613.9 347.1 1.8 % 345.4 1.8 % 0.0
1003 G/F Match (UGF) 0.0 0.0 0.0 0.0 0.0 500.0 500.0 >999 % 500.0 >999 % 500.0 >999 %
1004 Gen Fund (UGF) 4,745.2 5,939.0 5,960.2 5,881.2 6,034.2 6,034.2 1,289.0 27.2 % 153.0 2.6 % 0.0
1007 I/A Rcpts (Other) 1,523.7 1,787.7 1,787.7 1,787.7 1,815.6 1,815.6 291.9 19.2 % 27.9 1.6 % 0.0
1018 EVOS Trust (Other) 4.2 339.4 339.4 339.4 341.7 341.7 337.5 >999 % 2.3 0.7 % 0.0
1024 Fish/Game (Other) 11,523.3 13,137.9 13,137.9 13,137.9 13,324.0 13,324.0 1,800.7 15.6 % 186.1 1.4 % 0.0
1055 IA/OIL HAZ (Other) 0.0 18.5 18.5 18.5 18.5 0.0 0.0 -18.5 -100.0 % -18.5 -100.0 %
1061 CIP Rcpts (Other) 1,901.2 2,030.6 2,030.6 2,030.6 2,083.4 2,083.4 182.2 9.6 % 52.8 2.6 % 0.0
1108 Stat Desig (Other) 634.2 1,280.3 1,280.3 1,280.3 1,295.8 1,295.8 661.6 104.3 % 15.5 1.2 % 0.0
1199 Sportfish (Other) 499.4 500.0 500.0 500.0 500.0 500.0 0.6 0.1 % 0.0 0.0
Positions
Perm Full Time 230 199 199 204 196 196 -34 -14.8 % -8 -3.9 % 0
Perm Part Time 205 200 200 200 180 180 -25 -12.2 % -20 -10.0 % 0
Temporary 19 19 19 18 18 18 -1 -5.3 % 0 0
28 Legislative Finance Division Subcommittee Book

2012 Legislature - Operating BudgetTransaction Change Detail - Governor Structure
Numbers and LanguageAgency: Department of Fish and Game
Appropriation: Sport FisheriesAllocation: Sport Fisheries
Trans Total Personal Capital Type Expenditure Services Travel Services Commodities Outlay Grants Misc PFT PPT TMP ________ ____________ ____________ ____________ ____________ ____________ ____________ ____________ ____________ _____ _____ _____Transaction Title_______________________________________________
* * * FY12 Conference Committee * * * ConfCom 44,301.9 27,363.4 1,126.7 13,636.6 1,983.0 192.2 0.0 0.0 199 200 19FY12 Conference Committee
1002 Fed Rcpts (Fed) 19,268.51004 Gen Fund (UGF) 5,939.01007 I/A Rcpts (Other) 1,787.71018 EVOS Trust (Other) 339.41024 Fish/Game (Other) 13,137.91055 IA/OIL HAZ (Other) 18.51061 CIP Rcpts (Other) 2,030.61108 Stat Desig (Other) 1,280.31199 Sportfish (Other) 500.0 _________________________________________________________________________________________________________________________
FY12 Conference Committee Total 44,301.9 27,363.4 1,126.7 13,636.6 1,983.0 192.2 0.0 0.0 199 200 19
* * * Changes from FY12 Conference Committee to FY12 Authorized * * * ATrIn 21.2 0.0 0.0 21.2 0.0 0.0 0.0 0.0 0 0 0L August FY2012 Fuel/Utility Cost Increase Funding Distribution from the
Office of the Governor1004 Gen Fund (UGF) 21.2 _________________________________________________________________________________________________________________________
FY12 Authorized Total 44,323.1 27,363.4 1,126.7 13,657.8 1,983.0 192.2 0.0 0.0 199 200 19
* * * Changes from FY12 Authorized to FY12 Management Plan * * * TrOut 0.0 0.0 0.0 0.0 0.0 0.0 0.0 0.0 -1 -1 0ADN 11-2-0157 Transfer PFT PCN 11-7009 and PPT PCN 11-4099 to
Commercial Fisheries Headquarters Fisheries Management TrOut -79.0 -79.0 0.0 0.0 0.0 0.0 0.0 0.0 0 0 0ADN 11-2-0278 Transfer personal services increases to Sport Fish
Hatcheries component1004 Gen Fund (UGF) -79.0
TrOut 0.0 0.0 0.0 0.0 0.0 0.0 0.0 0.0 0 -2 0ADN 11-2-0342 Transfer PPT PCNs 11-1938 and 11-4100 to WildlifeConservation Special Projects for wildlife management
TrOut 0.0 0.0 0.0 0.0 0.0 0.0 0.0 0.0 -1 0 0ADN 11-2-0338 Transfer PFT 11-4093 from Sport Fisheries to WildlifeConservation for field research
TrIn 0.0 0.0 0.0 0.0 0.0 0.0 0.0 0.0 10 0 0Transfer 10 PFT PCNs from Sport Fish Hatcheries to Sport Fisheries toplace positions in correct allocation.
PosAdj 0.0 0.0 0.0 0.0 0.0 0.0 0.0 0.0 -1 1 0ADN 11-1-0582 Time status change of PCN 11-1029 Office Assistant IIfrom PFT to PPT
PosAdj 0.0 0.0 0.0 0.0 0.0 0.0 0.0 0.0 -1 1 0ADN 11-1-0617 Time status change of PCN 11-4234 Fishery Biologist Ifrom PFT to PPT
PosAdj 0.0 0.0 0.0 0.0 0.0 0.0 0.0 0.0 -1 1 0ADN 11-2-0367 Time status change of PCN 11-4190 FisheriesBiologist I from PFT to PPT
PosAdj 0.0 0.0 0.0 0.0 0.0 0.0 0.0 0.0 0 0 -1ADN 11-2-0443 Delete College Intern II PCN 11-IN1125 LIT 0.0 -1,000.0 0.0 750.0 0.0 250.0 0.0 0.0 0 0 0ADN 11-2-0405 Transfer between line items to align with anticipated
spending plan _________________________________________________________________________________________________________________________FY12 Management Plan Total 44,244.1 26,284.4 1,126.7 14,407.8 1,983.0 442.2 0.0 0.0 204 200 18
* * * Changes from FY12 Management Plan to FY13 Adjusted Base * * * TrOut 0.0 0.0 0.0 0.0 0.0 0.0 0.0 0.0 0 -2 0Transfer PCN 11-4111 and 11-2219 to Administrative Services for
Facility Maintenance PosAdj 0.0 0.0 0.0 0.0 0.0 0.0 0.0 0.0 -8 -18 0Delete 8 PFT and 18 PPT Vacant Positions OTI -21.2 0.0 0.0 -21.2 0.0 0.0 0.0 0.0 0 0 0L Reverse August FY2012 Fuel/Utility Cost Increase Funding Distribution
from the Office of the Governor
Subcommittee Book Legislative Finance Division 29

2012 Legislature - Operating BudgetTransaction Change Detail - Governor Structure
Numbers and LanguageAgency: Department of Fish and Game
Appropriation: Sport FisheriesAllocation: Sport Fisheries
Trans Total Personal Capital Type Expenditure Services Travel Services Commodities Outlay Grants Misc PFT PPT TMP ________ ____________ ____________ ____________ ____________ ____________ ____________ ____________ ____________ _____ _____ _____Transaction Title_______________________________________________
* * * Changes from FY12 Management Plan to FY13 Adjusted Base * * * (continued)Reverse August FY2012 Fuel/Utility Cost IncreaseFunding Distribution from the Office of the Governor(continued)
1004 Gen Fund (UGF) -21.2 SalAdj 543.4 543.4 0.0 0.0 0.0 0.0 0.0 0.0 0 0 0FY2013 Salary Increases
1002 Fed Rcpts (Fed) 231.41004 Gen Fund (UGF) 120.81007 I/A Rcpts (Other) 17.91018 EVOS Trust (Other) 1.41024 Fish/Game (Other) 127.41061 CIP Rcpts (Other) 34.31108 Stat Desig (Other) 10.2
SalAdj 260.8 260.8 0.0 0.0 0.0 0.0 0.0 0.0 0 0 0FY2013 Health Insurance Increases1002 Fed Rcpts (Fed) 114.01004 Gen Fund (UGF) 53.41007 I/A Rcpts (Other) 10.01018 EVOS Trust (Other) 0.91024 Fish/Game (Other) 58.71061 CIP Rcpts (Other) 18.51108 Stat Desig (Other) 5.3 _________________________________________________________________________________________________________________________
FY13 Adjusted Base Total 45,027.1 27,088.6 1,126.7 14,386.6 1,983.0 442.2 0.0 0.0 196 180 18
* * * Changes from FY13 Adjusted Base to FY13 Governor Request * * * Inc 500.0 0.0 0.0 500.0 0.0 0.0 0.0 0.0 0 0 0Matching Funds for the Dingell-Johnson Federal Aid in Sportfish
Restoration1003 G/F Match (UGF) 500.0
Dec -18.5 0.0 0.0 -18.5 0.0 0.0 0.0 0.0 0 0 0Remove Oil and Hazardous Fund Receipt Authority1055 IA/OIL HAZ (Other) -18.5 _________________________________________________________________________________________________________________________
FY13 Governor Request Total 45,508.6 27,088.6 1,126.7 14,868.1 1,983.0 442.2 0.0 0.0 196 180 18
30 Legislative Finance Division Subcommittee Book

This Page Intentionally Left Blank
Subcommittee Book Legislative Finance Division 31
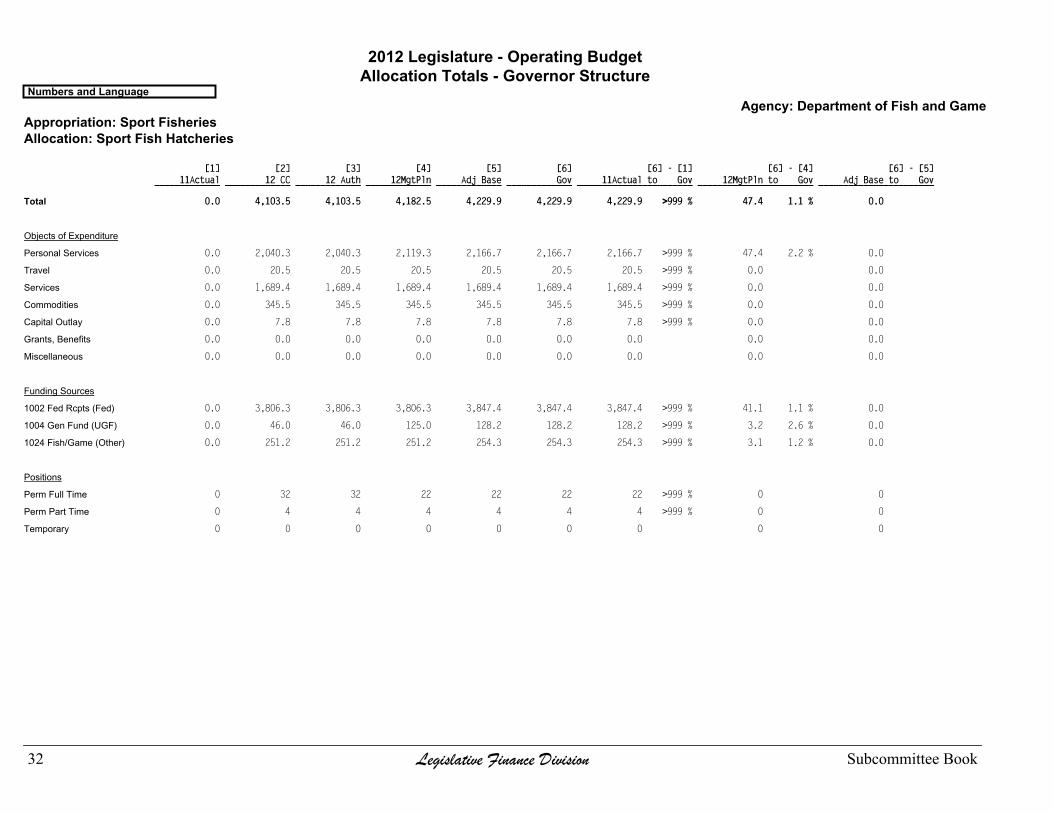
2012 Legislature - Operating BudgetAllocation Totals - Governor Structure
Numbers and LanguageAgency: Department of Fish and Game
Appropriation: Sport FisheriesAllocation: Sport Fish Hatcheries
[1] [2] [3] [4] [5] [6] [6] - [1] [6] - [4] [6] - [5] 11Actual 12 CC 12 Auth 12MgtPln Adj Base Gov 11Actual to Gov 12MgtPln to Gov Adj Base to Gov _____________ _____________ _____________ _____________ _____________ _____________ _______________________ _______________________ _______________________
Total 0.0 4,103.5 4,103.5 4,182.5 4,229.9 4,229.9 4,229.9 >999 % 47.4 1.1 % 0.0
Objects of Expenditure
Personal Services 0.0 2,040.3 2,040.3 2,119.3 2,166.7 2,166.7 2,166.7 >999 % 47.4 2.2 % 0.0
Travel 0.0 20.5 20.5 20.5 20.5 20.5 20.5 >999 % 0.0 0.0
Services 0.0 1,689.4 1,689.4 1,689.4 1,689.4 1,689.4 1,689.4 >999 % 0.0 0.0
Commodities 0.0 345.5 345.5 345.5 345.5 345.5 345.5 >999 % 0.0 0.0
Capital Outlay 0.0 7.8 7.8 7.8 7.8 7.8 7.8 >999 % 0.0 0.0
Grants, Benefits 0.0 0.0 0.0 0.0 0.0 0.0 0.0 0.0 0.0
Miscellaneous 0.0 0.0 0.0 0.0 0.0 0.0 0.0 0.0 0.0
Funding Sources
1002 Fed Rcpts (Fed) 0.0 3,806.3 3,806.3 3,806.3 3,847.4 3,847.4 3,847.4 >999 % 41.1 1.1 % 0.0
1004 Gen Fund (UGF) 0.0 46.0 46.0 125.0 128.2 128.2 128.2 >999 % 3.2 2.6 % 0.0
1024 Fish/Game (Other) 0.0 251.2 251.2 251.2 254.3 254.3 254.3 >999 % 3.1 1.2 % 0.0
Positions
Perm Full Time 0 32 32 22 22 22 22 >999 % 0 0
Perm Part Time 0 4 4 4 4 4 4 >999 % 0 0
Temporary 0 0 0 0 0 0 0 0 0
32 Legislative Finance Division Subcommittee Book

2012 Legislature - Operating BudgetTransaction Change Detail - Governor Structure
Numbers and LanguageAgency: Department of Fish and Game
Appropriation: Sport FisheriesAllocation: Sport Fish Hatcheries
Trans Total Personal Capital Type Expenditure Services Travel Services Commodities Outlay Grants Misc PFT PPT TMP ________ ____________ ____________ ____________ ____________ ____________ ____________ ____________ ____________ _____ _____ _____Transaction Title_______________________________________________
* * * FY12 Conference Committee * * * ConfCom 4,103.5 2,040.3 20.5 1,689.4 345.5 7.8 0.0 0.0 32 4 0FY12 Conference Committee
1002 Fed Rcpts (Fed) 3,806.31004 Gen Fund (UGF) 46.01024 Fish/Game (Other) 251.2 _________________________________________________________________________________________________________________________
FY12 Conference Committee Total 4,103.5 2,040.3 20.5 1,689.4 345.5 7.8 0.0 0.0 32 4 0
* * * Changes from FY12 Conference Committee to FY12 Authorized * * * _________________________________________________________________________________________________________________________FY12 Authorized Total 4,103.5 2,040.3 20.5 1,689.4 345.5 7.8 0.0 0.0 32 4 0
* * * Changes from FY12 Authorized to FY12 Management Plan * * * TrIn 79.0 79.0 0.0 0.0 0.0 0.0 0.0 0.0 0 0 0ADN 11-2-0278 Transfer personal services increases from Sport
Fisheries component1004 Gen Fund (UGF) 79.0
TrOut 0.0 0.0 0.0 0.0 0.0 0.0 0.0 0.0 -10 0 0Transfer 10 PFT PCNs from Sport Fish Hatcheries to Sport Fisheries toplace positions in correct allocation. _________________________________________________________________________________________________________________________FY12 Management Plan Total 4,182.5 2,119.3 20.5 1,689.4 345.5 7.8 0.0 0.0 22 4 0
* * * Changes from FY12 Management Plan to FY13 Adjusted Base * * * SalAdj 29.7 29.7 0.0 0.0 0.0 0.0 0.0 0.0 0 0 0FY2013 Salary Increases
1002 Fed Rcpts (Fed) 25.61004 Gen Fund (UGF) 2.21024 Fish/Game (Other) 1.9
SalAdj 17.7 17.7 0.0 0.0 0.0 0.0 0.0 0.0 0 0 0FY2013 Health Insurance Increases1002 Fed Rcpts (Fed) 15.51004 Gen Fund (UGF) 1.01024 Fish/Game (Other) 1.2 _________________________________________________________________________________________________________________________
FY13 Adjusted Base Total 4,229.9 2,166.7 20.5 1,689.4 345.5 7.8 0.0 0.0 22 4 0
* * * Changes from FY13 Adjusted Base to FY13 Governor Request * * * _________________________________________________________________________________________________________________________FY13 Governor Request Total 4,229.9 2,166.7 20.5 1,689.4 345.5 7.8 0.0 0.0 22 4 0
Subcommittee Book Legislative Finance Division 33

2012 Legislature - Operating BudgetAllocation Totals - Governor Structure
Numbers and LanguageAgency: Department of Fish and Game
Appropriation: Wildlife ConservationAllocation: Wildlife Conservation
[1] [2] [3] [4] [5] [6] [6] - [1] [6] - [4] [6] - [5] 11Actual 12 CC 12 Auth 12MgtPln Adj Base Gov 11Actual to Gov 12MgtPln to Gov Adj Base to Gov _____________ _____________ _____________ _____________ _____________ _____________ _______________________ _______________________ _______________________
Total 27,825.7 30,856.4 30,871.5 31,131.5 31,789.9 31,939.9 4,114.2 14.8 % 808.4 2.6 % 150.0 0.5 %
Objects of Expenditure
Personal Services 17,257.6 18,517.8 18,517.8 19,157.5 19,831.0 19,926.7 2,669.1 15.5 % 769.2 4.0 % 95.7 0.5 %
Travel 949.5 861.8 861.8 861.8 861.8 874.1 -75.4 -7.9 % 12.3 1.4 % 12.3 1.4 %
Services 7,225.2 9,434.4 9,449.5 9,069.8 9,054.7 9,096.7 1,871.5 25.9 % 26.9 0.3 % 42.0 0.5 %
Commodities 2,087.2 2,042.4 2,042.4 2,042.4 2,042.4 2,042.4 -44.8 -2.1 % 0.0 0.0
Capital Outlay 306.2 0.0 0.0 0.0 0.0 0.0 -306.2 -100.0 % 0.0 0.0
Grants, Benefits 0.0 0.0 0.0 0.0 0.0 0.0 0.0 0.0 0.0
Miscellaneous 0.0 0.0 0.0 0.0 0.0 0.0 0.0 0.0 0.0
Funding Sources
1002 Fed Rcpts (Fed) 14,909.9 15,515.1 15,515.1 15,710.1 16,066.3 16,066.3 1,156.4 7.8 % 356.2 2.3 % 0.0
1004 Gen Fund (UGF) 5,521.6 6,639.7 6,654.8 6,719.8 6,851.6 7,001.6 1,480.0 26.8 % 281.8 4.2 % 150.0 2.2 %
1005 GF/Prgm (DGF) 85.9 89.5 89.5 89.5 92.4 92.4 6.5 7.6 % 2.9 3.2 % 0.0
1024 Fish/Game (Other) 7,308.3 8,612.1 8,612.1 8,612.1 8,779.6 8,779.6 1,471.3 20.1 % 167.5 1.9 % 0.0
Positions
Perm Full Time 153 154 154 159 160 160 7 4.6 % 1 0.6 % 0
Perm Part Time 42 42 42 41 36 36 -6 -14.3 % -5 -12.2 % 0
Temporary 16 16 16 12 12 12 -4 -25.0 % 0 0
34 Legislative Finance Division Subcommittee Book

2012 Legislature - Operating BudgetTransaction Change Detail - Governor Structure
Numbers and LanguageAgency: Department of Fish and Game
Appropriation: Wildlife ConservationAllocation: Wildlife Conservation
Trans Total Personal Capital Type Expenditure Services Travel Services Commodities Outlay Grants Misc PFT PPT TMP ________ ____________ ____________ ____________ ____________ ____________ ____________ ____________ ____________ _____ _____ _____Transaction Title_______________________________________________
* * * FY12 Conference Committee * * * ConfCom 30,856.4 18,517.8 861.8 9,434.4 2,042.4 0.0 0.0 0.0 154 42 16FY12 Conference Committee
1002 Fed Rcpts (Fed) 15,515.11004 Gen Fund (UGF) 6,639.71005 GF/Prgm (DGF) 89.51024 Fish/Game (Other) 8,612.1 _________________________________________________________________________________________________________________________
FY12 Conference Committee Total 30,856.4 18,517.8 861.8 9,434.4 2,042.4 0.0 0.0 0.0 154 42 16
* * * Changes from FY12 Conference Committee to FY12 Authorized * * * ATrIn 15.1 0.0 0.0 15.1 0.0 0.0 0.0 0.0 0 0 0L August FY2012 Fuel/Utility Cost Increase Funding Distribution from the
Office of the Governor1004 Gen Fund (UGF) 15.1 _________________________________________________________________________________________________________________________
FY12 Authorized Total 30,871.5 18,517.8 861.8 9,449.5 2,042.4 0.0 0.0 0.0 154 42 16
* * * Changes from FY12 Authorized to FY12 Management Plan * * * TrIn 0.0 0.0 0.0 0.0 0.0 0.0 0.0 0.0 2 1 0ADN 11-2-0337 Transfer PFT PCNs 11-2117 and 11-7012 and PPT
PCN 11-2224 from Wildlife Conservation Special Projects TrIn 0.0 0.0 0.0 0.0 0.0 0.0 0.0 0.0 0 1 0ADN 11-2-0321 Transfer PPT PCN 11-1579 from Commercial
Fisheries Westward Region TrIn 260.0 260.0 0.0 0.0 0.0 0.0 0.0 0.0 0 0 0ADN 11-2-0347 Transfer from Wildlife Conservation Special Projects
for wildlife restoration projects1002 Fed Rcpts (Fed) 195.01004 Gen Fund (UGF) 65.0
TrIn 0.0 0.0 0.0 0.0 0.0 0.0 0.0 0.0 1 0 0ADN 11-2-0338 Transfer PFT 11-4093 from Sport Fisheries to WildlifeConservation for field research
TrOut 0.0 0.0 0.0 0.0 0.0 0.0 0.0 0.0 0 -1 -3ADN 11-2-0336 Transfer PPT PCN 11-1171 and NP PCNs 11-IN0902,11-IN1104 and 11-IN11079 to WC Special Projects
PosAdj 0.0 0.0 0.0 0.0 0.0 0.0 0.0 0.0 3 -3 0ADN 11-2-0339 Time status change from PPT to PFT for 11-1152,11-2242, and 11-4004 due to changes in workload
PosAdj 0.0 0.0 0.0 0.0 0.0 0.0 0.0 0.0 -1 1 0ADN 11-2-0341 Position time status change from PFT to PPT for11-4093 due to changes in workload
PosAdj 0.0 0.0 0.0 0.0 0.0 0.0 0.0 0.0 0 0 -1ADN 11-2-0444 Delete College Intern I PCN 11-N08075 LIT 0.0 379.7 0.0 -379.7 0.0 0.0 0.0 0.0 0 0 0ADN 11-2-0348 Transfer from services to meet staffing assignments
for shared Fish and Game Program Technician positions _________________________________________________________________________________________________________________________FY12 Management Plan Total 31,131.5 19,157.5 861.8 9,069.8 2,042.4 0.0 0.0 0.0 159 41 12
* * * Changes from FY12 Management Plan to FY13 Adjusted Base * * * TrOut 0.0 0.0 0.0 0.0 0.0 0.0 0.0 0.0 0 -1 0Transfer PPT PCN 11-4093 to Wildlife Conservation Special Projects
for Federal Projects PosAdj 0.0 0.0 0.0 0.0 0.0 0.0 0.0 0.0 1 -1 0Time Status Change of PCN 11-2255 for Spatial Analysis Project PosAdj 0.0 0.0 0.0 0.0 0.0 0.0 0.0 0.0 0 -3 0Delete Vacant PPT PCNs 11-1579, 11-2224 and 11-4330 OTI -300.0 -90.0 -10.0 -160.0 -40.0 0.0 0.0 0.0 -1 0 0Reverse Funding for Two Feasibility Assessments in 15A and 15C for
Future Intensive Management Activity1004 Gen Fund (UGF) -300.0
OTI -130.0 0.0 -10.0 -110.0 -10.0 0.0 0.0 0.0 0 0 0Reverse Funding for Bear Removal Program on the North Slope1004 Gen Fund (UGF) -130.0
OTI -80.0 0.0 -5.0 -55.0 -20.0 0.0 0.0 0.0 0 0 0Reverse Collar 50 Moose and Complete Population Estimation Surveyto Determine Population Density
Subcommittee Book Legislative Finance Division 35
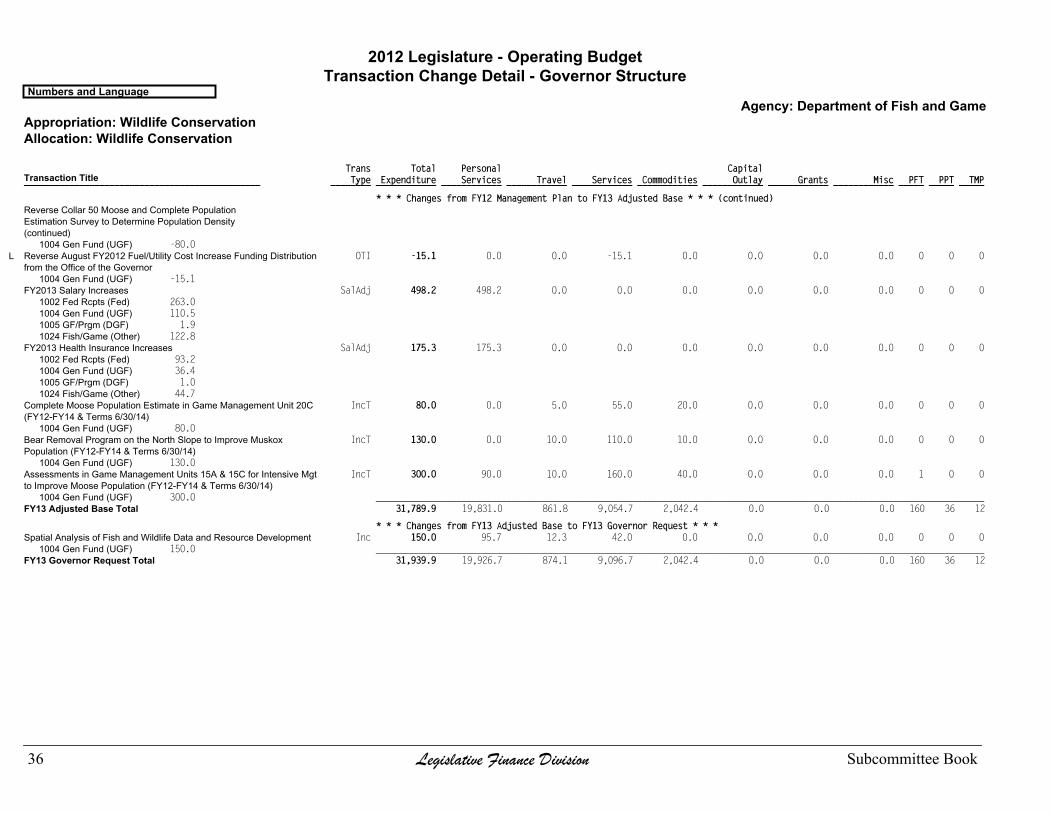
2012 Legislature - Operating BudgetTransaction Change Detail - Governor Structure
Numbers and LanguageAgency: Department of Fish and Game
Appropriation: Wildlife ConservationAllocation: Wildlife Conservation
Trans Total Personal Capital Type Expenditure Services Travel Services Commodities Outlay Grants Misc PFT PPT TMP ________ ____________ ____________ ____________ ____________ ____________ ____________ ____________ ____________ _____ _____ _____Transaction Title_______________________________________________
* * * Changes from FY12 Management Plan to FY13 Adjusted Base * * * (continued)Reverse Collar 50 Moose and Complete PopulationEstimation Survey to Determine Population Density(continued)
1004 Gen Fund (UGF) -80.0 OTI -15.1 0.0 0.0 -15.1 0.0 0.0 0.0 0.0 0 0 0L Reverse August FY2012 Fuel/Utility Cost Increase Funding Distribution
from the Office of the Governor1004 Gen Fund (UGF) -15.1
SalAdj 498.2 498.2 0.0 0.0 0.0 0.0 0.0 0.0 0 0 0FY2013 Salary Increases1002 Fed Rcpts (Fed) 263.01004 Gen Fund (UGF) 110.51005 GF/Prgm (DGF) 1.91024 Fish/Game (Other) 122.8
SalAdj 175.3 175.3 0.0 0.0 0.0 0.0 0.0 0.0 0 0 0FY2013 Health Insurance Increases1002 Fed Rcpts (Fed) 93.21004 Gen Fund (UGF) 36.41005 GF/Prgm (DGF) 1.01024 Fish/Game (Other) 44.7
IncT 80.0 0.0 5.0 55.0 20.0 0.0 0.0 0.0 0 0 0Complete Moose Population Estimate in Game Management Unit 20C(FY12-FY14 & Terms 6/30/14)
1004 Gen Fund (UGF) 80.0 IncT 130.0 0.0 10.0 110.0 10.0 0.0 0.0 0.0 0 0 0Bear Removal Program on the North Slope to Improve Muskox
Population (FY12-FY14 & Terms 6/30/14)1004 Gen Fund (UGF) 130.0
IncT 300.0 90.0 10.0 160.0 40.0 0.0 0.0 0.0 1 0 0Assessments in Game Management Units 15A & 15C for Intensive Mgtto Improve Moose Population (FY12-FY14 & Terms 6/30/14)
1004 Gen Fund (UGF) 300.0 _________________________________________________________________________________________________________________________FY13 Adjusted Base Total 31,789.9 19,831.0 861.8 9,054.7 2,042.4 0.0 0.0 0.0 160 36 12
* * * Changes from FY13 Adjusted Base to FY13 Governor Request * * * Inc 150.0 95.7 12.3 42.0 0.0 0.0 0.0 0.0 0 0 0Spatial Analysis of Fish and Wildlife Data and Resource Development
1004 Gen Fund (UGF) 150.0 _________________________________________________________________________________________________________________________FY13 Governor Request Total 31,939.9 19,926.7 874.1 9,096.7 2,042.4 0.0 0.0 0.0 160 36 12
36 Legislative Finance Division Subcommittee Book

This Page Intentionally Left Blank
Subcommittee Book Legislative Finance Division 37

2012 Legislature - Operating BudgetAllocation Totals - Governor Structure
Numbers and LanguageAgency: Department of Fish and Game
Appropriation: Wildlife ConservationAllocation: Wildlife Conservation Special Projects
[1] [2] [3] [4] [5] [6] [6] - [1] [6] - [4] [6] - [5] 11Actual 12 CC 12 Auth 12MgtPln Adj Base Gov 11Actual to Gov 12MgtPln to Gov Adj Base to Gov _____________ _____________ _____________ _____________ _____________ _____________ _______________________ _______________________ _______________________
Total 9,585.4 11,923.8 11,923.8 11,663.8 11,796.2 11,796.2 2,210.8 23.1 % 132.4 1.1 % 0.0
Objects of Expenditure
Personal Services 3,937.8 4,272.6 4,272.6 4,012.6 4,145.0 4,145.0 207.2 5.3 % 132.4 3.3 % 0.0
Travel 307.7 457.3 457.3 457.3 457.3 457.3 149.6 48.6 % 0.0 0.0
Services 4,628.7 6,014.3 6,014.3 6,014.3 6,014.3 6,014.3 1,385.6 29.9 % 0.0 0.0
Commodities 441.2 1,179.6 1,179.6 1,179.6 1,179.6 1,179.6 738.4 167.4 % 0.0 0.0
Capital Outlay 270.0 0.0 0.0 0.0 0.0 0.0 -270.0 -100.0 % 0.0 0.0
Grants, Benefits 0.0 0.0 0.0 0.0 0.0 0.0 0.0 0.0 0.0
Miscellaneous 0.0 0.0 0.0 0.0 0.0 0.0 0.0 0.0 0.0
Funding Sources
1002 Fed Rcpts (Fed) 6,632.7 8,592.2 8,592.2 8,397.2 8,505.7 8,605.7 1,973.0 29.7 % 208.5 2.5 % 100.0 1.2 %
1004 Gen Fund (UGF) 895.7 998.5 998.5 933.5 944.7 944.7 49.0 5.5 % 11.2 1.2 % 0.0
1007 I/A Rcpts (Other) 1,313.7 1,229.0 1,229.0 1,229.0 1,240.3 1,040.3 -273.4 -20.8 % -188.7 -15.4 % -200.0 -16.1 %
1018 EVOS Trust (Other) 0.0 50.0 50.0 50.0 50.0 50.0 50.0 >999 % 0.0 0.0
1024 Fish/Game (Other) 65.2 375.2 375.2 375.2 375.2 375.2 310.0 475.5 % 0.0 0.0
1061 CIP Rcpts (Other) 163.2 67.6 67.6 67.6 67.6 167.6 4.4 2.7 % 100.0 147.9 % 100.0 147.9 %
1108 Stat Desig (Other) 514.9 611.3 611.3 611.3 612.7 612.7 97.8 19.0 % 1.4 0.2 % 0.0
Positions
Perm Full Time 31 31 31 29 29 29 -2 -6.5 % 0 0
Perm Part Time 17 17 17 19 18 18 1 5.9 % -1 -5.3 % 0
Temporary 9 9 9 12 12 12 3 33.3 % 0 0
38 Legislative Finance Division Subcommittee Book
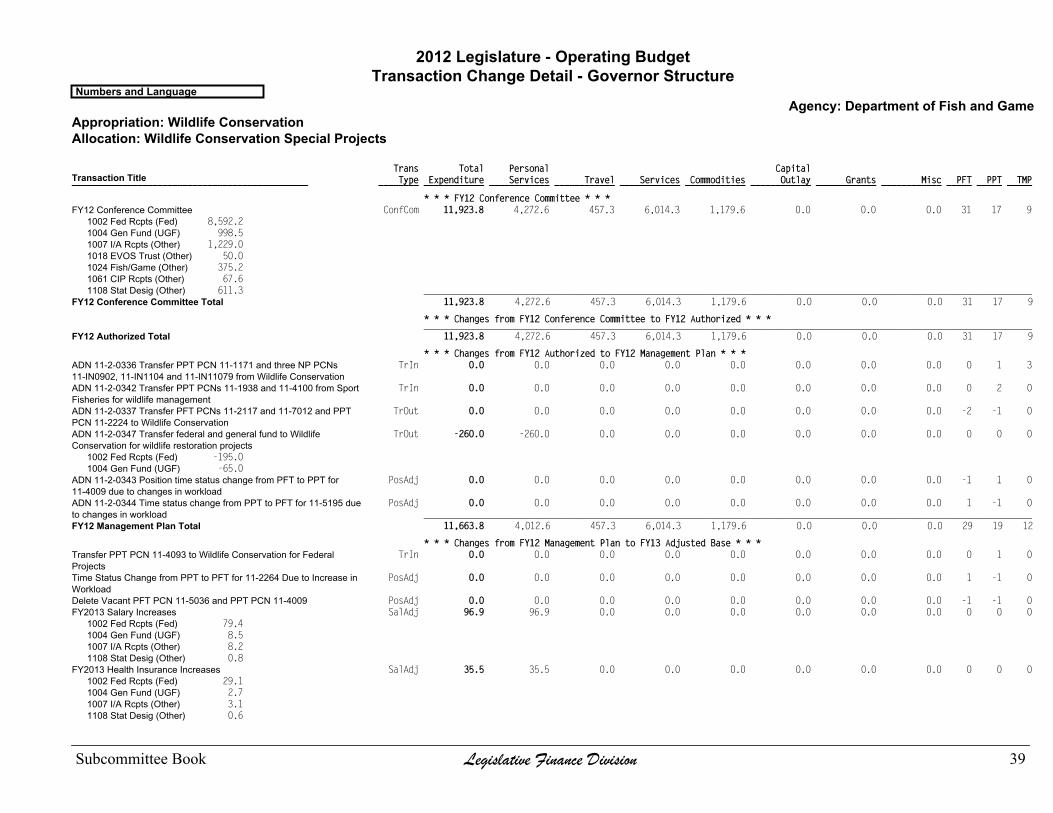
2012 Legislature - Operating BudgetTransaction Change Detail - Governor Structure
Numbers and LanguageAgency: Department of Fish and Game
Appropriation: Wildlife ConservationAllocation: Wildlife Conservation Special Projects
Trans Total Personal Capital Type Expenditure Services Travel Services Commodities Outlay Grants Misc PFT PPT TMP ________ ____________ ____________ ____________ ____________ ____________ ____________ ____________ ____________ _____ _____ _____Transaction Title_______________________________________________
* * * FY12 Conference Committee * * * ConfCom 11,923.8 4,272.6 457.3 6,014.3 1,179.6 0.0 0.0 0.0 31 17 9FY12 Conference Committee
1002 Fed Rcpts (Fed) 8,592.21004 Gen Fund (UGF) 998.51007 I/A Rcpts (Other) 1,229.01018 EVOS Trust (Other) 50.01024 Fish/Game (Other) 375.21061 CIP Rcpts (Other) 67.61108 Stat Desig (Other) 611.3 _________________________________________________________________________________________________________________________
FY12 Conference Committee Total 11,923.8 4,272.6 457.3 6,014.3 1,179.6 0.0 0.0 0.0 31 17 9
* * * Changes from FY12 Conference Committee to FY12 Authorized * * * _________________________________________________________________________________________________________________________FY12 Authorized Total 11,923.8 4,272.6 457.3 6,014.3 1,179.6 0.0 0.0 0.0 31 17 9
* * * Changes from FY12 Authorized to FY12 Management Plan * * * TrIn 0.0 0.0 0.0 0.0 0.0 0.0 0.0 0.0 0 1 3ADN 11-2-0336 Transfer PPT PCN 11-1171 and three NP PCNs
11-IN0902, 11-IN1104 and 11-IN11079 from Wildlife Conservation TrIn 0.0 0.0 0.0 0.0 0.0 0.0 0.0 0.0 0 2 0ADN 11-2-0342 Transfer PPT PCNs 11-1938 and 11-4100 from Sport
Fisheries for wildlife management TrOut 0.0 0.0 0.0 0.0 0.0 0.0 0.0 0.0 -2 -1 0ADN 11-2-0337 Transfer PFT PCNs 11-2117 and 11-7012 and PPT
PCN 11-2224 to Wildlife Conservation TrOut -260.0 -260.0 0.0 0.0 0.0 0.0 0.0 0.0 0 0 0ADN 11-2-0347 Transfer federal and general fund to Wildlife
Conservation for wildlife restoration projects1002 Fed Rcpts (Fed) -195.01004 Gen Fund (UGF) -65.0
PosAdj 0.0 0.0 0.0 0.0 0.0 0.0 0.0 0.0 -1 1 0ADN 11-2-0343 Position time status change from PFT to PPT for11-4009 due to changes in workload
PosAdj 0.0 0.0 0.0 0.0 0.0 0.0 0.0 0.0 1 -1 0ADN 11-2-0344 Time status change from PPT to PFT for 11-5195 dueto changes in workload _________________________________________________________________________________________________________________________FY12 Management Plan Total 11,663.8 4,012.6 457.3 6,014.3 1,179.6 0.0 0.0 0.0 29 19 12
* * * Changes from FY12 Management Plan to FY13 Adjusted Base * * * TrIn 0.0 0.0 0.0 0.0 0.0 0.0 0.0 0.0 0 1 0Transfer PPT PCN 11-4093 to Wildlife Conservation for Federal
Projects PosAdj 0.0 0.0 0.0 0.0 0.0 0.0 0.0 0.0 1 -1 0Time Status Change from PPT to PFT for 11-2264 Due to Increase in
Workload PosAdj 0.0 0.0 0.0 0.0 0.0 0.0 0.0 0.0 -1 -1 0Delete Vacant PFT PCN 11-5036 and PPT PCN 11-4009 SalAdj 96.9 96.9 0.0 0.0 0.0 0.0 0.0 0.0 0 0 0FY2013 Salary Increases
1002 Fed Rcpts (Fed) 79.41004 Gen Fund (UGF) 8.51007 I/A Rcpts (Other) 8.21108 Stat Desig (Other) 0.8
SalAdj 35.5 35.5 0.0 0.0 0.0 0.0 0.0 0.0 0 0 0FY2013 Health Insurance Increases1002 Fed Rcpts (Fed) 29.11004 Gen Fund (UGF) 2.71007 I/A Rcpts (Other) 3.11108 Stat Desig (Other) 0.6
Subcommittee Book Legislative Finance Division 39

2012 Legislature - Operating BudgetTransaction Change Detail - Governor Structure
Numbers and LanguageAgency: Department of Fish and Game
Appropriation: Wildlife ConservationAllocation: Wildlife Conservation Special Projects
Trans Total Personal Capital Type Expenditure Services Travel Services Commodities Outlay Grants Misc PFT PPT TMP ________ ____________ ____________ ____________ ____________ ____________ ____________ ____________ ____________ _____ _____ _____Transaction Title_______________________________________________
* * * Changes from FY12 Management Plan to FY13 Adjusted Base * * * (continued) _________________________________________________________________________________________________________________________
FY13 Adjusted Base Total 11,796.2 4,145.0 457.3 6,014.3 1,179.6 0.0 0.0 0.0 29 18 12
* * * Changes from FY13 Adjusted Base to FY13 Governor Request * * * Inc 200.0 0.0 0.0 200.0 0.0 0.0 0.0 0.0 0 0 0Intensive Management Projects and Projected Federal Receipts
1002 Fed Rcpts (Fed) 100.01061 CIP Rcpts (Other) 100.0
Dec -200.0 0.0 0.0 -200.0 0.0 0.0 0.0 0.0 0 0 0Reduce Receipt Authority1007 I/A Rcpts (Other) -200.0 _________________________________________________________________________________________________________________________
FY13 Governor Request Total 11,796.2 4,145.0 457.3 6,014.3 1,179.6 0.0 0.0 0.0 29 18 12
40 Legislative Finance Division Subcommittee Book

This Page Intentionally Left Blank
Subcommittee Book Legislative Finance Division 41
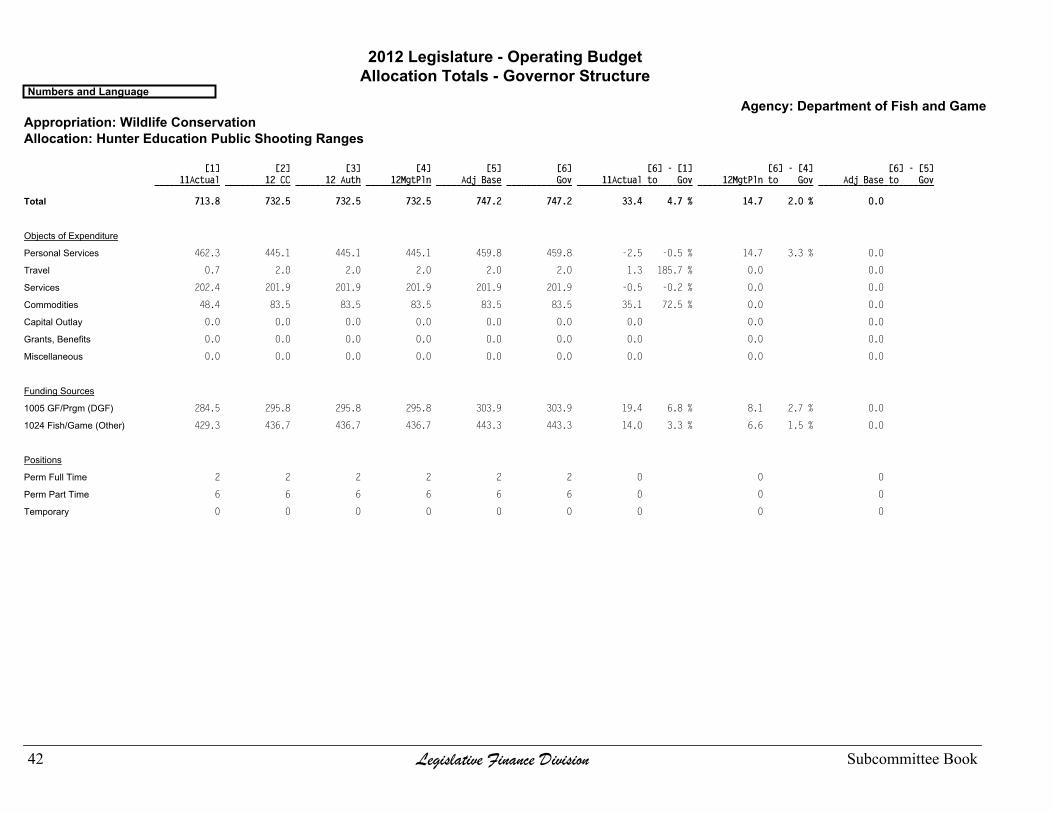
2012 Legislature - Operating BudgetAllocation Totals - Governor Structure
Numbers and LanguageAgency: Department of Fish and Game
Appropriation: Wildlife ConservationAllocation: Hunter Education Public Shooting Ranges
[1] [2] [3] [4] [5] [6] [6] - [1] [6] - [4] [6] - [5] 11Actual 12 CC 12 Auth 12MgtPln Adj Base Gov 11Actual to Gov 12MgtPln to Gov Adj Base to Gov _____________ _____________ _____________ _____________ _____________ _____________ _______________________ _______________________ _______________________
Total 713.8 732.5 732.5 732.5 747.2 747.2 33.4 4.7 % 14.7 2.0 % 0.0
Objects of Expenditure
Personal Services 462.3 445.1 445.1 445.1 459.8 459.8 -2.5 -0.5 % 14.7 3.3 % 0.0
Travel 0.7 2.0 2.0 2.0 2.0 2.0 1.3 185.7 % 0.0 0.0
Services 202.4 201.9 201.9 201.9 201.9 201.9 -0.5 -0.2 % 0.0 0.0
Commodities 48.4 83.5 83.5 83.5 83.5 83.5 35.1 72.5 % 0.0 0.0
Capital Outlay 0.0 0.0 0.0 0.0 0.0 0.0 0.0 0.0 0.0
Grants, Benefits 0.0 0.0 0.0 0.0 0.0 0.0 0.0 0.0 0.0
Miscellaneous 0.0 0.0 0.0 0.0 0.0 0.0 0.0 0.0 0.0
Funding Sources
1005 GF/Prgm (DGF) 284.5 295.8 295.8 295.8 303.9 303.9 19.4 6.8 % 8.1 2.7 % 0.0
1024 Fish/Game (Other) 429.3 436.7 436.7 436.7 443.3 443.3 14.0 3.3 % 6.6 1.5 % 0.0
Positions
Perm Full Time 2 2 2 2 2 2 0 0 0
Perm Part Time 6 6 6 6 6 6 0 0 0
Temporary 0 0 0 0 0 0 0 0 0
42 Legislative Finance Division Subcommittee Book
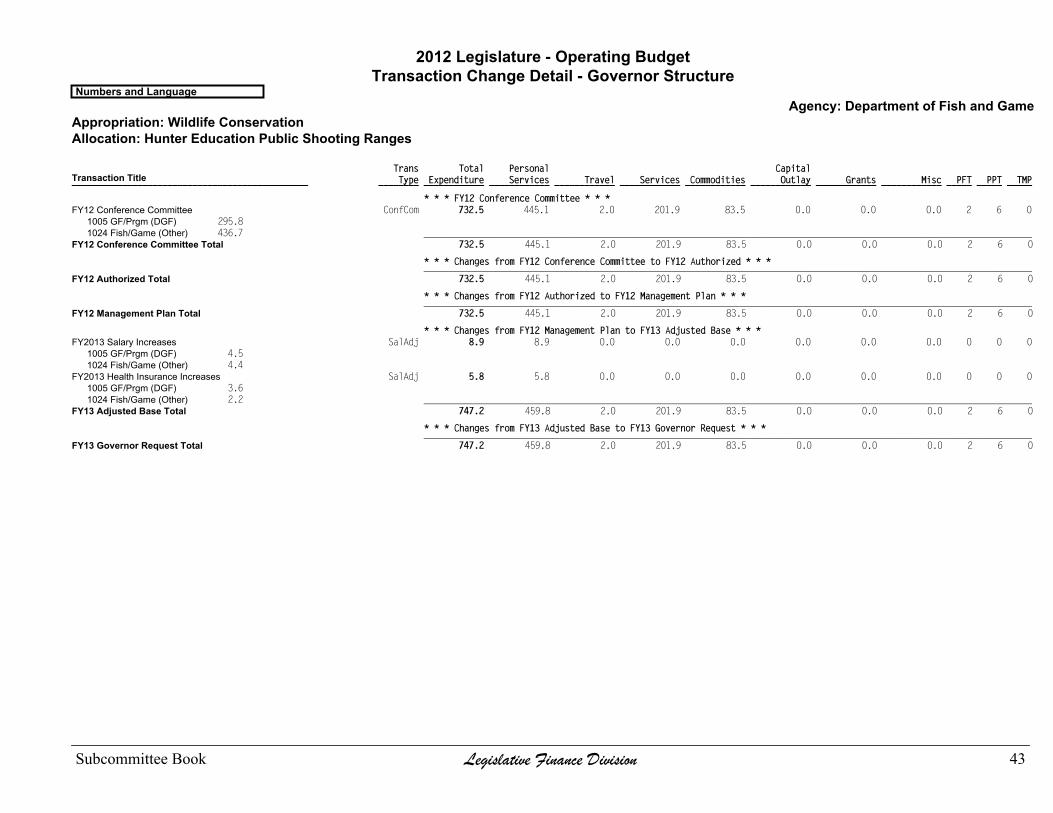
2012 Legislature - Operating BudgetTransaction Change Detail - Governor Structure
Numbers and LanguageAgency: Department of Fish and Game
Appropriation: Wildlife ConservationAllocation: Hunter Education Public Shooting Ranges
Trans Total Personal Capital Type Expenditure Services Travel Services Commodities Outlay Grants Misc PFT PPT TMP ________ ____________ ____________ ____________ ____________ ____________ ____________ ____________ ____________ _____ _____ _____Transaction Title_______________________________________________
* * * FY12 Conference Committee * * * ConfCom 732.5 445.1 2.0 201.9 83.5 0.0 0.0 0.0 2 6 0FY12 Conference Committee
1005 GF/Prgm (DGF) 295.81024 Fish/Game (Other) 436.7 _________________________________________________________________________________________________________________________
FY12 Conference Committee Total 732.5 445.1 2.0 201.9 83.5 0.0 0.0 0.0 2 6 0
* * * Changes from FY12 Conference Committee to FY12 Authorized * * * _________________________________________________________________________________________________________________________FY12 Authorized Total 732.5 445.1 2.0 201.9 83.5 0.0 0.0 0.0 2 6 0
* * * Changes from FY12 Authorized to FY12 Management Plan * * * _________________________________________________________________________________________________________________________FY12 Management Plan Total 732.5 445.1 2.0 201.9 83.5 0.0 0.0 0.0 2 6 0
* * * Changes from FY12 Management Plan to FY13 Adjusted Base * * * SalAdj 8.9 8.9 0.0 0.0 0.0 0.0 0.0 0.0 0 0 0FY2013 Salary Increases
1005 GF/Prgm (DGF) 4.51024 Fish/Game (Other) 4.4
SalAdj 5.8 5.8 0.0 0.0 0.0 0.0 0.0 0.0 0 0 0FY2013 Health Insurance Increases1005 GF/Prgm (DGF) 3.61024 Fish/Game (Other) 2.2 _________________________________________________________________________________________________________________________
FY13 Adjusted Base Total 747.2 459.8 2.0 201.9 83.5 0.0 0.0 0.0 2 6 0
* * * Changes from FY13 Adjusted Base to FY13 Governor Request * * * _________________________________________________________________________________________________________________________FY13 Governor Request Total 747.2 459.8 2.0 201.9 83.5 0.0 0.0 0.0 2 6 0
Subcommittee Book Legislative Finance Division 43
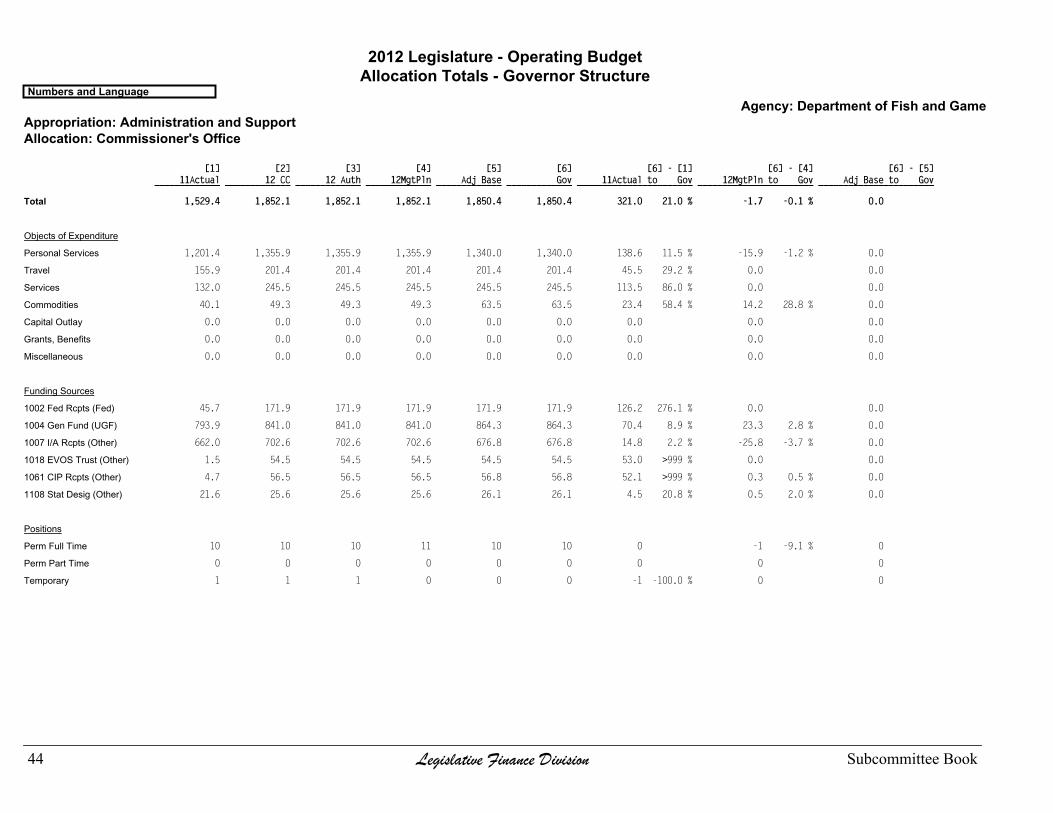
2012 Legislature - Operating BudgetAllocation Totals - Governor Structure
Numbers and LanguageAgency: Department of Fish and Game
Appropriation: Administration and SupportAllocation: Commissioner's Office
[1] [2] [3] [4] [5] [6] [6] - [1] [6] - [4] [6] - [5] 11Actual 12 CC 12 Auth 12MgtPln Adj Base Gov 11Actual to Gov 12MgtPln to Gov Adj Base to Gov _____________ _____________ _____________ _____________ _____________ _____________ _______________________ _______________________ _______________________
Total 1,529.4 1,852.1 1,852.1 1,852.1 1,850.4 1,850.4 321.0 21.0 % -1.7 -0.1 % 0.0
Objects of Expenditure
Personal Services 1,201.4 1,355.9 1,355.9 1,355.9 1,340.0 1,340.0 138.6 11.5 % -15.9 -1.2 % 0.0
Travel 155.9 201.4 201.4 201.4 201.4 201.4 45.5 29.2 % 0.0 0.0
Services 132.0 245.5 245.5 245.5 245.5 245.5 113.5 86.0 % 0.0 0.0
Commodities 40.1 49.3 49.3 49.3 63.5 63.5 23.4 58.4 % 14.2 28.8 % 0.0
Capital Outlay 0.0 0.0 0.0 0.0 0.0 0.0 0.0 0.0 0.0
Grants, Benefits 0.0 0.0 0.0 0.0 0.0 0.0 0.0 0.0 0.0
Miscellaneous 0.0 0.0 0.0 0.0 0.0 0.0 0.0 0.0 0.0
Funding Sources
1002 Fed Rcpts (Fed) 45.7 171.9 171.9 171.9 171.9 171.9 126.2 276.1 % 0.0 0.0
1004 Gen Fund (UGF) 793.9 841.0 841.0 841.0 864.3 864.3 70.4 8.9 % 23.3 2.8 % 0.0
1007 I/A Rcpts (Other) 662.0 702.6 702.6 702.6 676.8 676.8 14.8 2.2 % -25.8 -3.7 % 0.0
1018 EVOS Trust (Other) 1.5 54.5 54.5 54.5 54.5 54.5 53.0 >999 % 0.0 0.0
1061 CIP Rcpts (Other) 4.7 56.5 56.5 56.5 56.8 56.8 52.1 >999 % 0.3 0.5 % 0.0
1108 Stat Desig (Other) 21.6 25.6 25.6 25.6 26.1 26.1 4.5 20.8 % 0.5 2.0 % 0.0
Positions
Perm Full Time 10 10 10 11 10 10 0 -1 -9.1 % 0
Perm Part Time 0 0 0 0 0 0 0 0 0
Temporary 1 1 1 0 0 0 -1 -100.0 % 0 0
44 Legislative Finance Division Subcommittee Book
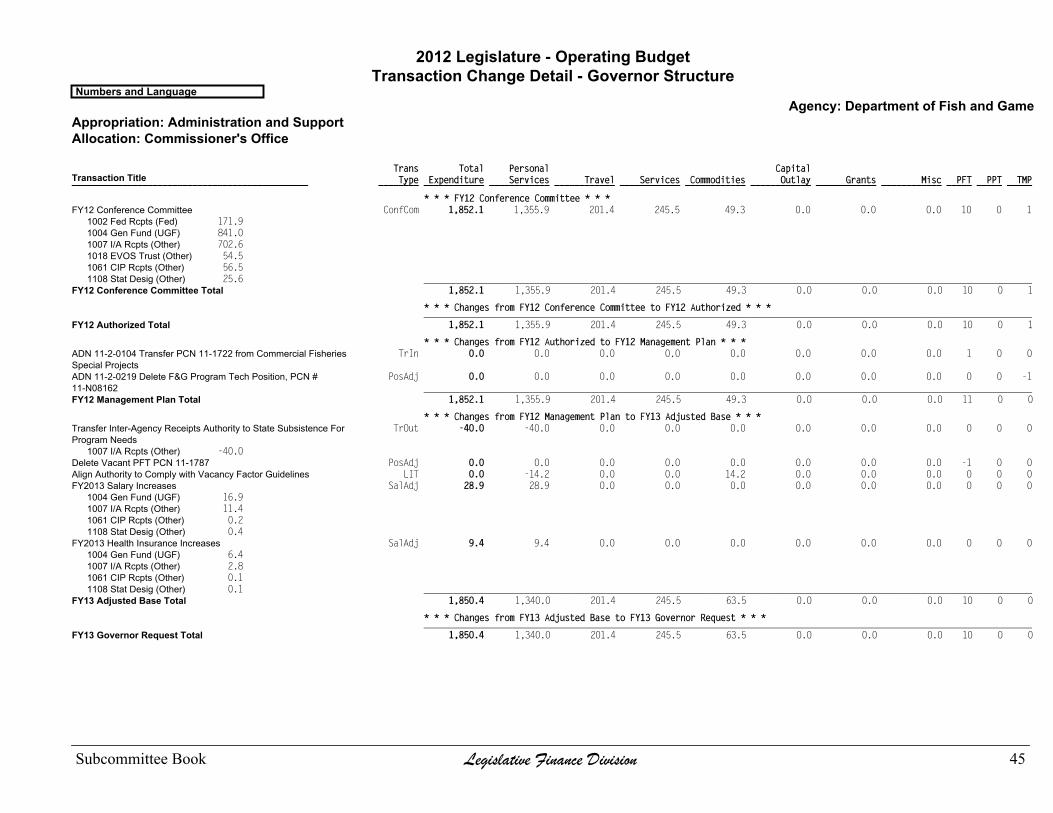
2012 Legislature - Operating BudgetTransaction Change Detail - Governor Structure
Numbers and LanguageAgency: Department of Fish and Game
Appropriation: Administration and SupportAllocation: Commissioner's Office
Trans Total Personal Capital Type Expenditure Services Travel Services Commodities Outlay Grants Misc PFT PPT TMP ________ ____________ ____________ ____________ ____________ ____________ ____________ ____________ ____________ _____ _____ _____Transaction Title_______________________________________________
* * * FY12 Conference Committee * * * ConfCom 1,852.1 1,355.9 201.4 245.5 49.3 0.0 0.0 0.0 10 0 1FY12 Conference Committee
1002 Fed Rcpts (Fed) 171.91004 Gen Fund (UGF) 841.01007 I/A Rcpts (Other) 702.61018 EVOS Trust (Other) 54.51061 CIP Rcpts (Other) 56.51108 Stat Desig (Other) 25.6 _________________________________________________________________________________________________________________________
FY12 Conference Committee Total 1,852.1 1,355.9 201.4 245.5 49.3 0.0 0.0 0.0 10 0 1
* * * Changes from FY12 Conference Committee to FY12 Authorized * * * _________________________________________________________________________________________________________________________FY12 Authorized Total 1,852.1 1,355.9 201.4 245.5 49.3 0.0 0.0 0.0 10 0 1
* * * Changes from FY12 Authorized to FY12 Management Plan * * * TrIn 0.0 0.0 0.0 0.0 0.0 0.0 0.0 0.0 1 0 0ADN 11-2-0104 Transfer PCN 11-1722 from Commercial Fisheries
Special Projects PosAdj 0.0 0.0 0.0 0.0 0.0 0.0 0.0 0.0 0 0 -1ADN 11-2-0219 Delete F&G Program Tech Position, PCN #
11-N08162 _________________________________________________________________________________________________________________________FY12 Management Plan Total 1,852.1 1,355.9 201.4 245.5 49.3 0.0 0.0 0.0 11 0 0
* * * Changes from FY12 Management Plan to FY13 Adjusted Base * * * TrOut -40.0 -40.0 0.0 0.0 0.0 0.0 0.0 0.0 0 0 0Transfer Inter-Agency Receipts Authority to State Subsistence For
Program Needs1007 I/A Rcpts (Other) -40.0
PosAdj 0.0 0.0 0.0 0.0 0.0 0.0 0.0 0.0 -1 0 0Delete Vacant PFT PCN 11-1787 LIT 0.0 -14.2 0.0 0.0 14.2 0.0 0.0 0.0 0 0 0Align Authority to Comply with Vacancy Factor Guidelines SalAdj 28.9 28.9 0.0 0.0 0.0 0.0 0.0 0.0 0 0 0FY2013 Salary Increases
1004 Gen Fund (UGF) 16.91007 I/A Rcpts (Other) 11.41061 CIP Rcpts (Other) 0.21108 Stat Desig (Other) 0.4
SalAdj 9.4 9.4 0.0 0.0 0.0 0.0 0.0 0.0 0 0 0FY2013 Health Insurance Increases1004 Gen Fund (UGF) 6.41007 I/A Rcpts (Other) 2.81061 CIP Rcpts (Other) 0.11108 Stat Desig (Other) 0.1 _________________________________________________________________________________________________________________________
FY13 Adjusted Base Total 1,850.4 1,340.0 201.4 245.5 63.5 0.0 0.0 0.0 10 0 0
* * * Changes from FY13 Adjusted Base to FY13 Governor Request * * * _________________________________________________________________________________________________________________________FY13 Governor Request Total 1,850.4 1,340.0 201.4 245.5 63.5 0.0 0.0 0.0 10 0 0
Subcommittee Book Legislative Finance Division 45

2012 Legislature - Operating BudgetAllocation Totals - Governor Structure
Numbers and LanguageAgency: Department of Fish and Game
Appropriation: Administration and SupportAllocation: Administrative Services
[1] [2] [3] [4] [5] [6] [6] - [1] [6] - [4] [6] - [5] 11Actual 12 CC 12 Auth 12MgtPln Adj Base Gov 11Actual to Gov 12MgtPln to Gov Adj Base to Gov _____________ _____________ _____________ _____________ _____________ _____________ _______________________ _______________________ _______________________
Total 11,237.5 12,056.6 12,139.2 12,139.2 12,431.0 12,431.0 1,193.5 10.6 % 291.8 2.4 % 0.0
Objects of Expenditure
Personal Services 6,416.6 6,818.3 6,818.3 6,818.3 7,110.1 7,110.1 693.5 10.8 % 291.8 4.3 % 0.0
Travel 106.2 134.1 134.1 134.1 134.1 134.1 27.9 26.3 % 0.0 0.0
Services 4,234.2 4,347.0 4,429.6 4,429.6 4,429.6 4,429.6 195.4 4.6 % 0.0 0.0
Commodities 227.8 567.2 567.2 567.2 567.2 567.2 339.4 149.0 % 0.0 0.0
Capital Outlay 252.7 190.0 190.0 190.0 190.0 190.0 -62.7 -24.8 % 0.0 0.0
Grants, Benefits 0.0 0.0 0.0 0.0 0.0 0.0 0.0 0.0 0.0
Miscellaneous 0.0 0.0 0.0 0.0 0.0 0.0 0.0 0.0 0.0
Funding Sources
1002 Fed Rcpts (Fed) 1,206.1 1,934.0 1,934.0 1,934.0 1,934.0 1,934.0 727.9 60.4 % 0.0 0.0
1004 Gen Fund (UGF) 2,574.7 2,887.1 2,969.7 2,969.7 3,074.8 3,074.8 500.1 19.4 % 105.1 3.5 % 0.0
1005 GF/Prgm (DGF) 379.4 141.9 141.9 141.9 141.9 141.9 -237.5 -62.6 % 0.0 0.0
1007 I/A Rcpts (Other) 5,475.5 6,176.9 6,176.9 6,176.9 6,344.7 6,344.7 869.2 15.9 % 167.8 2.7 % 0.0
1018 EVOS Trust (Other) 116.3 327.9 327.9 327.9 337.4 337.4 221.1 190.1 % 9.5 2.9 % 0.0
1024 Fish/Game (Other) 969.2 0.0 0.0 0.0 0.0 0.0 -969.2 -100.0 % 0.0 0.0
1061 CIP Rcpts (Other) 226.1 267.4 267.4 267.4 276.8 276.8 50.7 22.4 % 9.4 3.5 % 0.0
1108 Stat Desig (Other) 290.2 321.4 321.4 321.4 321.4 321.4 31.2 10.8 % 0.0 0.0
Positions
Perm Full Time 70 70 70 70 70 70 0 0 0
Perm Part Time 10 10 10 10 11 11 1 10.0 % 1 10.0 % 0
Temporary 6 6 6 5 5 5 -1 -16.7 % 0 0
46 Legislative Finance Division Subcommittee Book
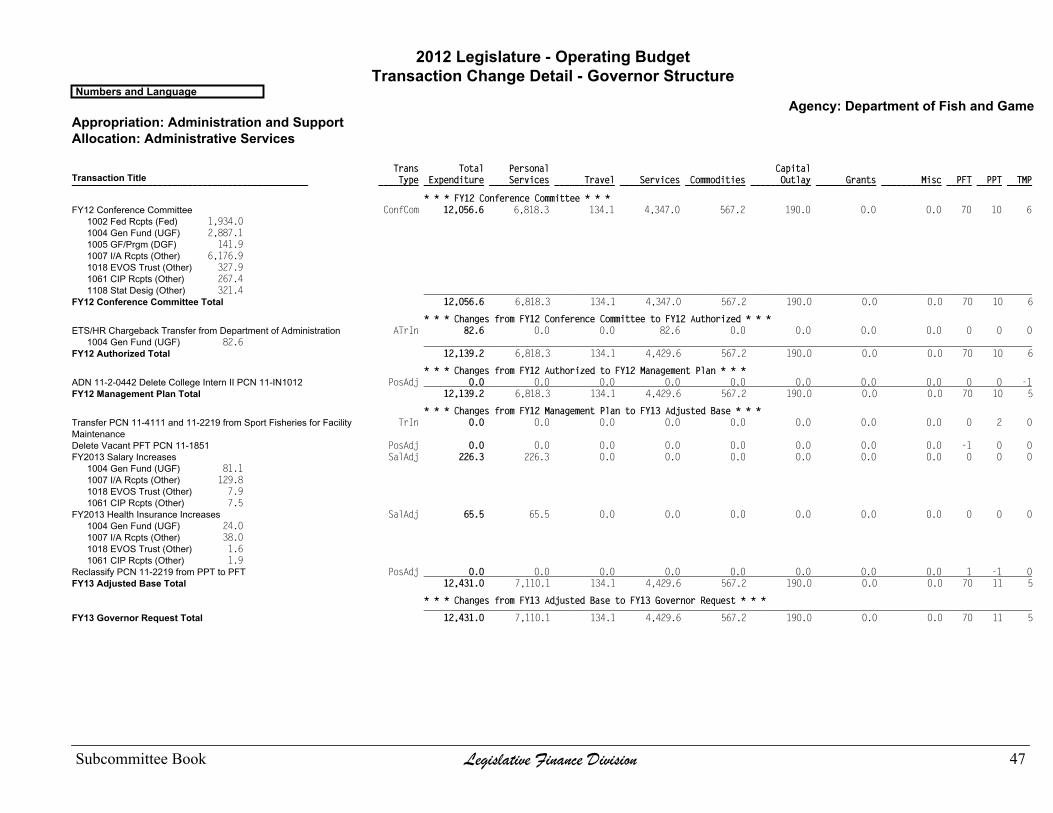
2012 Legislature - Operating BudgetTransaction Change Detail - Governor Structure
Numbers and LanguageAgency: Department of Fish and Game
Appropriation: Administration and SupportAllocation: Administrative Services
Trans Total Personal Capital Type Expenditure Services Travel Services Commodities Outlay Grants Misc PFT PPT TMP ________ ____________ ____________ ____________ ____________ ____________ ____________ ____________ ____________ _____ _____ _____Transaction Title_______________________________________________
* * * FY12 Conference Committee * * * ConfCom 12,056.6 6,818.3 134.1 4,347.0 567.2 190.0 0.0 0.0 70 10 6FY12 Conference Committee
1002 Fed Rcpts (Fed) 1,934.01004 Gen Fund (UGF) 2,887.11005 GF/Prgm (DGF) 141.91007 I/A Rcpts (Other) 6,176.91018 EVOS Trust (Other) 327.91061 CIP Rcpts (Other) 267.41108 Stat Desig (Other) 321.4 _________________________________________________________________________________________________________________________
FY12 Conference Committee Total 12,056.6 6,818.3 134.1 4,347.0 567.2 190.0 0.0 0.0 70 10 6
* * * Changes from FY12 Conference Committee to FY12 Authorized * * * ATrIn 82.6 0.0 0.0 82.6 0.0 0.0 0.0 0.0 0 0 0ETS/HR Chargeback Transfer from Department of Administration
1004 Gen Fund (UGF) 82.6 _________________________________________________________________________________________________________________________FY12 Authorized Total 12,139.2 6,818.3 134.1 4,429.6 567.2 190.0 0.0 0.0 70 10 6
* * * Changes from FY12 Authorized to FY12 Management Plan * * * PosAdj 0.0 0.0 0.0 0.0 0.0 0.0 0.0 0.0 0 0 -1ADN 11-2-0442 Delete College Intern II PCN 11-IN1012 _________________________________________________________________________________________________________________________
FY12 Management Plan Total 12,139.2 6,818.3 134.1 4,429.6 567.2 190.0 0.0 0.0 70 10 5
* * * Changes from FY12 Management Plan to FY13 Adjusted Base * * * TrIn 0.0 0.0 0.0 0.0 0.0 0.0 0.0 0.0 0 2 0Transfer PCN 11-4111 and 11-2219 from Sport Fisheries for Facility
Maintenance PosAdj 0.0 0.0 0.0 0.0 0.0 0.0 0.0 0.0 -1 0 0Delete Vacant PFT PCN 11-1851 SalAdj 226.3 226.3 0.0 0.0 0.0 0.0 0.0 0.0 0 0 0FY2013 Salary Increases
1004 Gen Fund (UGF) 81.11007 I/A Rcpts (Other) 129.81018 EVOS Trust (Other) 7.91061 CIP Rcpts (Other) 7.5
SalAdj 65.5 65.5 0.0 0.0 0.0 0.0 0.0 0.0 0 0 0FY2013 Health Insurance Increases1004 Gen Fund (UGF) 24.01007 I/A Rcpts (Other) 38.01018 EVOS Trust (Other) 1.61061 CIP Rcpts (Other) 1.9
PosAdj 0.0 0.0 0.0 0.0 0.0 0.0 0.0 0.0 1 -1 0Reclassify PCN 11-2219 from PPT to PFT _________________________________________________________________________________________________________________________FY13 Adjusted Base Total 12,431.0 7,110.1 134.1 4,429.6 567.2 190.0 0.0 0.0 70 11 5
* * * Changes from FY13 Adjusted Base to FY13 Governor Request * * * _________________________________________________________________________________________________________________________FY13 Governor Request Total 12,431.0 7,110.1 134.1 4,429.6 567.2 190.0 0.0 0.0 70 11 5
Subcommittee Book Legislative Finance Division 47
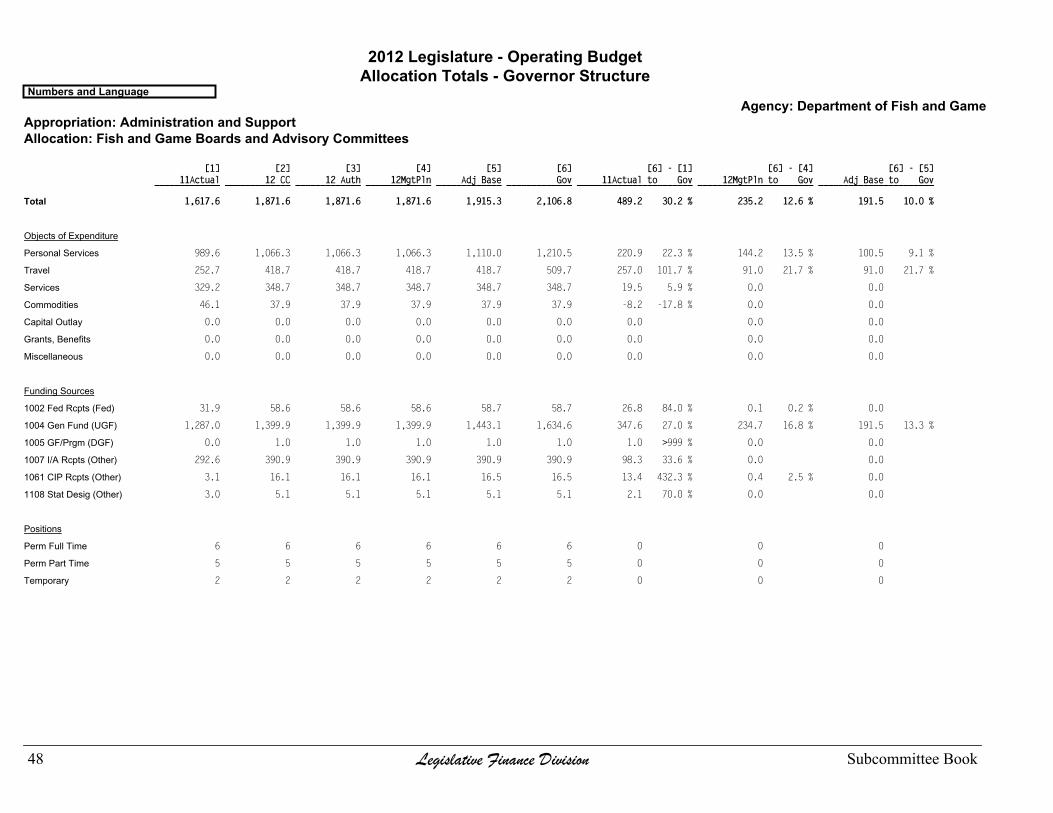
2012 Legislature - Operating BudgetAllocation Totals - Governor Structure
Numbers and LanguageAgency: Department of Fish and Game
Appropriation: Administration and SupportAllocation: Fish and Game Boards and Advisory Committees
[1] [2] [3] [4] [5] [6] [6] - [1] [6] - [4] [6] - [5] 11Actual 12 CC 12 Auth 12MgtPln Adj Base Gov 11Actual to Gov 12MgtPln to Gov Adj Base to Gov _____________ _____________ _____________ _____________ _____________ _____________ _______________________ _______________________ _______________________
Total 1,617.6 1,871.6 1,871.6 1,871.6 1,915.3 2,106.8 489.2 30.2 % 235.2 12.6 % 191.5 10.0 %
Objects of Expenditure
Personal Services 989.6 1,066.3 1,066.3 1,066.3 1,110.0 1,210.5 220.9 22.3 % 144.2 13.5 % 100.5 9.1 %
Travel 252.7 418.7 418.7 418.7 418.7 509.7 257.0 101.7 % 91.0 21.7 % 91.0 21.7 %
Services 329.2 348.7 348.7 348.7 348.7 348.7 19.5 5.9 % 0.0 0.0
Commodities 46.1 37.9 37.9 37.9 37.9 37.9 -8.2 -17.8 % 0.0 0.0
Capital Outlay 0.0 0.0 0.0 0.0 0.0 0.0 0.0 0.0 0.0
Grants, Benefits 0.0 0.0 0.0 0.0 0.0 0.0 0.0 0.0 0.0
Miscellaneous 0.0 0.0 0.0 0.0 0.0 0.0 0.0 0.0 0.0
Funding Sources
1002 Fed Rcpts (Fed) 31.9 58.6 58.6 58.6 58.7 58.7 26.8 84.0 % 0.1 0.2 % 0.0
1004 Gen Fund (UGF) 1,287.0 1,399.9 1,399.9 1,399.9 1,443.1 1,634.6 347.6 27.0 % 234.7 16.8 % 191.5 13.3 %
1005 GF/Prgm (DGF) 0.0 1.0 1.0 1.0 1.0 1.0 1.0 >999 % 0.0 0.0
1007 I/A Rcpts (Other) 292.6 390.9 390.9 390.9 390.9 390.9 98.3 33.6 % 0.0 0.0
1061 CIP Rcpts (Other) 3.1 16.1 16.1 16.1 16.5 16.5 13.4 432.3 % 0.4 2.5 % 0.0
1108 Stat Desig (Other) 3.0 5.1 5.1 5.1 5.1 5.1 2.1 70.0 % 0.0 0.0
Positions
Perm Full Time 6 6 6 6 6 6 0 0 0
Perm Part Time 5 5 5 5 5 5 0 0 0
Temporary 2 2 2 2 2 2 0 0 0
48 Legislative Finance Division Subcommittee Book
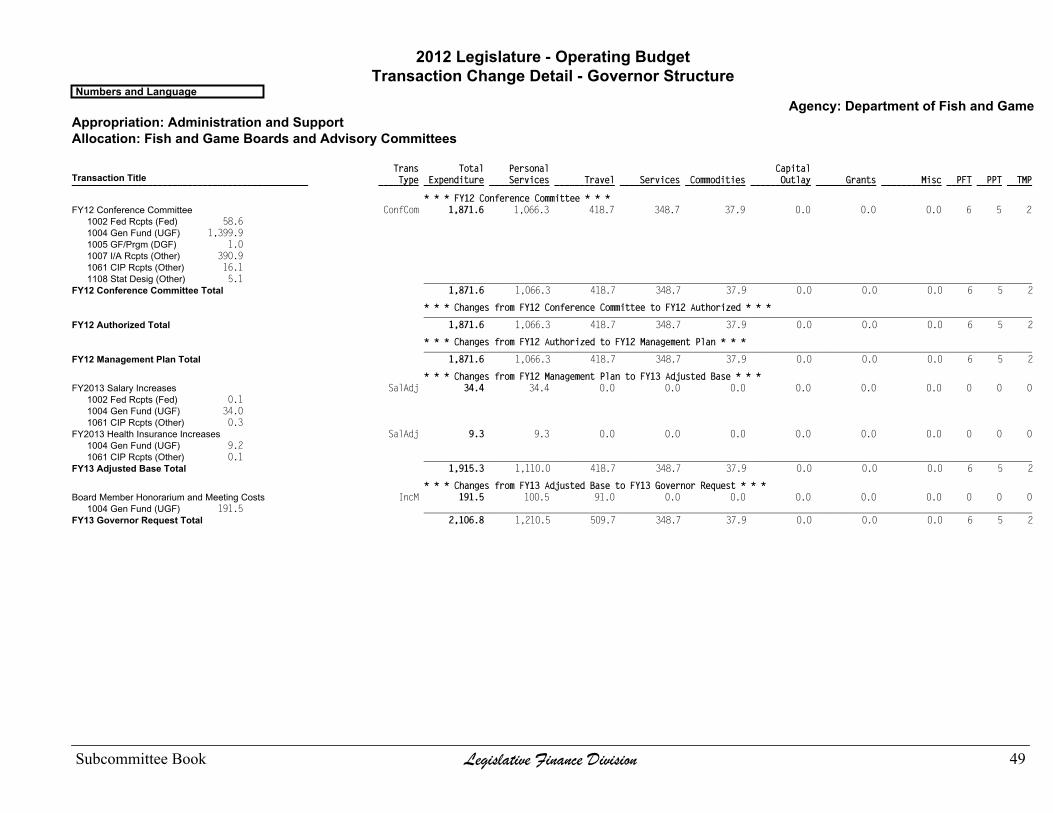
2012 Legislature - Operating BudgetTransaction Change Detail - Governor Structure
Numbers and LanguageAgency: Department of Fish and Game
Appropriation: Administration and SupportAllocation: Fish and Game Boards and Advisory Committees
Trans Total Personal Capital Type Expenditure Services Travel Services Commodities Outlay Grants Misc PFT PPT TMP ________ ____________ ____________ ____________ ____________ ____________ ____________ ____________ ____________ _____ _____ _____Transaction Title_______________________________________________
* * * FY12 Conference Committee * * * ConfCom 1,871.6 1,066.3 418.7 348.7 37.9 0.0 0.0 0.0 6 5 2FY12 Conference Committee
1002 Fed Rcpts (Fed) 58.61004 Gen Fund (UGF) 1,399.91005 GF/Prgm (DGF) 1.01007 I/A Rcpts (Other) 390.91061 CIP Rcpts (Other) 16.11108 Stat Desig (Other) 5.1 _________________________________________________________________________________________________________________________
FY12 Conference Committee Total 1,871.6 1,066.3 418.7 348.7 37.9 0.0 0.0 0.0 6 5 2
* * * Changes from FY12 Conference Committee to FY12 Authorized * * * _________________________________________________________________________________________________________________________FY12 Authorized Total 1,871.6 1,066.3 418.7 348.7 37.9 0.0 0.0 0.0 6 5 2
* * * Changes from FY12 Authorized to FY12 Management Plan * * * _________________________________________________________________________________________________________________________FY12 Management Plan Total 1,871.6 1,066.3 418.7 348.7 37.9 0.0 0.0 0.0 6 5 2
* * * Changes from FY12 Management Plan to FY13 Adjusted Base * * * SalAdj 34.4 34.4 0.0 0.0 0.0 0.0 0.0 0.0 0 0 0FY2013 Salary Increases
1002 Fed Rcpts (Fed) 0.11004 Gen Fund (UGF) 34.01061 CIP Rcpts (Other) 0.3
SalAdj 9.3 9.3 0.0 0.0 0.0 0.0 0.0 0.0 0 0 0FY2013 Health Insurance Increases1004 Gen Fund (UGF) 9.21061 CIP Rcpts (Other) 0.1 _________________________________________________________________________________________________________________________
FY13 Adjusted Base Total 1,915.3 1,110.0 418.7 348.7 37.9 0.0 0.0 0.0 6 5 2
* * * Changes from FY13 Adjusted Base to FY13 Governor Request * * * IncM 191.5 100.5 91.0 0.0 0.0 0.0 0.0 0.0 0 0 0Board Member Honorarium and Meeting Costs
1004 Gen Fund (UGF) 191.5 _________________________________________________________________________________________________________________________FY13 Governor Request Total 2,106.8 1,210.5 509.7 348.7 37.9 0.0 0.0 0.0 6 5 2
Subcommittee Book Legislative Finance Division 49
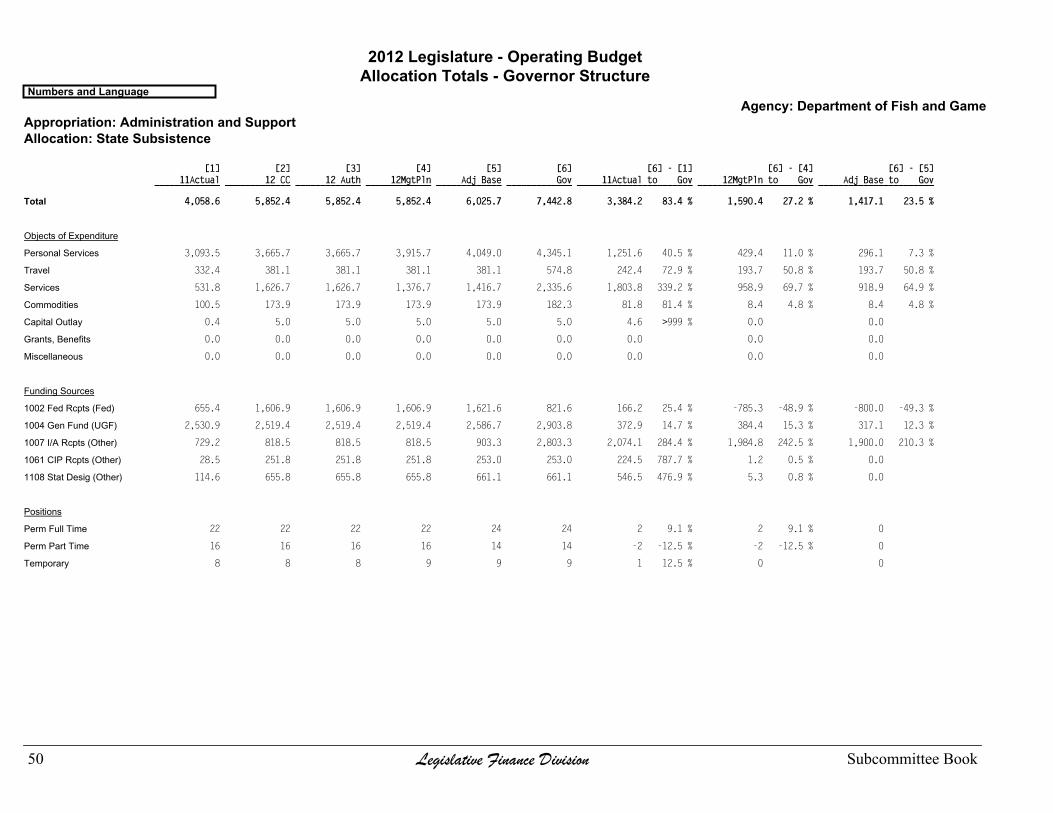
2012 Legislature - Operating BudgetAllocation Totals - Governor Structure
Numbers and LanguageAgency: Department of Fish and Game
Appropriation: Administration and SupportAllocation: State Subsistence
[1] [2] [3] [4] [5] [6] [6] - [1] [6] - [4] [6] - [5] 11Actual 12 CC 12 Auth 12MgtPln Adj Base Gov 11Actual to Gov 12MgtPln to Gov Adj Base to Gov _____________ _____________ _____________ _____________ _____________ _____________ _______________________ _______________________ _______________________
Total 4,058.6 5,852.4 5,852.4 5,852.4 6,025.7 7,442.8 3,384.2 83.4 % 1,590.4 27.2 % 1,417.1 23.5 %
Objects of Expenditure
Personal Services 3,093.5 3,665.7 3,665.7 3,915.7 4,049.0 4,345.1 1,251.6 40.5 % 429.4 11.0 % 296.1 7.3 %
Travel 332.4 381.1 381.1 381.1 381.1 574.8 242.4 72.9 % 193.7 50.8 % 193.7 50.8 %
Services 531.8 1,626.7 1,626.7 1,376.7 1,416.7 2,335.6 1,803.8 339.2 % 958.9 69.7 % 918.9 64.9 %
Commodities 100.5 173.9 173.9 173.9 173.9 182.3 81.8 81.4 % 8.4 4.8 % 8.4 4.8 %
Capital Outlay 0.4 5.0 5.0 5.0 5.0 5.0 4.6 >999 % 0.0 0.0
Grants, Benefits 0.0 0.0 0.0 0.0 0.0 0.0 0.0 0.0 0.0
Miscellaneous 0.0 0.0 0.0 0.0 0.0 0.0 0.0 0.0 0.0
Funding Sources
1002 Fed Rcpts (Fed) 655.4 1,606.9 1,606.9 1,606.9 1,621.6 821.6 166.2 25.4 % -785.3 -48.9 % -800.0 -49.3 %
1004 Gen Fund (UGF) 2,530.9 2,519.4 2,519.4 2,519.4 2,586.7 2,903.8 372.9 14.7 % 384.4 15.3 % 317.1 12.3 %
1007 I/A Rcpts (Other) 729.2 818.5 818.5 818.5 903.3 2,803.3 2,074.1 284.4 % 1,984.8 242.5 % 1,900.0 210.3 %
1061 CIP Rcpts (Other) 28.5 251.8 251.8 251.8 253.0 253.0 224.5 787.7 % 1.2 0.5 % 0.0
1108 Stat Desig (Other) 114.6 655.8 655.8 655.8 661.1 661.1 546.5 476.9 % 5.3 0.8 % 0.0
Positions
Perm Full Time 22 22 22 22 24 24 2 9.1 % 2 9.1 % 0
Perm Part Time 16 16 16 16 14 14 -2 -12.5 % -2 -12.5 % 0
Temporary 8 8 8 9 9 9 1 12.5 % 0 0
50 Legislative Finance Division Subcommittee Book
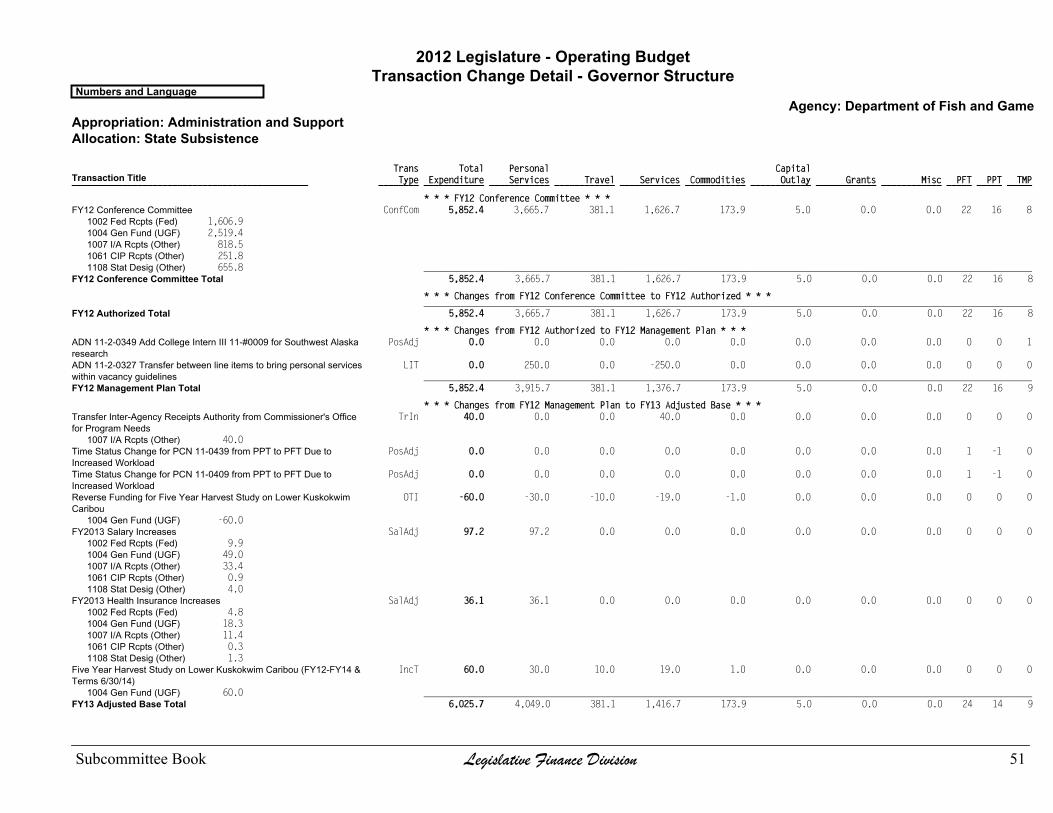
2012 Legislature - Operating BudgetTransaction Change Detail - Governor Structure
Numbers and LanguageAgency: Department of Fish and Game
Appropriation: Administration and SupportAllocation: State Subsistence
Trans Total Personal Capital Type Expenditure Services Travel Services Commodities Outlay Grants Misc PFT PPT TMP ________ ____________ ____________ ____________ ____________ ____________ ____________ ____________ ____________ _____ _____ _____Transaction Title_______________________________________________
* * * FY12 Conference Committee * * * ConfCom 5,852.4 3,665.7 381.1 1,626.7 173.9 5.0 0.0 0.0 22 16 8FY12 Conference Committee
1002 Fed Rcpts (Fed) 1,606.91004 Gen Fund (UGF) 2,519.41007 I/A Rcpts (Other) 818.51061 CIP Rcpts (Other) 251.81108 Stat Desig (Other) 655.8 _________________________________________________________________________________________________________________________
FY12 Conference Committee Total 5,852.4 3,665.7 381.1 1,626.7 173.9 5.0 0.0 0.0 22 16 8
* * * Changes from FY12 Conference Committee to FY12 Authorized * * * _________________________________________________________________________________________________________________________FY12 Authorized Total 5,852.4 3,665.7 381.1 1,626.7 173.9 5.0 0.0 0.0 22 16 8
* * * Changes from FY12 Authorized to FY12 Management Plan * * * PosAdj 0.0 0.0 0.0 0.0 0.0 0.0 0.0 0.0 0 0 1ADN 11-2-0349 Add College Intern III 11-#0009 for Southwest Alaska
research LIT 0.0 250.0 0.0 -250.0 0.0 0.0 0.0 0.0 0 0 0ADN 11-2-0327 Transfer between line items to bring personal services
within vacancy guidelines _________________________________________________________________________________________________________________________FY12 Management Plan Total 5,852.4 3,915.7 381.1 1,376.7 173.9 5.0 0.0 0.0 22 16 9
* * * Changes from FY12 Management Plan to FY13 Adjusted Base * * * TrIn 40.0 0.0 0.0 40.0 0.0 0.0 0.0 0.0 0 0 0Transfer Inter-Agency Receipts Authority from Commissioner's Office
for Program Needs1007 I/A Rcpts (Other) 40.0
PosAdj 0.0 0.0 0.0 0.0 0.0 0.0 0.0 0.0 1 -1 0Time Status Change for PCN 11-0439 from PPT to PFT Due toIncreased Workload
PosAdj 0.0 0.0 0.0 0.0 0.0 0.0 0.0 0.0 1 -1 0Time Status Change for PCN 11-0409 from PPT to PFT Due toIncreased Workload
OTI -60.0 -30.0 -10.0 -19.0 -1.0 0.0 0.0 0.0 0 0 0Reverse Funding for Five Year Harvest Study on Lower KuskokwimCaribou
1004 Gen Fund (UGF) -60.0 SalAdj 97.2 97.2 0.0 0.0 0.0 0.0 0.0 0.0 0 0 0FY2013 Salary Increases
1002 Fed Rcpts (Fed) 9.91004 Gen Fund (UGF) 49.01007 I/A Rcpts (Other) 33.41061 CIP Rcpts (Other) 0.91108 Stat Desig (Other) 4.0
SalAdj 36.1 36.1 0.0 0.0 0.0 0.0 0.0 0.0 0 0 0FY2013 Health Insurance Increases1002 Fed Rcpts (Fed) 4.81004 Gen Fund (UGF) 18.31007 I/A Rcpts (Other) 11.41061 CIP Rcpts (Other) 0.31108 Stat Desig (Other) 1.3
IncT 60.0 30.0 10.0 19.0 1.0 0.0 0.0 0.0 0 0 0Five Year Harvest Study on Lower Kuskokwim Caribou (FY12-FY14 &Terms 6/30/14)
1004 Gen Fund (UGF) 60.0 _________________________________________________________________________________________________________________________FY13 Adjusted Base Total 6,025.7 4,049.0 381.1 1,416.7 173.9 5.0 0.0 0.0 24 14 9
Subcommittee Book Legislative Finance Division 51

2012 Legislature - Operating BudgetTransaction Change Detail - Governor Structure
Numbers and LanguageAgency: Department of Fish and Game
Appropriation: Administration and SupportAllocation: State Subsistence
Trans Total Personal Capital Type Expenditure Services Travel Services Commodities Outlay Grants Misc PFT PPT TMP ________ ____________ ____________ ____________ ____________ ____________ ____________ ____________ ____________ _____ _____ _____Transaction Title_______________________________________________
* * * Changes from FY13 Adjusted Base to FY13 Governor Request * * * Inc 1,100.0 0.0 178.7 913.9 7.4 0.0 0.0 0.0 0 0 0Subsistence Information Update in Proposed Development Sites
1007 I/A Rcpts (Other) 1,100.0 Inc 800.0 0.0 0.0 800.0 0.0 0.0 0.0 0.0 0 0 0Receipts from Other State Agencies
1007 I/A Rcpts (Other) 800.0 Dec -800.0 0.0 0.0 -800.0 0.0 0.0 0.0 0.0 0 0 0Reduce Receipt Authority
1002 Fed Rcpts (Fed) -800.0 Inc 317.1 296.1 15.0 5.0 1.0 0.0 0.0 0.0 0 0 0Harvest Surveys that Identify Subsistence Use Patterns
1004 Gen Fund (UGF) 317.1 _________________________________________________________________________________________________________________________FY13 Governor Request Total 7,442.8 4,345.1 574.8 2,335.6 182.3 5.0 0.0 0.0 24 14 9
52 Legislative Finance Division Subcommittee Book

This Page Intentionally Left Blank
Subcommittee Book Legislative Finance Division 53

2012 Legislature - Operating BudgetAllocation Totals - Governor Structure
Numbers and LanguageAgency: Department of Fish and Game
Appropriation: Administration and SupportAllocation: EVOS Trustee Council
[1] [2] [3] [4] [5] [6] [6] - [1] [6] - [4] [6] - [5] 11Actual 12 CC 12 Auth 12MgtPln Adj Base Gov 11Actual to Gov 12MgtPln to Gov Adj Base to Gov _____________ _____________ _____________ _____________ _____________ _____________ _______________________ _______________________ _______________________
Total 944.8 3,670.7 3,670.7 3,670.7 3,693.2 2,602.7 1,657.9 175.5 % -1,068.0 -29.1 % -1,090.5 -29.5 %
Objects of Expenditure
Personal Services 473.2 952.1 952.1 952.1 974.6 784.1 310.9 65.7 % -168.0 -17.6 % -190.5 -19.5 %
Travel 12.2 215.6 215.6 215.6 215.6 115.6 103.4 847.5 % -100.0 -46.4 % -100.0 -46.4 %
Services 452.3 2,309.7 2,309.7 2,309.7 2,309.7 1,559.7 1,107.4 244.8 % -750.0 -32.5 % -750.0 -32.5 %
Commodities 7.1 118.3 118.3 118.3 118.3 68.3 61.2 862.0 % -50.0 -42.3 % -50.0 -42.3 %
Capital Outlay 0.0 75.0 75.0 75.0 75.0 75.0 75.0 >999 % 0.0 0.0
Grants, Benefits 0.0 0.0 0.0 0.0 0.0 0.0 0.0 0.0 0.0
Miscellaneous 0.0 0.0 0.0 0.0 0.0 0.0 0.0 0.0 0.0
Funding Sources
1002 Fed Rcpts (Fed) 0.0 582.8 582.8 582.8 582.8 582.8 582.8 >999 % 0.0 0.0
1018 EVOS Trust (Other) 944.8 3,087.9 3,087.9 3,087.9 3,110.4 2,019.9 1,075.1 113.8 % -1,068.0 -34.6 % -1,090.5 -35.1 %
Positions
Perm Full Time 9 9 9 9 6 6 -3 -33.3 % -3 -33.3 % 0
Perm Part Time 0 0 0 0 0 0 0 0 0
Temporary 0 0 0 0 0 0 0 0 0
54 Legislative Finance Division Subcommittee Book

2012 Legislature - Operating BudgetTransaction Change Detail - Governor Structure
Numbers and LanguageAgency: Department of Fish and Game
Appropriation: Administration and SupportAllocation: EVOS Trustee Council
Trans Total Personal Capital Type Expenditure Services Travel Services Commodities Outlay Grants Misc PFT PPT TMP ________ ____________ ____________ ____________ ____________ ____________ ____________ ____________ ____________ _____ _____ _____Transaction Title_______________________________________________
* * * FY12 Conference Committee * * * ConfCom 3,670.7 952.1 215.6 2,309.7 118.3 75.0 0.0 0.0 9 0 0FY12 Conference Committee
1002 Fed Rcpts (Fed) 582.81018 EVOS Trust (Other) 3,087.9 _________________________________________________________________________________________________________________________
FY12 Conference Committee Total 3,670.7 952.1 215.6 2,309.7 118.3 75.0 0.0 0.0 9 0 0
* * * Changes from FY12 Conference Committee to FY12 Authorized * * * _________________________________________________________________________________________________________________________FY12 Authorized Total 3,670.7 952.1 215.6 2,309.7 118.3 75.0 0.0 0.0 9 0 0
* * * Changes from FY12 Authorized to FY12 Management Plan * * * _________________________________________________________________________________________________________________________FY12 Management Plan Total 3,670.7 952.1 215.6 2,309.7 118.3 75.0 0.0 0.0 9 0 0
* * * Changes from FY12 Management Plan to FY13 Adjusted Base * * * TrOut 0.0 0.0 0.0 0.0 0.0 0.0 0.0 0.0 -2 0 0Transfer PCNs 11-7701 and 11-7705 to Habitat for Development
Related Activities PosAdj 0.0 0.0 0.0 0.0 0.0 0.0 0.0 0.0 -1 0 0Delete Vacant PFT PCN 11-7007 SalAdj 15.5 15.5 0.0 0.0 0.0 0.0 0.0 0.0 0 0 0FY2013 Salary Increases
1018 EVOS Trust (Other) 15.5 SalAdj 7.0 7.0 0.0 0.0 0.0 0.0 0.0 0.0 0 0 0FY2013 Health Insurance Increases
1018 EVOS Trust (Other) 7.0 _________________________________________________________________________________________________________________________FY13 Adjusted Base Total 3,693.2 974.6 215.6 2,309.7 118.3 75.0 0.0 0.0 6 0 0
* * * Changes from FY13 Adjusted Base to FY13 Governor Request * * * Dec -1,090.5 -190.5 -100.0 -750.0 -50.0 0.0 0.0 0.0 0 0 0Reduce Receipt Authority
1018 EVOS Trust (Other) -1,090.5 _________________________________________________________________________________________________________________________FY13 Governor Request Total 2,602.7 784.1 115.6 1,559.7 68.3 75.0 0.0 0.0 6 0 0
Subcommittee Book Legislative Finance Division 55
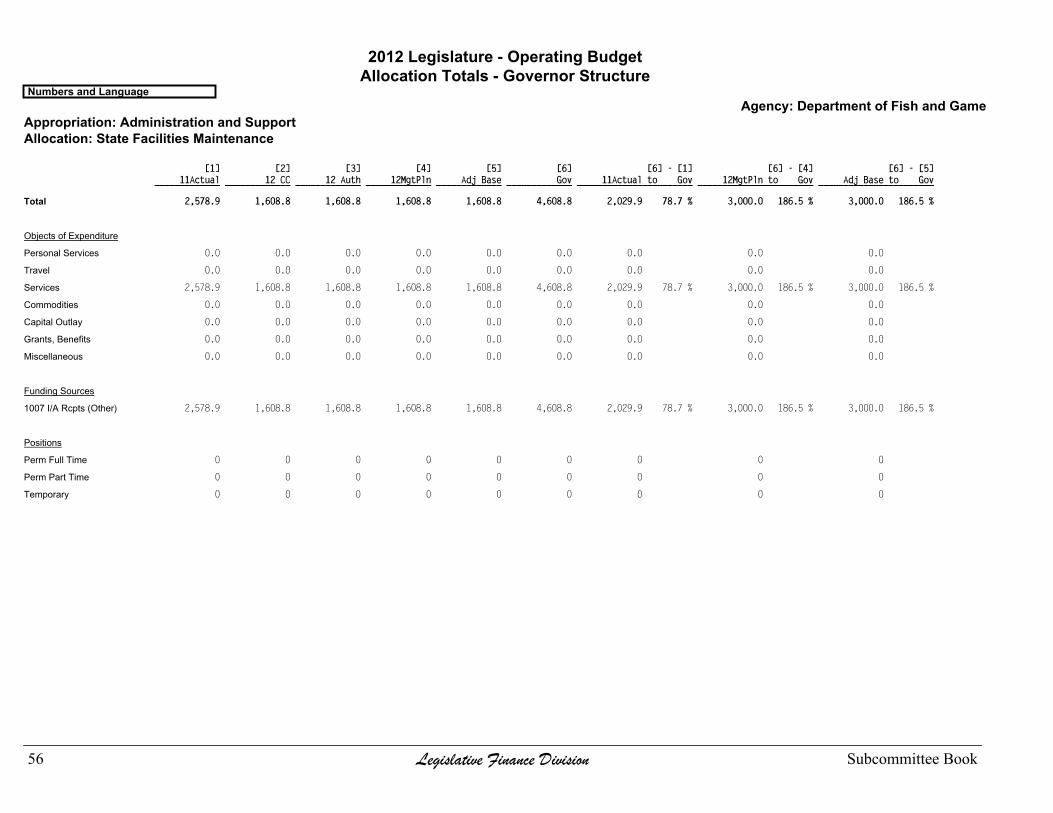
2012 Legislature - Operating BudgetAllocation Totals - Governor Structure
Numbers and LanguageAgency: Department of Fish and Game
Appropriation: Administration and SupportAllocation: State Facilities Maintenance
[1] [2] [3] [4] [5] [6] [6] - [1] [6] - [4] [6] - [5] 11Actual 12 CC 12 Auth 12MgtPln Adj Base Gov 11Actual to Gov 12MgtPln to Gov Adj Base to Gov _____________ _____________ _____________ _____________ _____________ _____________ _______________________ _______________________ _______________________
Total 2,578.9 1,608.8 1,608.8 1,608.8 1,608.8 4,608.8 2,029.9 78.7 % 3,000.0 186.5 % 3,000.0 186.5 %
Objects of Expenditure
Personal Services 0.0 0.0 0.0 0.0 0.0 0.0 0.0 0.0 0.0
Travel 0.0 0.0 0.0 0.0 0.0 0.0 0.0 0.0 0.0
Services 2,578.9 1,608.8 1,608.8 1,608.8 1,608.8 4,608.8 2,029.9 78.7 % 3,000.0 186.5 % 3,000.0 186.5 %
Commodities 0.0 0.0 0.0 0.0 0.0 0.0 0.0 0.0 0.0
Capital Outlay 0.0 0.0 0.0 0.0 0.0 0.0 0.0 0.0 0.0
Grants, Benefits 0.0 0.0 0.0 0.0 0.0 0.0 0.0 0.0 0.0
Miscellaneous 0.0 0.0 0.0 0.0 0.0 0.0 0.0 0.0 0.0
Funding Sources
1007 I/A Rcpts (Other) 2,578.9 1,608.8 1,608.8 1,608.8 1,608.8 4,608.8 2,029.9 78.7 % 3,000.0 186.5 % 3,000.0 186.5 %
Positions
Perm Full Time 0 0 0 0 0 0 0 0 0
Perm Part Time 0 0 0 0 0 0 0 0 0
Temporary 0 0 0 0 0 0 0 0 0
56 Legislative Finance Division Subcommittee Book
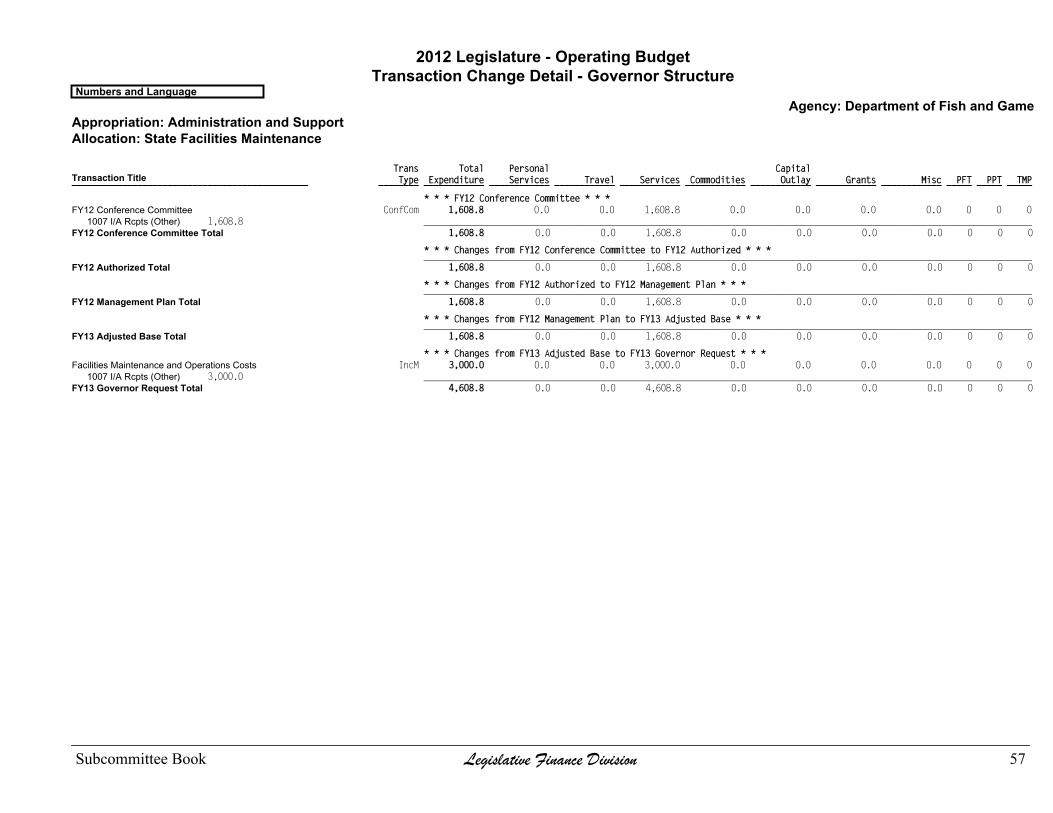
2012 Legislature - Operating BudgetTransaction Change Detail - Governor Structure
Numbers and LanguageAgency: Department of Fish and Game
Appropriation: Administration and SupportAllocation: State Facilities Maintenance
Trans Total Personal Capital Type Expenditure Services Travel Services Commodities Outlay Grants Misc PFT PPT TMP ________ ____________ ____________ ____________ ____________ ____________ ____________ ____________ ____________ _____ _____ _____Transaction Title_______________________________________________
* * * FY12 Conference Committee * * * ConfCom 1,608.8 0.0 0.0 1,608.8 0.0 0.0 0.0 0.0 0 0 0FY12 Conference Committee
1007 I/A Rcpts (Other) 1,608.8 _________________________________________________________________________________________________________________________FY12 Conference Committee Total 1,608.8 0.0 0.0 1,608.8 0.0 0.0 0.0 0.0 0 0 0
* * * Changes from FY12 Conference Committee to FY12 Authorized * * * _________________________________________________________________________________________________________________________FY12 Authorized Total 1,608.8 0.0 0.0 1,608.8 0.0 0.0 0.0 0.0 0 0 0
* * * Changes from FY12 Authorized to FY12 Management Plan * * * _________________________________________________________________________________________________________________________FY12 Management Plan Total 1,608.8 0.0 0.0 1,608.8 0.0 0.0 0.0 0.0 0 0 0
* * * Changes from FY12 Management Plan to FY13 Adjusted Base * * * _________________________________________________________________________________________________________________________FY13 Adjusted Base Total 1,608.8 0.0 0.0 1,608.8 0.0 0.0 0.0 0.0 0 0 0
* * * Changes from FY13 Adjusted Base to FY13 Governor Request * * * IncM 3,000.0 0.0 0.0 3,000.0 0.0 0.0 0.0 0.0 0 0 0Facilities Maintenance and Operations Costs
1007 I/A Rcpts (Other) 3,000.0 _________________________________________________________________________________________________________________________FY13 Governor Request Total 4,608.8 0.0 0.0 4,608.8 0.0 0.0 0.0 0.0 0 0 0
Subcommittee Book Legislative Finance Division 57

2012 Legislature - Operating BudgetAllocation Totals - Governor Structure
Numbers and LanguageAgency: Department of Fish and Game
Appropriation: Administration and SupportAllocation: Fish and Game State Facilities Rent
[1] [2] [3] [4] [5] [6] [6] - [1] [6] - [4] [6] - [5] 11Actual 12 CC 12 Auth 12MgtPln Adj Base Gov 11Actual to Gov 12MgtPln to Gov Adj Base to Gov _____________ _____________ _____________ _____________ _____________ _____________ _______________________ _______________________ _______________________
Total 2,530.0 2,530.0 2,530.0 2,530.0 2,530.0 2,530.0 0.0 0.0 0.0
Objects of Expenditure
Personal Services 0.0 0.0 0.0 0.0 0.0 0.0 0.0 0.0 0.0
Travel 0.0 0.0 0.0 0.0 0.0 0.0 0.0 0.0 0.0
Services 2,530.0 2,530.0 2,530.0 2,530.0 2,530.0 2,530.0 0.0 0.0 0.0
Commodities 0.0 0.0 0.0 0.0 0.0 0.0 0.0 0.0 0.0
Capital Outlay 0.0 0.0 0.0 0.0 0.0 0.0 0.0 0.0 0.0
Grants, Benefits 0.0 0.0 0.0 0.0 0.0 0.0 0.0 0.0 0.0
Miscellaneous 0.0 0.0 0.0 0.0 0.0 0.0 0.0 0.0 0.0
Funding Sources
1004 Gen Fund (UGF) 2,530.0 2,530.0 2,530.0 2,530.0 2,530.0 2,530.0 0.0 0.0 0.0
Positions
Perm Full Time 0 0 0 0 0 0 0 0 0
Perm Part Time 0 0 0 0 0 0 0 0 0
Temporary 0 0 0 0 0 0 0 0 0
58 Legislative Finance Division Subcommittee Book
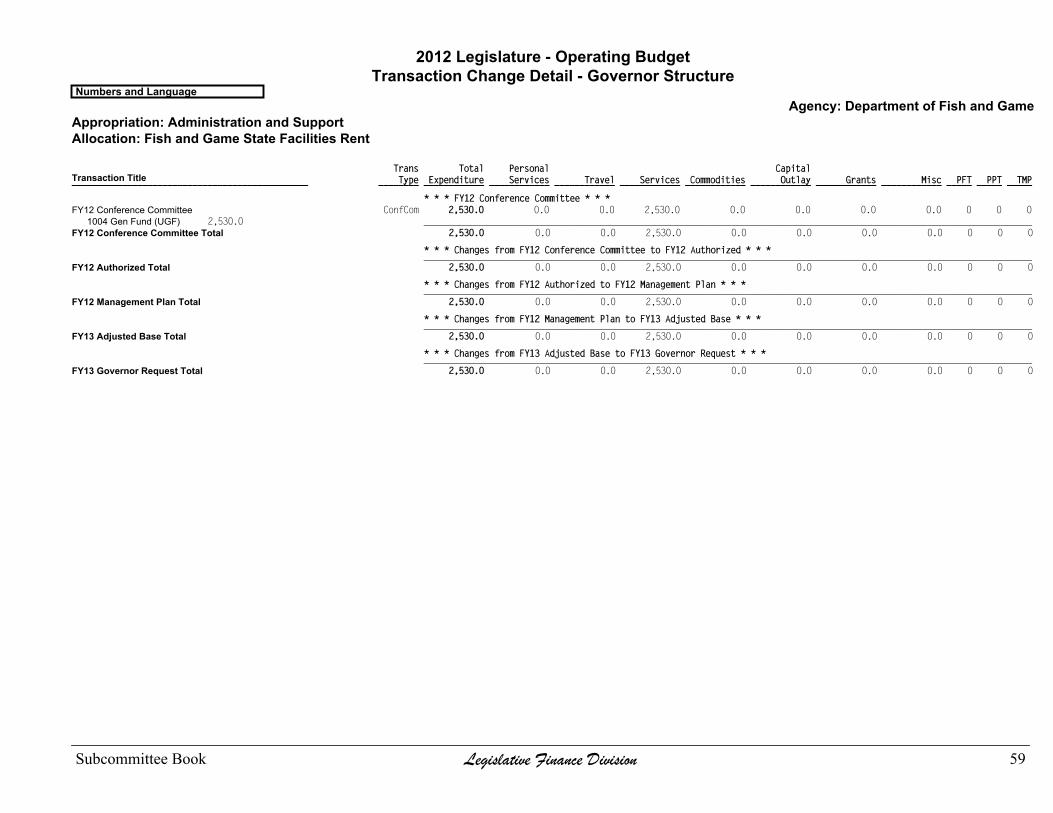
2012 Legislature - Operating BudgetTransaction Change Detail - Governor Structure
Numbers and LanguageAgency: Department of Fish and Game
Appropriation: Administration and SupportAllocation: Fish and Game State Facilities Rent
Trans Total Personal Capital Type Expenditure Services Travel Services Commodities Outlay Grants Misc PFT PPT TMP ________ ____________ ____________ ____________ ____________ ____________ ____________ ____________ ____________ _____ _____ _____Transaction Title_______________________________________________
* * * FY12 Conference Committee * * * ConfCom 2,530.0 0.0 0.0 2,530.0 0.0 0.0 0.0 0.0 0 0 0FY12 Conference Committee
1004 Gen Fund (UGF) 2,530.0 _________________________________________________________________________________________________________________________FY12 Conference Committee Total 2,530.0 0.0 0.0 2,530.0 0.0 0.0 0.0 0.0 0 0 0
* * * Changes from FY12 Conference Committee to FY12 Authorized * * * _________________________________________________________________________________________________________________________FY12 Authorized Total 2,530.0 0.0 0.0 2,530.0 0.0 0.0 0.0 0.0 0 0 0
* * * Changes from FY12 Authorized to FY12 Management Plan * * * _________________________________________________________________________________________________________________________FY12 Management Plan Total 2,530.0 0.0 0.0 2,530.0 0.0 0.0 0.0 0.0 0 0 0
* * * Changes from FY12 Management Plan to FY13 Adjusted Base * * * _________________________________________________________________________________________________________________________FY13 Adjusted Base Total 2,530.0 0.0 0.0 2,530.0 0.0 0.0 0.0 0.0 0 0 0
* * * Changes from FY13 Adjusted Base to FY13 Governor Request * * * _________________________________________________________________________________________________________________________FY13 Governor Request Total 2,530.0 0.0 0.0 2,530.0 0.0 0.0 0.0 0.0 0 0 0
Subcommittee Book Legislative Finance Division 59
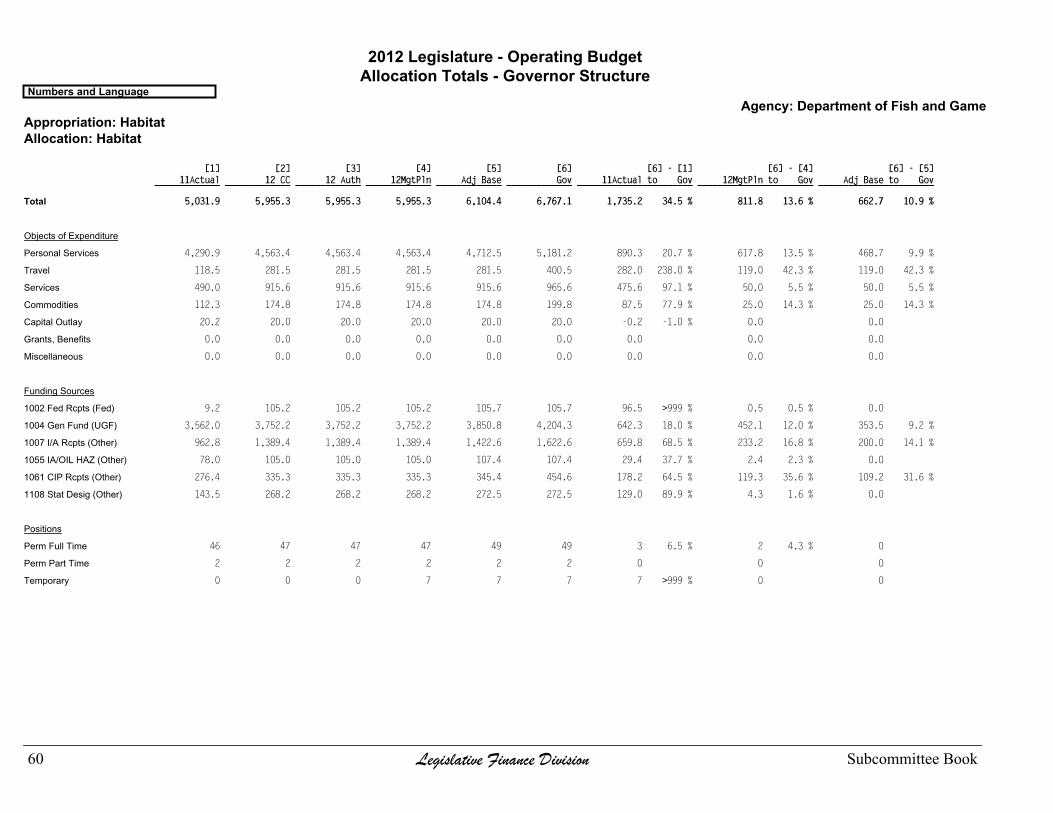
2012 Legislature - Operating BudgetAllocation Totals - Governor Structure
Numbers and LanguageAgency: Department of Fish and Game
Appropriation: HabitatAllocation: Habitat
[1] [2] [3] [4] [5] [6] [6] - [1] [6] - [4] [6] - [5] 11Actual 12 CC 12 Auth 12MgtPln Adj Base Gov 11Actual to Gov 12MgtPln to Gov Adj Base to Gov _____________ _____________ _____________ _____________ _____________ _____________ _______________________ _______________________ _______________________
Total 5,031.9 5,955.3 5,955.3 5,955.3 6,104.4 6,767.1 1,735.2 34.5 % 811.8 13.6 % 662.7 10.9 %
Objects of Expenditure
Personal Services 4,290.9 4,563.4 4,563.4 4,563.4 4,712.5 5,181.2 890.3 20.7 % 617.8 13.5 % 468.7 9.9 %
Travel 118.5 281.5 281.5 281.5 281.5 400.5 282.0 238.0 % 119.0 42.3 % 119.0 42.3 %
Services 490.0 915.6 915.6 915.6 915.6 965.6 475.6 97.1 % 50.0 5.5 % 50.0 5.5 %
Commodities 112.3 174.8 174.8 174.8 174.8 199.8 87.5 77.9 % 25.0 14.3 % 25.0 14.3 %
Capital Outlay 20.2 20.0 20.0 20.0 20.0 20.0 -0.2 -1.0 % 0.0 0.0
Grants, Benefits 0.0 0.0 0.0 0.0 0.0 0.0 0.0 0.0 0.0
Miscellaneous 0.0 0.0 0.0 0.0 0.0 0.0 0.0 0.0 0.0
Funding Sources
1002 Fed Rcpts (Fed) 9.2 105.2 105.2 105.2 105.7 105.7 96.5 >999 % 0.5 0.5 % 0.0
1004 Gen Fund (UGF) 3,562.0 3,752.2 3,752.2 3,752.2 3,850.8 4,204.3 642.3 18.0 % 452.1 12.0 % 353.5 9.2 %
1007 I/A Rcpts (Other) 962.8 1,389.4 1,389.4 1,389.4 1,422.6 1,622.6 659.8 68.5 % 233.2 16.8 % 200.0 14.1 %
1055 IA/OIL HAZ (Other) 78.0 105.0 105.0 105.0 107.4 107.4 29.4 37.7 % 2.4 2.3 % 0.0
1061 CIP Rcpts (Other) 276.4 335.3 335.3 335.3 345.4 454.6 178.2 64.5 % 119.3 35.6 % 109.2 31.6 %
1108 Stat Desig (Other) 143.5 268.2 268.2 268.2 272.5 272.5 129.0 89.9 % 4.3 1.6 % 0.0
Positions
Perm Full Time 46 47 47 47 49 49 3 6.5 % 2 4.3 % 0
Perm Part Time 2 2 2 2 2 2 0 0 0
Temporary 0 0 0 7 7 7 7 >999 % 0 0
60 Legislative Finance Division Subcommittee Book

2012 Legislature - Operating BudgetTransaction Change Detail - Governor Structure
Numbers and LanguageAgency: Department of Fish and Game
Appropriation: HabitatAllocation: Habitat
Trans Total Personal Capital Type Expenditure Services Travel Services Commodities Outlay Grants Misc PFT PPT TMP ________ ____________ ____________ ____________ ____________ ____________ ____________ ____________ ____________ _____ _____ _____Transaction Title_______________________________________________
* * * FY12 Conference Committee * * * ConfCom 5,955.3 4,563.4 281.5 915.6 174.8 20.0 0.0 0.0 47 2 0FY12 Conference Committee
1002 Fed Rcpts (Fed) 105.21004 Gen Fund (UGF) 3,752.21007 I/A Rcpts (Other) 1,389.41055 IA/OIL HAZ (Other) 105.01061 CIP Rcpts (Other) 335.31108 Stat Desig (Other) 268.2 _________________________________________________________________________________________________________________________
FY12 Conference Committee Total 5,955.3 4,563.4 281.5 915.6 174.8 20.0 0.0 0.0 47 2 0
* * * Changes from FY12 Conference Committee to FY12 Authorized * * * _________________________________________________________________________________________________________________________FY12 Authorized Total 5,955.3 4,563.4 281.5 915.6 174.8 20.0 0.0 0.0 47 2 0
* * * Changes from FY12 Authorized to FY12 Management Plan * * * PosAdj 0.0 0.0 0.0 0.0 0.0 0.0 0.0 0.0 0 0 2ADN 11-1-0571 LTNP PCN's 11-N11103 and 11-N11104 to monitor
aquatic resources near the Kensington Mine PosAdj 0.0 0.0 0.0 0.0 0.0 0.0 0.0 0.0 0 0 1ADN 11-1-0541 LTNP PCN 11-N11107 to document anadromous
waters in Juneau, Haines and Sitka PosAdj 0.0 0.0 0.0 0.0 0.0 0.0 0.0 0.0 0 0 2ADN 11-2-0293 College Intern LTNP PCNs 11-IN1110 and 11-IN1111
to assist with surveys and data collection projects PosAdj 0.0 0.0 0.0 0.0 0.0 0.0 0.0 0.0 0 0 2ADN 11-2-0292 College Intern LTNP PCNs 11-IN1108 and 11-IN1109
to assist with mining biomonitoring work _________________________________________________________________________________________________________________________FY12 Management Plan Total 5,955.3 4,563.4 281.5 915.6 174.8 20.0 0.0 0.0 47 2 7
* * * Changes from FY12 Management Plan to FY13 Adjusted Base * * * TrIn 0.0 0.0 0.0 0.0 0.0 0.0 0.0 0.0 2 0 0Transfer PCNs 11-7701 and 11-7705 from EVOS for Development
Related Activities SalAdj 104.5 104.5 0.0 0.0 0.0 0.0 0.0 0.0 0 0 0FY2013 Salary Increases
1002 Fed Rcpts (Fed) 0.31004 Gen Fund (UGF) 69.21007 I/A Rcpts (Other) 23.41055 IA/OIL HAZ (Other) 1.61061 CIP Rcpts (Other) 7.01108 Stat Desig (Other) 3.0
SalAdj 44.6 44.6 0.0 0.0 0.0 0.0 0.0 0.0 0 0 0FY2013 Health Insurance Increases1002 Fed Rcpts (Fed) 0.21004 Gen Fund (UGF) 29.41007 I/A Rcpts (Other) 9.81055 IA/OIL HAZ (Other) 0.81061 CIP Rcpts (Other) 3.11108 Stat Desig (Other) 1.3 _________________________________________________________________________________________________________________________
FY13 Adjusted Base Total 6,104.4 4,712.5 281.5 915.6 174.8 20.0 0.0 0.0 49 2 7
* * * Changes from FY13 Adjusted Base to FY13 Governor Request * * * Inc 65.0 35.0 10.0 10.0 10.0 0.0 0.0 0.0 0 0 0Permit Streamlining and Reform
1004 Gen Fund (UGF) 65.0 Inc 200.0 125.0 30.0 30.0 15.0 0.0 0.0 0.0 0 0 0Oil and Gas Related Right-of-Way Work
1007 I/A Rcpts (Other) 200.0
Subcommittee Book Legislative Finance Division 61
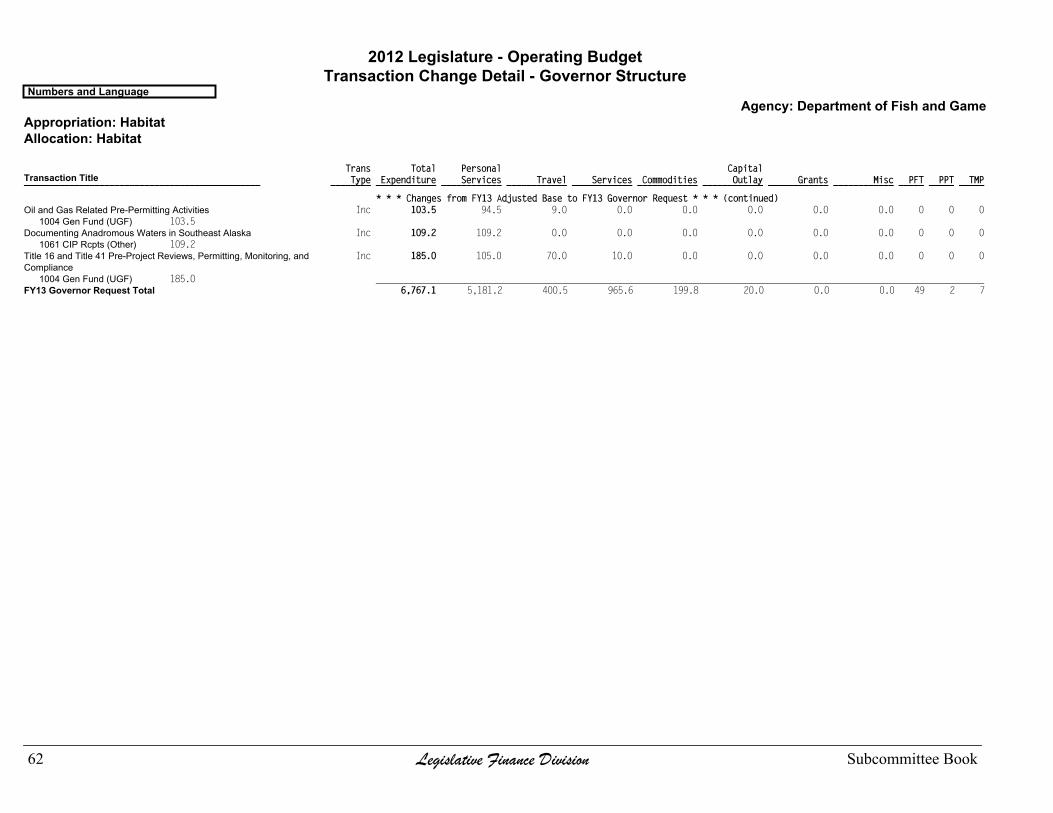
2012 Legislature - Operating BudgetTransaction Change Detail - Governor Structure
Numbers and LanguageAgency: Department of Fish and Game
Appropriation: HabitatAllocation: Habitat
Trans Total Personal Capital Type Expenditure Services Travel Services Commodities Outlay Grants Misc PFT PPT TMP ________ ____________ ____________ ____________ ____________ ____________ ____________ ____________ ____________ _____ _____ _____Transaction Title_______________________________________________
* * * Changes from FY13 Adjusted Base to FY13 Governor Request * * * (continued) Inc 103.5 94.5 9.0 0.0 0.0 0.0 0.0 0.0 0 0 0Oil and Gas Related Pre-Permitting Activities
1004 Gen Fund (UGF) 103.5 Inc 109.2 109.2 0.0 0.0 0.0 0.0 0.0 0.0 0 0 0Documenting Anadromous Waters in Southeast Alaska
1061 CIP Rcpts (Other) 109.2 Inc 185.0 105.0 70.0 10.0 0.0 0.0 0.0 0.0 0 0 0Title 16 and Title 41 Pre-Project Reviews, Permitting, Monitoring, and
Compliance1004 Gen Fund (UGF) 185.0 _________________________________________________________________________________________________________________________
FY13 Governor Request Total 6,767.1 5,181.2 400.5 965.6 199.8 20.0 0.0 0.0 49 2 7
62 Legislative Finance Division Subcommittee Book
This Page Intentionally Left Blank
Subcommittee Book Legislative Finance Division 63
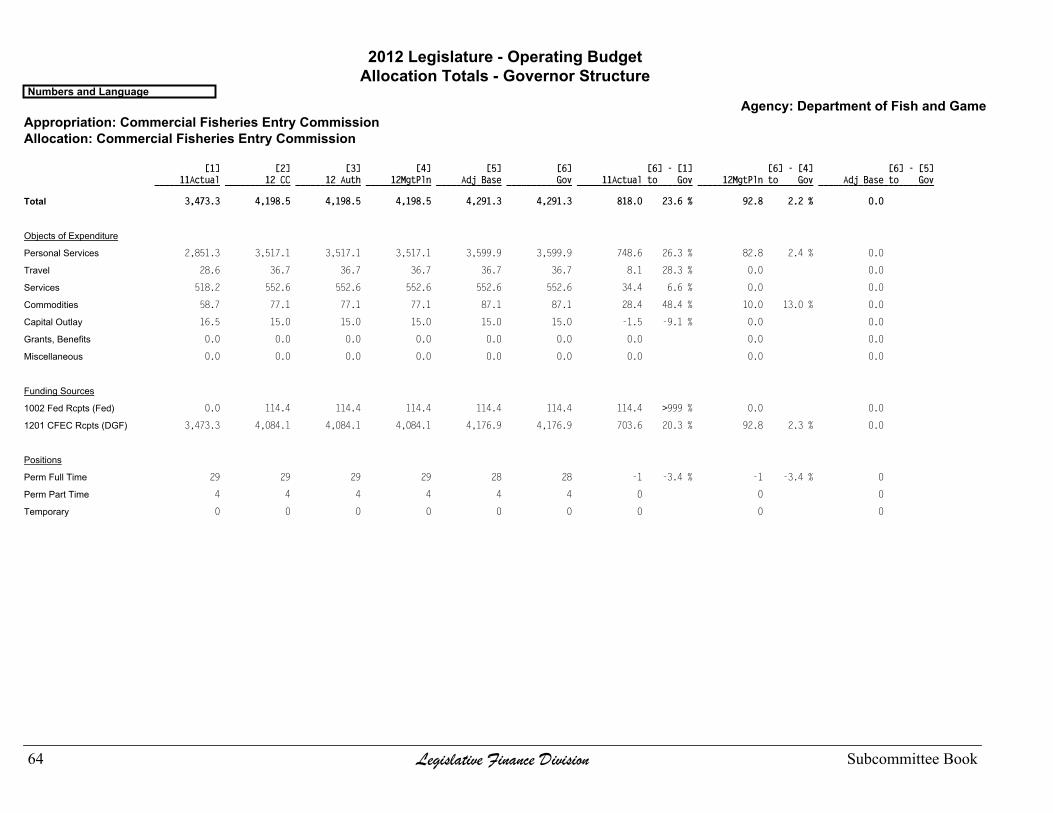
2012 Legislature - Operating BudgetAllocation Totals - Governor Structure
Numbers and LanguageAgency: Department of Fish and Game
Appropriation: Commercial Fisheries Entry CommissionAllocation: Commercial Fisheries Entry Commission
[1] [2] [3] [4] [5] [6] [6] - [1] [6] - [4] [6] - [5] 11Actual 12 CC 12 Auth 12MgtPln Adj Base Gov 11Actual to Gov 12MgtPln to Gov Adj Base to Gov _____________ _____________ _____________ _____________ _____________ _____________ _______________________ _______________________ _______________________
Total 3,473.3 4,198.5 4,198.5 4,198.5 4,291.3 4,291.3 818.0 23.6 % 92.8 2.2 % 0.0
Objects of Expenditure
Personal Services 2,851.3 3,517.1 3,517.1 3,517.1 3,599.9 3,599.9 748.6 26.3 % 82.8 2.4 % 0.0
Travel 28.6 36.7 36.7 36.7 36.7 36.7 8.1 28.3 % 0.0 0.0
Services 518.2 552.6 552.6 552.6 552.6 552.6 34.4 6.6 % 0.0 0.0
Commodities 58.7 77.1 77.1 77.1 87.1 87.1 28.4 48.4 % 10.0 13.0 % 0.0
Capital Outlay 16.5 15.0 15.0 15.0 15.0 15.0 -1.5 -9.1 % 0.0 0.0
Grants, Benefits 0.0 0.0 0.0 0.0 0.0 0.0 0.0 0.0 0.0
Miscellaneous 0.0 0.0 0.0 0.0 0.0 0.0 0.0 0.0 0.0
Funding Sources
1002 Fed Rcpts (Fed) 0.0 114.4 114.4 114.4 114.4 114.4 114.4 >999 % 0.0 0.0
1201 CFEC Rcpts (DGF) 3,473.3 4,084.1 4,084.1 4,084.1 4,176.9 4,176.9 703.6 20.3 % 92.8 2.3 % 0.0
Positions
Perm Full Time 29 29 29 29 28 28 -1 -3.4 % -1 -3.4 % 0
Perm Part Time 4 4 4 4 4 4 0 0 0
Temporary 0 0 0 0 0 0 0 0 0
64 Legislative Finance Division Subcommittee Book

2012 Legislature - Operating BudgetTransaction Change Detail - Governor Structure
Numbers and LanguageAgency: Department of Fish and Game
Appropriation: Commercial Fisheries Entry CommissionAllocation: Commercial Fisheries Entry Commission
Trans Total Personal Capital Type Expenditure Services Travel Services Commodities Outlay Grants Misc PFT PPT TMP ________ ____________ ____________ ____________ ____________ ____________ ____________ ____________ ____________ _____ _____ _____Transaction Title_______________________________________________
* * * FY12 Conference Committee * * * ConfCom 4,198.5 3,517.1 36.7 552.6 77.1 15.0 0.0 0.0 29 4 0FY12 Conference Committee
1002 Fed Rcpts (Fed) 114.41201 CFEC Rcpts (DGF) 4,084.1 _________________________________________________________________________________________________________________________
FY12 Conference Committee Total 4,198.5 3,517.1 36.7 552.6 77.1 15.0 0.0 0.0 29 4 0
* * * Changes from FY12 Conference Committee to FY12 Authorized * * * _________________________________________________________________________________________________________________________FY12 Authorized Total 4,198.5 3,517.1 36.7 552.6 77.1 15.0 0.0 0.0 29 4 0
* * * Changes from FY12 Authorized to FY12 Management Plan * * * _________________________________________________________________________________________________________________________FY12 Management Plan Total 4,198.5 3,517.1 36.7 552.6 77.1 15.0 0.0 0.0 29 4 0
* * * Changes from FY12 Management Plan to FY13 Adjusted Base * * * LIT 0.0 -10.0 0.0 0.0 10.0 0.0 0.0 0.0 0 0 0Align Authority to Comply with Vacancy Factor Guidelines SalAdj 62.1 62.1 0.0 0.0 0.0 0.0 0.0 0.0 0 0 0FY2013 Salary Increases
1201 CFEC Rcpts (DGF) 62.1 SalAdj 30.7 30.7 0.0 0.0 0.0 0.0 0.0 0.0 0 0 0FY2013 Health Insurance Increases
1201 CFEC Rcpts (DGF) 30.7 PosAdj 0.0 0.0 0.0 0.0 0.0 0.0 0.0 0.0 -1 0 0Delete Vacant PFT PCN 11-3006 _________________________________________________________________________________________________________________________
FY13 Adjusted Base Total 4,291.3 3,599.9 36.7 552.6 87.1 15.0 0.0 0.0 28 4 0
* * * Changes from FY13 Adjusted Base to FY13 Governor Request * * * _________________________________________________________________________________________________________________________FY13 Governor Request Total 4,291.3 3,599.9 36.7 552.6 87.1 15.0 0.0 0.0 28 4 0
Subcommittee Book Legislative Finance Division 65
This Page Intentionally Left Blank

Transaction Type Definitions
11Act Prior year actual expenditures. Transactions are received from OMB and reviewed (and possibly edited) by Legislative Finance.11Final Prior year final budget authorization.ATrIn Inter-Agency Transfer Into an agency/allocation. Totals for ATrIn and ATrOut net zero statewide.ATrOut Inter-Agency Transfer Out of an agency/allocation. Totals for ATrIn and ATrOut net zero statewide.CarryFwd Authorization brought forward into the current year's budget (FY 2013).Cntngt ContingentConfCom FY 2012 Conference Committee.Dec Decrement (reduction) of funds (may include positions).FisNot Fiscal Note appropriations for legislation effective in FY 2013.FisNot12 Fiscal Note appropriations for legislation effective in FY 2012.FndChg Net Zero Fund Source Change.Inc Increment (addition) of funds (may include positions).IncM Increment (addition) of funds that maintains the level of services provided in the prior fiscal year.IncOTI One-time increment (addition) of funds (may include positions) that will be removed from the base budget in the next fiscal year.IncT A temporary increment (IncT) adds money to the base for a specified period. Removal from the base before the termination year requires legislative
action. Lang Appropriations in the language sections of the operating budget bill(s); generally treated as one-time increments.LangCC Appropriations in the language sections of the operating budget bill(s) during the prior year Conference Committee.LIT Line Item Transfer moves funding between line items to reflect planned expenditures.MisAdj Miscellaneous adjustment is typically used to make adjustments that do not meet the definitions of other transaction types.MultiYr Appropriations affecting multiple fiscal years. (The entire appropriation is attributed to the first fiscal year in which the money may be spent).OTI One Time Item identifies a reduction made to an agency's base when FY 2012 funding will not be available for the current budget cycle (FY 2013).PosAdj Position increases or decreases with no funding change.ReAprop Identifies reappropriations of prior appropriations.RPL Revised Program - Legislative are budget additions reviewed/approved by the Legislative Budget and Audit Committee.SalAdj Identifies Salary and Benefits adjustments and COLA distributions.Special Special appropriations are operating appropriations made in bills other than the operating budget bill.Suppl Supplemental appropriations are effective in the prior fiscal year (FY 2012) for use in the prior fiscal year.TrIn Transfers Into an allocation from another allocation within an agency. Totals for TrIn and TrOut net zero department-wide.TrOut Transfers Out of an allocation to another allocation within an agency. Totals for TrIn and TrOut net zero department-wide.Unalloc Legislative unallocated reductions or additions to be spread per agency discretion.Veto Transactions reflecting vetoed appropriations.