fiscal policies to fight malnutrition
TRANSCRIPT

ISSN
252
1-18
38
z
Fiscal policies to fight malnutritionAn analysis of the sugar-sweetened beverages tax in Catalonia, Spain
April 2021
FAO AGRICULTURAL DEVELOPMENT ECONOMICS WORKING PAPER 21-05


Food and Agriculture Organization of the United Nations
Rome, 2021
Fiscal policies to fight malnutrition: an analysis of
the sugar-sweetened beverages tax in Catalonia,
Spain
Eléonore Dal Economist, Agrifood Economics Division, FAO
Cristian Morales Senior Economist, Agrifood Economics Division, FAO
Arturo Angulo Food Security and Nutrition Expert, Agrifood Economics Division, FAO
José Luis Yagüe
GESPLAN, E.T.S.I Agronómica, Alimentaria y de Biosistemas, Universidad Politécnica de Madrid (UPM)

Required citation: Dal, E., Morales, C., Angulo, A. & Yagüe, J-L. 2021. Fiscal policies to fight malnutrition – An analysis of the sugar-sweetened beverages tax in Catalonia, Spain. FAO Agricultural Development Economics Working Paper 21-05. Rome, FAO. https://doi.org/10.4060/cb4176en
The designations employed and the presentation of material in this information product do not imply the expression of any opinion whatsoever on the part of the Food and Agriculture Organization of the United Nations (FAO) concerning the legal or development status of any country, territory, city or area or of its authorities, or concerning the delimitation of its frontiers or boundaries. The mention of specific companies or products of manufacturers, whether or not these have been patented, does not imply that these have been endorsed or recommended by FAO in preference to others of a similar nature that are not mentioned.
The views expressed in this information product are those of the author(s) and do not necessarily reflect the views or policies of FAO.
ISSN 2664-5785 [Print]
ISSN 2521-1838 [Online]
ISBN 978-92-5-134239-8
© FAO, 2021
Some rights reserved. This work is made available under the Creative Commons Attribution-NonCommercial-ShareAlike 3.0 IGO licence (CC BY-NC-SA 3.0 IGO; https://creativecommons.org/licenses/by-nc-sa/3.0/igo/legalcode).
Under the terms of this licence, this work may be copied, redistributed and adapted for non-commercial purposes, provided that the work is appropriately cited. In any use of this work, there should be no suggestion that FAO endorses any specific organization, products or services. The use of the FAO logo is not permitted. If the work is adapted, then it must be licensed under the same or equivalent Creative Commons licence. If a translation of this work is created, it must include the following disclaimer along with the required citation: “This translation was not created by the Food and Agriculture Organization of the United Nations (FAO). FAO is not responsible for the content or accuracy of this translation. The original [Language] edition shall be the authoritative edition.”
Disputes arising under the licence that cannot be settled amicably will be resolved by mediation and arbitration as described in Article 8 of the licence except as otherwise provided herein. The applicable mediation rules will be the mediation rules of the World Intellectual Property Organization http://www.wipo.int/amc/en/mediation/rules and any arbitration will be conducted in accordance with the Arbitration Rules of the United Nations Commission on International Trade Law (UNCITRAL).
Third-party materials. Users wishing to reuse material from this work that is attributed to a third party, such as tables, figures or images, are responsible for determining whether permission is needed for that reuse and for obtaining permission from the copyright holder. The risk of claims resulting from infringement of any third-party-owned component in the work rests solely with the user.
Sales, rights and licensing. FAO information products are available on the FAO website (www.fao.org/publications) and can be purchased through [email protected]. Requests for commercial use should be submitted via: www.fao.org/contact-us/licence-request. Queries regarding rights and licensing should be submitted to: [email protected].

iii
Contents
Abstract .................................................................................................................................. v
Acknowledgements ............................................................................................................... vi
1 Introduction ..................................................................................................................... 1
2 Background ..................................................................................................................... 3
3 Methodology .................................................................................................................... 5
4 Results ............................................................................................................................ 9
5 Discussion ..................................................................................................................... 15
6 Conclusion .................................................................................................................... 19
References ........................................................................................................................... 20
Annex 1. Survey ................................................................................................................... 23

iv
Tables
Table 1. Socio-demographic characteristics ........................................................................ 9 Table 2. Model for the reduction in SSBs consumption obtained by binary logistic
regression ............................................................................................................ 11 Table 3. Significant associations between explanatory variables and socio-
demographic characteristics ................................................................................ 12 Table 4. Awareness of the price increase, recent knowledge of SSBs’ health risks and
socio-demographic characteristics ....................................................................... 13 Table 5. Model for the recent knowledge of SSBs’ health risks obtained by binary
logistic regression ................................................................................................ 13
Figures
Figure 1. Relations between the questions of the survey, the variables used in the analysis and the study objective ............................................................................ 7
Figure 2. Respondent’s declared motives for reducing consumption of SSBs ................... 10

v
Abstract
This paper analyses the potential signalling effect from a tax on sugar-sweetened beverages (SSBs) that Catalonia introduced in May 2017, with a view to understand the ways in which, and the extent to which taxes discourage SSBs consumption. A questionnaire was distributed in November 2019 in two neighbourhoods from Barcelona with different mean income levels. We explored associations between variables constructed from the questionnaire and declared reduced consumption. Our goal was to disentangle the different effects from the price increase itself and from the signalling effect of the price increase on the reduction of SSBs consumption, analyzing results that account for socio-demographic characteristics, in order to provide policy recommendations. Respondents mainly declared that a higher awareness of SSBs’ health risks made them curb their consumption of SSBs (98.5 percent). Only 10.6 percent of them declared that the new price was considered high enough to have discouraged their SSBs consumption. Nevertheless, the tax in Catalonia seems to have had a signalling effect through the increase in prices (100 percent pass-through of the law), and much less through the awareness of the existence of the tax. The fact that people had noticed the increase in prices is associated to a recent knowledge of SSBs’ health risks, which is itself related to reduced consumption in the sample. Implementing higher and more salient SSBs taxes on the shelves, and having public campaigns making sure taxes are known among the entire population, aiming at behavioural changes among young populations, would enhance their signalling effect.
Keywords: SSBs tax; Catalonia; signalling effect; food policies.
JEL codes: D12, H3, I18.

vi
Acknowledgements
This paper was prepared under the overall responsibility of Cristian Morales, Senior Economist at the Agrifood Economics Division (ESA), FAO and Eléonore Dal, Economist at the Agrifood Economics Division (ESA), FAO. We would like to thank the Polytechnic University of Madrid for their support in this research work.
The authors are grateful to Marco V. Sánchez, Deputy Director (ESA, FAO), and to the blind reviewer who both revised very carefully this manuscript.
A special thanks is extended to Daniela Verona, Publishing Coordinator (ESA, FAO), for her editorial and layout support, as well as publishing coordination.
1
1 Introduction
According to the Food and Agriculture Organization of the United Nations (FAO) report The State of Food Security and Nutrition in the World 2020, obesity and non-communicable diseases (NCDs)1 are rising worldwide (FAO, IFAD, UNICEF, WFP and WHO, 2020). NCDs were proved to be related to unhealthy diets and obesity. They represent the first cause of death in the world, generating costly healthcare costs in the affected countries. Conclusions concerning the consumption of sugar-sweetened beverages (SSBs) that are relevant to these trends have been established. Several scientific studies point to SSBs as driving obesity, diabetes, heart diseases, and more generally NCDs (Park and Yu, 2019; Mullee et al., 2019; Chazelas et al., 2019, Basu et al., 2013).
At the international level, concerns about the rising number of NCDs and obesity rates have been raised, leading governments to explore a wide range of measures to curb the tendency and improve dietary patterns. Among the main solutions discussed, implemented and advocated throughout the world, we can highlight the following ones: prohibition of misleading advertising (especially directed to children), public campaigns about healthy diets, nutrition education, labelling, promotion of physical activity, sustainable and healthy public procurement, social policies, improved access to healthy food, promotion of agroecology and local food chains, and taxes on specific products or nutrients like fat, salt and/or sugar.
Taxation has been increasingly proposed by governments as a means to reduce the intake of SSBs and to trigger reformulation, since voluntary initiatives have been failing over the years. International organizations like the WHO and FAO (UNSCN, 2017) advocate for this kind of instrument to tackle problems related to obesity (WHO, 2016a). Indeed, those problems are noted in the global 2030 Agenda for Sustainable Development that includes 17 Sustainable Development Goals (SDGs), and more precisely by the central focus of target 2.2 of SDG 2 “Zero Hunger” which seeks to eradicate all forms of malnutrition. Nevertheless, taxes on SSBs also face the fierce opposition of the industry which mostly uses unfounded arguments to deter their implementation (Le Bodo et al., 2019; Royo-Bordonada et al., 2019).
This policy option is still debated today because of its potential negative economic effects, including, inter alia, job losses in the SSBs’ industry, regressivity of the taxation and substitutions effects towards other sugary food products (Bascuñán and Cuadrado, 2017). Questions keep on arising as the implementation of this policy does not date back to long ago. Out of more than 51 national governments, states or cities with sugar taxes on SSBs, 37 have been introduced since 2015 (IFPRI, 2019). Therefore, the impacts of taxation at various levels (consumption, health, food systems, industry and economy as a whole, etc.) are still unclear and understudied (Cornelsen and Smith, 2018). Nevertheless, there is a flourishing literature about positive impacts of SSBs taxes: reductions in consumption and sales (Teng et al., 2019). Evidence of success of these taxes has spread all over the world, with Hungary, Mexico and Berkeley, United States providing the most emblematic cases (WHO, 2015a; Redondo et al., 2018). The higher price of SSBs induced by a tax is supposed to lead to a drop in sales and consumption, while generating revenues that governments can use for health programmes. In addition, the tax may help raise awareness on the risks of SSBs consumption, which this paper regards as
1 The main types of NCDs are cardiovascular diseases (like heart attacks and stroke), cancers, chronic respiratory diseases (such as chronic obstructive pulmonary disease and asthma) and diabetes (WHO, 2020).

2
the signalling effect.2 There is a need to enhance our understanding of the purchasing behaviour of people and of their motivations behind their buying a SSB (O’Connor, 2018). More specifically, it is important to disentangle the signalling effect of the tax from the price one. This means studying more in detail how the public debate around the introduction of a SSBs tax and the potential salience of the tax in the supermarkets and other purchasing sites can both influence buying patterns (Cornelsen and Smith, 2018; Cawley et al., 2019).3
Following the worldwide trend, Catalonia, an autonomous region of Spain, implemented an excise tax4 on SSBs in May 2017. This tax does not apply to artificially sweetened beverages (diet drinks), 100 percent fruit juices and drinkable yoghurts. It gathers interesting features like an obligatory 100 percent pass-through to consumers and two levels of taxation according to the drink’s content of sugar (called “tiers”). It amounts to 8 cents per litre for drinks containing between 5 to 8 g of sugar per 100 ml, and to 12 cents per litre for drinks containing more than 8 g of sugar per 100 ml.
The only study that expressly intended to study the signalling effect of a real world SSBs tax is from Álvarez-Sánchez et al. (2018) about the SSBs tax in Mexico. They concluded that people who were aware of the tax, were less likely to consume SSBs and more likely to reduce their consumption. It is essential to replicate this kind of analysis and go deeper into the topic for other SSBs taxes in the world, since the country’s state of development, culture, and the specific ongoing context in which the tax is introduced (if there has been a public campaign about it or not for instance) may influence its impact. Because this is important for governments to get clear evidence from the scientific field of taxation effects in order to back up effectively the implementation of tax related policies to fight obesity and malnutrition, the aim of this study is three-fold:
1. To disentangle the different influences of price, signalling effect of the tax and previous awareness of SSBs’ health risks on the reduction of SSBs consumption in Catalonia, Spain.
2. To develop such analysis while recognizing the important role of socio-demographic characteristics (income level, age, consumption of SSBs, gender).
3. To present policy implications grounded on the findings for future tax implementations, defining elements of a successful design for SSBs taxes and making broader but highly related policy recommendations to fight malnutrition.
The results of this study could provide valuable guidance for the Spanish Ministries of Health and Finance so as to implement necessary changes related to SSBs taxation, aligning existing legislation at national level with the overall successful initiative worldwide of taxing SSBs. The results may also be useful for those countries in the world where governments are willing and with political space to introduce this type of tax, particularly if one considers that – with globalization and web connectivity growing – consumer behaviour is turning more homogenous across countries, particularly across those of similar development.
2 The signalling effect of a tax is its capacity to raise awareness about the risks associated with the product that is being levied and to contribute to excluding it from being part of the regular consumption patterns of society. 3 A tax is “salient” when it has helped call attention on the price increase for a product and/or has been signalled to the consumer by the seller (on the shelves or on the receipt). A tax known by the population can generally be considered as a salient tax. 4 An excise tax is any duty on manufactured goods. In this case, it is paid by the producer or seller to the authorities.

3
2 Background
2.1 NCDs,obesityandhealthcostsUnder current food consumption patterns, diet-related health costs linked to mortality and non-communicable diseases are projected to exceed USD 1.3 trillion per year by 2030. On the other hand, the diet-related social cost of greenhouse gas emissions associated with current dietary patterns is estimated to be more than USD 1.7 trillion per year by 2030 (FAO, 2020). In 2016, more than 70 percent of global deaths (40.5 million out of 56.9 million) were due to non-communicable diseases (WHO, 2016b). European countries are no exception to this problem. In Spain, the prevalence of obesity in the adult population has reached 23.8 percent in 2016 (FAO, 2020). In 2017, almost one third of Spanish children aged between two and seventeen years old were overweighed, and one out of ten was obese (Royo-Bordonada et al., 2019).
2.2 SugarandSSBsThe excessive consumption of added sugar and sugar in general, largely found in SSBs, contributes to the rise in obesity and NCDs. Added sugar is contained in many different food products, but various studies have demonstrated that a major consumption pathway, if not the first one, is still explained by sugary-sweetened beverages (WHO, 2015b; Popkin and Hawkes, 2016). In Spain, the ANIBES study5 published in 2017, which uses data from 2015, indicates that the sugar daily consumption of the Spanish population is about 71.5 g, almost three times the 25 g advised intake from the World Health Organization (WHO, 2015b). According to the same study, sugary-sweetened beverages (SSBs) represent 22.5 percent of the total free sugar daily intake. Overall, this is the first source of added sugar intake in the diet of the Spanish population (Ruiz et al., 2017).
2.3 SignallingeffectIt has been proven that people underreact to taxes that are not salient, and that salience is higher when the tax is signalled on the shelves rather than on the receipt (Chetty et al., 2019). Various articles have demonstrated that taxes have the power to generate new social norms and new habits if they are correctly designed, by taking into account potential behavioural biases (Apichaidejudom, 2019; Le Bodo, Paquette and De Wals, 2016; Chetty et al., 2019). Salient taxes participate to the “denormalization” of the act of drinking SSBs on a regular basis, acting as “alarm signal” in society (Le Bodo, Paquette and De Wals, 2016). Nevertheless, it is complicated to measure how much these described effects of taxes weigh in the reduction of SSBs consumption. They are somehow intangible and most of the time entangled with the rising awareness of the population on the topic, but this is by no means that they do not exist (Chetty et al., 2019; Apichaidejudom, 2019).
5 The ANIBES scientific study on food and nutrition includes several specific researches that have enabled to assess, among others, anthropometric data, macronutrients and micronutrients intake, as well as the socioeconomic data and dietary behavior of the population in Spain (see www.fen.org.es/anibes/en/data_results) (ANIBES, 2020).

4
2.4 ThetaxinCataloniaThree studies from the Pompeu Fabra University (Vall et al., 2018), the Research Institute for Evaluation and Public Policies (Mora et al., 2018), and the Institute of Health Carlos III (Royo Bordonada et al., 2019) began to examine the issue. They have already noted a significant reduction in sales and consumption, a rise in the price of the drinks between 10 and 20 percent, depending on the volume of the container, and in some cases substitutions towards untaxed drinks like diet or low sugared drinks. According to Royo Bordonada et al. (2019), one year after the introduction of the tax the prevalence of regular consumers of taxed beverages had decreased by 39 percent more in Barcelona than in Madrid (among people aged 12 to 40 years). While the prevalence of consumers of untaxed beverages remained stable in Barcelona, more than two-thirds of the people surveyed cited the increase in the price as the main reason for reducing their consumption of SSBs; heightened awareness of SSBs’ health effects came as the second factor (22.4 percent). Similar studies have not been recently developed: the previous studies draw on data until June 2018 and have mainly focused on producing quantitative analysis of prices, consumption and sales evolutions. In general, studies on SSBs taxes focus on quantitative analysis of prices, consumption and sales evolutions.

5
3 Methodology
3.1 StudyareaWe conducted a cross-sectional survey (Annex 1) in two neighbourhoods of Barcelona (capital and biggest city of the region) differing by level of income. The study exclusively focuses on Barcelona, but it may illustrate the potential effects of the SSBs tax in Catalonia as a whole since consumer behaviour depends on culture (De Mooij and Hofstede, 2011). The aim of the survey was to collect data whose analysis helps determine in which way(s) the SSBs tax had influenced consumption patterns. The two chosen neighbourhoods were Sarrià from the district called Sarrià-Saint Gervasi and Les Roquetes from the district called Nou Barris. The reference used to choose the neighbourhoods was the disposable family income index data from the Barcelona’s Townhall (2017). Sarrià and Les Roquetes were selected for being the most representative of the neighbourhoods of Barcelona with, respectively, very low and very high disposable family incomes. Their indexes were the nearest to the mean of the respective very low and very high categories of disposable family income (49.7 for Les Roquettes and 193.6 for Sarrià, with Barcelona’s index of 100 as reference). Sarrià is a neighbourhood of Sarrià-Saint Gervasi, district of Barcelona with the highest disposable family income index (182.8), while Les Roquetes is a neighbourhood of Nou Barris, district of Barcelona with the lowest disposable family income index (55). The indexes correspond to a disposable family income per capita of EUR 40 022 a year in Sarrià-Saint Gervasi and EUR 12 045 in Nou Barris. Interviewers were positioned at the exit of representative supermarkets located in these areas (where people go the most in the neighbourhood). Supermarkets are quite different across neighbourhoods. The data collection was carried out in November 2019.
3.2 StudysampleA total of 218 individuals were interviewed (100 in Sarrià and 118 in Les Roquetes), all between 12 and 85 years of age. The persons interviewed had to be necessarily living in Catalonia. In the Sarrià sample, 73 percent of the respondents were residing in the study district, while this is the case for 89.8 percent of them in the sample of Les Roquetes. The respondents who were not residing in the two neighbourhoods were related to these neighbourhoods in some way though (family, friends, etc.), increasing their chance of pertaining to the inhabitants social classes, hence having a higher probability of declaring similar eating behaviours/food choices. The majority of them were leaving close by, in districts with similar socio-demographic characteristics. If added to the fact they do not represent an important part of the sample, the potential bias resulting from this inclusion is rather limited. These samples are therefore representative of the districts’ socio-economic characteristics. One of our main concerns was to know if there was any difference in consumer knowledge, opinion and behaviour across socio-economic positions. This is why it made sense to spread the survey in two districts differing in terms of income level of the population.
Proportions for the districts’ subsamples (100/118) were decided according to the proportions of people in Barcelona pertaining to the very low and very high categories of 2017 disposable family income, so that the sample as a whole can be considered as representative at the city level. Only then, the 2 neighbourhoods were selected for representing best these two categories of disposable family income (see Section 2.1). So actually, it is representative of these 2 disposable family income categories of Barcelona, not of the neighbourhoods themselves since Sarrià counts for around 25 000 inhabitants and Les Roquetes for 16 000.

6
The 218 surveys collected are all complete surveys (all questions were answered by respondents). It would be valuable to repeat this kind of study gathering larger samples though, in order to increase the confidence interval. We used a formula based on the main study variables’ variation to determine minimum sample size, and it was under 100 surveys per neighbourhood for a 90 percent confidence interval. The formula is the following:
𝑁 =(1,96)*𝑝𝑞
𝑒*
With 1,96 being the critical value of the normal distribution for a confidence level of 95 percent, p the estimated proportion of the population picking a same choice, e the margin of error and q = 1 – p. p and q are calculated based on the main explicatory variables of the study, namely awareness of the tax and reduction of SSBs’ consumption over the last years.
3.3 DatacollectionThe trained interviewers invited all passers to answer the survey, which was totally anonymous, made up of 25 questions and lasted about 10 minutes. The consent of the persons was asked before starting the survey. It was distributed during different days of the week and at different times of the day within the stores’ operating hours in order to capture the range of consumers visiting the stores: morning, lunch time, afternoon and evening; beginning of the working week, end of the working week and weekend in each supermarket. The success rate interviewing people was quite higher in Les Roquetes than in Sarrià. A pilot study was performed before the collection of the 218 surveys with Catalans in order to check the wording, to make sure the questions were understandable, and that the research objectives were properly covered.
3.4 StudyvariablesThe survey gathered information about how the tax influences consumer preferences and behaviour: through price, generated public debate and/or salience in the shelves. The following variables used in the analysis were built from the questions of the survey:
a. ReductionofSSBsconsumptionoverlastyearsPeople were asked about whether or not they had reduced their consumption of SSBs (Q10 of the survey). This variable has a binary outcome (“yes” or “no”). The people who never consumed SSBs were assigned the “no” option.
b. RoleofthepriceinthedecisionofreducingconsumptionofSSBsPeople were asked about whether or not the price had an influence in their decision of reducing consumption of SSBs (Q11 of the survey). This variable has a binary outcome (“yes” or “no”). The people who never consumed SSBs were assigned the “no” option.
c. RecentknowledgeofSSBs’healthrisksPeople were asked about whether or not they have felt more aware of the risk of SBBs for their health in the last 2-3 years (Q3 of the survey). This variable has a binary outcome (“yes” or “no”). The people who already knew those risks before were assigned the “no” option. This variable shows the proportion of people who got more conscious of the risks of SSBs recently. This proportion might be due to the implementation of the tax, but also to other measures and to a general rising awareness about the topic. Our study is cross-sectional so causality of associations observed cannot be clearly established, but the advantage of this variable is that people who have always been aware of the risks, or at least for a long time before the

7
introduction of the tax, are assigned the “no” option and only the population of interest within the sample is considered. The risk of presence of confounding factors is reduced, albeit not eliminated. It would be valuable to repeat this type of study with other SSBs taxes in the world, before and after the moment of tax implementation, in order to be able to account for causality of associations.
d. AwarenessofthetaxPeople were asked about whether or not they knew about the existence of the tax (Q4 of the survey). This variable has a binary outcome (“yes” or “no”). It allows to measure how spread was the public debate about the tax in Catalonia. The more people are aware of the tax, the more the significance of the public debate that unfolded with the introduction of the tax.
e. AwarenessofthepriceincreasePeople were asked whether or not they had noticed an increase in the price of SSBs (Q7 of the survey). This variable has a binary outcome (“yes” or “no”). People may have noticed the change because the price climbed notably and/or because the tax was specifically signalled to the consumer by the seller (on the shelves or on the receipt). In the case of Catalonia, both cases are plausible since a 100 percent pass through was imposed by law and some distributors have signalled the tax at the moment of implementation.
Figure 1 illustrates how the variables used in the analysis relate to the objective of the study.
Figure 1. Relations between the questions of the survey, the variables used in the analysis and the study objective
Source: Authors’ own elaboration.
People were asked about their current consumption of SSBs (Q1 of the survey). They were classified between three categories on a scale from low to high consumption of SSBs. A low level of consumption was attributed to people who never consume SSBs or who consume them yearly. A medium level was attributed to those who consume them monthly or very few times weekly, and finally, a high level of consumption was attributed to daily consumers of SSBs. In reality, the decision of putting the individual in one category or the other has depended on the actual amount of SSBs consumed during the year, month, week or day, and on the types of beverages consumed since not all beverage categories contain the same average level of sugar. For instance, vegetal drinks and a significant part of sport and isotonic drinks contain on average less sugar than all other categories. A section with socio-demographic variables
EFFECT OF THE TAXReduction of SSBs' consumption over last years (Q10)
through salience at purchasing sitesAwareness of the rise in price (Q7)
through public debateAwareness of the tax (Q4)
through awarenessRecent knowledge of SSBs' risksfor health (Q3)
through priceRole of the price in the decision of reducing SSBs' consumption (Q11)

8
(sex, age, birthplace and gross annual income) was included in the survey. The variable about the age of the individuals was split into five categories and the variables about gross annual income and current consumption of SSBs into three.
3.5 QuantitativeanalysisThe statistical analysis and the presentation of the results have similarities with the ones of Álvarez-Sánchez et al. (2018). Based on the literature, a binary logistic regression was first conducted to analyse the associations between reduction of SSBs consumption and the following variables: recent knowledge of SSBs’ health risks, awareness of the tax, and awareness of the price increase. Sex, age, gross annual income, neighbourhood and current consumption of SSBs were entered as covariates for control. Backward and forward eliminations were performed. In forward elimination, you start with your null model and add predictors while in backward elimination you start with a full model including all your variables and then you drop those which are not significant one at a time, starting with the least significant one. The final logistic regression model includes only one explanatory variable: recent knowledge of SSBs’ health risks and no covariates.
Chi-Square Tests were run to examine the relationships between some variables used in the initially estimated binary logistic regression. Links between recent knowledge of SSBs’ health risks and awareness of the price increase, and between recent knowledge of SSBs’ health risks and awareness of the tax were explored. These relationships were also examined in light of socio-demographic variables (sex, age, gross annual income, neighbourhood and current consumption of SSBs). If categories within a variable had a n <5, a Fisher Exact Test was performed, instead of a Chi-Square Test. Unlike an approximate statistic such as the Chi-square, Fisher is exact and allows for directional (confirmatory) as well as non-directional (exploratory) hypothesis-testing. The observations met the assumption of independence (that is to say, the answers of each respondent do not depend on the answers of other respondents).
Finally, another binary logistic regression was conducted to analyse the associations between recent knowledge of SSBs’ health risks and the following variables: awareness of the tax and awareness of the price increase. Sex, age, gross annual income, neighbourhood and current consumption of SSBs were entered again as covariates for control. Backward and forward eliminations were performed again. The final logistic regression model includes one variable: awareness of the price increase, and one covariate: age.
A thorough descriptive correlation analysis (Spearman’s rank or Pearson correlation coefficient depending on the variables) was conducted to check for little correlation between the dependent and explanatory variables used in the regressions. Because this study is cross-sectional and cannot conclude for causality of associations, we conducted an analysis of variance as well to inform the results of the regressions.
All analyses were performed with the statistical software package STATA. Results are all based on 95 percent confidence intervals.

9
4 Results
4.1 Socio-demographiccharacteristicsOur analysis begins with the description of the descriptive statistics of the socio-demographic characteristics from the general population and by neighbourhoods (Table 1). It shows that more than half of the respondents earns between EUR 0–20 000 a year (55 percent) and about a quarter of them (33 percent) drinks SSBs daily or several times a week. Only 28.5 percent of the respondents have a low consumption of SSBs. Difference of consumption of SSBs by neighbourhood is statistically significant (p-value=0.015), and high consumption of SSBs is significantly higher in Les Roquetes (39 percent) relative to Sarrià (24 percent). A difference in gross annual income has been observed too (p-value=0.00), with 77.1 percent of respondents in Les Roquetes pertaining to the category “low gross annual income” and only 30 percent in Sarrià. Similarly, only 3.4 percent of respondents in Les Roquetes pertain to the “high gross annual income” category while it amounts to 32 percent in Sarrià. Other significant relationships have been identified between socio-demographic characteristics: age and gross annual income (p-value=0.00), age and current consumption (p-value=0.00), and gross annual income and current consumption (p-value=0.003). Older people earn significantly more and consume significantly less SSBs. Richer people consume significantly less SSBs. These statistically significant socioeconomic differences add value to our analysis because they may condition the design of policies related to SSBs.
Table 1. Socio-demographic characteristics
Neighbourhood Sarrià (n=100)
Percentage (%)
Les Roquetes (n=118)
Percentage (%)
Total (n=218)
Percentage (%)
Sex
Female 64 64 69 58.5 133 61
Male 36 36 49 41.5 85 39
Age (mean ± SE) 43.6 (± 2.1) 45.2 (± 1.7) 44.5 (± 1.3)
£24 25 25 21 17.8 46 21.1
25–44 27 27 37 31.4 64 29.4
45–54 16 16 25 21.2 41 18.8
55–64 12 12 16 13.6 28 12.8
³65 20 20 19 16.1 39 17.9
Gross annual income
Low 30 30 91 77.1 121 55.5
Medium 17 17 15 12.7 32 14.7
High 32 32 4 3.4 36 16.5
Students 21 21 8 6.8 29 13.3

10
Neighbourhood Sarrià (n=100)
Percentage (%)
Les Roquetes (n=118)
Percentage (%)
Total (n=218)
Percentage (%)
Current consumption of SSBs
Low 36 36 26 22 62 28.4
Medium 40 40 44 37.3 84 38.5
High 24 24 46 39 72 33
Notes: For the variable “Age”, the categories were chosen according to age associated levels of SSBs consumption found in the National Health Survey of 2017. For the variable “Gross annual income”, the low category corresponds to annual incomes between 0 and EUR 20 000, the medium category to annual incomes between EUR 12 001 and EUR 30 000, and the high category to annual incomes higher than EUR 30 000. The category “Students” gathers students without earnings. For the variable “Current consumption of SSBs”, the low, medium and high categories correspond to respondents’ declared self-perception of change in their consumption of SSBs.
Source: Authors’ own elaboration.
4.2 InfluenceofpriceandawarenessThe price was found to have had an impact on the reduction in their consumption of SSBs – whether this factor is seen alone or in interaction with a higher awareness of SSBs’ health risks (10.6 percent). People considered SSBs were getting too expensive and therefore decided to reduce their consumption. This result was not statistically different for any of the socio-demographic characteristics. For 98.5 percent of the respondents, declarations point to awareness about SSBs’ health risks explaining totally or partially why respondents reduced their consumption (Figure 2).
Figure 2. Respondent’s declared motives for reducing consumption of SSBs
Source: Authors’ own elaboration.
Awareness of SSBs’ health risks grows as a result of various sources, including the SSBs tax implemented itself due to its potential signalling effect. Given the cross-sectional of our study, causality of associations observed cannot be guaranteed, but these results motivate to explore
0%
10%
20%
30%
40%
50%
60%
70%
80%
90%
100%
Awareness of SSBs' risks only Awareness of SSBs' risks andprice increase
Price increase only

11
relationships between the reduction of SSBs consumption and variables like recent knowledge of SSBs’ health risks, awareness of the tax, and awareness of the price increase. It is possible to assume that awareness of the tax and awareness of the price increase are linked to the recent knowledge of SSBs’ health risks. First, we conducted a regression analysis without taking into account this last hypothesis. In the general sample, about 60 percent of the respondents declared having reduced their SSBs consumption. This drop in consumption was not statistically different for any of the socio-demographic characteristics, which implies that there are no differences across categories of respondents.
4.3 BinarylogisticregressionmodelforthereductioninSSBsconsumption
We tested the hypothesis that a recent knowledge of SSBs’ health risks contributes to the reduction in SSBs consumption. Results have been presented as adjusted odds ratios along with 95 percent confidence intervals and level of statistical significance (Table 2).
Table 2. Model for the reduction in SSBs consumption obtained by binary logistic regression
Consumption decreased vs consumption did not decrease
Odds Ratio (OR)
95% Confidence Interval (CI)
P-value
Recent knowledge of SSBs’ health risks Aware 2.42
Not aware Reference 1.31, 4.46 0.005
Pseudo R2 = 0.0275
Source: Authors’ own elaboration.
The final model of the first regression was significant, Prob > chi2 = 0.0045. Only the variable about recent knowledge of SSBs’ health risks was significant (p-value = 0.005). Respondents who had a recent knowledge of SSBs’ risk were 2.42 times more likely to report a decrease in consumption of SSBs (OR = 2.42) than those who did not have this knowledge. The Pseudo coefficient of determination (R2) is small (0.0275) but it cannot be interpreted as a classical R2. Its interpretation is valid only if compared to that of competitive models based on a same dataset. Moreover, food choices are complex and always depend on many different factors, which may explain a relatively small Pseudo R2.
The finding that only the recent knowledge of SSBs’ health risks was significant in the regression and the fact that the explanatory variables may be related informed what further analysis was needed. Hence, we continued by analysing the interactions between explanatory variables, also taking into account socio-demographic characteristics (between recent knowledge of SSBs’ health risks and awareness of the tax on one side, and between recent knowledge of SSBs’ health risks and awareness of the price increase, on the other).

12
4.4 RelationsbetweentheexplanatoryvariablesIn the general sample, 73.4 percent of the respondents declared they were recently more aware of the health risks of SSBs, 53.7 percent declared they were aware of the tax, and 37.6 percent declared they had noticed the price increase (significant differences by neighbourhood for the price increase: 48.3 percent in Les Roquetes, and 25 percent in Sarrià). We found significant relationships between these three explanatory variables and socio-demographic characteristics (Table 3).
Table 3. Significant associations between explanatory variables and socio-demographic characteristics
Explanatory variables Socio-demographic characteristics Relevant percentages
Recent knowledge of SSBs’ health risks
Age <18–24: 56.5% 25–44: 82.8% 45–54: 82.9% 55–64: 78.6% ³65: 64.1%
Awareness of the tax Age <18–24: 32.6% 25–44: 53.1% ³65: 66.7%
Awareness of the tax Gross annual income Low: 49.6% High: 75%
Awareness of the tax Current consumption of SSBs Low: 67.7% High: 43.1%
Awareness of the price increase Age <18–24: 37% 25–44: 46.9% ³65: 7.7%
Awareness of the price increase Gross annual income Low: 45.5% High: 19.4%
Awareness of the price increase Current consumption of SSBs Low: 16.1% High: 58.3%
Awareness of the price increase Neighbourhood Les Roquetes: 48.3% Sarria: 25%
Source: Authors’ own elaboration.
People aged between 25 and 64 years old have a more recent knowledge of SSBs’ health risks than the youngest and oldest respondents. They are also the ones who notice the most the price increase, followed by the youngest (£18–24 years old). Older and richer people are in general more aware of the existence of the tax. Those who consume less are more aware of the existence of the tax, but they tend to be the most educated and richer individuals. Conversely, they are the ones who least notice the price increase.
Accounting for socio-demographic characteristics points to statistically significant relations between awareness of the health risks of SSBs and awareness of the price rise and age (with a Chi Squared Tests of independence found to be F=10.1562; p=0.054) and gross annual income (F=16.8810, p=0.007). Poorer and younger people tend to notice more the price increase. Younger people tend to be less aware of SSBs’ health risks (Table 4).

13
Table 4. Awareness of the price increase, recent knowledge of SSBs’ health risks and socio-demographic characteristics
Aware of the price increase Not aware of the price increase n Aware of SSBs’
health risks Unaware of
SSBs’ health risks
Aware of SSBs’ health risks
Unaware of SSBs’ health risks
% (95% CI) % (95% CI) % (95% CI) % (95% CI) Sample 218 31.2 25.1–37.4 6.4 3.2–9.6 42.2 35.6–48.8 20.2 14.9–25.5 Age £24 46 21.7 9.8–33.6 15.2 4.8–25.6 34.8 21–48.6 28.3 15.3–41.3 25–44 64 43.8 31.6–56 3.1 0–7.3 39.1 27.1–51.1 14.1 5.6–22.6 45–54 41 34.1 19.6–48.6 4.9 0–11.5 48.8 33.5–64.1 12.2 2.2–22.2 55–64 28 46.4 28–64.9 10.7 0–22.2 32.1 14.8–49.4 10.7 0–22.2 ³65 39 7.7 0–16.1 0 0 56.4 40.8–72.0 35.9 20.8–51.0 Gross annual income Low 121 38.8 30.1–47.5 6.6 2.2–11.0 36.4 27.8–45.0 18.2 11.3–25.1 Medium 32 34.4 18–50.9 3.1 0–9.1 46.9 29.6–64.2 15.6 3.0–28.2 High 36 19.4 6.5–32.3 0 0 58.3 42.2–74.4 22.2 8.6–35.8 Students 29 10.3 0–21.4 17.2 3.5–31.0 41.4 23.5–59.3 31.0 14.2–47.8 Source: Authors’ own elaboration.
4.5 BinarylogisticregressionmodelfortherecentknowledgeofSSBs’healthrisks
These results prompted us to conduct a new regression analysis with recent knowledge of SSBs’ health risks as dependent variable. The final model was significant (Prob > chi2 = 0.0035) and explained 7 percent (Pseudo R2) of the variance in change (Table 5).
Table 5. Model for the recent knowledge of SSBs’ health risks obtained by binary logistic regression
Increase vs no increase in knowledge Odds ratio 95% CI P-value
Awareness of the price increase Aware
Not aware
2.11
Reference
1.02, 4.37
0.044
Age £24
25–44 45–54 55–64 ³65
0.28
Reference 1.07 0.70 0.48
0.12, 0.68
0.37, 3.05 0.23, 2.16 0.18, 1.24
0.005
0.904 0.536 0.128
Pseudo R2 = 0.0664 Source: Authors’ own elaboration.

14
The Pseudo R2 is small and the explanation for this, as provided for the previous model, also hold here. Only one variable (Awareness of the price increase) and one covariate (Age) were found to be statistically significant (p-value=0.044 and p-value=0.005, respectively).
Respondents who had noticed the price increase were 2.11 times more likely to report a recent knowledge of SSBs’ health risks (OR = 2.11) than those who did not. Respondents aged between 25–54 years old had more chance to be aware of the risks of SSBs for health because they have noticed the price increase (OR = 1; OR = 1.07), compare with other age categories, especially young people (OR = 0.28).
4.6 Descriptivecorrelationanalysisandanalysisofvariancea. Correlationanalysis
The correlation between socio-demographic variables (see Section 3.1) was found to be small – according to Spearman’s rank and Pearson correlation coefficients (rho<0.12), except for age and gross annual income (rho=0.39). Dependent and explanatory variables used in the regressions (see Sections 3.3-3.5) are also weakly correlated – with coefficients always below or equal to 0.19. Regarding explanatory variables and socio-demographic variables (see Section 3.4), correlation was also weak, except for the following variables for which the correlation was found to be quite higher: neighbourhood and awareness of the price increase (rho=-0.24) and age and recent knowledge of SSBs’ health risks (rho=-0.23).
b. Analysisofvariance(ANOVA)
Analysis of variance revealed significant differences between groups for some relations between the dependent and explanatory variables used in the regressions. Reduction in consumption is significantly different for respondents if they had recently gained knowledge on SSBs’ health risks or not, knowledge of SSBs’ health risks is significantly different if they had noticed the price increase or not, and knowledge of SSBs’ health risks is also significantly different if they knew the existence of the tax or not. This last relation (knowledge/existence of the tax) does not appear in the final results of the regression because only the strongest model was selected among competing models (see Section 4). As shown in the results of the regression, no significant differences between groups were noticed for the following variables: reduction of SSBs consumption over the last years and awareness of the price increase; reduction of SSBs consumption over the last years and awareness of the tax. Moreover, significant differences between groups were observed for all relations shown in Table 3, Analysis of variance does not reveal significant differences between groups for the following relations: current consumption of SSBs and neighbourhood; and current consumption of SSBs and gross annual income – contrary to the Chi Squared Tests of independence (see Section 3.1).
15
5 Discussion
5.1 SignallingeffectofthetaxAs mentioned in the results, awareness of SSBs’ health risks is a key factor for reduced consumption in our sample. Convincingly, 98.5 percent of the respondents declared this factor had played a role in reducing their consumption of SSBs, while only 10.6 percent declared that the higher price was the consumption-reducing factor. This accords to an impact assessment about the product tax in Hungary by WHO, which found that, through a second assessment of the tax, more people had significantly reduced their consumption of SSBs because they learnt that the product was unhealthy rather than because of the price increase (WHO, 2015a). It means that the tax may have had a signalling effect by way of exposing the risk factor.
These results make sense in Europe, in an OECD country like Spain, and particularly for autonomous region like Catalonia whose mean income ranks third out of seventeen in Spain. People do not reduce in a large proportion their consumption of SSBs just because the price of the drink they use to buy has risen by some cents. The World Health Organization states that the price of the drink should raise by at least 20 percent to deter consumption. In our study, we asked respondents how much the price of a SSB should increase to deter its consumption, on a scale from 10 cents to 1 euro per litre. Around 57 percent of the respondents declared that the price should rise at least by 50 cents or 1 euro per litre (41 percent said 1 euro per litre). Ortega Avila, Papadaki and Jago (2017) found in their study named “Exploring perceptions of the Mexican sugar-sweetened beverage tax among adolescents in north-west Mexico: a qualitative study” that young people believed the rise in price due to the national tax was insufficient to change their SSBs consumption patterns, but that they would consider substituting with other drinks if the price increase was higher. Despite these observations, 10.6 percent is an important number for a relatively small rise of the price6, and should not be disregarded. It means that a part of the population changes its behaviour even when the price increase is rather small.
In the general sample, 53.7 percent of the respondents declared they were aware of the existence of the tax. In other places like Berkeley (United States) or Mexico, the percentage reached more than 60 percent: respectively, 68 percent in Berkeley (Falbe et al., 2016) and 65.2 percent in Mexico (Alvarez-Sánchez et al., 2018). The higher percentage found in those places might be due to the fact that in both places massive public campaigns were conducted about the tax implementation, making the overall population more aware of its existence. Moreover, the tax was established after a referendum in Berkeley, which must have played a key role in the high awareness. Such was not the case in Catalonia where diffusion was restrained to a public release and attendance to the media willing to relay the information. According to respondents, the tax in Catalonia was signalled by supermarkets at the beginning of the measure, but then the signal was withdrawn. Fast food chains like Mc Donald’s or Burger King still signal the tax and a significant number of people declared they found out about it in those places. The measure was spread in the media but not massively at the time of implementation. According to Royo-Bordonada et al. (2019), 83.4 percent of a study sample gathering young people (12–40 years old) from low income areas of Barcelona knew about the existence of the tax. Looked at it by age and income, we find from our sample that the awareness
6 In Catalonia, for a 33 cl can, the price is supposed to increase by 4 cents with the tax, and for a 2 liters bottle by 24 cents (for a drink containing more than 8g of sugar per 100 ml).

16
is 43.1 to 45 percent depending of the variable taken to measure living standards: neighbourhood or gross annual income. This figures can be explained by the fact that younger and poorer people are generally significantly less aware of the tax (p-value=0.01 and p-value= 0.001). In accordance to this finding, Ortega Avila, Papadaki and Jago (2017) had observed that adolescents in Mexico were mostly unaware of the tax. Besides, the tax in Catalonia was overall 100 percent passed through in the SSBs’ prices. In our general sample, 37.6 percent of respondents declared they had noticed the price increase. In this specific case, the tax was somehow salient thanks to the high pass-through rate but could have been more salient, and therefore more efficient in deterring consumption.
Knowledge about the existence of the tax may contribute to increased awareness of SSBs’ health risks and a price increase that goes by unnoticed may contribute to a lower awareness of SSBs’ health risks – as suggested by the Chi-squared tests between variables. This is the reason why a binary logistic regression was conducted treating as dependent variable the recent knowledge of SSBs’ health risks. In this regression, only the price increase being noticed was significant. Being aware of the existence of the tax does not explain increased awareness of SSBs’ health risks according to the selected model.7 This means that the SSBs tax in Catalonia had a signalling effect mostly through the price increase (imposed by the law in Catalonia) and not through the public debate which surrounded the implementation of the tax. It makes sense since, as stated earlier, a small majority of respondents were aware of the tax and no public campaign was made to promote the tax by the government. On the contrary, Alvarez-Sánchez et al. (2018) concluded that knowing the existence of the tax had an impact on reducing consumption in Mexico, country where a strong public debate took place around the SSBs tax. In our sample, about 63 percent of respondents declared that the announcement of the tax introduction was not sufficiently disseminated by the government.
Worth of note is that the vast majority of the population in our sample (87.6 percent) is aware of SSBs’ health risks. A study about the SSBs tax in UK also finds a high figure: 90 percent had knowledge of the link between SSBs and obesity (Pell et al., 2019). Nevertheless, many people are still consuming them in our study (see Table 1). In our sample, 60 percent of the respondents reduced their consumption, a high number if compared to other studies that have found reductions of about 30 percent in their sample (WHO, 2015a; Royo-Bordonada et al., 2019). This high result may be explained by the social desirability response bias (Cerri, Thøgersen and Testa, 2019; Emilien, Weitkunat and Lüdicke, 2017). People tend to give the socially desirable answer to this kind of question. People struggle to reduce their consumption of SSBs, and being aware of their health risks does not prompt them to stop drinking them. Along these lines, Alvarez-Sánchez et al. (2018) conclude that “self-efficacy” and “liking of SSBs” were key variables to drive reduced consumption of SSBs. Ortega Avila, Papadaki and Jago (2017) concluded that adolescents in Mexico did not want to reduce their consumption of SSBs because of liking and addiction to these beverages. A recent article from Durán Agüero et al. (2019) about the black label introduced in Chile in 2015 came to the same conclusion. Only 2.5 percent of the sample was in the “action” stage and 1.5 percent in the “maintenance” stage of behavioural change for the SSBs category. These results for Mexico and Chile may not totally be comparable to our results for Catalonia because of different social norms regarding SSBs consumption. Nevertheless, problems of
7 One final model (the strongest according to R2 and AIC (expel out!) criterion) was selected among competing models. Being aware of the existence of the tax was found to be significant if put as only explanatory variable, but this model was not the most robust so it was left unselected. Therefore, it is essential to recall that there has been a signalling effect through awareness of the tax, but not very large if compared to the influence of the awareness of the price increase.

17
unhealthy diets and obesity are a global phenomenon, depending on many factors which are sometimes crosscutting issues around the world (addiction to the taste of those products, limited time for food preparation, low incomes, habits, etc.).
5.2 Socio-demographiccharacteristicsandheterogeneousresponsetothetax
According to the 2014 European Health Survey, 35.9 percent of the Spanish population aged 15 years and older were regular consumers of soft drinks. This figure is not far away from the 33 percent of individuals who drink daily or several times a week SSBs in our sample. Only 28.5 percent of the respondents have a low consumption of SSBs. Mora et al. (2018) point to 22 percent of the Catalan population regularly drinking SSBs. The higher figure of our sample can be explained by the fact that 55 percent earn less than EUR 20 000 per year, having more chances to gather high consumers of SSBs in the sample. Nevertheless, this proportion makes sense since the majority of the population of Barcelona earns this income level. Data from the Spanish Ministry of Agriculture (Informe de Consumo 2018) show that consumption of SSBs in Catalonia (38.19 litres per person per year) is slightly lower than what the mean consumption for the Spanish population as a whole shows (39.72 litres per person per year).
As of now, drinking SSBs is certainly still a spread habit in the Spanish population especially among the youth and the poorest. Significant relationships have been identified between age and current consumption (p-value=0.00), and between gross annual income and current consumption8 (p-value=0.003). There is extended evidence that young and poorer people drink indeed more SSBs (Ruiz et al., 2017; WHO, 2016a). Many people consider they have a reasonable consumption of SSBs but then were declaring what is a quite high frequency of SSBs consumption. Being the highest consumers of SSBs, young and poor people are in general more resistant to a change of habits.
This study shows significant differences in awareness across age categories, younger people declare less being aware of SSBs’ health risks (see Table 3). Meanwhile, they are the ones consuming the highest quantity of SSBs. The result of the regression (see Table 3) was significant by age category, with adults between 25 and 54 years old being more aware of SSBs’ health risks when being aware of the price increase. Despite a large part of young people had noticed the price increase, they are the ones who less associate it with SSBs’ health risks.
Studies have demonstrated that demand for SSBs was very price elastic (see, e.g., Andreyeva, Long and Brownell, 2010). A recent study about SSBs’ affordability showed that it had an impact on the amount of soft drink consumed per capita and was associated with the prevalence rates of overweight and obesity in countries (Ferreti and Mariani, 2019). Recently, affordability of SSBs has been rising in the world, including in Spain (Blecher et al. 2017).
We have reiteratively made the observation that the tax in Catalonia was overall 100 percent passed through in the price of SSBs. This is a salient point. In our general sample, 37.6 percent declared they had noticed the price rise (significant by neighbourhood: 48.3 percent in Les Roquetes and 25 percent in Sarrià). As highlighted in the results, poorer and younger people tend to notice the price increase much more (see Table 3). Frequent consumers of SSBs also significantly notice the price increase more. It makes sense since people who generally notice the
8 Significant result only with Chi Squared Test of independence.

18
price increase of a product are regular buyers of it and/or people who need to cautiously manage their money.
5.3 PolicyimplicationsoftheresearchfindingsThe above heterogeneous results mean that policies to decrease the level of SSBs consumption should be more oriented to influence specific groups, such as the young and poorest. First, it is key to ensure that awareness of SSBs’ health risks is comprehensive within the population so as to cover those groups. Policies aiming at reducing the consumption of SSBs should focus on raising young people awareness on SSBs’ health risks. Salient taxes on these products is just one among other ways to curb their consumption, but SSBs related public policies should aim at making a more explicit the association between SSBs consumption and health problems (through education and healthy food environments for example), and at incorporating other behavioural factors preventing young people from considering those risks.
To have a higher signalling effect, taxes should be known and therefore their introduction largely and continuously recalled through public campaigns for instance. Signalization should be clear, easy to understand and adapted to all types of population groups to avoid inequality. They should also be applied at higher rates and signalled on the shelves to consumers. Making the existence of the tax apparent is key to increase awareness of SSBs’ health risks and influence their consumption. Implementing salient taxes on SSBs would theoretically help changing the consumption patterns of the youngest since they are more likely than other age categories to notice a price rise. It is a key point since noticing the price rise participates to the rise in awareness about SSBs’ health risks, and therefore to reduced consumption. Further research exploring if these conclusions hold for online shopping would be valuable.
According to Royo-Bordonada et al. (2019), an effective fight against the epidemic of obesity should seek to develop healthy food environments and therefore combine different food policies acting as levers at different levels. Regular SSBs consumption pays a role in this epidemic. A solution to this problem cannot be the result of one isolated measure. In this line, these authors propose the “PODER” (“power” in Spanish) strategic framework which foster the simultaneous implementation of different food policies focusing on advertising, access to food products, taxation and regulation.
Le Bodo, Paquette and De Wals (2016) suggest another interesting approach. They support a “denormalization strategy” directed towards the social norm and habit of drinking regularly SSBs consumption, particularly among young people. According to them, this group tends to be less receptive to the signalling effect of soda taxes—which accord to the results of our regression analysis. Nevertheless, they state that this effect is limited because they also receive the influence of other generations’ norms and behaviours. Moreover, for them soda taxes are only part of this denormalization strategy that should seek, through different measures, changes in the food environments in which we are currently living, norms and habits. SSBs taxes seem to have the power to modify them but the extent to which this is the case is particularly difficult to estimate given that changing social norms and habits is a long process and depends overall on many factors (Chetty et al., 2019). Solutions to improve food choices should therefore be the result of combined measures, acting at different levels, with a regular evaluation of them over time that considers the social evolutions at play.

19
6 Conclusion
This study is the first one analysing the potential of a signalling effect of the SSBs tax in Catalonia, Spain, and the only one on this topic about a European and OECD country. It sheds light on the various ways SSBs taxes are working, ways that are more numerous and complex than we usually think and therefore rarely explored and presented.
Regular consumption of SSBs is still the rule not the exception in Catalonia and Spain in general, particularly among the youngest and poorest individuals. To reverse this trend, food and health policies should be aligned with this reality. The first relevant observation of this study is that people mainly declare reducing consumption partly or totally because of awareness of the SSBs risks for health. Therefore, it is of the highest importance to guarantee that young people become more aware of such risks. Different food policies can foster the require behavioural change and SSBs taxes are definitely one of them.
Indeed, the tax in Catalonia had a signalling effect thanks to the imposed 100 percent pass-through of the tax to the consumer price, but not so much because people were aware of the tax. This result means taxes have the power to raise awareness on SSBs’ health risks if they are correctly designed and diffused. The signalling effect of the SSBs tax in Catalonia, and its impact on awareness of SSBs’ health risks and reduced consumption would have be higher if the tax was more known by the population, especially among the youngest and poorest individuals. Any communication campaign about the tax should therefore be clear, easy to understand and largely disseminated. A higher rate and explicit labels at vending points signalling the tax, not only at the moment of its introduction but regularly over time, would also boost its salience.
Meanwhile, the fundamental objective remains to work towards changing social norms and habits about SSBs consumption. SSBs taxes can support this process but they need to be accompanied by other measures. These taxes alone have limited implications regarding consumption patterns. The results of our study show that young people associate the tax and SSBs’ health risks much less than other age categories. As stated before, one solution is to make the tax much more explicit through public campaigns and labelling, but a more global nutritional education strategy and transformations of the current obesogenic environment are essential components of the denormalization of the habit of drinking regularly SSBs. Together with a feeling of addiction to the taste of SSBs, this is the real problem, especially among young people. Promoting taste education and what Alvarez Sánchez et al. (2019) call in their article “self-efficacy” are interesting ideas to further explore.

20
References
Agüero, S.D., Ocampo, P.S., Sánchez, J.G., Sánchez, Y.F. & Tillería, J.M. 2019. Stages of change in the purchase of packaged foods after phase 1 of the implementation of the new food policy in Chile 2017. Nutrition, 71, 110593.
Ajuntament de Barcelona. 2017. Distribució Territorial De La Renda Familiar Disponible Per Càpita a Barcelona [online]. Barcelona, Spain. [Cited 2 October 2019]. https://ajuntament.barcelona.cat/barcelonaeconomia/sites/default/files/RFD_2017_BCN.pdf
Álvarez-Sánchez, C., Contento, I., Jiménez-Aguilar, A., Koch, P., Gray, H.L., Guerra, L.A. & Shamah-Levy, T. 2018. Does the Mexican sugar-sweetened beverage tax have a signaling effect? ENSANUT 2016. PLoS ONE, 13(8): e0199337.
Andreyeva, T., Long, M.W. & Brownell, K.D. 2010. The impact of food prices on consumption: A systematic review of research on the price elasticity of demand for food. American Journal of Public Health, 2: 216–222.
ANIBES. 2020. Data and results of the ANIBES Study. In: ANIBES. [Accessed 16 September 2020]. www.fen.org.es/anibes/en/data_results
Apichaidejudom, A. 2019. Analyzing and Applying Behavioral Science to Philadelphia’s Sugar Sweetened Beverage (SSB) Tax. Penn Libraries, University of Pennsylvania.
Bascuñán, J. & Cuadrado, C. 2017. Efectividad de los impuestos a bebidas azucaradas para reducir niveles de obesidad: resumen de evidencia para políticas. Medwave, 17(8), e7054.
Basu, S., McKee, M., Galea, G. & Stuckler, D. 2013. Relationship of soft drink consumption to global overweight, obesity, and diabetes: A cross-national analysis of 75 countries. American Journal of Public Health, 103(11): 2071–2077.
Blecher, E., Liber, A.C., Drope, J.M., Nguyen, B. & Stoklosa, M. 2017. Global trends in the affordability of sugar-sweetened beverages, 1990–2016. Preventing Chronic Disease, 14: 160406.
Cawley, J., Thow, A.M., Wen, K. & Frisvold, D. 2019. The Economics of Taxes on Sugar-Sweetened Beverages: A Review of the Effects on Prices, Sales, Cross-Border Shopping, and Consumption. Annual Review of Nutrition, 39(1): 317–338.
Cerri, J., Thøgersen, J. & Testa, F. 2019. Social desirability and sustainable food research: A systematic literature review. Food Quality and Preference, 71: 136–140.
Chazelas, E., Srour, B., Desmetz, E., Kesse-Guyot, E., Julia, C., Deschamps, V. & Touvier, M. 2019. Sugary drink consumption and risk of cancer: Results from NutriNet-Santé prospective cohort. The BMJ, 366: I2408.
Chetty, R., Looney, A. & Kroft, K. 2009. Salience and taxation: Theory and evidence. American Economic Review, 99(4): 1145–1177.
Cornelsen, L. & Smith, R.D. 2018. Viewpoint: Soda taxes – Four questions economists need to address. Food Policy, 74: 138–142.
Chrysochou, P. 2017. Consumer Behavior Research Methods. In G. Emilien, R. Weitkunat & F. Lüdicke, eds. Consumer Perception of Product Risks and Benefits, pp. 409–429. Springer International Publishing.

21
De Mooij, M. & Hofstede, G. 2011. Cross-Cultural Consumer Behavior: A Review of Research Findings. Journal of International Consumer Marketing, 23(3-4): 181–192.
Encuesta Europea de Salud en España. 2014. Instituto Nacional de Estadística, Madrid 2014 [online]. Madrid. [Cited 2 October 2019]. www.mscbs.gob.es/estadEstudios/estadisticas/EncuestaEuropea/pdf/EESE14_inf.pdf
Falbe, J., Thompson, H.R., Becker, C.M., Rojas, N., McCulloch, C.E. & Madsen, K.A. 2016. Impact of the Berkeley excise tax on sugar-sweetened beverage consumption. American Journal of Public Health, 106(10): 1865–1871.
FAO, International Fund for Agricultural Development (IFAD), United Nations Children’s Fund (UNICEF), United Nations World Food Programme (WFP) & World Health Organization (WHO). 2019. The State of Food Security and Nutrition in the World 2019. Safeguarding against economic slowdowns and downturns. Rome.
Ferretti, F. & Mariani, M. 2019. Sugar-sweetened beverage affordability and the prevalence of overweight and obesity in a cross section of countries. Global Health, 15(30).
Le Bodo, Y., Etilé, F., Gagnon, F. & De Wals, P. 2019. Conditions influencing the adoption of a soda tax for public health: Analysis of the French case (2005–2012). Food Policy, 88, 101765.
Le Bodo, Y., Paquette, M.-C., De Wals, P., Le Bodo, Y., Paquette, M.-C. & De Wals, P. 2016. Taxing Soda for Public Health. Springer International Publishing.
Ministerio de Agricultura, Pesca y Alimentación, 2018. Informe del Consumo Alimentario en España 2018. Madrid.
Mora, T., Fichera, E., Lopez-Valcarcel, B.G. & Roche, D. 2018. Do consumers respond to “sin taxes” heterogeneously? New evidence from the tax on sugary drinks using longitudinal scanner data.
Mullee, A., Romaguera, D., Pearson-Stuttard, J., Viallon, V., Stepien, M., Freisling, H. & Murphy, N. 2019. Association between Soft Drink Consumption and Mortality in 10 European Countries. JAMA Internal Medicine, 179(11): 1479–1490.
O’Connor, S. 2018. An investigation into the introduction of a tax on sugar sweetened soft drinks in Ireland and its impact on consumers’ buying behavior. Dublin, National College of Ireland.
Ortega-Avila, A.G., Papadaki, A. & Jago, R. 2018. Exploring perceptions of the Mexican sugar-sweetened beverage tax among adolescents in north-west Mexico: A qualitative study. Public Health Nutrition, 21(3): 618–626.
Park, H. & Yu, S. 2019. Policy review: Implication of tax on sugar-sweetened beverages for reducing obesity and improving heart health. Health Policy and Technology, 8(1): 92–95.
Pell, D., Penney, T., Hammond, D., Vanderlee, L., White, M. & Adams, J. 2019. Support for, and perceived effectiveness of, the UK soft drinks industry levy among UK adults: Cross-sectional analysis of the International Food Policy Study. BMJ Open, 9: e026698.
Popkin, B.M. & Hawkes, C. 2016. Sweetening of the global diet, particularly beverages: Patterns, trends, and policy responses. The Lancet Diabetes and Endocrinology, 4(2): 174–186.
Redondo, M., Hernández-Aguado, I. & Lumbreras, B. 2018. The impact of the tax on sweetened beverages: A systematic review. American Journal of Clinical Nutrition, 108(3): 548–563.

22
Royo-Bordonada, M.Á., Fernández-Escobar, C., Simón, L., Sanz-Barbero, B. & Padilla, J. 2019. Impact of an excise tax on the consumption of sugar-sweetened beverages in young people living in poorer neighbourhoods of Catalonia, Spain: a difference in differences study. BMC Public Health, 19(1): 1553.
Royo-Bordonada, M.Á., Rodríguez-Artalejo, F., Bes-Rastrollo, M., Fernández-Escobar, C., González, C.A., Rivas, F. & Vioque, J. 2019. Food policies to prevent obesity and the main non-transmissible diseases in Spain: where there’s a will there’s a way. Gaceta Sanitaria, 33(6): 584–592.
Ruiz, E., Rodriguez, P., Valero, T., Ávila, J.M., Aranceta-Bartrina, J., Gil, Á. & Varela-Moreiras, G. 2017. Dietary intake of individual (Free and intrinsic) sugars and food sources in the Spanish population: Findings from the ANIBES study. Nutrients, 9(3), 275.
Teng, A.M., Jones, A.C., Mizdrak, A., Signal, L., Genç, M. & Wilson, N. 2019. Impact of sugar-sweetened beverage taxes on purchases and dietary intake: Systematic review and meta-analysis. Obesity Reviews, 20(9): 1187–1204.
United Nations System Standing Committee on Nutrition (UNSCN). 2017. United Nations Decade of Action on Nutrition. Working Programme.
Vall Castelló, J. & Lopez Casasnovas, G. 2020. Impact of SSB taxes on sales. Economics and Human Biology, 36, 100821.
WHO. 2015a. Assessment of the impact of a public health product tax. Copenhagen.
WHO. 2015b. Guideline: Sugars intake for adults and children. Geneva.
WHO. 2016a. Fiscal policies for diet and the prevention of noncommunicable diseases. Geneva.
WHO. 2016b. Global health estimates: disease burden by cause, age, sex, by country and by region, 2000–2016. Geneva.
WHO. 2020. What are noncommunicable diseases? In: WHO [online]. Geneva. [Accessed 16 September 2020]. www.euro.who.int/en/health-topics/noncommunicable-diseases/ncd-background-information/what-are-noncommunicable-diseases

23
Annex1.Survey
Available only in Spanish.
Lugar: __________________________ Fecha: __________________________ Hora: __________________________ N° formulario: ___________________ _____________________
Por favor, responda con una cruz a las preguntas siguientes: 1) ¿Con qué frecuencia usted consume los siguientes tipos de
bebidas azucaradas envasadas? (Por favor, rellene la tabla inferior con las letras que corresponden a las categorías)
A Sodas azucaradas (ej. Coca-Cola, Pepsi, Fanta, Sprite, Trinaranjus…) B Zumos o néctares azucarados (ej. Tropicana, Minute Maid…) C Bebidas energéticas azucaradas (ej. Red Bull, Monster…) D Bebidas deportivas/isotónicas azucaradas (ej. Aquarius, Powerade, Gatorade...) E Tés y cafés azucarados envasados (ej. Nestea, Starbucks…) F Leches endulzadas y batidos (ej. de vainilla y chocolate, Cocaolat…) G Bebidas vegetales azucaradas (ej. leches de soya, almendra…) H Aguas saborizadas azucaradas I Otra(s): _____________________________________________
Frecuencia Bebida(s) : A, B, C… Nunca
Alguna vez al año Alguna vez al mes
Alguna vez a la semana 1 vez al día
2-3 veces al día 4 ³ veces al día
2) ¿Qué bebida(s) y/o alimento(s) que contienen azúcar añadido
usted piensa que consume demasiado? Bebida(s): ______________________________________________ Alimento(s): ____________________________________________ 3) ¿Usted se considera ahora más consciente de los riesgos
asociados con el consumo de bebidas azucaradas que hace 5 años?
Sí No No, ya conocía bien estos riesgos hace 5 años 4) ¿Usted sabía que en Cataluña existe un impuesto especial a las
bebidas azucaradas envasadas? Sí No
5) Si usted sabía que existía un impuesto a las bebidas azucaradas en Cataluña, ¿cómo se enteró de su existencia?
Gracias a las noticias (TV, periódicos, revistas, radio…) Gracias a las redes sociales Gracias a un miembro de su familia/amigo/colega/otro Gracias a alguna publicidad Gracias al cambio de precio en los estantes del supermercado No me acuerdo No tenía información hasta este momento 6) ¿Usted piensa que la información sobre la existencia del
impuesto fue difundida suficientemente? • Por los medios de comunicación:
Sí No • Por la administración (campañas de información pública):
Sí No 7) ¿Usted ha notado un incremento en el precio de las bebidas
azucaradas en el supermercado en los últimos dos años (precio en los estantes)1?
Sí No
8) ¿Cuál considera que sería el incremento del precio de una
bebida azucarada que podría desincentivar su compra? De 10 céntimos/L De 3 céntimos/lata (33cl) De 20 céntimos/L De 7 céntimos/lata
De 40 céntimos/L De 13 céntimos/lata De 50 céntimos/L De 17 céntimos/lata
De más de 1 euro/L De más de 30 céntimos/lata 9) ¿Usted se considera más consciente de los riesgos asociados
con el consumo de bebidas azucaradas gracias a la introducción del impuesto ?
Sí No
¿Por qué? _____________________________________________ 10) ¿Usted cree que ha reducido su nivel de consumo de
bebidas azucaradas debido a la introducción del impuesto?
Sí No He reducido mi consumo pero por otras razones
Muchas gracias por tomarse el tiempo para completar este cuestionario. Las encuestas son totalmente anónimas y los resultados serán utilizados para un estudio universitario en colaboración con la FAO sobre la evolución del consumo de bebidas azucaradas, los motivos y hábitos de consumo/compra, y la influencia en los mismos de medidas fiscales específicas. Rellenarlo toma aproximadamente 5-10 minutos.
Encuesta: Consumo y fiscalidad de las bebidas azucaradas
1 El impuesto a las bebidas azucaradas en Cataluña ha sido introducido en mayo de 2017. El tipo de gravamen del impuesto es el siguiente:
a) 8 céntimos por litro para bebidas con un contenido de azúcar entre 50 y 80 gramos por litro.
b) 12 céntimos por litro para bebidas con un contenido de azúcar superior a 80 gramos por litro.
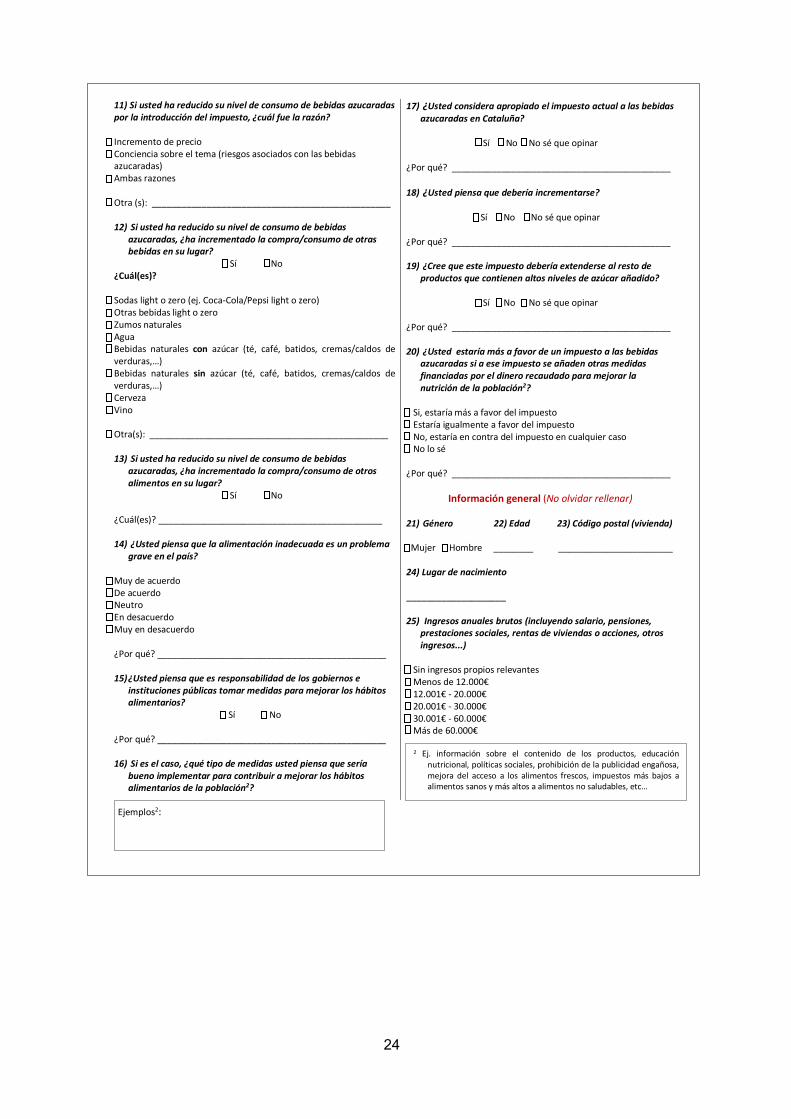
24
11) Si usted ha reducido su nivel de consumo de bebidas azucaradas por la introducción del impuesto, ¿cuál fue la razón? Incremento de precio Conciencia sobre el tema (riesgos asociados con las bebidas azucaradas) Ambas razones Otra (s): ________________________________________________ 12) Si usted ha reducido su nivel de consumo de bebidas
azucaradas, ¿ha incrementado la compra/consumo de otras bebidas en su lugar?
Sí No ¿Cuál(es)? Sodas light o zero (ej. Coca-Cola/Pepsi light o zero) Otras bebidas light o zero Zumos naturales Agua Bebidas naturales con azúcar (té, café, batidos, cremas/caldos de verduras,…) Bebidas naturales sin azúcar (té, café, batidos, cremas/caldos de verduras,…) Cerveza Vino Otra(s): ________________________________________________ 13) Si usted ha reducido su nivel de consumo de bebidas
azucaradas, ¿ha incrementado la compra/consumo de otros alimentos en su lugar?
Sí No ¿Cuál(es)? _____________________________________________ 14) ¿Usted piensa que la alimentación inadecuada es un problema
grave en el país? Muy de acuerdo De acuerdo Neutro En desacuerdo Muy en desacuerdo ¿Por qué? ______________________________________________ 15) ¿Usted piensa que es responsabilidad de los gobiernos e
instituciones públicas tomar medidas para mejorar los hábitos alimentarios?
Sí No
¿Por qué? ______________________________________________ 16) Si es el caso, ¿qué tipo de medidas usted piensa que sería
bueno implementar para contribuir a mejorar los hábitos alimentarios de la población2?
17) ¿Usted considera apropiado el impuesto actual a las bebidas azucaradas en Cataluña?
Sí No No sé que opinar
¿Por qué? ____________________________________________ 18) ¿Usted piensa que debería incrementarse?
Sí No No sé que opinar ¿Por qué? ____________________________________________ 19) ¿Cree que este impuesto debería extenderse al resto de
productos que contienen altos niveles de azúcar añadido?
Sí No No sé que opinar ¿Por qué? ____________________________________________ 20) ¿Usted estaría más a favor de un impuesto a las bebidas
azucaradas si a ese impuesto se añaden otras medidas financiadas por el dinero recaudado para mejorar la nutrición de la población2?
Si, estaría más a favor del impuesto Estaría igualmente a favor del impuesto No, estaría en contra del impuesto en cualquier caso No lo sé ¿Por qué? ____________________________________________
Información general (No olvidar rellenar) 21) Género 22) Edad 23) Código postal (vivienda)
Mujer Hombre ________ _______________________ 24) Lugar de nacimiento ____________________ 25) Ingresos anuales brutos (incluyendo salario, pensiones,
prestaciones sociales, rentas de viviendas o acciones, otros ingresos...)
Sin ingresos propios relevantes Menos de 12.000€ 12.001€ - 20.000€ 20.001€ - 30.000€ 30.001€ - 60.000€ Más de 60.000€
2 Ej. información sobre el contenido de los productos, educación nutricional, políticas sociales, prohibición de la publicidad engañosa, mejora del acceso a los alimentos frescos, impuestos más bajos a alimentos sanos y más altos a alimentos no saludables, etc…
E Ejemplos2:


FAO AGRICULTURAL DEVELOPMENT ECONOMICS WORKING PAPERSThis series is produced by the Food and Agriculture Organization of the United Nations (FAO) since 2001 to share findings from research produced by FAO and elicit feedback for the authors.
It covers different thematic areas, such as food security and nutrition global trends and governance; food security and resilience; sustainable markets, agribusinesses and rural transformations; and climate-smart agriculture.
The complete series is available at: www.fao.org/economic/esa/working-papers
The Agrifood Economics Division (ESA) is the focal point for FAO’s research and policy analysis on agricultural and economic development. The Division produces evidence-based policy analysis and strengthens the capacity of member countries to improve decision-making on food security and nutrition, resilience, climate-smart agriculture, sustainable markets, agribusinesses and rural transformations.
CONTACTS
Agrifood Economics Division – Economic and Social [email protected]/economic/agricultural-development-economicswww.fao.org/economic/esa
Food and Agriculture Organization of the United NationsRome, Italy CB4176EN/1/04.21
ISBN 978-92-5-134239-8 ISSN 2664-5785
9 7 8 9 2 5 1 3 4 2 3 9 8