fiscal implications of climate change - world...
TRANSCRIPT

Policy Research Working Paper 5956
Fiscal Implications of Climate Change Benjamin Jones Michael Keen
Jon Strand
The World BankDevelopment Research GroupEnvironment and Energy TeamJanuary 2012
WPS5956P
ublic
Dis
clos
ure
Aut
horiz
edP
ublic
Dis
clos
ure
Aut
horiz
edP
ublic
Dis
clos
ure
Aut
horiz
edP
ublic
Dis
clos
ure
Aut
horiz
edP
ublic
Dis
clos
ure
Aut
horiz
edP
ublic
Dis
clos
ure
Aut
horiz
edP
ublic
Dis
clos
ure
Aut
horiz
edP
ublic
Dis
clos
ure
Aut
horiz
ed

Produced by the Research Support Team
Abstract
The Policy Research Working Paper Series disseminates the findings of work in progress to encourage the exchange of ideas about development issues. An objective of the series is to get the findings out quickly, even if the presentations are less than fully polished. The papers carry the names of the authors and should be cited accordingly. The findings, interpretations, and conclusions expressed in this paper are entirely those of the authors. They do not necessarily represent the views of the International Bank for Reconstruction and Development/World Bank and its affiliated organizations, or those of the Executive Directors of the World Bank or the governments they represent.
Policy Research Working Paper 5956
This paper provides a primer on the fiscal implications of climate change, in particular the policies for responding to it. Many of the complicated challenges that arise in limiting climate change (through greenhouse gas emissions mitigation), and in dealing with the effects that remain (through adaptation to climate change impacts), are of a fiscal nature. While mitigation has the potential to raise substantial public revenue (through charges on greenhouse gas emissions), adaptation largely leads to fiscal outlays. Policies may unduly favor public spending (on technological solutions to limit emissions,
This paper is a product of the Environment and Energy Team, Development Research Group. It is part of a larger effort by the World Bank to provide open access to its research and make a contribution to development policy discussions around the world. Policy Research Working Papers are also posted on the Web at http://econ.worldbank.org. The author may be contacted at [email protected].
and on adaptation), over policies that lead to more public revenue being raised (emissions charges). The pervasive uncertainties that surround climate change make the design of proper policy responses even more complex. This applies especially to policies for mitigation of emissions, since agreement on and international enforcement of cooperative abatement policies are exceedingly difficult to achieve, and there is as yet no common view on how to compare nearer-term costs of mitigation to longer-term benefits.

0
FISCAL IMPLICATIONS OF CLIMATE CHANGE*
Benjamin Jones
Oxford University
Michael Keen
Fiscal Affairs Department
International Monetary Fund
Washington DC 20431, USA
and
Jon Strand
Development Research Group, Environment and Energy Team
The World Bank
Washington DC 20433, USA
*This paper is a considerably revised version of IMF (2008a). We are grateful to Ian Parry and two
referees for helpful comments. Views and errors remain ours alone, and should not be attributed to
the International Monetary Fund or the World Bank Group, or any of their member countries.

2
I. INTRODUCTION
Climate change is, to a large degree, a fiscal issue. In itself, it is simply an externality
problem, potentially calling for public intervention to limit (‗mitigate,‘ in the jargon of the
climate literature) harmful emissions. But it is an extraordinarily complex externality, both
technically and politically, making appropriate measures correspondingly hard to design and
(even more so) secure agreement on. Moreover, the economic impact of changing climates—
now well-known1—will be felt, for good or bad, on both tax and spending sides of
governments‘ accounts. And there are very specific challenges posed by the need for
measures (of ‗adaptation‘) to come to terms with—whether limiting damage or exploiting
potential benefits—the climate change that will remain, with the balance between mitigation
and adaptation in itself an important question of policy design. These potential fiscal
implications, moreover, are—or at least should be—among the first consequences of climate
change to be widely felt: the science means that mitigation will take decades to reduce future
climate risks, while adaptation issues already arise in many countries.
This paper reviews the fiscal challenges posed by climate change and what is known about
how to address them. The aim is to provide a (reasonably) quick and comprehensive
overview of the main analytical issues and lessons learnt. More detailed reviews of particular
topics may be found elsewhere: Aldy and others (2010) and the contributions in Parry (2012)
for instance, survey mitigation instruments. There seems, however, to be no unified overview
of the full range of fiscal issues.
To this end, Section II sets out the key features of the public economics of climate change.
Section III then considers fiscal aspects of mitigation, and Section IV considers core aspects
of current policies in this area. Section V turns to adaptation and the newer topic of ‗climate
finance.‘ The paper devotes more pages to mitigation than to adaptation, for two main
reasons. First, the most severe incentive and coordination problems arise in relation to
mitigation, since international spillover issues are much more marked: one country‘s
emissions ultimately affect all others, but most measures of adaptation do not. Second, while
mitigation clearly requires public action, adaptation will and should be largely a matter of
response by the private sector. Moreover, adaptation has simply attracted less attention.
Section VI concludes.
II. CLIMATE CHANGE AS A PUBLIC FINANCE ISSUE
Climate change will have indirect effects on the public finances that may amplify the wider
challenges it poses. Countries heavily dependent on tourism or on selling fishing rights, for
example, or experiencing reduced agricultural productivity, may face significant reductions
in tax revenues. More fundamentally, however, taxes and spending instruments have a
purposive role to play in mitigating and adapting to climate change, and it is these that are the
1 The Appendix provides a refresher.
3
focus of the paper. This section starts by setting out key structural features of climate change
viewed from a public finance perspective.
Climate change is an externality problem…
Emitters of greenhouse gases (GHGs) fail to recognize the aggregate damage they cause, so
emit more than is collectively desirable. Attaining a long-run atmospheric CO2 target of 550
parts per million, by many scientists considered necessary, requires slowing and then
(starting in 2020–40) cutting global emissions (by 60–80 percent). But each country would
prefer others to shoulder the costs of doing so—a classic ―free-rider‖ problem. Indeed a
unilateral reduction in emissions by one country reduces the marginal benefit of abatement to
others, and so is likely to be to some degree offset by increased emissions elsewhere.2
…but a particularly complex one
The collective action problem is made more challenging by asymmetries in physical impact
and past emissions. Emissions have the same effects wherever they arise, but those effects
differ greatly across countries: they are most adverse in lower-income countries (and perhaps
even beneficial in some wealthier ones), and often for the most vulnerable groups within
them. Responsibility for current concentration levels also varies greatly: high-income
economies generated about 80 percent of past fossil fuel-based emissions, and in that sense
account for much of the prospective damage. But limiting that damage requires that others
also cut emissions: China now emits more than the U.S., for example, and within a decade,
most emissions will come from outside the OECD. Asymmetric interests and views on
historical responsibility, with a clear tendency for those standing to lose most having lower
past emissions, severely complicate identifying generally acceptable policy responses, and
make it likely that some form of side payments between countries will be needed.
Dealing with climate change is also made difficult by its slow-moving, stock nature. Global
temperature depends not on the current flow of emissions but on the cumulative stock, with
emissions taking decades to have their full effect and then a century or so to decay. Thus
little can be done to avoid temperature rise in the next three decades or so, and current
economic difficulties make little difference to the case for future mitigation: these caused
global emissions to fall temporarily in2009,3 but the impact on the accumulated stock—given
its sheer scale relative to emissions, and very slow rate of decay—is limited: even a 10
percent fall in global emissions lasting two years, for example, might reduce the stock of
greenhouse gases by only around 0.1 percent—and by only around 2 percent in 2040 were
the economic impacts to be permanent.4 A still more profound implication is the strong inter-
2 Auerswald, Konrad, and Thum (2011) show that where a unilateral cut in emissions reduces the uncertainty
associated with emission-related damages, the net impact may actually be an increase in global emissions.
3 The International Energy Agency (IEA, 2009) estimated that global emissions fell by around 3 percent in
2009; but increased again in2010 to slightly surpass the 2008 level.
4 Jones and Keen (2010).
4
temporal mismatch between the (early, and certain) costs and (late, and highly uncertain)
benefits of reducing emissions.
Addressing the issues of inter-generational equity implied by this awkward inter-temporal
structure requires assessing the impact now and into the future of mitigation efforts and
remaining climate effects and then determining how to weigh them in designing policy. The
latter has sparked particular controversy as to the appropriate choice of discount rate. One
approach is simply to use a market rate as a summary statistic of implicit social judgments or
through sheer pragmatism. Another has been to dissect the standard formula for discounting
marginal increases in future consumption in the Ramsey model of an infinitely lived
individual in a perfectly certain world at a rate of , where ρ is the rate of pure time
preference (comparing future to present welfare), η is (the negative of) the marginal utility of
consumption and G the rate of consumption growth. The Stern Review (2007), notably,
famously followed Frank Ramsey in deeming the discounting of future utility ethically
indefensible, and took ρ to be 0.1 percent (non-zero only to the extent of possible global
catastrophe). But this is not the only philosophically respectable position: others might argue,
for example for a maximin approach; which, since the present generation is likely to be the
poorer than its successors, climate damage notwithstanding, leads to quite different
conclusions. The remaining elements of the formula are also open to debate: Dasgupta (2007)
for instance, argues for a higher value of η than taken by Stern (two rather than one).
This controversy is now quite well-trodden. But it is not resolved. One response to this lack
of consensus is to treat the discount rate itself as uncertain; which, since discount factors are
convex in the discount rate, implies discounting at a rate below the expected discount rate
(with that rate also falling over time). The conclusion, more generally, is simply that it
remains the case that the position one takes on the proper discount rate can make a large
difference not only to assessed damages from climate change but—as discussed below—to
views on the proper level and rate of increase of carbon prices.
Arguably even deeper challenges arise from the pervasive uncertainty in the science of
climate change. First, the trajectory of future man-made GHG emissions, over a natural
planning horizon (say, the current century) is uncertain. Second, there is uncertainty on the
long-term impacts of emissions on GHG concentrations, due to variable and uncertain
absorption rates for carbon in soil and oceans. Third, the climate implications of given GHG
concentration level changes are highly uncertain. This is true of both gradual effects (for
instance on cloud formation, whose overall effect on warming is uncertain), and the
possibility of catastrophic events, whose probabilities—while likely low—are themselves
unknown. Finally, the impacts of any given climate change, on human societies and overall
human welfare, given our adaptive responses to such change, is highly uncertain. The
implications of this uncertainty for policy design are profound.
One issue posed by uncertainty is its implications for the proper discounting of future effects.
A straightforward approach is to discount expected future consumption at a rate that adds a
risk premium to the standard formula above. Weitzman (2009) argues however, that more
5
profound consequences follow on recognizing that the relevant uncertainty in relation to
extreme events is necessarily Knightian, since past observations can provide little if any
guidance on the distribution of outcomes. Taking the expectation over distributions of
possible outcomes can plausibly lead to a distribution with ‗fat tails;‘ and with the probability
of these low outcome events declining less rapidly than the associated marginal utility of
consumption increases, the expected marginal utility from an additional unit of consumption
in all future states of nature becomes infinitely (or at least) very large. The consequence of
this ‗dismal theorem‘ is that a concern to guard against catastrophe will dominate policy
choices, whatever view is taken on the more traditional discount rate issue (and many others)
above. The practical importance of this observation, and the conclusions to be drawn from it,
have attracted much debate: Kousky and Cook (2009), for example, provide statistical
evidence that the distribution of losses for wind and flood events in the US may be ―fat
tailed‖.5 Others, however (including Nordhaus (2011), and Pindyck (2011)), take the view
that such possibilities do not cause fundamental problems for economic analysis.6 And Aldy
et al (2010) point out, for instance, that since many catastrophic events will have significant
transition periods and may come with some warning, the development of ‗last resort‘
technologies is likely a wiser response than is cutting emissions to levels providing
reasonable assurance against such catastrophes. Nonetheless, the debate makes clear that tail
events are, in an important sense, different, and may need tailored responses to address them.
The possible irreversibility of many climate effects causes particular problems when coupled
with uncertainty. On one hand, the possibility of irreversible environmental damage—
increased atmospheric concentrations, extinction of species, and catastrophic events—points
to a ―precautionary principle:‖ act now to avoid the possibility of bad future outcomes. But
the prospect of better information on the likely extent and nature of damage, and of improved
technologies, argues for the opposite: delay action to avoid incurring costs (including through
mitigation) that may prove unnecessary.7 Balancing these two considerations is complex,
and— beyond some consensus that the risk of catastrophe argues for caution—assessments
of the practical implications differ.8 The consensus in the literature, exposed e.g. in Fisher
and Narain (2003), however seems to be that the delaying (―wait-and-see‖) factor dominates
the irreversible damage factor: additional waiting is then typically optimal (an unpalatable
result for many environmentalists). Problems caused by irreversibility are increased by the
5 They also identify weaknesses in traditional assumptions regarding the independence of different weather
related risks, significantly amplifying concerns regarding potential losses from extreme weather events.
6 The basic argument is that damages are always bounded so that the fundamental problem in Weitzman (2009),
that expected climate damages can be infinitely large, does not apply. A modified argument appears in
Weitzman (2011). See also Strand (2009). Kousky et al (2009) discuss practical, anticipatory, measures to meet
the possibility of ―mega-catastrophes‖.
7 See for example Pindyck (2000).
8 Kolstad (1996); Fisher and Narain (2003); O‘Neill and others (2006); Pindyck (2007).
6
existence of long-lived infrastructure investments that may imply high levels of GHG
emissions long into the future, but are costly to change in the short and medium terms.9
Climate change and responses to it are likely to interact with other market failures.
Innovation in mitigation and adaptation, for example, may convey externalities and so raise
questions of policy support. Not least, the design of mitigation instruments may be affected
by their impact on revenue and the wider fiscal system. And addressing deforestation (about
15 percent of GHG emissions) may be hindered by weak property rights and governance.
Further complications arising from the exhaustibility of the fossil fuels from which most
emissions arise. Suppliers must decide not simply whether, but also when, to extract oil, gas,
or coal, or to cut trees—which can have powerful implications for the impact of mitigation
measures. And those decisions may themselves be distorted by another set of market failures.
All this adds up to an extraordinarily complex setting in which to design policy.
III. FISCAL INSTRUMENTS FOR MITIGATION
Fiscal instruments are not the only way to reduce GHG emissions, but can be particularly
well-targeted. Performance standards for cars, for example, limit fuel used per mile traveled
but do not charge drivers for the emissions from the marginal mile traveled. And there are a
wide range of fiscal instruments that could be used: a tradable performance standard, for
example, would require firms to purchase permits to the extent that the average emissions
intensity of their output exceeds some threshold. But the best-targeted policy is to charge an
appropriate price for GHG emissions, since this efficiently exploits all opportunities for
emission reduction. A tradable performance standard, for instance, provides the same
incentive to reduce emissions per unit of output as would a carbon prices; but, in effectively
rebating the part of that charge corresponding to baseline emissions combines this with an
output subsidy that counteracts the impact on emissions.10
Accordingly, this section reviews
issues in the design and assessment of appropriate carbon prices.
9 See Shalizi and Lecocq (2009), Strand, Miller and Siddiqui (2011).
10 To see this: A firm‘s profits under such a scheme are where R denotes
revenue, output is X , emissions per unit output are e, the emissions standard is and the permit price is p.
Rewriting, where would be profits under a carbon price of p and
acts as an output subsidy.

7
A. Principles of Carbon Pricing11
Pigovian pricing
The classic prescription for externality problems—facing polluters with a price for their
emissions equal to the marginal social damage they cause—implies charging a price for
emitting CO2 equal to the present value of the marginal social damage it causes. Denoting the
stock of emissions at time t by and the associated marginal damage by 12this
implies a Pigovian charge at time u of
(1),
where denotes the rate at which the stock decays and r the discount rate. The stock nature
of the externality means that the corrective price for current emissions generally depends on
future emissions; and a lower discount rate implies a higher carbon price, as does slower
decay.
Faced with such a ‗carbon price‘—an addition to the price paid for the underlying resource
itself (such as coal)—emissions will not be taken beyond the point at which the marginal cost
of reducing (‗abating‘ or ‗mitigating‘) those emissions is less than that price. In this way, the
marginal social cost of abatement is equated to its marginal social benefit (from reduced
damage). Efficiency requires—absent other market failures and/or equity concerns (returned
to later)—that this carbon price be the same for all emissions, however and wherever they
arise. The social damage from CO2 emissions being the same wherever in the world they
arise, efficiency requires that marginal abatement costs also be uniform, across countries and
emitters. This requires identical carbon prices: otherwise the same emissions reduction could
be achieved more cheaply by raising the carbon price on fuels, in regions or on activities in
which it is low, and reducing it where it is high.
Arguably no less important than the level of the carbon price at any time is its evolution over
time. One reason for this is that energy investments are commonly made for the long term—
possibly decades—and with substantial sunk costs, so that efficient decision-making requires
confidence on the future course of carbon prices. So too do incentives to innovate. From (1),
the Pigovian carbon price evolves as All else equal, while
a lower discount rate means a higher current carbon price it thus also means one that rises
11
Similar principles apply to other GHGs, but the discussion here follows much of the debate in focusing on
mitigating CO2 emissions—the largest (and most rapidly increasing) share of GHG emissions. Burning fossil
fuels also generates other pollutants (such as nitrous oxides and particulates) that can cause significant local and
regional harm. While carbon pricing can have significant co-benefits in reducing such emissions, they are best
dealt with by differential charges related to each pollutant.
12 The shape of the marginal damage function Is not entirely clear cut: damage is convex in temperature
increase, but temperature increase is (somewhat counter-intuitively) concave in (linear in the log of) the
concentration level.

8
less rapidly (because the present value of future damages then increases less rapidly as they
draw nearer). And, ignoring decay, the efficient carbon price increases over time so long as
most damage arises in the future, in the sense that the present value of future marginal
damages is greater than it would be if today‘s damage persisted forever. This seems likely to
be the case for several decades.
While the characterization in (1) is of wide applicability, the implied time path of the carbon
price plays a particularly critical role in the context of exhaustibility. As in Hotelling (1931),
the extraction decisions of competitive producers are then guided not by the carbon price at
any moment but by the rate at which it increases in present value: extraction today will be
more attractive than extraction tomorrow, all else equal, if that present value increases over
time.13
If, for instance, the carbon price simply rises at the rate of interest, then—unless the
rate is so high as to choke consumption, and ignoring the possibility of backstop
technologies—then there is no impact on extraction paths (or, hence, the course of global
warming): the price to the producer simply falls by the amount of the carbon price. The
intuition is straightforward: the long-run supply of the resource being inelastic, producers
bear the full burden. Similarly, a carbon price growing at a rate higher than the rate of
interest—or other policies pointing towards tighter limits in the future than at present--will
tend to bring forward fossil fuel extraction and so accelerate climate damage: this is the
―green paradox‖ of Sinn (2008).14
How important this possibility is in practice has proved
another focus of debate. Ploeg and Withagen (2009), for instance, show that the green
paradox is less likely to occur when backstops that can replace fossil fuels are relatively
inexpensive. Even when immediate extraction does increase, however, cumulative extraction
may fall: this will be the case, Hoel (2010) shows, when extraction costs rise as the stock is
depleted; and a similar effect may arise as the expectation of tighter future policies
discourages exploration for new reserves. Perhaps most fundamentally, however, whether
fossil fuels are best modeled as exhaustible is questionable: empirically, the evolution of
resource prices is not well-described by simple Hotelling-type models; and stocks—
especially of coal—are so large that the relevance of exhaustion is moot.15
Market imperfections
Using the proceeds from carbon pricing
Government receipts from carbon pricing—whether as tax revenue or from auctioning
emission rights—can ease pressures on the public finances, which will likely remain
13
The carbon price is effectively a royalty on resource extraction.,
14 Early treatments of the issue are in Sinclair (1994) and Ulph and Ulph (1994).
15 The World Coal Organization reports that proven coal reserves are adequate for around 118 years at current
usage, while proven oil and gas reserves are enough for around 46 and 59 years
(http://www.worldcoal.org/coal/where-is-coal-found/).
9
extraordinarily severe in many advanced (and high emitting) countries for some time. They
can enable cuts in other distorting taxes, or an increase in public spending, or debt reduction.
And the sums at stake are potentially sizable. Recent legislative proposals for an emissions
trading scheme in the US, for example, had revenue potential of around $850 billion over
2010–19 (the value of the third phase of the EU ETS 2013-20 is expected to be of similar
magnitude): roughly 25 percent of the then-forecast cumulative US fiscal deficit, more than a
quarter of total corporate income tax revenues, and around 0.5 percent of cumulative GDP.16
It might be tempting to suppose that carbon pricing can thus yield a ―double dividend‖17
in
the sense of not only mitigating climate change but also improving the overall efficiency of
the tax system—in which case it might be optimal to set the carbon price above the Pigovian
level. But in addition to this beneficial ―revenue recycling‖ effect is a ―tax interaction‖ effect:
carbon pricing will affect, and possibly exacerbate, the distortions caused by the pre-existing
tax system. By raising the consumer price of energy-intensive goods, for instance, it would
have effects similar to a reduction in the after-tax wage, and thus reinforce the distortionary
impact of labor taxes—implying an optimal carbon price below the Pigovian level,18
by
perhaps 15–20 percent. In some circumstance, however, the tax interaction effect could act in
the opposite direction: in some developing countries, for instance, a tax on fuel inputs may
increase efficiency by levying tax more effectively on final operators.
If the initial tax system is well-designed (climate concerns aside) then the two effects must
cancel out: tautologically, it is impossible to raise the same revenue in a way that is better. In
practice, however, initial tax systems may be less than perfect, and the political impetus
behind carbon pricing may enable beneficial reforms that were previously unpalatable.
The best use of additional revenue from carbon pricing, including to offset any adverse
equity impact (discussed below), will vary with countries‘ circumstances. In many
developing countries, revenue from better carbon pricing would naturally be used to
strengthen revenue mobilization. Several developed countries have previously used
additional revenue from increased energy taxes to reduce social contributions, such ―green
tax swaps‖ being intended to reduce unemployment: Germany, for example, shifted around
3 percent of total tax revenue in this way in 1996–99. The likely effectiveness of such
measures depends on the extent to which the burden of carbon prices can be shifted to factors
other than labor. The (scant) empirical evidence does not suggest strong employment gains.19
In any case, it is likely that many advanced countries will increasingly need to utilize receipts
from emissions charging for fiscal consolidation.
16
Congressional Budget Office (2009a,b); Commission of the European Communities (2008a).
17 Usage of this term differs: see Goulder (1995). For further references, see Goulder (2002).
18 Bovenberg and de Mooij (1994).
19 See, for instance, Carraro, Galeotti, and Gallo (1996).

10
Innovation
Proper carbon pricing is a critical anchor for efficient innovation. Technical progress—for
instance, in developing carbon sequestration technologies—will be pivotal in dealing with
climate change. Such innovation needs to be guided by carbon prices (present and
prospective, over the long term) that reflect the social gains from developing less carbon-
intensive technologies.
One strand of literature examines how the path of optimal carbon prices is affected if (as is
likely) technological progress is endogenous to emissions charging and subject to forms of
market failure other than the underpricing of emissions reductions—under the assumption
that no other instruments are deployed. The exact prescription varies for different forms of
knowledge spillovers.20
Positive learning effects might imply a relatively higher carbon price
initially, but subject to a lower than otherwise growth rate—falling back to the level in (1) (or
even lower level) at some future date. However, an initial price below the Pigovian level may
be appropriate where the set of useful ideas is viewed as limited, and their research and
development has a ―crowding out‖ feature, becoming progressively more costly.21
Some
studies argue that returns to innovation in green technologies could be mutually reinforcing
(due, for example, to positive scale effects with respect to market diffusion), which might
modify the path of optimal carbon taxation as the economy is shifted to a growth path where
‗green‘ technologies dominate more (Acemoglu and others, 2011). However, constraints on
substitutability of clean and dirty forms of capital, as well as the extent of the competitive
advantages currently enjoyed by conventional technologies, mean that a steadily increasing
carbon price over a sustained period is likely needed in practice.
More fundamentally, however, where innovation is subject to its own market failures an
efficient response will require instruments beyond carbon pricing. Such failures potentially
arise from standard problems of knowledge spillover in relation to R&D and learning by
doing, potentially amplified in the present context by a time inconsistency problem: once
innovations have proved their worth, governments may have an incentive to renege on the
high carbon prices promised in order to induce that innovation.
Fiscal instruments have a potential role in overcoming market failures in climate-related
R&D. Technical progress in dealing with climate change will be subject to the same broad
market failures and challenges that affect all innovation: the inability of innovators to
appropriate the full social benefits of their investments, and overcoming obstacles to rapid,
20
See Jaffe, Newell, and Stavins (2002) for a review of the empirical literature.
21 See, in particular, Greaker and Pade (2008), who show that when the technology projects are mutually
reinforcing, the carbon tax should typically start higher, while when projects have the ―crowding out‖ feature, it
should usually start lower, relative to the Pigou level.

11
wide diffusion of new technologies, in particular in low-income countries where they may
have their widest application. Even aside from climate issues, many countries already offer
generous R&D incentives (this being one feature of the intensified international tax
competition in recent years). There is evidence that these do increase spending on R&D and
patenting,22
but they can be difficult to shape so as to target innovation conveying social
rather than private benefit. And tax reductions may do little for innovative start-ups, since
these are unlikely to generate substantial taxable income. Nonetheless, general R&D support
measures should apply to climate-related innovation as to any other. There may though be a
case for further fiscal measures reflecting, for instance, the costliness of catastrophic
outcomes (putting some premium on geo-engineering solutions) and such sector-specific
issues as the inability of private insurers to cope with particular risks from nuclear power.
Although not without risk of waste, public spending to support private innovation can
potentially be better targeted where social returns are likely most to exceed private.
It remains unclear whether fiscal support measures to encourage renewable energy
developments so far—including, for example, capital grants and low interest loans for
production capacity and new technologies development, feed-in tariffs, and tax credits—have
proven cost-effective. The OECD (2008) estimated that support for biofuels in the United
States, Canada, and the European Union, for example, amounted to around $11 billion in
2006, but returned emissions at a cost of between $960 to $1,700 per tCO2—around 70 to
130 times the current EU ETS price. This will be too pessimistic a view once learning-by-
doing is taken into account, but stresses the importance of monitoring such spending—
including through tax expenditure analysis—to inform policy formation in an increasingly
important area.
What does seem clear, however, is that while it may be politically tempting to set a low
carbon price and instead provide strong public support for innovation, this risks wasting
resources by substituting, at the margin, relatively expensive R&D for relatively inexpensive
mitigation. Fischer and Newell (2007), for instance, find that while there are likely to be
considerable gains from an efficient combination of carbon pricing, R&D support and
renewable subsidization, it is the carbon pricing component that is most critical.
Distortions in fossil fuel extraction
Some argue that fossil fuels are extracted too rapidly, which may call for a carbon price
increasing at less than the market interest rate. This over-extraction may be because resource-
owners may use ‗too high‘ an interest rate (so preferring to extract the resource now and
invest the proceeds, rather than leave it in the ground), either because their rate of
discounting of future costs and benefits is higher than that chosen by a global social planner
(due perhaps, to imperfections in credit and capital markets); or because they feel insecure in
22
Hall and van Reenen (2000), Jaumotte and Pain (2005).
12
their property rights (Sinn, 2008). This could be countered directly by taxing the sectoral
return to capital or alternatively by having the carbon price rise at less than the interest rate.
But the direction of effect is not entirely clear-cut. Insecurity of property rights might also
lead to too little extraction, by discouraging any accompanying sunk investments it requires
(including potentially in exploration): there is evidence that such insecurity reduces oil
production, but increases deforestation (Bohn and Deacon, 2000). 23
The limits of carbon pricing
There may come a point—indeed this is increasingly likely as mitigation efforts are
delayed—at which it becomes clear that feasible mitigation strategies are unlikely to avert
abrupt or catastrophic climatic shifts: these events may well be preceded by clues that a
trigger point is approaching (Weitzman 2011) and generally involve transitions of decades or
more, Fast-acting ‗last resort technologies‘—direct carbon capture from the air or
geoengineering to deflect solar radiation—are then the only way to avoid these large effects
(or at least buy time).
Much is already known about the science of these options. Experience from volcanic
eruptions shows that deflection can work, and the physics and engineering of geoengineering
are well understood. Moreover, operationalizing this could be cheap: Carlin (2006) puts the
cost at only a few cents per tonne of CO2. Barrett (2007) argues that at such low cost the free-
rider problem becomes very much less marked. The concerns are in this case rather different.
Beyond political incorrectness is a natural concern with unintended side effects.24
Still more
fundamental, perhaps, are the governance issues stressed by Barrett (2006): Who gets to
control the global climate? It seems increasingly prudent, nonetheless, to take these options
seriously.
B. Instrument Choice—Taxes, Cap-and-Trade, Hybrids25
Carbon pricing can be implemented through carbon taxation, cap-and-trade, or hybrids of the
two. A carbon tax is simply one levied at the same specific rate on all emissions, whatever
their source. Since carbon emissions are proportional to fossil fuel use (for a given fossil-fuel
type, and in the absence of carbon capture and storage technologies), this could be charged
not directly on emissions but on the use of fossil fuels—oil, gas, and coal—themselves.
Under cap-and-trade, some fixed total of emission rights is issued, and firms trade to hold the
23
Strand (2009) shows that either the ―insecure property rights‖ effect, or the ―sunk cost‖ effect, may dominate,
depending on parameter values.
24 Carlin (2006) points out, however, that geoengineering has some advantages over mitigation: it preserves, for
instance, the beneficial effects of higher CO2 concentrations on some plant growth.
25 Issues of instrument choice are also reviewed in Goulder and Parry (2008) and the contributions in Parry
(2012).

13
permits they need. The price paid for the permit is then, in effect, a carbon price. ‗Hybrids‘
let the carbon price vary (like cap-and-trade) but also allow some flexibility in aggregate
emissions (like a tax): this might involve, for instance, cap-and-trade with a maximum price
(at which unlimited permits would be issued). More generally, since no tax or emissions limit
would remain unchanged forever, any scheme will in practice be some form of hybrid.
Variants include a cap-and-trade scheme in which countries are allocated emission rights
corresponding to business-as-usual and a central authority, financed by direct country
contributions, controls emissions by purchasing and retiring them (Bradford, 2002).
Investigating the relative merits of these instruments is a central challenge for the public
finance of climate change and has received considerable attention.
Tax and cap-and-trade schemes can be26
equivalent—in terms of aggregate emissions and
government revenue—if emission rights are auctioned, the structure of abatement costs is
known; and there is perfect competition in the markets for fossil fuels. Any outcome under
some carbon tax can then also be achieved by cap-and-trade: auctioning permits in an amount
equal to the level of emissions under the carbon tax will result in an equilibrium permit price
equal to that initial carbon tax; so each firm will emit the same amount and the government
will collect the same revenue. In practice, of course, these conditions rarely hold, and
instrument choice becomes a real issue.
Box 1 elaborates on the comparison between these instruments. For reasons set out there,
carbon taxation is then likely to be preferable to cap-and-trade. Recent experiences relating to
the global economic crisis, for example—which caused prices in the EU emissions trading
market to plummet during the second half of 2008—provides a powerful reminder that policy
must be set with imperfect knowledge of future mitigation costs (and serves to illustrate the
problem that setting a cap can lead to high price volatility in the carbon markets, potentially
harming long-term investment decisions). Hybrid instruments (combining features of both
taxes and caps) can improve on both, 27
though no instrument assures credibility—critical for
guiding efficient investments in long-lived capital of the type common in energy markets.
Carbon taxes provide certainty on carbon prices; cap-and-trade provides certainty on
aggregate emissions.
26
―Can be‖ rather than ―are‖ because equivalence also requires, for instance, effective competition in both
product and permit markets.
27 This general point is made by Roberts and Spence (1976).

14
Box 1. Aspects of instrument choice
Uncertainty tends to favor the use of tax- rather quantity-based instruments:
Errors in assessing marginal abatement costs will arise under either tax or cap-and-trade schemes, but
with different consequences (Weitzman, 1974).28
If marginal abatement costs prove higher than expected,
for example, cap-and-trade will lead to too much abatement (because it takes no account of that increased
cost) whereas a carbon tax will lead to too little (because it does not allow for the increased marginal
benefit of abatement when abatement is cut). In the climate context, such errors under cap-and-trade over
any relatively short period are likely to be more costly than those under taxation: this is because marginal
abatement costs rise rapidly as abatement increases, but emissions over any short interval make little
difference to the accumulated stock, and hence to marginal benefit from abatement. The consequent gain
from the use of tax schemes may be sizable (Newell and Pizer, 2003; see also Pizer, 2002 who argues for a
combination of price and quantity instruments).
Volatility of the carbon price may be greater under cap-and-trade, and international spillovers stronger,
since aggregate emissions cannot respond flexibly to aggregate demand shocks. This may discourage
mitigation-related investments by increasing the option value of waiting. In an international setting, the
same effect can cause adverse macroeconomic spillovers as increased growth in one country has an
amplified effect on the carbon price also faced by others (McKibbin and Wilcoxen, 2004).
Hybrids can in principle improve on either a simple tax or cap-and-trade. In practice, the choice is not
between an unchanging tax scheme and a fully predetermined path for aggregate emissions: each would be
updated in the light of emerging information, producing an outcome with elements of both. More generally,
faced with uncertainty in abatement costs, the best policy in principle is neither a simple tax nor cap-and-trade,
but a scheme allowing both the carbon price and total emissions to vary.29
Such hybrids can take many forms,
such as supplementing cap-and-trade with price caps and provision for ‗banking‘ (saving) and ‗borrowing‘
permits.
Credibility of future carbon prices is not easy to achieve under any instrument. One hybrid proposal, for
instance, involves issuing very long term permits, to create a vested interest in the maintenance of tight
emissions limits (McKibbin and Wilcoxen, 2002). Whether governments faced with an urgent need to limit
emissions would be willing to pay market prices to retire long-term permits, however, is questionable. And
carbon taxation may, through the revenue it raises, create a strong vested interest in the government itself. Some
degree of international cooperation seems likely to be needed, in any event, to support the credibility of
domestic policies.
Domestically, practical considerations tend to favor tax-based schemes. Implementing carbon taxes and
cap-and-trade both require monitoring payments and emissions. And since what matters is the amount of fossil
fuels ultimately burnt, not who does the burning, both can be implemented at any stage between ‗upstream‘
(extraction, refining or import) and ‗downstream‘ (the final burning). The general principle of restricting
monitoring to as few points as possible suggests in each case an upstream focus—but with the difference that
under cap-and-trade this may compromise the competitiveness of any auctioning process. Tax arrangements
also fit well with the established expertise of tax administrations in relation to fuel and other excises, whereas
cap-and-trade requires, in many countries, a new institutional apparatus. For the same reason, compliance for
firms may be less burdensome if existing tax schemes are strengthened rather than new trading mechanisms
28
A standard diagrammatic exposition of the Weitzman argument is in Jones and others (2007).
29 Dasgupta (1982), Roberts and Spence (1976). See Pizer (2002) for an evaluation of gains from such hybrid
schemes.

15
created.
The equivalence between taxes and cap-and-trade may also fail under imperfect competition
in fossil fuel markets. One reason is that fossil fuel demand is likely to be more elastic under
a carbon tax than under a given cap, simply because the cap defines a more rigid demand. A
fuel exporter that behaves monopolistically (as OPEC or some of its members may do) is
likely to react with a higher export price in the face of a cap than when facing a tax: in effect,
the cap serves as a coordinating device for imposing an export tax.30
In consequence, the
outcome for fuel importers will be less favorable under a cap policy.
The administrative implications of the two approaches also differ markedly. Implementing
cap-and-trade, for example, requires new functions including determining baselines,
allocating emissions rights, and verifying and enforcing compliance; it also raises a novel set
of tax issues, many with complex international aspects. These include, for instance, whether
to treat income derived from transactions in allowances as business income or capital gains.
Particular issues arise when allowances are allocated free of charge: if the value is not taxed
when received but only when the permits are sold, for instance, recipient firms may have an
incentive to defer this tax liability by banking permits, if possible, rather than selling them
now31
—so distorting the market for permits.32
Implementing an emissions tax, by contrast,
may often seem easier as systems of indirect tax collection, already in place in most
countries, can be harnessed.
This is however not to say that effective implementation of emissions pricing through carbon
taxation is necessarily easy. One problem is that several policy instruments are usually
brought to bear on fossil energy consumption, and thus on GHG emissions. Being obliged
(say by international treaty) to impose a higher than desired carbon tax, countries may be
able to undo parts of the effect of such a tax by manipulating other albeit less well-targeted
instruments (such as reduced rates of sales taxation). It can be difficult for an outside party to
verify that an effective cost increase for fossil fuels has, all in all, resulted.
The choice of instrument may also have political economy dimensions. Most obviously, there
has been a clear tendency to over-compensate producers through generous allocation of free
permits—a core issue returned to in Section IV.A below. A cap may be perceived as more
firmly based on the science of climate change, so depoliticizing a key fiscal choice. And it
30
See Strand (2010b).
31 See for instance Lucas (2010) and, on other tax issues raised by tradable allowances, Csikós (2007).
32 A number of administrative issues have also emerged. The EU ETS, for example, created opportunities for
―carousel‖ style VAT fraud. This prompted a variety of unilateral responses, with ―reverse charging‖—
imposing the VAT obligation on the buyer—ultimately adopted.

16
may be easier to charge consumers higher energy prices through quotas that push up
production costs rather than by imposing explicit taxes which appear on utility bills.
The cross-country allocation of revenue from carbon pricing may also in practice differ
between tax and cap-and-trade systems. Revenue from a carbon tax is commonly presumed
to remain in the country that levies the tax, which is taken to be that in which final use
occurs. (There is, however, no inherent reason why carbon tax proceeds should be allocated
on such a ―destination‖ basis.) Under international cap-and-trade, in contrast, countries where
abatement is relatively cheap would sell emission rights to those where it is costly. The
extent of the consequent transfers—and hence incentives to join the scheme—depends on
how emission rights are allocated. This is explored further below.
C. Rates, Revenue and International Flows
At what level should the carbon price be set?
The technical complexities and judgments required to calculate carbon price paths are
reflected in quite widely-varying estimates. One meta-study of estimates of the marginal
social damage from carbon emissions33
finds a modal value of around US$6 per ton of CO2,
and a median—the distribution being strongly right-skewed—of US$15/tCO2. (Tol, 2007).
The U.S. Environmental Protection Agency (2010) arrives at a central value—averaged over
a range of ‗Integrated Assessment Models‘ (see below) and at a discount rate of 3 percent—
of around US $25 per. The Stern Review (2007) estimate, towards the upper end of the
distribution, is US$85/tCO2; Nordhaus (2007), on the other hand, suggests a starting carbon
price of around US$5/tC. For comparison, the current EU ETS forward price (September
2011; for delivery in December 2011) is around € 12/tCO2.34
Since the business as usual
(BAU) projections from which they derive implicitly reflect current policies, the corrective
carbon prices these estimates imply should be seen as additional to existing measures.
These estimates are in some respects only moderately daunting: a charge of US$20 per ton is
equivalent to around US$8 per barrel of oil, or 20 cents per gallon of gasoline—well within
commonplace fluctuations. For coal, however—which accounts for around 44 percent of all
emissions from fossil fuels (compared to 37 percent for gasoline)—this is in the order of a
doubling of the price.
33
Since carbon pricing would reduce emissions and hence marginal social damage, estimated damage under
BAU overstates the corresponding Pigovian charge. Stern (2007), for example, has strong mitigation reducing
marginal damage to US$105/tC.
34See www.pointcarbon.com
17
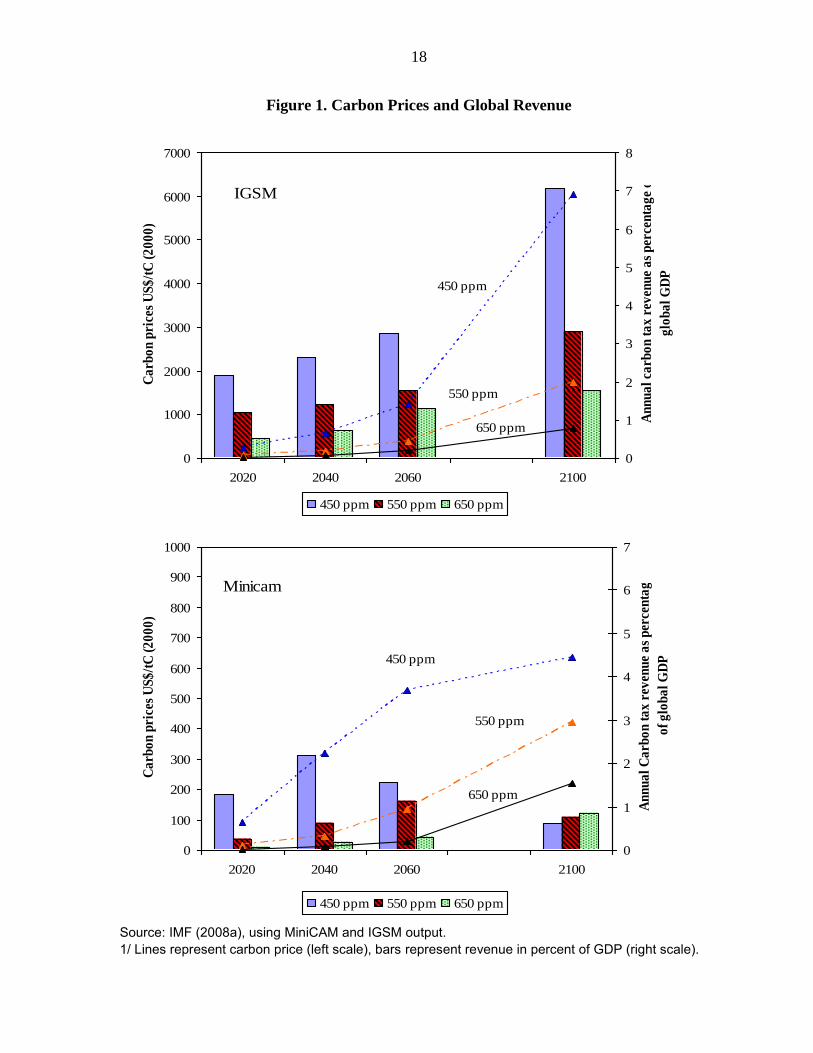
How much revenue is at stake?
To provide a broad and coherent view of possible prices of carbon prices and associated
revenues, this section reports results using two widely used ‗integrated assessment models‘:35
the ―IGSM‖ and ―MiniCAM‖36
and estimates in IMF (2008b) using the G-cubed model of
McKibbin and Wilcoxen (2002); the latter is similar to the IGSM but explicitly models
international capital flows. Results are reported for three stabilization objectives (Figure 1):
the most ambitious (450 pm; where concentrations include man-made non-carbon emissions)
is widely regarded as effectively unattainable and the highest (650 ppm) as very risky, so the
discussion focuses on stabilization at 550 ppm. All these model exercises assume that carbon
pricing is globally uniform.
In the IGSM, the carbon price (shown in the lines) rises from about US$20/tCO2 to
US$105/tCO2 (from US$10 to nearly US$50 per barrel of oil) by 2060. It is far lower
throughout under MiniCAM (note the different scales), mainly because baseline emissions
are far less, reaching US$37/tC02 by 2060.37
The potential revenue from appropriate carbon pricing is around 1–2 percent of global GDP
until mid-century—significant but not transformational. Revenue increases throughout the
century (except under the more aggressive MiniCAM scenarios, which achieve stabilization
much earlier), with the increasing carbon price more than offsetting any fall in emissions.
35
IAMs combine a wide range of economic and physical processes characterizing the human influence on, and
interactions with, the global climate (including both mitigation and adaptation). Their strength in the present
context is a relatively detailed modeling of energy use and mitigation opportunities. They (especially
MiniCAM) are less well-suited than G-cubed, which is an intertemporal general equilibrium model, to modeling
investment, savings, and balance of payment effects. An appendix to IMF (2008b) provides a detailed
comparison of these and other models.
36 See, respectively, Paltsev and others (2005) and Brenkert and others (2003).
37 Note that figures in the tables are given per ton C, which implies that in the tables, the respective prices per
ton CO2 are multiplied by a factor of about 3.6.
18
Figure 1. Carbon Prices and Global Revenue
Source: IMF (2008a), using MiniCAM and IGSM output. 1/ Lines represent carbon price (left scale), bars represent revenue in percent of GDP (right scale).
IGSM
450 ppm
550 ppm
650 ppm
0
1000
2000
3000
4000
5000
6000
7000
2020 2040 2060 2100
Ca
rbo
n p
rice
s U
S$
/tC
(2
00
0)
0
1
2
3
4
5
6
7
8
An
nu
al
carb
on
ta
x r
even
ue
as
per
cen
tag
e o
f
glo
ba
l G
DP
450 ppm 550 ppm 650 ppm
Minicam
450 ppm
550 ppm
650 ppm
0
100
200
300
400
500
600
700
800
900
1000
2020 2040 2060 2100
Ca
rbo
n p
rice
s U
S$
/tC
(2
00
0)
0
1
2
3
4
5
6
7
An
nu
al
Ca
rbo
n t
ax
rev
enu
e a
s p
erce
nta
ge
of
glo
ba
l G
DP
450 ppm 550 ppm 650 ppm
19
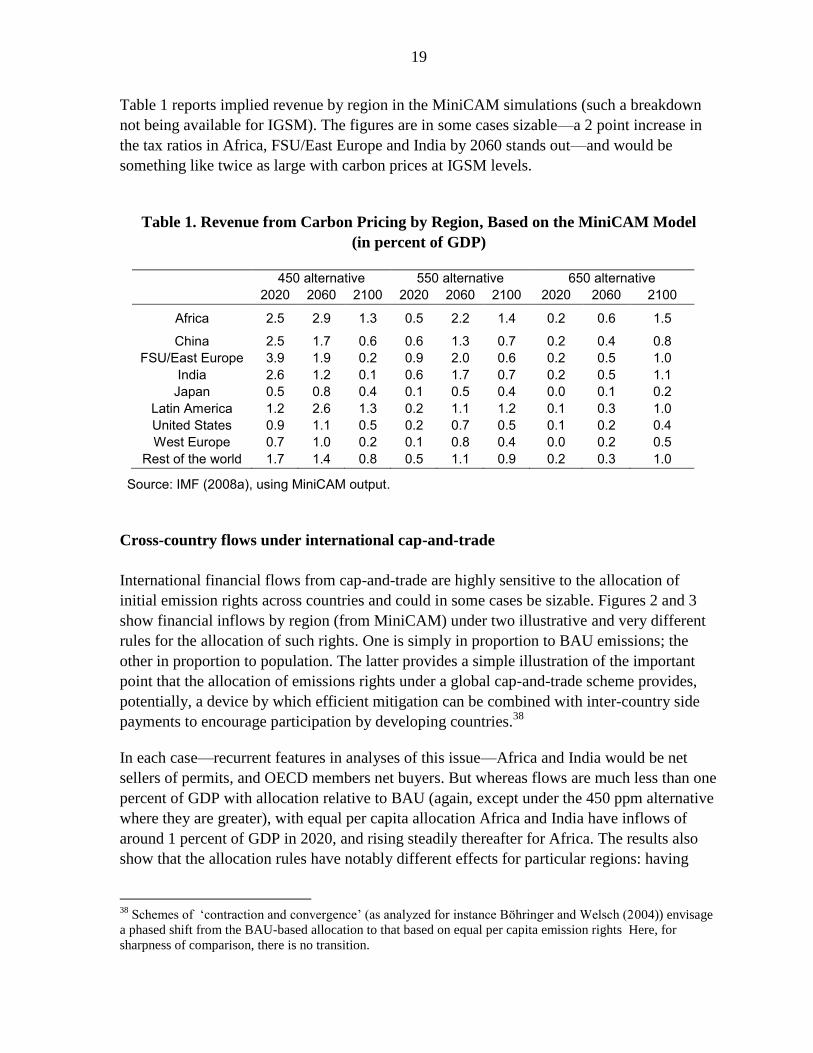
Table 1 reports implied revenue by region in the MiniCAM simulations (such a breakdown
not being available for IGSM). The figures are in some cases sizable—a 2 point increase in
the tax ratios in Africa, FSU/East Europe and India by 2060 stands out—and would be
something like twice as large with carbon prices at IGSM levels.
Table 1. Revenue from Carbon Pricing by Region, Based on the MiniCAM Model
(in percent of GDP)
450 alternative 550 alternative 650 alternative 2020 2060 2100 2020 2060 2100 2020 2060 2100
Africa 2.5 2.9 1.3 0.5 2.2 1.4 0.2 0.6 1.5
China 2.5 1.7 0.6 0.6 1.3 0.7 0.2 0.4 0.8 FSU/East Europe 3.9 1.9 0.2 0.9 2.0 0.6 0.2 0.5 1.0
India 2.6 1.2 0.1 0.6 1.7 0.7 0.2 0.5 1.1 Japan 0.5 0.8 0.4 0.1 0.5 0.4 0.0 0.1 0.2
Latin America 1.2 2.6 1.3 0.2 1.1 1.2 0.1 0.3 1.0 United States 0.9 1.1 0.5 0.2 0.7 0.5 0.1 0.2 0.4 West Europe 0.7 1.0 0.2 0.1 0.8 0.4 0.0 0.2 0.5
Rest of the world 1.7 1.4 0.8 0.5 1.1 0.9 0.2 0.3 1.0
Source: IMF (2008a), using MiniCAM output.
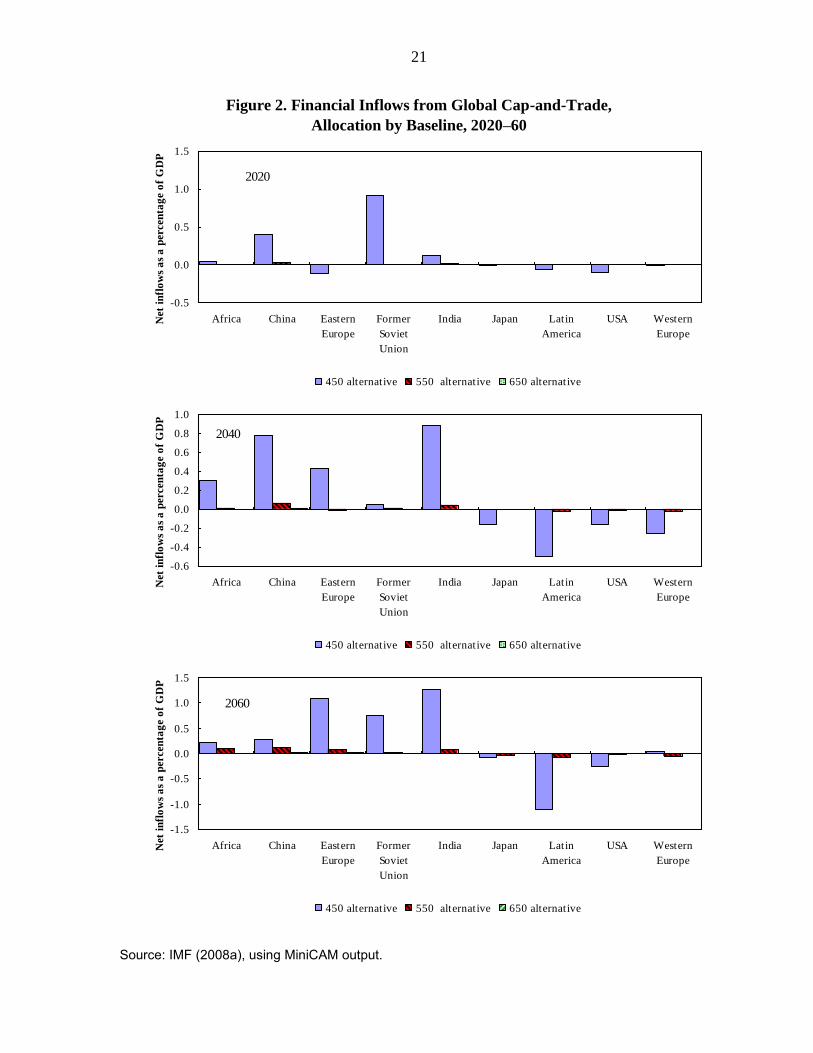
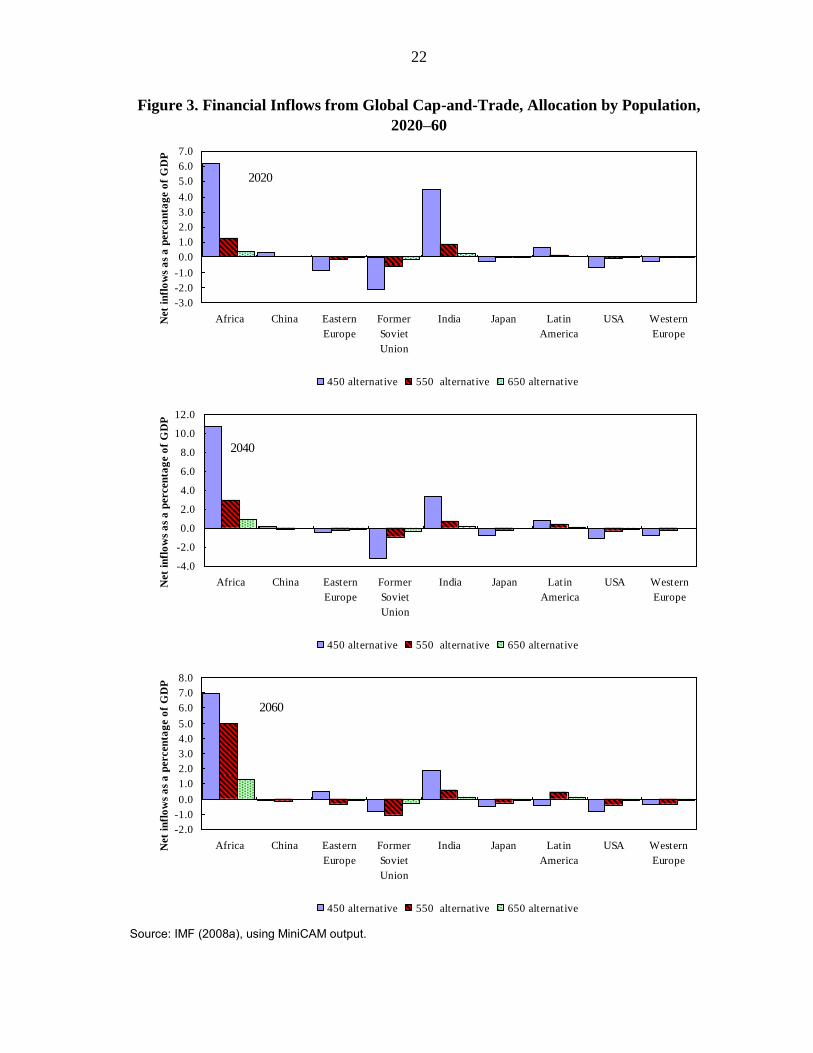
Cross-country flows under international cap-and-trade
International financial flows from cap-and-trade are highly sensitive to the allocation of
initial emission rights across countries and could in some cases be sizable. Figures 2 and 3
show financial inflows by region (from MiniCAM) under two illustrative and very different
rules for the allocation of such rights. One is simply in proportion to BAU emissions; the
other in proportion to population. The latter provides a simple illustration of the important
point that the allocation of emissions rights under a global cap-and-trade scheme provides,
potentially, a device by which efficient mitigation can be combined with inter-country side
payments to encourage participation by developing countries.38
In each case—recurrent features in analyses of this issue—Africa and India would be net
sellers of permits, and OECD members net buyers. But whereas flows are much less than one
percent of GDP with allocation relative to BAU (again, except under the 450 ppm alternative
where they are greater), with equal per capita allocation Africa and India have inflows of
around 1 percent of GDP in 2020, and rising steadily thereafter for Africa. The results also
show that the allocation rules have notably different effects for particular regions: having
38
Schemes of ‗contraction and convergence‘ (as analyzed for instance Böhringer and Welsch (2004)) envisage
a phased shift from the BAU-based allocation to that based on equal per capita emission rights Here, for
sharpness of comparison, there is no transition.

20
relatively high emissions but a relatively small (and shrinking) population, the Former Soviet
Union (FSU), for example, sells permits in one case but buys in the other.
Results are in important respects model-specific. Table 2 reports results using G-cubed, taken
from IMF (2008b). Though the exercises underlying the two sets of results are not fully
comparable—there are differences, for instance, in BAU projections and regional/country
coverage—they are in many respects qualitatively similar, and consistent with others. But
21
Figure 2. Financial Inflows from Global Cap-and-Trade,
Allocation by Baseline, 2020–60
Source: IMF (2008a), using MiniCAM output.
2020
-0.5
0.0
0.5
1.0
1.5
Africa China Eastern
Europe
Former
Soviet
Union
India Japan Latin
America
USA Western
Europe
Net
in
flo
ws
as
a p
erce
nta
ge
of
GD
P
450 alternative 550 alternative 650 alternative
2040
-0.6
-0.4
-0.2
0.0
0.2
0.4
0.6
0.8
1.0
Africa China Eastern
Europe
Former
Soviet
Union
India Japan Latin
America
USA Western
Europe
Net
in
flo
ws
as
a p
erce
nta
ge
of
GD
P
450 alternative 550 alternative 650 alternative
2060
-1.5
-1.0
-0.5
0.0
0.5
1.0
1.5
Africa China Eastern
Europe
Former
Soviet
Union
India Japan Latin
America
USA Western
Europe
Net
in
flo
ws
as
a p
erce
nta
ge
of
GD
P
450 alternative 550 alternative 650 alternative
22
Figure 3. Financial Inflows from Global Cap-and-Trade, Allocation by Population,
2020–60
Source: IMF (2008a), using MiniCAM output.
2020
-3.0
-2.0
-1.0
0.0
1.0
2.0
3.0
4.0
5.0
6.0
7.0
Africa China Eastern
Europe
Former
Soviet
Union
India Japan Latin
America
USA Western
Europe
Net
infl
ow
s a
s a
perca
nta
ge o
f G
DP
450 alternative 550 alternative 650 alternative
2040
-4.0
-2.0
0.0
2.0
4.0
6.0
8.0
10.0
12.0
Africa China Eastern
Europe
Former
Soviet
Union
India Japan Latin
America
USA Western
Europe
Net
infl
ow
s a
s a
percen
tag
e o
f G
DP
450 alternative 550 alternative 650 alternative
2060
-2.0
-1.0
0.0
1.0
2.0
3.0
4.0
5.0
6.0
7.0
8.0
Africa China Eastern
Europe
Former
Soviet
Union
India Japan Latin
America
USA Western
Europe
Net
infl
ow
s a
s a
percen
tag
e o
f G
DP
450 alternative 550 alternative 650 alternative

23
Table 2. International Transfers under Cap-and-Trade, Using G-Cubed1, 2
(in percent of GDP)
Region 2020 2030 2040
Annual emission rights proportional to initial emissions3
United States 0.02 0.11 0.22
Japan 0.00 -0.01 -0.04
Europe 0.00 -0.01 -0.03
China 0.32 2.16 5.95
Less developed countries -0.11 -0.59 -1.44
Eastern Europe and Russia -0.01 -0.05 -0.12
OPEC 0.08 0.29 0.53
Annual emission rights proportional to population share
United States -0.02 -0.32 -0.32
Japan -0.12 -0.24 -0.35
Europe -0.12 -0.24 -0.34
China 0.33 1.96 5.46
Less developed countries 0.71 1.08 0.77
Eastern Europe and Russia 0.29 -0.62 -0.87
OPEC 0.51 1.15 1.66
Source: IMF (2008b). 1 Emissions reduced by 40 percent from 2002 levels. 2 A positive value denotes receipt of transfers.
3 This allocation rule differs from that underlying Figures 2 and 3 (which is by emissions throughout the BAU path).
there are also differences. Most notably, China emerges as a modest buyer or seller in
Figures 2 and 3 but a large seller in Table 2:39
Intuitively, China‘s rapid growth points to a
high demand for rights to emit but relatively cheap opportunities for abatement points to a
high supply. This calls for great caution in interpreting the results, and stresses the
39
The wider literature also reaches divergent conclusions on China‘s position. Böhringer and Welsch (2004)
and the German Advisory Council on Global Change (2003), for instance, have China respectively selling and
buying permits.

24
importance of understanding better the relative ease of mitigation across countries and other
drivers of international permit trade.
D. Equity Aspects
Carbon pricing will affect the level and distribution of real incomes both within and across
countries.40
The degree of pass-through to final consumer prices to a large degree depends on the fuel
supply response. If this is relatively inelastic, most of the impact will be on producer prices,
and the rents associated with fossil fuel extraction. To that extent, the burden will fall largely
on fossil-fuel producing countries. Most of these are of course wealthy countries, but less
noticed, and not yet fully integrated into the policy debate, is that, as with recent oil
discoveries in Ghana and Uganda, an increasing number of lower income countries are
becoming oil producers and so, on this account stand to lose from more effective carbon
pricing.
In developed countries, increased fossil fuel prices are likely to have a regressive impact to
the extent that they fall on consumers. The impact on U.S. households, for example, of a
carbon price around US$50/tC is estimated to be quite strongly regressive,41
reflecting quite
large increases in the prices of electricity and gas (around 12 percent) and gasoline (around 8
percent). However, instruments to offset such effects are commonly available, at a cost less
than the additional revenue raised—for example, by reconfiguring the earned income tax
credit and social security payments in the US (Metcalf, 2007), or by removing excises on
electricity (‗wire taxes‘) that are mandatory in the EU. Other benefits targeted to vulnerable
groups, such as the winter supplement to pensioners in the United Kingdom, may also play a
role.42
Compensating measures need to be carefully designed, however: reduced indirect tax
rates on energy-intensive products, for instance—such as the lower VAT rate on electricity in
the United Kingdom—compromise climate objectives and are poorly targeted on vulnerable
groups. Ultimately, the scale of the problem should not be over-stated: the energy price
increases at issue are fairly moderate relative to those experienced from market fluctuations
in recent years.
Distributional effects are less clear-cut in many developing countries, where the first step
towards effective carbon pricing is in many cases eliminating remaining fuel subsidies, both
explicit and implicit. Coady and others (2010) suggest that halving energy subsidies in
40
And across generations too, as discussed in Section II above.
41 Hassett, Mathur, and Metcalf (2007) show, however, that, for familiar reasons, regressivity is much less
marked when assessed from a lifecycle perspective; and, perhaps more surprisingly, that there is relatively little
regional variation in the impact in the U.S.
42 Dresner and Ekins (2006), however, argue that the wide variation in energy efficiency make it hard to protect
all the poorest against increased energy prices in the U.K.

25
developing countries—which had a revenue cost of around $250 billion in 201043
—could
reduce greenhouse gas emissions by nearly 5 percent by 2050. Often substantial—17 percent
of GDP in Azerbaijan, 13 percent in Iran, and 9 percent in Egypt—petroleum subsidies are
an expensive and inefficient way of supporting the poor: fuel and fuel-intensive goods
account for a larger share of the spending of the poor, but the rich spend absolutely more on
them.44
More generally, distributional effects will depend on patterns of consumption: the
effect through gasoline prices is more likely to be regressive where car ownership is high,
and that through kerosene more regressive where its use for household lighting and heating
more common. An eye also needs to be kept open for unintended side effects: increasing
kerosene prices, for instance, may induce substitution towards burning wood, with adverse
implications for both health and deforestation.
Even where tax-benefit systems are relatively weak, there may be better-targeted ways of
protecting the poor than by subsidizing energy use. Ghana, for instance, accompanied fuel
price increases with the elimination of school fees for primary and secondary education.
Outright earmarking of revenues from carbon pricing can be a tempting way to appease
opponents, and indeed casual inspection suggests more generally that environmental taxes
are more commonly earmarked than are other taxes. One can see reason for that: since the
main purpose of environmental taxes is to change behavior rather than raise revenue,
pressures arise to compensate the losers and ensure that the proceeds are not spent
wastefully—which earmarking can, in principle, do.45
But earmarking has considerable
disadvantages too, If it genuinely constrains expenditure, it almost certainly makes it
inefficient and inflexible: the economic rationale, for example, for allocating part of the
proceeds from the Clean Development Mechanism (CDM) to an Adaptation Fund is unclear,
since there is no link between the appropriate revenue from mitigation and the appropriate
spending on adaptation. But if earmarking does not constrain spending, it is essentially an
exercise in obfuscation. The question is whether these drawbacks may be a price worth
paying if no other way can be found to overcome resistance.
Less studied and largely absent from public debate than effects through consumer prices are
the distributional effects from carbon pricing that can also arise on the income side of
households‘ accounts. Fullerton and Monti (2010) emphasize the potential importance of
changes in relative wage rates across different segments of the labor market—and suggests
43
IEA (2010) estimates global subsidies across all fossil fuels at approximately $550 billion per year: about
$300 billion for oil, $200 billion for gas, and $50 billion for coal; about$100 billion is subsidized electricity
generation inputs, and the rest direct use subsidies. See also Joint Group Report (2010).
44 See for instance the review of experience in Coady and others (2006).
45 See OECD (2006) and Brett and Keen (2000).
26
that a higher propensity for low-skill workers in the US to be employed in emissions-
intensive sectors may raise some distributional concerns.46
IV. ASSESSING AND IMPROVING MITIGATION POLICIES
This section turns to practice: issues in current approaches to carbon pricing, and in fostering
international cooperation.
A. Current Carbon Pricing Policies
Incoherencies
Fully comprehensive carbon tax regimes, uniform across emission and sectors, are very few.
The cleanest examples are Australia, which plans such a tax (in transition to a trading
scheme) from 2012, Mauritius and British Columbia. Denmark, Norway and Sweden were
early actors in the area, though in each case there are significant exemptions. Cap-and-trade
schemes are somewhat more common: in New Zealand, the Regional Greenhouse Gas
Initiative covering ten U.S. states, and, most extensive, the greenhouse gas Emissions
Trading Scheme of the EU (EU-ETS). The last covers only about 45 percent of GHG
emissions in the EU region, although its expansion to new sectors including international
aviation and gases such as Nitrous Oxides is planned for the next phase.
More widely, however, a wide variety of taxes, generally designed with other considerations
more paramount, affect emissions. The most obvious are the excises—or subsidies—on
petroleum products (differing from systematic carbon taxation in that they are not calibrated
to the varying carbon contents of the various fossil fuels), but there are typically many others.
Emissions from transportation, for example, may be affected by the tax treatment of
company cars, or by the import duties on cars, progressive in vehicle weight and motor size,
common in some European countries (including Denmark and Norway). And regulatory
provisions have effects in some respects akin to carbon charging. In fossil fuel producing
countries, fiscal arrangements also impact extraction and hence emissions.
The overall picture is often one of considerable incoherence. The recent Mirrlees Review
(2011) of the U.K. tax system points out, for instance, that the range of relevant instruments
imply an implicit charge per tonne of CO2 that ranges from infinity for nuclear power,
through £43 for business use of gas to zero for gas used for domestic heating.47
And the
existence of the EU-ETS can negate the impact of some measures bearing on emissions
outside the sector it covers: measures to reduce household use of electricity, for instance, will
tend to lower the price power companies are willing to pay for their permits—which will
then simply be taken up by other emitters.
46
This result rests on assumptions regarding the elasticity of substitution between clean capital and different
labor types, which may also vary across countries. 47
And £250 for petrol, though comparison is questionable as the dominant externality is in this case congestion.

27
Efforts towards greater coherence in energy tax policies do seem to be gathering momentum
in some cases. The EU, for example, has recently (in April 2011) proposed amendments to
the Energy Taxation Directive—having extended the framework of minimum excise rates to
a broader range of fuels in 2003 (albeit with some notable exemptions)48
— to shift the base
from fuel consumed towards the quantity of emissions produced. But there remains
significant scope and need in many countries for taking inventory of the various policy
measures for affecting energy use, so as to assess their coherence, transparency, and
effectiveness. Excessive complexity often follows when pursuing several objectives with a
single instrument. Fuel excises in developed countries, for example, are used not only to raise
revenue, but also to correct for congestion and other externalities associated with road use.
As technological developments allow more effective congestion pricing, fuel excises could
be restructured—and perhaps lowered—so as to focus more sharply on the mitigation
objective that they are best suited to serve.
The diversity of fiscal and other instruments of energy policy complicates cross-country
comparisons, impeding effective coordination. A common policy, such as a minimum carbon
tax, would need to recognize measures already in place. But the variety and complexity of
these—including differing reliance on regulation—make them hard to compare. Closer
international coordination would increase each country‘s interest in measures adopted by
others, so that coordination would be facilitated by greater coherence, simplicity and
transparency of fiscal policies towards energy. It may also be facilitated by coordinated data
gathering—along the lines of the database on environmentally-related taxes and charges
maintained by the OECD and the European Environment Agency49
—and analytical work to
assess implied effective rates of taxation on carbon emissions.
The first step to proper carbon pricing in many countries is to impose appropriate (non-
climate related) fossil fuel taxes and equalize them across types when corrected for local
externalities. Raising fuel prices is called for, even absent climate concerns, not only in most
developing but also in some higher income countries: Parry and Small (2005) conclude, for
example, that—given the multiple objectives being served—fuel excises were ―too low‖ in
the United States in 2000. Parry and Strand (2011) draw the same conclusion for Chile,
despite its having the highest gasoline tax rate in Latin America. Applying the same
framework across a broader set of countries, Ley and Boccardo (2010) find that (under the
base assumptions) motor fuels are under taxed in six major countries (China, Russia, the
U.S., Brazil, Mexico and Canada) which together account for more than 40 percent of total
global transport-related GHG emissions. Many tax systems continue to be unduly favorable
to diesel.
48
Including for electricity used in the production of chemicals and metals (two major polluting sectors). These
sectors are however today covered by the EU-ETS and thereby already subject to a carbon emissions price.
49
Available at http://www2.oecd.org/ecoinst/queries/index.htm.

28
Not least, fuel used in international aviation and shipping—which collectively account for 6
or 7 percent of global carbon emissions—is essentially uncharged. While carbon pricing is,
as ever, the preferred instrument, particular obstacles arise in each case. For international
aviation, treaty commitments and bilateral air service agreements may impede effective
carbon pricing; ticket; less well targeted ticket taxes may then have a role, also helping
address distortions arising from the typical exclusion of international air travel from sales
taxation. In international shipping, the extraordinary mobility of the tax base—large ships
can travel the world on a single bunker of a fuel—make widespread international cooperation
essential for an effective charging scheme, with many developing countries fearing the
impact that this would have on them—absence explicit compensation. Keen and Strand
(2007) and IMF and World Bank (2011) review these issues and possible solutions.
The importance of auctioning permits
Realizing the fiscal benefits of cap-and-trade requires that rights be purchased by emitters,
not allocated to them for free. In the first stage of the EU-ETS, for instance, at least
90 percent of permits were allocated free of charge. Looking forward, while future allocation
rules remain subject to some uncertainty, the share of emissions rights to be auctioned under
the EU ETS is expected to increase after 2012, to perhaps around 50 percent of the total
allocation by 2020 or so (although the industrial sector is expected to continue to receive
virtually all permits free at least until 2015). However, overall revenue losses due to
incomplete auctioning for EU governments may not diminish substantially, given expected
increases in permit values (under a tighter cap) and broader coverage of the scheme. Similar
trends appear to be emerging in the United States, where recent draft legislation implied that
government effectively would forego $670 billion of the $850 billion in emissions quota
value projected for 2011–19.50
Allocating free rights in relation to past emissions—‗grandfathering‘—is of course a way to
limit any adverse impact on affected firms: setting the allocated amount equal to historic
emissions ensures that the firm can maintain its profit unchanged simply by acting as it did in
the absence of the permit requirement. Indeed such an a allocation over-compensates, since
by slightly cutting emissions the firm can receive income by selling rights while having no
first-order effect on its permit-exclusive profits.51
Free allocation can thus result in increased
profits even if set at a level somewhat below past emissions. And in imperfectly competitive
environments, profits can increase still more if the permit system acts as a coordinating
device for competing firms to collectively reduce output. Erring on the side of over-
compensation by grandfathering allowances may in some cases be reasonable where firms
have sunk large investments before emissions charges were thought of. But with the climate
debate now far from new, the force of such considerations is now considerably less. Current
50
CBO (2009).
51 Loosely speaking, the gain will be greater the less concave are permit-exclusive profits in emissions; a low
elasticity of demand, for instance, is in this respect conducive to larger private gains.

29
and prospective levels of free allocation likely create windfall profits for firms, and do little
to shield consumers from increased prices of energy-intensive products. Burtraw and Palmer
(2008), for example, estimate that free transfer of just 6 percent of emissions rights would be
sufficient to fully compensate electricity producers for any resulting reductions in their value
(although other studies put the figure somewhat higher—perhaps 25–30 percent).52
Grandfathering can also cause inefficiencies: when firms expect future free allocations to
reflect current emissions they may fail to abate (and sell permits) even when their own
abatement costs are below the permits price—and hence, below those of other emitters.
Benchmarked updating of free allocations over time—for example, where the allocations are
based not on actual emissions from each firm but instead on (hypothetical) emissions given
that best-practice technology is—may limit these problems. But this is likely to be
administratively complex when compared to auctioning, and has the added disadvantage that
auctioning revenue to the government is still foregone.
At a minimum, where grandfathering is politically unavoidable,53
the value of grandfathered
rights should at least be formally recorded as a tax expenditure, opening the issue up to
public debate.
Addressing deforestation
Establishing incentives for reduced deforestation--accounting for about 20 percent of
emissions, and often presumed to be a particularly cheap form of abatement—remains a
priority. This market was outside the scope of the Kyoto Protocol, due to both the conceptual
challenges posed and problems in forestry governance. Some progress is now beginning to be
made: the World Bank‘s Forest Carbon Partnership Facility, for example, is providing
capacity building support and piloting incentive schemes. The ―Copenhagen Accord‖ of 2009
highlights reduced emissions from deforestation and degradation as central to future
international cooperation; Norway, for instance, has pledged $1 billion each in support for
reduced deforestation in Indonesia and Brazil.
However, significant carbon market reform is likely to be needed in order to deliver on these
objectives. Extending formal emissions trading to forestry markets, for example, or allowing
firms to meet their caps through purchase of international deforestation ―offsets‖ could
help—subject to the necessary monitoring and verification assurances on the supply side—to
mobilize finance for forest preservation in developing countries on a larger scale than could
52
The lower figure partly reflects that fact that firms may also benefit from induced growth in other sectors:
many utilities, for example, have direct commercial interests in renewables.
53 Bovenberg, Goulder, and Jacobsen (2008) show that instrument choice may be affected if political economy
dictates that firms be compensated: imposing a carbon tax and compensating by lump sum transfers may be
inferior to command-and-control measures, for instance, because of the cost of financing those transfers from
distortionary taxation.

30
be achieved from public funds. However, restrictions on the importation of forestry credits
are currently anticipated on deforestation offsets on firms regulated under the next phase of
the EU ETS. Accelerated efforts to reduce relevant administrative concerns in host countries,
and limit any residual risks for example through some (albeit not complete) import
restrictions, and/or market segmentation, seem needed.
B. International Coordination
A fully coordinated approach would involve a uniform carbon price in all countries, with
cross-country transfers addressing any fairness concerns—but a range of national fiscal
concerns impede such a cooperative outcome.54
Perhaps most fundamentally, a dominant
concern in fuel pricing—at the heart of the free-rider problem in relation to implementing
climate policy—is each country‘s fear that unilateral action would disadvantage producers of
energy-intensive products (such as aluminum, paper, steel, and international transport) in
world markets; a concern exacerbated by the perception that much of the burden of this
would fall on developing countries not responsible for the buildup of greenhouse gases.
Exporters of fossil fuels have an incentive to resist carbon prices to the extent that these may
impact their rents55
(and, by the same token, an incentive to impose and collect such charges
themselves, if they are to be imposed at all). Energy security concerns could point in the
same direction, but may relate more to the diversity of supply than to the level of demand.
Incomplete participation in mitigation efforts is likely to result in significant inefficiencies.
While emissions are concentrated among relatively few countries—25 account for about
80 percent—wider agreement is likely to be needed for efficient and effective mitigation. The
wide inter-country variation in and steepness of marginal mitigation costs suggest a strong
efficiency case for ―broad-but-shallow‖ over ―narrow-but-deep‖ agreements: OECD (2009),
for example, shows that both the mitigation costs and leakage rates fall rapidly when the
scope of any coalition is broadened. Nonetheless, game theoretic analysis in this context—
while generally cautious on the overall prospects for a stable and effective international
environmental agreement on greenhouse gases controls—suggests that a small coalition of
large emitters may offer most promise in this regard.56
This argue for seeking a deal between
the (relatively few) major emitters rather than the universe of countries.
54
In the absence of international transfers, it is worth noting, uniform carbon pricing across countries may be
not only inequitable (Sandmo, 2005) but Pareto inefficient. This follows from the results of Keen and Wildasin
(2004).
55 Conversely, importers of fossil fuels have a collective incentive to use carbon taxes or tariffs to extract rent
from exporters; and exporters have a corresponding incentive to manipulate supply. The net outcome could, in
principle, be carbon taxes that, from a global climate perspective, are too high rather than too low (Strand,
2008). Of course, given the likely damage projected under BAU, this is not the dominant effect at work.
56 This is because the optimal response to defection by one of more parties in the case of a small coalition
of large emitters—to substantially reduce their mitigation activity—acts as a stronger deterrent than in the
case of a large group (where defection by one country affects the optimal effort of remaining signatories
only marginally). See, for example, Bloch (1997), Finus (2001), Finus and Rundshagen (2003), Barrett
(2003), Rubio and Ulph (2006, 2008).
(continued)
31
The effectiveness of coordination by some subset of countries—and the incentives for
unilateral action—depend on the likely extent of ‗leakage,‘ by which is meant the prospect
that the effect will be to some degree offset by increased emission by non-participants—
whether through relocation of polluting industries or, more important in several studies, in
response to reduced world prices of fossil fuels. The potential extent of leakage remains
unclear, and available studies are rarely comparable. Some put leakage rates under the Kyoto
Protocol in the order of 5-15 percent on average.57
However, leakage from unilateral or
weakly coordinated measures could be much more marked in markets for energy intensive
traded goods (such as iron and steel): perhaps 40-50 percent for some US industries.58
All this (and practical experience) suggest that some change in the rules of the international
negotiations game—beyond expecting simple agreement on an common global carbon
price—is needed if real progress is to be made.
Combining international cap and trade with side payments implemented through the permit
allocation rules, discussed above, is one such approach. Another has been to search for
alternative negotiation frameworks that would provide a mechanism for effective and
efficient agreements. Cramton and Stoft (2010), for instance, propose a scheme in which
each country proposes a carbon price to be applied by all, the lowest proposed is
implemented by all, and each then receives a transfer proportional to the shortfall of its own
emissions from the average. Though this does not assure a first-best outcome,59
it does limit
free-riding by providing countries, when choosing what price to bid, assurance that their
efforts will be matched by others. Whether it satisfies the participation constraint is less
clear: some fossil fuel producers, for instance, may require a zero price to be included in the
scheme; which may require that some countries be left out of agreement with significant
effect on global emissions. In any event, the advantage of the Cramton-Stoft scheme over
other proposed schemes lies in the voluntariness of chosen emissions prices, and that even
voluntary prices can lead to substantial global mitigation.
There are other approaches closer to the current policy debate. One standard prescription for
responding to downward pressures on low rates from international tax competition—adopted
in the EU, for example, for excises—is to adopt not common but minimum rates. This
provides some protection for countries wishing to set relatively high rates, potentially
57
See Paltsev (2001), and Kuik and Gerlach (2007). Model simulations in Rosendahl and Strand (2011)
however indicate that average leakage resulting from CDM projects could be closer to 30 percent.
58
Fischer and Fox (2007) Ho, Morgenstern, and Shih (2008).
59
The scheme proposed by Altemeyer-Bartscher, Rübbelke, and Sheshinski (2010) permits efficiency by ,
considering two negotiators who offer each other take-it-or-leave-it deals on the tax they are to charge and the
side-payment to be received; but, unlike the Cramton-Stoft scheme, it is not in general budget neutral.

32
inducing them to increase their rates by enough to benefit even countries obliged to raise
their tax.60
Another approach, focused on addressing leakage concerns and potentially encouraging
participation, is the use of border tax adjustment (BTA): remitting the carbon price content of
exports and imposing corresponding charges on imports. This has the merit of preserving
mitigation in respect of domestic consumption without impacting international
competitiveness: more formally, Keen and Kotsogiannis (2010) establish conditions under
which Pareto-efficient tariff and carbon tax structures require simple BTA of this kind.61
BTA, moreover, it is one of the few credible devices by which countries implementing
carbon pricing can encourage participation by others: participants gain, presumably, from the
BTA; and nonparticipants would then benefit by imposing a carbon price themselves, since
by doing so they would capture revenue otherwise accruing to others. Not the least of the
advantages is that this encouragement of participation comes without explicit side payments,
which can be politically problematic, especially when the payments need to go between
countries with tense relations. Against this, however, BTA risks hiding tariffs or export
subsidies, and may be WTO-inconsistent.62
It also raises many practical issues, including the
need to assess carbon prices implicit in taxes paid abroad (perhaps in a chain of production
activities across several countries).
Administrative aspects loom large in reaching international agreements, and may affect
instrument choice. Most fundamentally, instruments may differ in their ability to reassure
each participating country that others are honoring their obligations. Under a tax scheme,
countries would need confidence that others are not offering subsidies or tax breaks that
offset the impact of the carbon tax itself. Under a trading scheme, they would need assurance
that the governance of permit schemes (including the use made of any quota rents) is sound.
Agreement on principles for monitoring, reporting and verification of emissions and
mitigation policies and actions has proved particularly contentious in ongoing international
negotiations, raising sensitive issues of national sovereignty. Nevertheless, if tax rules are
transparent and readily comparable across countries—which may require simplification (or
extensive analysis) of energy tax structures, as discussed above, as well as addressing a range
of emerging technical issues—carbon taxes might on this account be preferable.
International cooperation on fiscal aspects of mitigation remains extremely limited and
flawed, but one can find some encouraging signs. The EU-ETS, for example, has been
marred by incomplete coverage, extensive grandfathering and inappropriate entry/exit rules.
60
Kanbur, Keen, and van Wijnbergen (1995).
61
They note too that there is no efficiency case for BTAs when non-participating countries use cap-and-trade,
since they then have no impact on emissions there.
62 McLure (2011) provides an extensive analysis of the legal issues. Ultimately, the issue will remain moot until
some case is brought to the WTO.
33
But it has shown the technical feasibility of international cap-and-trade schemes, at least
among closely-related countries; there is perhaps hope of ultimately linking such schemes.
Similarly, the Clean Development Mechanism (CDM)—which remains the primary
instrument by which the efficiency of mitigation obligations taken on by developing
countries may be met by exploiting opportunities for cheap mitigation in lower income
countries—has suffered from administrative and, still more fundamentally, conceptual
difficulties (Box 2). But it has started to build a framework, short of fully global carbon
pricing schemes, for encouraging developing countries‘ participation in achieving globally
efficient mitigation.
Box 2. Carbon Credits and the Clean Development Mechanism (CDM)63
Carbon credits enable those subject to emissions restrictions to meet them in part by purchasing emissions
reductions from those not so restricted. This is the nature of the CDM, under which support of emissions-
reducing projects in lower income countries is creditable against Kyoto commitments. The CDM (with a
maximum trading volume of about US$8 billion in primary markets for 2007; which has however dropped and
stood at about US$3 billion in 2009) has been the primary means of encouraging mitigation in developing
countries. Behind criticisms of the CDM as overly-bureaucratic, now being addressed in part by strengthening
programmatic as well as project-based support, lie two fundamental difficulties with offset schemes (which
would also apply, for example, to schemes providing payment for avoided deforestation): identifying the
baseline relative to which emissions reductions are measured, and ensuring that such reductions are not
undone by increases elsewhere (Rosendahl and Strand, 2011).
The prospect of catastrophe, it might be thought, might concentrate minds and facilitate
international cooperation. Barrett (2011) shows that his is indeed he case when there is a
single, known trigger point for disaster. But this is not so in the more plausible case of
multiple and/or unknown thresholds: these effectively ‗smooth out‘ the problem once more,
so that the standard enforcement problem remains.64
V. FISCAL ASPECTS OF ADAPTATION65
AND CLIMATE FINANCE
Adaptation to climate change arguably poses much less fundamental fiscal challenges than
does mitigation. Much adaptation will occur as spontaneous private sector adjustment in
response to (observed and predicted) climate changes.66
Slow-moving temperature changes
63
For further references and discussion, see World Bank (2010).
64 A further issue stressed in the literature is that the possibilities of catastrophes when GHG concentrations
exceed particular levels makes ―quick fixes‖ such as air capture, which could be very expensive, viable options;
see Sarewitz and Nelson (2008), Barrett (2009).
65 Though some aspects of climate change can of course be beneficial, the focus here—the dominant concern in
the policy debate—is on harmful effects. (Much the same analysis applies, however, in both cases: both limiting
harm and exploiting opportunities, for instance, are likely to be costly at the margin).
66 Sometimes called ‗autonomous‘ adaptation..

34
can be expected to generate relatively smooth market responses: ski resorts, for example, will
be run down in areas experiencing less snowfall and built up in those experiencing more.
Such market responses will have fiscal effects, but, with exceptions, seem unlikely to pose
problems more challenging than those from the changing circumstances to which economies
are routinely subject. More generally, for developing countries the distinction between
adaptation to climate change and development more generally is hazy at best: for example,
since agriculture is the main economic sector most vulnerable to climate change, a key way
of adapting to climate change is to develop into other activities; and strengthening wider
social insurance schemes can improve resilience to extreme weather events, as it does to
other traumas.
Indeed some see only a very limited role for government in this area: ―National governments
and international organizations have little to do with adaptation, and should not try‖ (Tol,
2005; p.577). Certainly international spillovers and the need for cooperation are not in this
case center-stage,67
and policy responses will reflect national and local differences in wider
views as to the proper role of government. Nonetheless, there does arise a potential purposive
role for government in traditional functions of providing public goods and addressing market
failures.
A. Fiscal Implications of Adaptation—Key Elements
Balancing adaptation and mitigation
Adaptation and mitigation are, by and large, substitutes:68
the more mitigation is done, the
less climate change there is to adapt to. Since each is costly, there is thus a trade-off to be
made between them. And, also by and large, mitigation is (or should be) primarily a potential
source of government revenue while the most prominent fiscal responses to adaptation—as
will be seen—involve additional public spending. How best to make that trade-off thus
depends on wider fiscal circumstances: broadly speaking, the greater is government‘s need
for revenue for its wider purposes the more attractive will be using carbon pricing to limit
climate damage rather than public spending to adapt to it.69
67
Some regional or global cooperation may of course be required in some areas: to improve management of
water systems, for example, or strengthen regional weather forecasting.
68 See, in particular, Tol (2005). This is however not always the case—planting mangrove in coastal areas both
protects against storms and sequesters carbon, for instance—but is the general tendency.
69 To see the point more formally, suppose that private welfare is , where ,
strictly increasing and concave, captures the benefits from emissions E, which are taxed at rate T, while R is
some item of non-climate-related public spending with its relative value, and damages D are strictly
increasing and convex in emissions, strictly decreasing and convex in public spending on abatement A and
(derivatives denoting subscripts) with When the government optimally chooses both T ( and hence ,
from , emissions) and A, subject to it is straightforward to show that an increase in
leads to higher T and lower A.

35
Given the severe fiscal challenges that many advanced economies face in the coming years,
this straightforward point—ultimately about the relative use of taxing and spending
instruments—is of some importance. It has seemed easier for governments to launch
spending measures addressed to climate change—subsidies for renewables, promises to
finance mitigation and adaptation in developing countries—than to deploy revenue-raising
instruments to limit it. This tilt of policy, increasingly inappropriate, risks creating significant
inefficiency.
Public goods and adaptation
Adaptation potentially requires increased public expenditure both on climate-related public
goods and to protect public programs driven by other concerns. Information acquisition and
dissemination—on changing precipitation patterns, for example—is one such public good,
whose provision requires public intervention (though delivery and some aspects of finance
may be left to the private sector). Traditional big ticket items of public expenditure
potentially affected include transport networks, water and health systems, and sea defenses.
Additional spending will also be needed to protect wider investments, though full ‗climate-
proofing‘—in the sense of removing all effects on some project or activity--is generally not
optimal: the investments themselves may need reconsideration, and some residual climate
risk accepted.
Uncertainties and irreversibilities require balancing precautionary spending on adaptation
against the risk of undertaking costly expenditures that may prove unnecessary. The
considerations discussed in Section II.B point to gradualism and flexibility in incurring sunk
costs to deal with inherently uncertain climate challenges. This is essentially a matter of
project design: for example, in identifying efficient adaptation options for coastal zones
(IPCC, 2007). As an example of this ‗real options‘ approach, World Bank (2010) cites
dealing with the possibility that aircraft will need longer take-offs in hotter climates not by
building now a long enough runway to provide for possible needs but a shorter one combined
with an option to purchase additional land as needed. Much of this is essentially common
sense—which of course is not so common in practice. The analytical point is simply that
where public investments involve heavy sunk costs, the option value of waiting can be high;
a point already referred to in Section II above and studied e g by Pindyck (2000).
Fiscal measures to facilitate private sector adaptation
Market failures may impede private adaptation. Private agents may be imperfectly informed
(systematic climate change may be hard to infer where the natural climate is variable, for
instance); credit market imperfections may hamper adaptation requiring substantial
investments; insurance may be unavailable or unaffordable; the Samaritan‘s dilemma70
may
70
This is the tendency for under-insurance by those who expect external help in the event of adversity: those
supplying the help would wish to limit its extent by committing to relatively low support—but their
benevolence makes it hard to do so credibly.

36
lead to inefficiently low adaptation; and the private sector may discount too heavily (so
spending too little on projects more robust to longer-term climate developments).
Fiscal instruments, particularly tax measures, may not be the best response to such failures. If
the expectation of ex post assistance leads to excessive location in flood-prone areas, for
instance, one response is to tax the use of such land. But where administration is weak,
zoning regulations, even if less efficient (in denying use even to those willing to pay a proper
price) may be more practicable. Other fiscal measures may be tempting but poorly-targeted:
tax breaks or subsidies for insurance, for example, reduce public revenue but do not
overcome the Samaritan‘s dilemma.
In some cases, significant barriers to private sector adjustment may themselves arise from ill-
designed public policies. Perhaps most notably, the under-pricing of water in many
developing countries may not only weaken public finances but impede market signals that
would promote effective responses to increasing shortages: World Bank (2010a, p. 91)
speaks of ―…a clear parallel [between water pricing reform and] the importance for
mitigation of pricing reform in the energy sector.‖
Dealing with fiscal risks
Intervention may be appropriate to facilitate private insurance. Insurance does not reduce the
physical damage from climate change (and through moral hazard effects could worsen it).
But it can reduce the consequent welfare losses, including by reducing implicit fiscal risks.
One response to the Samaritan‘s dilemma, for instance, is to make purchasing insurance
mandatory. In many developing countries, however, market insurance may be unavailable or
unaffordable for large groups at actuarially fair rates. There may then be scope for public
intervention to provide or facilitate access to risk markets: in Malawi, for instance, the World
Bank and donors provide drought insurance.71
Recent financial innovations point to new ways of coping with some climate-related fiscal
risks.72
The Caribbean Catastrophe Risk Insurance Facility (CCRIF), for example—bringing
together CARICOM countries and launched with donor support in 2007—pays out in the
event of parametric trigger points (such as hurricane wind speeds) being exceeded.73
It is
estimated to offer premia about 40 percent below market rates, and provides rapid payment if
disaster strikes. The scheme is limited in several respects: verification has proved more
contentious than expected, for instance, and pooling among countries subject to correlated
shocks limits the benefits from risk-spreading. But it indicates scope for addressing fiscal and
other risks from climate change through insurance mechanisms (and is an instance of
71
See Syroka and Musifora (2010).
72 IMF (2008b) provides a more general discussion of the role of financial markets in dealing with climate
change.
73 See http://www.ccrif.org/

37
effective regional collaboration in addressing adaptation challenges). Potentially even more
promising, as tapping more deeply into global capital markets, is the sovereign issue of
catastrophe bonds (for which principal is forgiven if disaster strikes); Mexico, for example,
issued a $290 million bond of this sort in 2009. Though volumes are down from pre-crisis
levels, this is likely to become increasing attractive as the market continues to develop.
Whether further innovations could deal with longer-term climate risk, and the uncertainty
surrounding some risks, remains an open question (Heal and Kristrom, 2002).
Part of an appropriate response to the likelihood of increased uninsured losses from extreme
weather events is increased precautionary public saving. This would convey fiscal benefits
not only when disaster strikes but also, through improved ratings and reduced risk premia,
when it does not. Given the many other fiscal challenges faced by low-income countries and
the possible scale of damage, however, the self-insurance reasonably achievable will often be
limited. An important first step—hardly yet begun—is to recognize the fiscal risks involved.
B. How Much?—Assessing the Fiscal Costs of Adaptation
Evidence on the likely aggregate direct public costs of appropriate adaptation measures in
general—and fiscal costs in particular—remains scant and patchy, and marked by important
uncertainties. But some broad impressions are beginning to emerge.
For advanced economies, two points stand out from the review of estimates for the EU in
Osberghaus and Reif (2010). The first is that some elements of warming will ease rather than
burden the public finances: through reduced heating bulls for public buildings, for instance,
and lower health care costs. The other is that the aggregate costs seem modest: focusing on
the upper limits, the implied aggregate cost in mid-century appears to be around €16 billion
(in 2005 prices),74
the main items being flood protection and strengthening transport
infrastructures. Uncertainty on some items remains large, however: the cost of flood
protection for Western Europe is put at between €137 million and €4 billion.
For developing countries, the most comprehensive analysis is that of the World Bank
(2010b). This puts the (undiscounted) aggregate public cost for a 2o temperate rise (over pre-
industrial levels) at around $80–90 billion (at 2005 prices) as an annual average from now
until 2050,75
of which perhaps around three-quarters is required before 2020. Infrastructure
and water supply expenditures account for roughly one half of these costs; and the adverse
impact is greatest for Sub-Saharan Africa. Given limited capacity and resources in many of
74
Figure 1 of Obsterghaus and Reif (2010).
75 This is somewhat higher than previous estimates. An early study by the World Bank (2006) put the cost of
climate-proofing existing investments in developing countries at US$10–US$40 billion per annum. UNDP
(2007) estimates an annual cost of climate-proofing development investment, by 2015, of around US$44 billion
per annum, with an additional US$2 billion to strengthen disaster response—and a further annual US$40 billion
in strengthening social safety nets. UNFCCC (2007) estimates suggest an annual investment cost for
agriculture, health, water and coastal protection, of around US$40 billion per annum by 2030.

38
the affected countries, as well as concerns of historical responsibility (and to reduce
Samaritan‘s dilemma issues), they imply need and scope for significant further bi- and
multilateral support (as well as private co-financing).
The World Bank (2010b) figures are similar in magnitude to current total overseas
development assistance.. In broader terms, however, they are relatively small: for 2010–19,
they amount to less than 0.3 percent of GDP in all regions other than Sub-Saharan Africa,
where they are around 0.7 percent of GDP. And in all regions they are projected to fall
relative to GDP over time. Since the adaptation costs are taken in World Bank (2010b, p.20)
to be those ―…needed to restore welfare to levels prevailing become climate change‖, it
might seem that the harm from climate change is rather minor. But the assumption of a 2o
temperature rise is very modest: and since adaptation costs are likely to be convex in
temperature rise, plausible alternatives could give rise to significantly higher numbers. In this
respect, these figures are naturally thought of as lower bounds: one reading is precisely that
they stress the importance of moderating temperature rise.
Effects will of course vary substantially by geographic circumstance. On sea level rise, for
example, Nicholls and Tol (2006) find coastal protection costs (for a rise of around 0.2–0.3
meters over the century) to be less than one percent of GDP annually for the 15 most-affected
countries by 2080. In some exposed small islands in the Pacific, however, the figure is
notably larger: 5–13.5 percent of GDP in Micronesia, for instance, and 3.9–9.1 percent in
Palau. These estimates likely understate total adaptation costs, however, in that they deal
only with sustained sea rise at mid-point estimates, and so exclude costs of coping with storm
surge and other associated effects, or with more dramatic rise.
Assessing the fiscal challenges from adaptation in developing countries requires a far better
understanding of their likely country-specific magnitude. It is currently hard to judge where
and when these costs rise to levels of macroeconomic significance relative to the wide variety
of other fiscal risks that countries face. A step ahead is recently made through a series of,
admittedly preliminary and incomplete, country studies of adaptation costs by the World
Bank in conjunction with respective authorities, for Bangladesh, Bolivia, Ethiopia, Ghana,
Mozambique, Samoa, and Vietnam, using a variety of tools including both partial and
computable general equilibrium analyses.
C. ‘Climate Finance’
A strong case can be made, on grounds of both historical responsibility76
and developmental
needs—Stern (2007) and UNDP (2007) stress, for instance, that climate change potentially
jeopardizes achievement of the Millennium Development Goals—for developed economies
to shoulder a substantial part of the real income loss that mitigation and adaptation are likely
76
The argument is made, for instance, in UNDP (2007).
39
to impose on developing countries. On the latter, signatories to the UNFCCC are explicitly
committed to helping ―developing countries that are particularly vulnerable to the adverse
effects of climate change in meeting costs of adaptation to those adverse effects.‖ More
generally, developed countries committed themselves in the Copenhagen Accord and Cancun
agreements to mobilize new and additional resources for climate change activities in
developing countries of $30 billion for the period 2010-12 and $100 billion per year by 2020,
through a Green Climate Fund set up for this purpose, conditional on particular mitigation
and adaptation actions by developing countries.77
Achieving this raises a host of practical
issues: precisely how, for example, to define (and monitor) climate finance, and ensure
additionality, given the synergies between climate-related and other type of development
spending. But the central ‗climate finance‘ question—increasingly prominent in climate
negotiations—issue is simply: Where is this money to come from?
How much is to come from private sources and how much from public remains open. To
generate the former, credible carbon pricing is again critical for providing signals that will
attract private investors. Designing the latter—mobilizing public funds for transfer to lower
income countries—arguably has in itself little to do with climate change: if funds must be
raised, best advice is simply to use whatever is the most acceptable instrument, whether tax
increase or spending reduction available—and that may have no relation to the climate.
Much of the debate, however—taken forward by a U.N. High Level Advisory Group (AGF,
2010) and the World Bank and others (2011)78
—has nonetheless, been on developing and
deploying particular tax instruments to this financing end. Some of the focus has been on
developing new tax instruments that in some cases, as with new taxes on the financial sector,
bear no very evident relation to climate issues, or on forms on financial engineering. Another
theme has been the possible earmarking of revenues from carbon pricing to climate finance;
and a third has been to use revenues from charges on international aviation and fuels.
Whether allocating the proceeds of these latter charges, however desirable in themselves,
away from national governments makes their adoption more or less likely is debatable. In
any event, little real progress has yet been made.
The encouraging feature of the climate finance debate is that it provides a framework for
delivering the side payments without which, the underlying economics and politics of the
problem both suggest, progress will remain painfully hard. It is discouraging, however, that
the debate is marked not only by a proclivity for earmarking but some bias towards spending
money—or at least promising to spend it—rather than taking firm action now to raise money
in ways that help address the underlying climate problem.
77
This compares with current bilateral development assistance for mitigation of around $9.4 billion per year in
2008-9, and multi-donor funds with cumulative pledges of around $10 billion (World Bank and others, 2011).
Conditions are that developing countries undertake so-called Nationally Appropriate Mitigation Actions
(NAMAs), in addition to the adaptation actions to be supported by the Green Climate Fund.
78 See also Atkinson (2005).
40
VI. CONCLUDING REMARKS
Climate change is, very largely, a fiscal problem—and to some also a fiscal opportunity. The
literature has indeed produced powerful insights, crisp on mitigation and technology policies,
helpful—if inevitably fuzzier—on adaptation. It stresses, above all, the importance of
comprehensive carbon pricing, at least by the main emitters, as the cornerstone of coherent
climate policies. With some exceptions, the impact on practical policy, however, has surely
been disappointing. The current agreement, following the Durban meeting of December
2010, to begin in 2015 negotiating a coordinated approach to mitigation, for implementation
in 2020, hardly shows the urgency that many have hoped for. It has proved easier to explain
the difficulty of effective action in this area than to facilitate it. Perhaps the urgent need for
fiscal consolidation in many countries will change things. If not, continued delay will make
addressing more radical approaches—developing last-resort technologies or, suggested by
Barrett (2006), a focus in designing climate treaties not on mitigation but instead on common
efforts to develop new and radical energy technologies, whose development will in case
make fossil fuels obsolete—increasingly important.
41
Appendix 1. The Science and Impact of Climate Change
Average global temperature increases with the atmospheric concentration of greenhouse
gases (GHGs). There are three main GHGs (other than water vapor, which is little affected
by human activity and decays rapidly):
Carbon dioxide (CO2) currently accounts for about 75 percent of GHG emissions;
burning fossil fuels—petroleum, coal and natural gas—contributes about 60 percent,
and deforestation (which releases carbon stored in soil and forest biomass) 15
percent.79
Methane, mainly from agricultural activity, contributes 15 percent
Nitrous oxides, generated by industrial and agricultural activities (including nitrogen-
based fertilizers) account for most of the remaining 10 percent.
Some man-made factors reduce global warming, most importantly aerosols (particles
resulting from sulphur emissions and reflecting sunlight), though these decay relatively
quickly and have more localized effects.
The concentration of GHGs in the atmosphere—conventionally measured in parts per million
(ppm) of CO2 equivalent (CO2e)—has risen from about 280 ppm in 1750 to around 430 ppm
now. It is currently rising by more than 2 ppm per annum, and under business as usual
(BAU) could increase to around 750 ppm by 2100.
Temperature increases less than linearly with GHG concentration (though climate damage
itself is likely convex in the temperature rise). And emissions take some time to have their
full temperature effects due to slow heat diffusion processes with oceans.80
GHG emissions
also decay very slowly: emitted carbon stays in the atmosphere for, on average, about 100
years.
By the best current estimate (IPCC, 2007), the global average temperature has increased by
about 0.75 degrees Celsius (°C) since 1906 (with the cooling effect of aerosols roughly
offsetting the warming effect of GHGs until about 1980). The Intergovernmental Panel on
Climate Change (IPCC, 2007) projects that—under current policies (―business as usual,‖
BAU)—the global mean temperature will increase over the next century by 2.8oC, with a
3 percent chance of rising 6oC or more
81 (the latter being roughly the same as the increase
since the last ice age).
79
Note however that forest biomass used for building materials does not lead to an immediate release of carbon;
this occurs only when buildings decay.
80 Global warming also leads to an increase in ocean water temperatures (which has a feedback effect on land
termperatures), but this occurs only very slowly. This implies long lags from an initial climate forcing to a final
equilibrium global temperature level.
81 Relative to average temperatures between 1980–1999.
42
The physical consequences include changed precipitation patterns, sea level rise (amplified
by storm surges), more intense and perhaps frequent extreme weather events, severe impacts
on ecosystems, increased prevalence of vector-borne diseases. The potential economic
consequences include productivity changes in agriculture and other climate-sensitive sectors,
damage to coastal areas from sea level rise and more severe flooding events, stresses on
health and water systems, changes in trading patterns and international investment flows,
financial market disruption (and innovation), increased vulnerability to sudden adverse
shocks, and altered migration patterns—all with potential implications for external stability.
The risk of catastrophic events—shifts in some basic features of the planet‘s geophysical
subsystems—have naturally attracted particular attention, in both public debate and the
formal literature. Such possibilities include, for instance, loss of the Greenland ice sheet and
a shift of the gulf stream. Little is known about the concentrations thresholds at which these
become significant risks; some, even though ‗abrupt‘ in geophysical terms involve transitions
of decades or more.
Of course not all of these effects are adverse: agricultural productivity increases in some
northern regions, for instance, and opening of the Northern passage; and at least one
technically 'catastrophic' event—greening of the Sahara—would convey large benefit.
Nonetheless and while views differ on the likely extent of many of these effects, few doubt
that they warrant serious and current attention—especially because the worst-affected
countries will be those least equipped to deal with them (and with the least historical
responsibility for emissions). Assessments of the macroeconomic impact of climate change
are reviewed in Jones and others (2007), and IMF (2008b). For a 3oC rise, benchmark
estimates for the loss of global GDP range from zero to 3 percent (reflecting differing
degrees of coverage of market- and nonmarket effects, the presumed ease of adapting to
changing climates, and the treatment of catastrophic risk). Behind these aggregate losses, it is
generally agreed that hotter and lower-lying countries—often already the most vulnerable—
are most at risk, with some more temperate countries even benefiting from moderate
temperature rise. Most of the likely aggregate damage is expected in the latter part of the
century. But events such as Hurricane Katrina, the 2002 drought in East Africa and severe
floods in Europe, Pakistan and elsewhere—though not simply attributable to climate
change—illustrate the possible severity of near-term challenges. Moreover, since core actions
to deal with climate change must be anticipatory, policy responses need to be considered far
in advance of the damage to be averted. The impact of biofuel subsidies is a stark illustration
of the potential for strong current impacts from climate policies (Mercer-Blackman, 2007)
43
References
Acemoglu, Daron, Philippe Aghion, Leonardo Bursztyn, and David Hemous, 2011; , ―The
Environment and Directed Technical Change,‖ American Economic Review
(forthcoming).
AGF, 2010, Report of the Secretary-General‘s High-level Advisory Group on Climate
Change Financing (New York: United Nations).
Aldy, Joseph E., Alan J. Krupnick, Richard G. Newell, Ian W.H. Parry, and William A.
Pizer, 2010, ―Designing Climate Mitigation Policy,‖ Journal of Economic Literature,
Vol. 48, pp. 903–34.
Altemeyer-Bartscher, Dirk Rübbelke, and Eytan Sheshinski, 2010, ―Environmental
Protection and the Private Provision of International Public Goods,‖ Economica, Vol.
77, pp. 775–84.
Atkinson, Anthony B. (ed.), 2005, New Sources of Development Finance (Oxford: Oxford
University Press).
Auerswald, Heike, Kai A. Konrad, and Marcel Thum, 2011, ―Adaptation, Mitigation and
Risk-taking in Climate Policy,‖ mimeo. Technische Universität Dresden.
Babiker, Mustafa H., 2005, Climate Change Policy, Market Structure, and Carbon Leakage,
Journal of International Economics, Vol. 65, pp. 421–45.
Barrett, Scott, 2003, Environment and Statecraft (Oxford and New York: Oxford University
Press).
______, 2006, ―Climate Treaties and ‗Breakthrough‘ Technologies,‖ American Economic
Review (Papers and Proceedings), Vol. 96 (2), pp. 22–25.
______, 2007, ―The Incredible Economics of Geoengineering,‖ mimeo, Johns Hopkins
University School of Advanced International Studies.
______, 2009, ―The Coming Global Climate-Technology Revolution‖. Journal of Economic
Perspectives, Vol. 23 (2), pp. 53–75.
______, 2011, ―Climate Treaties and Approaching Catastrophes‖. Working Paper, Columbia
University.
Bloch, Francis, 1997, ―Non-Cooperative Models of Coalition Formation in Games with
Spillovers,‖ In: Carraro, Carlo and Domenico Siniscalco (eds.), New Directions in the
Economic Theory of the Environment (Cambridge: Cambridge University Press).
Bohn, Henning, and Robert T. Deacon, 2000, ―Ownership Risk, Investment, and the Use of
Natural Resources,‖ American Economic Review, Vol. 90, pp. 526–49.

44
Böhringer, Christoph, and Heinz Welsch, 2004, ―Contraction and Convergence of Carbon
Emissions: An Intertemporal Multi-Region CGE Analysis,‖ Journal of Policy
Modeling, Vol. 26, pp. 21–39.
Bovenberg, Lans, and Ruud de Mooij, 1994, ―Environmental Levies and Distortionary
Taxation,‖ American Economic Review, Vol. 94, pp. 1085–89.
______, Lawrence H. Goulder, and Mark R. Jacobsen, 2008, ―Costs of Alternative
Environmental Policy Instruments in the Presence of Industry Compensation
Requirements,‖ Journal of Public Economics, Vol.92, pp. 1236–53.
Bradford, David F., 2002, ―Improving on Kyoto: Greenhouse-Gas Control as the Purchase of
a Global Public Good,‖ Working Paper, Princeton University.
Brenkert, A., S. Smith, S. Kim, and H. Pitcher, 2003, ―Model Documentation for the
MiniCAM,‖ PNNL-14337, (Richland, WA: Pacific Northwest National Laboratory).
Brett, Craig, and Michael Keen, 2000, ―Political Uncertainty and the Earmarking of
Environmental Taxes,‖ Journal of Public Economics, Vol. 75, pp. 315–40.
Burtraw, Dallas, and Karen Palmer, 2008, ―Compensation Rules for Climate Policy in the
Electricity Sector,‖ Journal of Policy Analysis and Management, Vol. 27, No. 4,
pp. 819–47.
Carlin, Alan, 2006, ―Global Climate Control: Is There a Better Strategy Than Reducing
Greenhouse Gas Emissions?‖ National Center for Environmental Economics,
Working Paper No. 06-04.
Carraro, Carlo, Marzio Galeotti, and Massimo Gallo, 1996, ―Environmental Taxation and
Unemployment: Some Evidence on the ‗Double Dividend Hypothesis‘ in Europe,‖
Journal of Public Economics, Vol. 62, 141–81.
Coady, David, Moataz El-Said, Robert Gillingham, Kangni Kpodar, Paulo Medas, and David
Newhouse, 2006, ―The Magnitude and Distribution of Fuel Subsidies: Evidence from
Bolivia, Ghana, Jordan, Mali, and Sri Lanka,‖ IMF Working Paper 06/247
(Washington: International Monetary Fund).
______, Robert Gillingham, Rolando Ossowski, John Piotrowski, Shamshuddin Tareq, and
Justin Tyson, 2010, ―Petroleum Product Subsidies: Costly, Inequitable and Rising,‖
Staff Position Note 10/05 (Washington: International Monetary Fund).
Coate, Stephen, 1995, ―Altruism, the Samaritan‘s Dilemma, and Government Transfer
Policy,‖ American Economic Review, Vol. 85, pp. 46–57.
Commission of the European Communities, 2008a, ―Package of Implementation Measures
for the EU‘s Objectives on Climate Change and Renewable Energy for 2020: Impact
Assessment,‖ Commission Staff Working Document, Brussels, January 23.
45
______, 2008b, ―Proposal for a Decision of the European Parliament and of the Council
Amending Directive 2003/87/EC so as to Improve and Extend the Greenhouse Gas
Emission Allowance Trading System of the Community,‖ (Brussels: European
Commission).
Congressional Budget Office (CBO), 2009a, ―The Budget and Economic Outlook: An
Update,‖ August (Washington: U.S. Government Printing Office).
______, 2009b, ―Congressional Budget Office Cost Estimate for S. 1733, Clean Energy Jobs
and American Power Act December 16, 2009‖ (Washington: U.S. Government
Printing Office).
Cramton, Peter, and Stephen Stoft, 2010, ―International Climate Games: From Caps to
Cooperation.‖ Global Energy Policy Center, Research Paper No 10-07.
Csikós, Katalin, 2007, ―International Tax Implications of Tradable Allowances,‖ European
Taxation, March, pp.135–43.
Dasgupta, Partha, 1982, The Control of Resources (Oxford: Basil Blackwell).
______, 2007, ―Commentary: The Stern Review‘s Economics of Climate Change,‖ National
Institute Economic review, Vol. 199, pp. 407.
Dresner, Simon, and Paul Ekins, 2006, ―Economic Instruments to Improve UK Home Energy
Efficiency Without Negative Social Impacts,‖ Fiscal Studies, Vol. 27, pp. 47–74.
Finus, Michael, 2001, Game Theory and International Environmental Cooperation
(Cheltenham, U.K.: Edward Elgar Publishers).
______, and Bianca Rundshagen, 2003, ―How the Rules of Coalition Formation Affect
Stability of International Environmental Agreements,‖ FEEM Working Paper
62.2003 (Milan: Fondazione Eni Enrico Mattei).
Fischer, Carolyn, and Alan K. Fox, 2007, ―Output-Based Allocation of Emissions Permits for
Mitigating Tax and Trade Interactions,‖ Land Economics, Vol. 83 (4), pp. 575–99.
______, and Richard G. Newell, 2007, ―Environmental and Technology Policies for Climate
Mitigation,‖ RFF Discussion Paper 04-05, revised (Washington: Resources for the
Future).
Fisher, Anthony C., and Urvashi Narain, 2003, ―Global Warming, Endogenous Risk, and
Irreversibility,‖ Environmental and Resource Economics, Vol. 25, pp. 395–416.
Fullerton, Don, and Holly Monti, 2010, ―Can Pollution Tax Rebates Protect Low-income
Families? The Effects of Relative Wage Rates,‖ NBER Working Paper 15935,
(Cambridge, Massachusetts).
46
German Advisory Council on Global Change (WGBU), 2003, Climate Protection Strategies
for the 21st Century: Kyoto and Beyond (Berlin: WGBU).
Goulder, Lawrence H., 1995, ―Environmental Taxation and the Double Dividend: A
Reader‘s Guide,‖ International Tax and Public Finance, Vol. 2, pp. 157–84.
______, 2002, Environmental Policy Making in Economies with Prior Tax Distortions
(Cheltenham, United Kingdom: Edward Elgar Publishers).
______, and Ian Parry, 2008, ―Instrument Choice in Environmental Policy,‖ Review of
Environmental Economics and Policy, Vol. 2, pp.152–74.
Greaker, Mads and Lise Lotte Pade, 2008, ―Optimal CO2 Abatement and Technological
Change: Should Emission Taxes Start High in Order to Spur R&D? Discussion Paper
no. 548, Statistics Norway.
Hallegatte, Stéphane, 2008, ―An Adaptive Regional Input-Output Model and its Application
to the Assessment of the Economic Cost of Katrina,‖ Risk Analysis, Vol. 28 (3),
pp. 779–99.
Hall, Bronwyn, and John van Reenen, 2000, ―How Effective are Fiscal Incentives for R&D?
A Review of the Evidence,‖ Research Policy, Vol. 29, pp. 449–69.
Hassett, Kevin A., Aparna Mathur, and Gilbert E. Metcalf, 2007, ―The Incidence of a U.S.
Carbon Tax: A Lifetime and Regional Analysis,‖ NBER Working Paper No. 13554
(Cambridge, Massachusetts: National Bureau of Economic Research).
Heal, Geoffrey, and Bengt Kristrom, 2002, ―Uncertainty and Climate Change,‖
Environmental and Resource Economics, Vol. 22, pp. 3–39.
Heller, Peter S., 2007, ―Addressing Climate Change: Is There a Role to be Played by the
IMF?‖ World Economics, Vol. 8, pp. 107–20.
Ho, Mun S., Richard Morgenstern, and Jhih-Shyang Shih, 2008, ―Impact of Carbon Price
Policies on U.S. Industry,‖ RFF Discussion Paper (Washington: Resources for the
Future).
Hoel, Michael, 2010, ―Is There a Green Paradox?‖ CESifo Working Paper No. 3168.
Hourcade Jean-Charles, Damien Demailly, Karsten Neuhoff, and Misato Sato, 2007,
―Differentiation and Dynamics of EU Industrial Competitiveness‖ (Cambridge:
Climate Strategies).
Houser, Trevor, Shashank Mohan, and Robert Heilmayr, 2009, A Green Global Recovery?
Assessing U.S. Economic Stimulus and Prospects for International Cooperation,
Policy Brief 09-3 (Washington: Peterson Institute for International Economics and
World Resource Institute).
47
International Energy Agency (IEA), 2009, World Energy Outlook 2009 (Paris: IEA).
International Monetary Fund, 2008a, ―Fiscal Implications of Climate Change,‖ Available via
the Internet: http://www.imf.org/external/np/pp/eng/2008/022208.pdf
______, 2008b, ―Climate Change and the Global Economy,‖ Chapter 4 in World Economic
Outlook (Washington: International Monetary Fund).
______, 2009a, ―The State of Public Finances: A Cross-Country Fiscal Monitor,‖ IMF Staff
Position Note 09/21 (Washington: International Monetary Fund).
______, 2009b, ―The State of Public Finances: Outlook and Medium-Term Policies after
the 2008 Crisis,‖ (Washington: International Monetary Fund). Available via the
Internet: www.imf.org/external/np/pp/eng/2009/030609.pdf
______, and World Bank, 2011, ―Market-Based Instruments for International Aviation and
Shipping as a Source of Climate Finance,‖ Available via the Internet:
http://www.imf.org/external/np/g20/
Intergovernmental Panel on Climate Change (IPCC), 2007, ―Climate Change 2007: Impacts,
Adaptation and Vulnerability,‖ Working Group II contribution to Fourth Assessment
Report of the Intergovernmental Panel on Climate Change (Geneva: IPCC).
Jaumotte, Florence, and Nigel Pain, 2005, ―From Ideas to Development: The Determinants of
R&D and Patenting,‖ OECD Economics Department Working Paper No. 457 (Paris:
Organization for Economic Cooperation and Development).
Jaffe, Adam B., Richard G. Newell, and Robert N. Stavins, 2002, ―Technological Change
and the Environment,‖ Environmental and Resources Economics, Vol. 22, pp. 41–69.
Joint Group Report, 2010, Analysis of the Scope of Energy Subsidies and Suggestions for the
G-20 Initiative. Report prepared for the G-20 Meeting in Toronto, Canada, June 26-
27, 2010 by the IEA, OECD, OPEC, and World Bank.
Jones, Benjamin, Michael Keen, John Norregaard, and Jon Strand, 2007, ―Climate Change:
Economic Impact and Policy Responses,‖ in World Economic Outlook, October,
International Monetary Fund, Appendix 1.1, pp. 53–68.
______, and Michael Keen, 2010, ―Climate Policy and Recovery‖, forthcoming in Journal of
International Commerce, Economics, and Policy.
Kanbur, Ravi, Michael Keen, and Sweder van Wijnbergen, 1995, ―Industrial
Competitiveness, Environmental Regulation, and Direct Foreign Investment,‖ in The
Economics of Sustainable Development, (ed.) by Ian Goldin and L. Alan Winters
(Cambridge: Cambridge University Press), pp. 289–302.
Keen, Michael J. and Christos Kotsogiannis, 2010, ―Coordinating Climate and Trade
Policies: Pareto Efficiency and the Role of Border Tax Adjustment,‖ mimeo.

48
______, and Jon Strand, 2007, ―Indirect Taxes on International Aviation,‖ Fiscal Studies,
Vol. 28, pp. 1–41.
———, and David Wildasin, 2004, ―Pareto efficient International Taxation,‖ American
Economic Review, Vol. 94 , pp. 259-275.
Kolstad, Charles D., 1996, ―Learning and Stock Effects in Environmental Regulation: The
Case of Greenhouse Gas Emissions,‖ Journal of Environmental Economics and
Management, Vol. 31, pp. 1–18.
Kousky, Carolyn, and Roger M. Cooke, 2009, ―The Unholy Trinity: Fat Tails, Tail
Dependence, and Micro-Correlations,‖ RFF Discussion Paper (Washington:
Resources for the Future).
______, Olga Rostapshva, Michael Toman, and Richard Zeckhauser, 2009, ―Responding to
Threats of Climate Change Mega-Catastrophes,‖ Unpublished, Harvard University.
Kuik, Onno Jan, and Reyer Gerlach, 2007, ―Carbon Leakage with International Technology
Spillovers,‖ FEEM Working Paper 2007.33 (Milan: Fondazione Eni Enrico Mattei).
Ley, Eduardo, and Jessica Boccardo, 2010, ―The Taxation of Motor Fuel: International
Comparison (Washington: World Bank).
Lucas, Gary M., 2010, ―The Taxation of Emissions Permits Distributed for Free as Part of a
Carbon Cap-and-Trade Program,‖ George Washington Journal of Energy and
Environmental Law, pp.1–67.
McKibbin, Warwick J., and Peter J. Wilcoxen, 2002, ―The Role of Economics in Climate
Change,‖ Journal of Economic Perspectives, Vol. 16, pp. 107–29.
______, 2004, ―Estimates of the Costs of Kyoto-Marrakesh versus the McKibbin-Wilcoxen
Blueprint,‖ Energy Policy, Vol. 32, pp. 467–79.
McLure, Charles, 2011, ―The GATT Legality of Border Tax Adjustments for Carbon Taxes
and the Cost of Emissions Permits: A Riddle Wrapped in a Mystery Inside an
Enigma,‖ Florida Tax Law Review, Vol. 11, pp. 221–94.
Mercer-Blackman, Valerie, 2007, ―Making the Most of Biofuels,‖ Box 1.6, pp. 48–51, in
World Economic Outlook, October (Washington: International Monetary Fund).
Newell, Richard G. and William A. Pizer, 2003, Regulating Stock Externalities under
Uncertainty. Journal of Environmental Economics and Management, 45, 416-432.
Nicholls, Robert J., and Richard S. J. Tol, 2006, ―Impacts and Responses to Sea-level Rise: A
Global Analysis of the SRSS Scenarios over the Twenty-first Century,‖ Philosophical
Transactions of the Royal Society, Vol. 363, pp. 1073–95.
49
Nordhaus, William D., 2007, ―To Tax or Not to Tax: Alternative Approaches to Slowing
Global Warming,‖ Review of Environmental Economics and Policy, Vol. 1, pp. 26–
44.
______, 2011, ―The Economics of Tail Events with an Application to Climate Change‖.
Review of Environmental Economics and Policy, Vol. 5, 240-257.
Obsterghaus, Daniel, and Christiane Reif, 2010, ―Total Costs and Budgetary Effects of
Adaptation to Climate Change: An Assessment for the European Union,‖ CESifo
Working Paper No. 3143.
O'Neill, Brian C., Paul Crutzen, Arnulf Grübler, Minh Ha Duong, Klaus Keller, Charles
Kolstad, Jonathan Koomey, Andreas Lange, Michael Obersteiner, Michael
Oppenheimer, William Pepper, Warren Sanderson, Michael Schlesinger, Nicolas
Treich, Alistair Ulph, Mort Webster, and Chris Wilson, 2006, ―Learning and Climate
Change,‖ Climate Policy, Vol. 6, pp. 585–89.
Organization for Economic Cooperation and Development (OECD), 2004, Sustainable
Development in OECD Countries: Getting the Policies Right, Environment
Directorate (Paris).
______, 2006, The Political Economy of Environmentally Related Taxes (Paris).
______, 2008, Biofuel Support Policies: An Economic Assessment (Paris: OECD).
Paltsev, Sergey, 2001, ―The Kyoto Protocol: Regional and Sectoral Contributions to the
Carbon Leakage,‖ The Energy Journal, Vol. 22 (4), pp. 53–79.
______, John M. Reilly, Henry D. Jacoby, Richard S. Eckaus, James McFarland, Marcus.
Sarofim, Malcolm Asadoorian, and Mustafa Babiker, 2005, ―The MIT Emissions
Prediction and Policy Analysis (EPPA) Model: Version 4,‖ Report 125, MIT Joint
Program on the Science and Policy of Global Change (Cambridge, Massachusetts:
Massachusetts Institute of Technology).
Parry, Ian W. H., and Kenneth A. Small, 2005, ―Does Britain or the United States Have the
Right Gasoline Tax?‖ American Economic Review, Vol. 95, pp. 1276–89.
______, and Jon Strand, 2011, International Fuel Tax Assessment: An Application to Chile.
Environment and Development Economics, forthcoming.
______, (ed.), 2012, Mitigating Global Climate Change: A Practical Guide for Policymakers
(Washington: International Monetary Fund).
Pindyck, Robert S., 2000, Irreversibility and the Timing of Environmental Policy. Resource
and Energy Economics, Vol. 22. pp 233–59.
______, 2007, ―Uncertainty in Environmental Economics,‖ Review of Environmental
Economics and Policy, Vol. 1, pp. 45–65.

50
______, 2011, ―Fat Tails, Thin Tails, and Climate Change Policy,‖ Review of Environmental
Economics and Policy, Vol. 5, pp. 259–74.
Pizer, William A., 2002, ―Combining Price and Quantity Control to Mitigate Global Climate
Change,‖ Journal of Public Economics, Vol. 85, pp. 409–34.
Ploeg, Frederick v.d. and Withagen, Cees, 2009, ―Is There Really a Green Paradox?‖ CESifo
Working Paper no 2963 (Munich: CESifo).
Ritz, Robert, 2009, ―Carbon Leakage under Incomplete Environmental Regulation: An
Industry-level Approach,‖ Discussion Paper, Department of Economics (Oxford:
University of Oxford).
Robins, Nicholas, Robert Clover, and Charanjit Singh, 2009, ―A Climate for Recovery: the
Colour of the Stimulus Goes Green,‖ (London: HSBC).
Roberts, Marc J., and Michael Spence, 1976, ―Effluent Charges and Licenses under
Uncertainty,‖ Journal of Public Economics, Vol. 5, pp. 193–208.
Rosendahl, Knut Einar, 2008, ―Incentives and Prices in an Emissions Trading Scheme with
Updating,‖ Journal of Environmental Economics and Management, Vol. 56, pp. 69–
82.
______, and Jon Strand, 2011, ―Carbon Leakage from the Clean Development Mechanism,‖
The Energy Journal, Vol. 32 (4), pp. 27–50.
Rubio, Santiago J., and Alistair Ulph, 2006, ―Self-Enforcing International Environmental
Agreements Revisited,‖ Oxford Economic Papers, Vol. 58, pp. 233–63.
______, 2008, ―An Infinite-Horizon Model of Dynamic Membership of International
Environmental Agreements,‖ Journal of Environmental Economics and Management,
Vol. 54, pp. 296–310.
Sandmo, Agnar, 2005, ―Environmental Taxation and Revenue for Development‖ in A.B.
Atkinson (ed.), New Sources of Development Finance (Oxford: Oxford University
Press).
Sarewitz, Daniel, and Richard Nelson, 2008, ―Three Rules for Technological Fixes,‖ Nature,
Vol. 456, pp. 871–72.
Shalizi, Zmarak, and Franck Lecocq, 2009, ―Economics of Targeted Mitigation Programs in
Sectors with Long-Lived Capital Stock,‖ World Bank Working Paper, WPS 5063
(Washington: World Bank).
Sinclair, Peter, 1994, ―On the Optimum Trend of Fossil Fuel Taxation,‖ Oxford Economic
Papers Vol. 46, pp. 869–77.

51
Sinn, Hans-Werner 2008, ―Public Policies Against Global Warming,‖ International Tax and
Public Finance, Vol. 15, pp. 360–94.
Stern, Nicholas, and others, 2007, The Economics of Climate Change (―The Stern Review‖)
(Cambridge: Cambridge University Press).
Strand, Jon, 2008, ―Importer and Producer Petroleum Taxation: A Geo-Political Model,‖
IMF Working Paper 08/35. (Washington: International Monetary Fund).
______, 2009, ―Comment on ‗On Modeling and Interpreting the Economics of Catastrophic
Climate Change‘ by Martin Weitzman‖ Unpublished (Washington: World Bank).
______, 2010a, ―Optimal Fossil-Fuel Taxation with Backstop Technologies and Tenure
Risk,‖ Energy Economics, Vol., 32, pp. 418–22.
______, 2010b, ―Taxes and Caps as Climate Policy Instruments with Domestic and Imported
Fuels,‖ World Bank Policy Research Working Paper 5171 (Washington: World
Bank).
______, and Michael A. Toman, 2010, ―Green Stimulus,‖ Economic Recovery, and Long-
Term Sustainable Development, World Bank Policy Research Working Paper 5163
(Washington: World Bank).
______, Sebastian Miller, and Sauleh Siddiqui, 2011, ―Infrastructure Investments under
Uncertainty with the Possibility of Retrofit: Theory and Simulations,‖ World Bank
Policy Research Working Paper 5516 (Washington: World Bank).
Syroka, Joanna and Antonio Musifora, 2010, National Drought Insurance for Malawi. Policy
Research Working Paper no 5169, World Bank.
Tol, Richard S. J., 2007, ―The Social Cost of Carbon: Trends, Outliers and Catastrophes,‖
Discussion Paper 2007–44 (Dublin: Economic and Social Research Institute).
______, 2005, Adaptation and Mitigation: Trade-Offs in Substance and Method.
Environmental Science and Policy, Vol. 8, pp. 572–78.
Ulph, Alistair, and David Ulph, 1994, ―The Optimal Time Path of a Carbon Tax,‖ Oxford
Economic Papers, Vol. 46, pp. 857–68.
United Nations Development Program (UNDP), 2007, Human Development Report
2007/2008: Fighting Climate Change: Human Solidarity in a Divided World
(Basingstoke: Palgrave Macmillan).
United Nations Environment Program (UNEP), 2009a, A Global Green New Deal: An
Update for the G-20 Pittsburgh Summit (New York: United Nations).
UNFCCC, 2007, ―Investment and Financial Flows to Address Climate Change‖ (Bonn).

52
Weitzman, Martin L., 1974, ―Prices Versus Quantities,‖ Review of Economic Studies,
Vol. 41, pp. 477–91.
______, 2009, ―On Modeling and Interpreting the Economics of Catastrophic Climate
Change,‖ Review of Economics and Statistics, Vol. 91, 1–19.
______, 2011, ―Fat-Tailed Uncertainty in the Economics of Catastrophic Climate Change.
Review of Environmental Economics and Policy, Vol. 5, pp. 275–292.
World Bank, 2006, Clean Energy and Development: Towards an Investment Framework
(Washington: World Bank).
______, 2008, International Trade and Climate Change: Economic, Legal and Institutional
Perspectives (Washington: World Bank).
______, 2009, World Development Report 2010: Development and Climate Change
(Washington: World Bank).
______, 2009b, The Economics of Adaptation to Climate Change (Washington: World
Bank).
______, 2010, Ten Years of Experience in Carbon Finance. Insights from Working with the
Kyoto Mechanisms (Washington: World Bank).
______, 2010a, Climate Change and Fiscal Policy: A Report for APEC, 56563 REV (Office
of the Chief Economist, East Asia and Pacific Region: World Bank).
______, 2010b, The Cost to Developing Countries of Adapting to Climate Change: New
Methods and Estimates, Consultation Draft (Washington: World Bank).
______, and others, 2011, ―Mobilizing Climate Finance: A Report Prepared at the Request of
G-20 Finance Ministers,‖ Available via the Internet:
http://climatechange.worldbank.org/content/mobilizing-climate-finance