fis technical - capesize 26-6-17 - freight investor...
TRANSCRIPT
The information provided in this communication is general in nature only and does not constitute advice in relation to investment products nor
constitute any recommendation on our part. The information has been prepared without taking into account your investment objectives, financial
situation or knowledge and experience. Freight Investor Services Limited is authorised and regulated by the Financial Conduct Authority (FRN
211452).’
Technical Report Global Leader Dry Bulk Derivatives
FIS Technical - Capesize
Highlights:
• Capesize Index- A mean reversal is
currently underway. The trend remains
bearish, market buyers should look to
the daily chart for a higher low before
entering.
• Q3– A higher low on the back of
technical support and bullish divergence.
Currently mid-range, the Q3 has the
potential to consolidate from here.
• Cape v Panamax Q3 17 spread – Support
has held, there is a potential to revert
back to the technical resistance.
However we continue to see fresh lows
and until this changes the trend should
be considered as bearish.
• Q3 v Cal 18 – A technical bounce, but
from a lower low. USD – 185 is an
important level, price rejection from
here would suggest a test of the lows.
Technical Analyst
Edward Hutton
44 20 7090 1120
Client Relations
Andrew Cullen
44 20 7090 1120
[Grab your reader’s attention with a great quote from the document or use this space to emphasize a key point. To place this
text box anywhere on the page, just drag it.]
i
Technical Report Global Leader Dry Bulk Derivatives
‘Risk Disclosure: Trading derivative products such as swaps, futures and options carries with it a substantial risk of loss. Transactional fees such
as broker commission and clearing costs will be applied and these can vary depending on the type of product traded as well as the venue used
for execution. These products are not suitable for all investors. For any further information or to discuss the use of these products please speak
to your broker or relationship manager.’
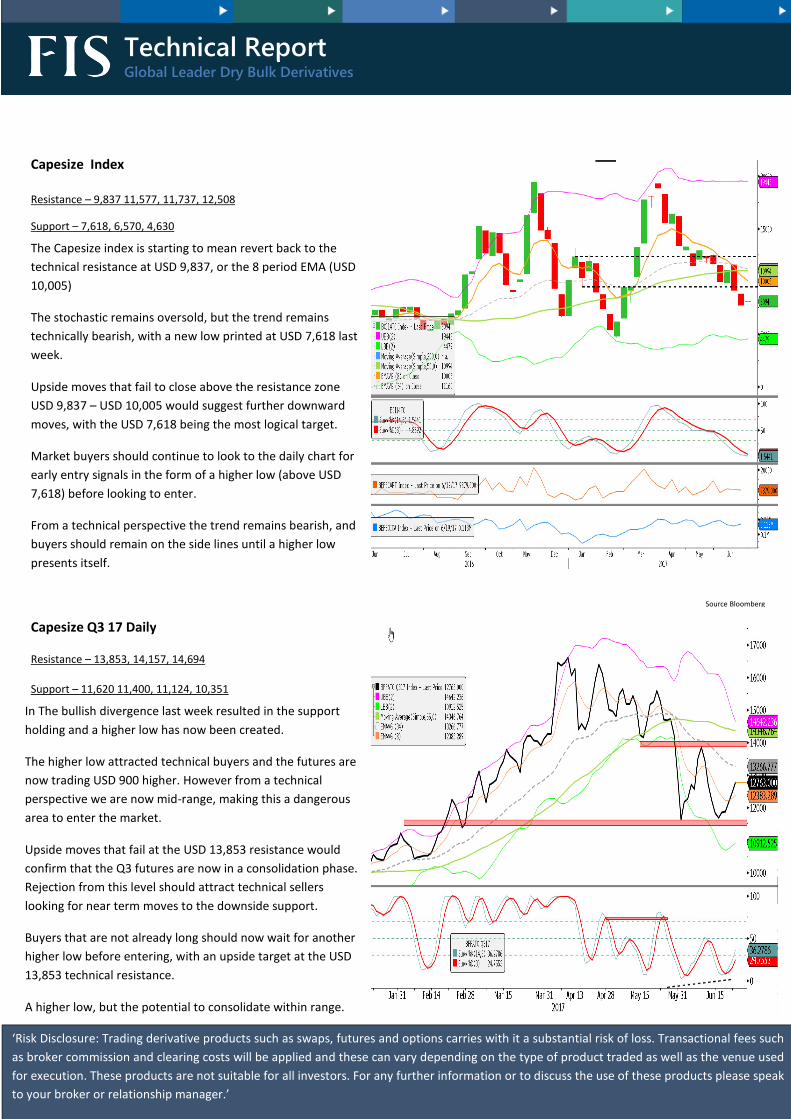
Capesize Index
Support – 7,618, 6,570, 4,630
Resistance – 9,837 11,577, 11,737, 12,508
The Capesize index is starting to mean revert back to the
technical resistance at USD 9,837, or the 8 period EMA (USD
10,005)
The stochastic remains oversold, but the trend remains
technically bearish, with a new low printed at USD 7,618 last
week.
Upside moves that fail to close above the resistance zone
USD 9,837 – USD 10,005 would suggest further downward
moves, with the USD 7,618 being the most logical target.
Market buyers should continue to look to the daily chart for
early entry signals in the form of a higher low (above USD
7,618) before looking to enter.
From a technical perspective the trend remains bearish, and
buyers should remain on the side lines until a higher low
presents itself.
Source Bloomberg
Capesize Q3 17 Daily
Support – 11,620 11,400, 11,124, 10,351
Resistance – 13,853, 14,157, 14,694
In The bullish divergence last week resulted in the support
holding and a higher low has now been created.
The higher low attracted technical buyers and the futures are
now trading USD 900 higher. However from a technical
perspective we are now mid-range, making this a dangerous
area to enter the market.
Upside moves that fail at the USD 13,853 resistance would
confirm that the Q3 futures are now in a consolidation phase.
Rejection from this level should attract technical sellers
looking for near term moves to the downside support.
Buyers that are not already long should now wait for another
higher low before entering, with an upside target at the USD
13,853 technical resistance.
A higher low, but the potential to consolidate within range.
[Grab your reader’s attention with a great quote from the document or use this space to emphasize a key point. To place this
text box anywhere on the page, just drag it.]
i
Technical Report Global Leader Dry Bulk Derivatives
‘Risk Disclosure: Trading derivative products such as swaps, futures and options carries with it a substantial risk of loss. Transactional fees such
as broker commission and clearing costs will be applied and these can vary depending on the type of product traded as well as the venue used
for execution. These products are not suitable for all investors. For any further information or to discuss the use of these products please speak
to your broker or relationship manager.’
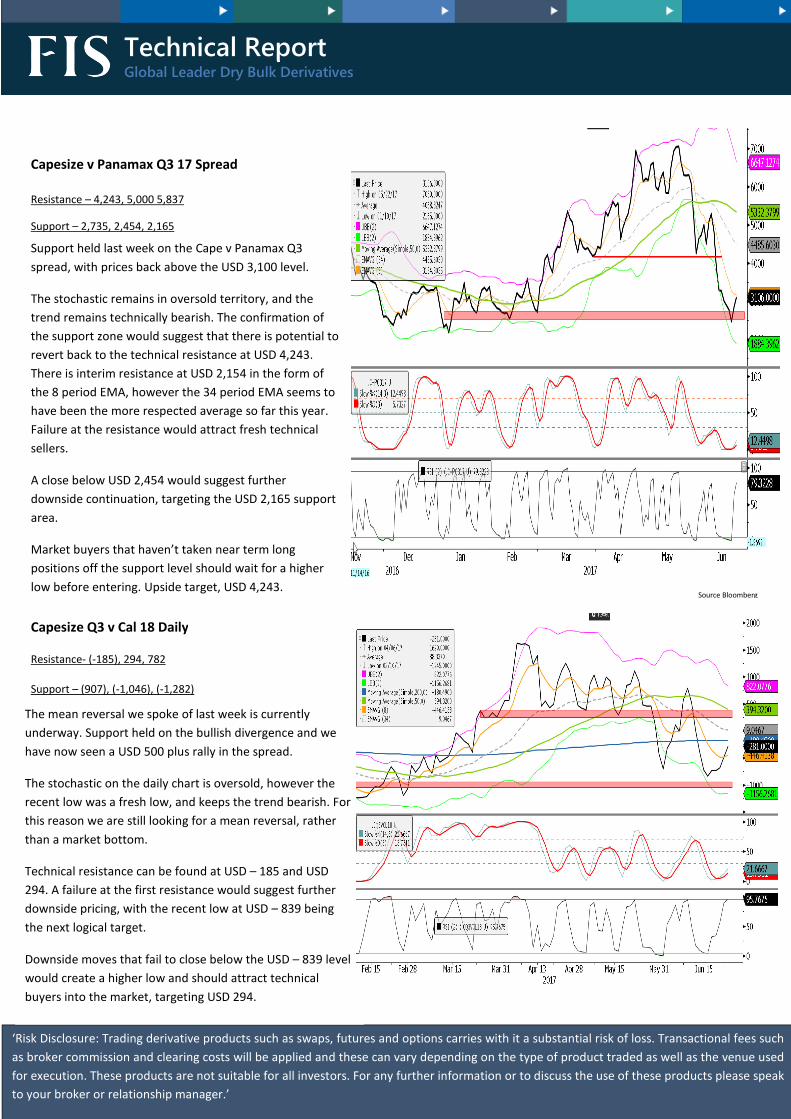
Capesize v Panamax Q3 17 Spread
Support – 2,735, 2,454, 2,165
Resistance – 4,243, 5,000 5,837
Support held last week on the Cape v Panamax Q3
spread, with prices back above the USD 3,100 level.
The stochastic remains in oversold territory, and the
trend remains technically bearish. The confirmation of
the support zone would suggest that there is potential to
revert back to the technical resistance at USD 4,243.
There is interim resistance at USD 2,154 in the form of
the 8 period EMA, however the 34 period EMA seems to
have been the more respected average so far this year.
Failure at the resistance would attract fresh technical
sellers.
A close below USD 2,454 would suggest further
downside continuation, targeting the USD 2,165 support
area.
Market buyers that haven’t taken near term long
positions off the support level should wait for a higher
low before entering. Upside target, USD 4,243. Source Bloomberg
Capesize Q3 v Cal 18 Daily
Support – (907), (-1,046), (-1,282)
Resistance- (-185), 294, 782
The mean reversal we spoke of last week is currently
underway. Support held on the bullish divergence and we
have now seen a USD 500 plus rally in the spread.
The stochastic on the daily chart is oversold, however the
recent low was a fresh low, and keeps the trend bearish. For
this reason we are still looking for a mean reversal, rather
than a market bottom.
Technical resistance can be found at USD – 185 and USD
294. A failure at the first resistance would suggest further
downside pricing, with the recent low at USD – 839 being
the next logical target.
Downside moves that fail to close below the USD – 839 level
would create a higher low and should attract technical
buyers into the market, targeting USD 294.
[Grab your reader’s attention with a great quote from the document or use this space to emphasize a key point. To place this
text box anywhere on the page, just drag it.]
i
Technical Report Global Leader Dry Bulk Derivatives
‘Risk Disclosure: Trading derivative products such as swaps, futures and options carries with it a substantial risk of loss. Transactional fees such
as broker commission and clearing costs will be applied and these can vary depending on the type of product traded as well as the venue used
for execution. These products are not suitable for all investors. For any further information or to discuss the use of these products please speak
to your broker or relationship manager.’
Technical Analysis Glossary
Pivot Point
A point where the market makes a new high or low, before reversing in direction.
Trend Line
A directional line connecting pivot points.
Primary Trend
The main trend line over an extended period of time.
Secondary Trend
Distinct from but within the primary trend. Indicates recent trend.
Support
A previous market low where market participants have been prepared to enter long positions.
Resistance
A previous market high where market participants have been prepared enter short positions.
Range
An area between the support and resistance.
Relative Strength Index (RSI)
A technical momentum indicator that compares the magnitude of recent gains to recent losses in an attempt to determine
overbought and oversold conditions in an asset. The RSI ranges from 0 to 100.Typically speaking, an asset is deemed to be
overbought once the RSI approaches the 70 level, and likewise, as the RSI approaches 30, it is deemed to be oversold.
Fibonacci Retracement
Refers to areas of support or resistance. A Fibonacci retracement shows the potential retracement of a financial asset
relative to the original move in price. A trend line is drawn between two points and then the vertical distance is divided by
key Fibonacci ratios; 23.60%, 38.25%, 50.00%, 61.80% and 100.00%. This tool can also be used as a projection method.
Moving Average Convergence Divergence (MACD)
A trend-following momentum indicator that shows the relationship between two moving averages of prices. The MACD is
calculated by subtracting the 26-day exponential moving average (EMA) from the 12-day EMA. A nine-day EMA of the
MACD, called the "signal line", is then plotted on top of the MACD, functioning as a trigger for buy and sell signals on the
crossover of the two lines. The histogram highlights the narrowing and widening of the two averages acting as an indicator
for slowing or increasing momentum in the market. I.E a flattening or decreasing histogram in an upward market would
suggest that the upward move could soon stall.

[Grab your reader’s attention with a great quote from the document or use this space to emphasize a key point. To place this
text box anywhere on the page, just drag it.]
i
Technical Report Global Leader Dry Bulk Derivatives
‘Risk Disclosure: Trading derivative products such as swaps, futures and options carries with it a substantial risk of loss. Transactional fees such
as broker commission and clearing costs will be applied and these can vary depending on the type of product traded as well as the venue used
for execution. These products are not suitable for all investors. For any further information or to discuss the use of these products please speak
to your broker or relationship manager.’
Award winning broker
In 2015 FIS was named as the best performing inter-dealing broker in Iron Ore swaps and options by Singapore-based SGX
AsiaClear for the third consecutive year.
For More information on this report please contact:
Edward Hutton
Tel: +44(0)20 7090 1121
E-mail [email protected]