first state global growth funds - doc.morningstar.com
TRANSCRIPT

First State Investments (Singapore)38 Beach Road#06-11 South Beach TowerSingapore 189767
Telephone: +65 6538 0008Facsimile: +65 6538 0800www.firststateinvestments.com Company registration number: 196900420D
First State Investments (Singapore)38 Beach Road#06-11 South Beach TowerSingapore 189767
Telephone: +65 6538 0008Facsimile: +65 6538 0800www.firststateinvestments.com Company registration number: 196900420D
First State Global Growth Funds
2018 Annual Report

First State Investments (Singapore)38 Beach Road#06-11 South Beach TowerSingapore 189767
Telephone: +65 6538 0008Facsimile: +65 6538 0800www.firststateinvestments.com Company registration number: 196900420D
First State Investments (Singapore)38 Beach Road#06-11 South Beach TowerSingapore 189767
Telephone: +65 6538 0008Facsimile: +65 6538 0800www.firststateinvestments.com Company registration number: 196900420D

Page
First State Asia Opportunities Fund – Class A, Class B
Manager’s report 3Distribution of investments 5Disclosures 6
First State Asian Growth Fund*
Manager’s report 7Distribution of investments 9Disclosures 10
First State Asian Quality Bond
Manager’s report 11Distribution of investments 13Disclosures 14
First State Bridge - Class A (Semi-Annually Distributing) ** , Class A (Monthly Distributing)
Manager’s report 16Distribution of investments 18Disclosures 20
First State Dividend Advantage*
Manager’s report 22Distribution of investments 24Disclosures 25
First State Global Balanced Fund
Manager’s report 26Distribution of investments 28Disclosures 30
First State Global Infrastructure
Manager’s report 31Distribution of investments 33Disclosures 34
First State Global Property Investments - Class A (Accumulation), Class A (Distribution)
Manager’s report 35Distribution of investments 37Disclosures 38
First State Regional China Fund*
Manager’s report 39Distribution of investments 41Disclosures 42
First State Regional India Fund
Manager’s report 43Distribution of investments 46Disclosures 47
TABLE OF CONTENTS
1

Page
First State Singapore Growth Fund
Manager’s report 48Distribution of investments 50Disclosures 51
Stewart Investors Global Emerging Markets Leaders Fund
Manager’s report 52Distribution of investments 54Disclosures 55
Stewart Investors Worldwide Leaders Fund
Manager’s report 56Distribution of investments 58Disclosures 59
Audited Financial Statements
Report of the Trustee 60Statement by the Manager 61Independent Auditor’s Report 62Statements of Total Return 65Statements of Financial Position 72Statements of Movements of Unitholders’ Funds 79Statements of Portfolio 86Notes to the Financial Statements 91
* Eligible for CPFIS-OA investments** Eligible for both CPFIS-OA and SA investments
TABLE OF CONTENTS
The CPF interest rate for the Ordinary Account (OA) is based on the 12-month fixed deposit and month-endsavings rates of the major local banks. Under the CPF Act, the CPF Board pays a minimum interest of 2.5%per annum when this interest formula yields a lower rate. The interest rate for the Special and MedisaveAccounts (SMA) is pegged to the 12-month average yield of 10-year Singapore Government Securities(10YSGS) plus 1%. The interest rate to be credited to the Retirement Account (RA) will be the weightedaverage interest of the entire portfolio of Special Government Securities (SSGS) which the RA savings areinvested in, which earn a fixed coupon equal to the 12-month average yield of the 10YSGS plus 1% at thepoint of issuance. As announced on 27 September 2018, the government will maintain the 4% per annumminimum rate for interest earned on all SMA and RA monies until 31 December 2019, subject to updates fromthe CPF board. The CPF Board will pay an extra interest rate of 1% per annum on the first S$60,000 of a CPFmember's combined balances, including up to S$20,000 in the OA. In addition, CPF members aged 55 andabove will also earn an additional 1% extra interest on the first $30,000 of their combined balances (with up to$20,000 from the OA). Only monies in excess of S$20,000 in the OA and S$40,000 in the Special Accountcan be invested.
2

Annual Report for the financial year ended 31 December 2018
First State Asia Opportunities Fund
MANAGER'S REPORT
for the period from 1 January to 31 December 2018
Historical performance*
in Singapore dollarsClass A Sub-Fund Benchmark
% %
3-mths -4.8 -8.86-mths -5.3 -10.01-year -4.9 -12.43-years 3.6 7.45-years 6.8 5.910-years 11.2 9.8Since Inception - 26 November 1999 1.0 -0.1(Calculated since date of first valuation)
Class B Sub-Fund Benchmark
% %
3-mths -4.6 -8.86-mths -5.0 -10.01-year -4.2 -12.43-years n/a n/a5-years n/a n/a10-years n/a n/aSince Inception - 10 November 2016 3.9 6.3(Calculated since date of first valuation)
Note:
• •
* Source: Lipper, First State Investments. No initial charges with income reinvested in Singapore dollars.
Accordingly, the benchmark performance set out above uses the performance of the following:Inception to 30 November 2008 : MSCI AC Asia Information Technology Index
The Sub-Fund invests all or substantially all of its asset in the First State Asia Opportunities Fund (a Dublin-domiciled fund) with effect from 18 October 2002.
The performance prior to 18 October 2002 is in relation to the Sub-Fund before its conversion to a feederfund. Performance for 1 year and above has been annualised.
The benchmark of the Sub-Fund is MSCI AC Asia ex Japan Index. It was changed from MSCI AC AsiaInformation Technology Index from 1 December 2008. The new benchmark is intended to be more consistentwith the new investment scope of the Underlying Fund which took effect on 1 December 2008.
From 1 December 2008 : MSCI AC Asia ex Japan Index
3

Annual Report for the financial year ended 31 December 2018
First State Asia Opportunities Fund
MANAGER'S REPORT
Performance
Transactions
Outlook
The MSCI AC Asia ex Japan index decreased by 14.4% in US dollar terms in the 12 months to the end of December2018. China and South Korea were the worst performers, while Malaysia and Thailand declined the least. On asector level, Information Technology and Consumer Discretionary lagged the most, while Utilities and ConsumerStaples were the strongest.
The Sub-Fund declined by 6.5% over the 12 months to 31 December 2018. Detracting from performance, Vodafone
Idea weakened as its subscriber numbers and revenue declined amid competitive pressures in the telecoms sector.Hanssem was lower, due to increased competition and a weaker property cycle, and Cemex Holdings Philippines
was negative due to lower selling prices for domestic cement.
On the positive side, Tata Consultancy Services ("TCS") reported an uptick in revenue and margins. TCS’sbusiness model has evolved towards higher margin ‘digital transformation’ consultancy services, where it hadsecured a number of deals with large clients such as Transamerica, Marks and Spencer and Rolls Royce. CSL
Limited saw accelerating demand for both its flu vaccines and its core immunoglobulin products, which canincreasingly be used as a secondary treatment for haematological cancers. Dairy Farm was boosted by theleadership of its new CEO, Ian McLeod, with significant personnel and cultural shifts within the company. Thecompany has started its rationalisation process in Southeast Asia, closing stores and cutting costs to improvebusiness operations.
Significant purchases over the year included Cognizant Technology Solutions, on expectations of a turnaround inthe Indian technology outsourcing sector. The valuation seemed attractive for what looked like improving marginsand steady growth. The Sub-Fund also added DBS Group after a good meeting with the CEO. Its market share hadimproved and cost-to-income had declined due to investments in technology – which suggests that the bank couldearn higher returns-on-equity over this cycle.
The Sub-Fund divested Sun Art Retail Group, due to expensive valuations. Recent results were lacklustre, with aslowdown in same store sales growth and a fall in operating profit. The Sub-Fund also disposed of HDFC Standard
Life Insurance, after the departure of their CEO and on valuation concerns.
Despite the flurry of market outlooks typically written at the start of a new year, not much has actually changed. Wefear that it is the same old issues – rising interest rates, slowing demand growth, lower global trade volumes, anddebt-laden companies and governments – that will challenge Asian equity markets again this year. If, as some macroforecasters suggest, the US economy weakens this year (as fiscal stimulus packages expire), perhaps China’sbolstering domestic policies might prop up the global economy instead. On the other hand, the ongoing war ofattrition between the two countries on trade imbalances and other ‘unfair trade practices’ seems likely to weigh onglobal markets for some time yet.
We do not pay too much attention to the gyrations of market forecasters, however, preferring to spend our timeresearching companies and talking to management. We remain resolutely-focused on quality (of management,franchise and financials), which has helped our Asian portfolios remain relatively defensive amidst the marketvolatility. While we understand that such periods are worrying for clients, they provide us with opportunities to top upour holdings and buy into quality companies at cheaper prices – thus contributing to better long-term absolutereturns.
4

Annual Report for the financial year ended 31 December 2018
First State Asia Opportunities Fund
DISTRIBUTION OF INVESTMENTS
As at 31 December 2018
Holdings Market Value % of NAV
S$
FIRST STATE ASIA OPPORTUNITIES FUND
Ireland
First State Asia Opportunities Fund 342,328 20,194,146 99.04Total investments 20,194,146 99.04Other net assets 195,654 0.96Total net assets attributable to unitholders 20,389,800 100.00
DISTRIBUTION OF INVESTMENTS (UNDERLYING FUND)
Market Value % of NAV
S$
Top 10 holdings (as at 31 December 2018)
Tata Consultancy Services Ltd 2,610,249 5.3Newcrest Mining Ltd 2,428,024 4.9Taiwan Semiconductor Mfg Co Ltd 2,339,374 4.7Tech Mahindra Ltd 2,029,099 4.1Haw Par Corp Ltd 1,817,324 3.7HDFC Bank Limited 1,753,299 3.6Housing Development Finance Corp Ltd 1,684,349 3.4Dairy Farm International Holdings Ltd 1,516,899 3.1Uni-President Enterprises Corp 1,447,949 2.9CSL Ltd 1,403,624 2.9
Top 10 holdings (as at 31 December 2017)
Taiwan Semiconductor Mfg Co Ltd 2,697,131 4.8Newcrest Mining Ltd 2,473,766 4.4Haw Par Corp Ltd 2,367,667 4.2Tata Consultancy Services Ltd 2,283,906 4.1Towngas China Co Ltd 1,909,769 3.4Dairy Farm International Holdings Ltd 1,826,008 3.3CSL Ltd 1,714,325 3.1Midea Group Co Ltd 1,664,068 3.0MediaTek Inc 1,613,811 2.9CK Hutchison Holding 1,585,890 2.8
5

Annual Report for the financial year ended 31 December 2018
First State Asia Opportunities Fund
DISCLOSURES
Subscriptions S$1,562,054
Redemptions S$6,400,93131 December 2018 31 December 2017
Expense Ratio** (Class A) 2.25% 2.27%(including that of the Underlying Fund)Expense Ratio** (Class B) 1.53% 1.51%(including that of the Underlying Fund)Portfolio Turnover 5.95% 9.98%Disclosures on the Underlying Fund -
Portfolio Turnover 28.3% 42.3%
Expense Ratio** 2.01% 1.98%
** In accordance with IMAS guidelines, expense ratio is stated on an annualised basis.
Related Party Transactions
For the financial year ended 31 December 2018
The Trustee is HSBC Institutional Trust Services (Singapore) Limited, a subsidiary of the HSBC Group.S$
Bank service fees paid to HSBC 9,720
Bank balances outstanding with HSBC as at 31 December 2018
S$ equivalent
Singapore Dollar 136,288United States Dollar 16,356
Foreign exchange transacted with HSBC for the financial year ended 31 December 2018
Currency Amount Currency Amount
Singapore Dollar 5,165,361 Singapore Dollar 144,528United States Dollar 108,120 United States Dollar 3,902,295
Others
Soft dollar commissions
Commission Sharing Arrangement
As at 31 December 2018, the Sub-Fund did not hold any bonds, derivatives or other unit trusts, other than the FirstState Asia Opportunities Fund Class I shares, constituting 99.04% of the Sub-Fund’s Net Asset Value and at amarket value of S$20,194,146. In addition, the Sub-Fund did not hold any investment constituting more than 5% of acompany’s outstanding share capital and/or debt issue. There were also no borrowings, outstanding currencyforward contracts or material information that would adversely impact the valuation of the Sub-Fund.
In order to align with the policy of First State Investments internationally, the Investment Manager has ceased all of its soft dollar arrangements previously made with brokers with effect from 13 June 2005.
There were no commission sharing arrangement in place during the year or at the year end 31 December 2018 or atthe year end 31 December 2017.
In the normal course of business of the Sub-Fund, trustee’s fees and registration fees have been paid or are payableto the Trustee, while management fees have been paid or are payable to the Manager, as noted in the Statement ofTotal Return (Page 65 – 71). Transactions with related parties were at terms agreed between the parties and withinthe provisions of the Trust Deed.
Sales
The expense ratio does not include brokerage and other transaction costs, performance fee, foreign exchange gainsor losses, front or back end loads arising from the purchase or sale of other funds, tax deducted at source or arisingout of income received and dividends and other distributions paid to unitholders.
Purchases
6

Annual Report for the financial year ended 31 December 2018
First State Asian Growth Fund
MANAGER'S REPORT
for the period from 1 January to 31 December 2018
Historical performance*
in Singapore dollarsSub-Fund Benchmark
% %
3-mths -3.9 -8.86-mths -3.8 -10.01-year -2.7 -12.43-years 3.9 7.45-years 6.7 5.910-years 9.6 9.8Since Inception – 10 October 1984 7.2 n/a(Calculated since date of first valuation)
Note:
••
* Source: Lipper, First State Investments. No initial charges with income reinvested in Singapore dollars.
The benchmark of the Sub-Fund is the MSCI AC Asia ex Japan Index. It was changed from MSCI All CountryFar East ex Japan Index from 2 November 2005 in order to include India in the benchmark to be moreconsistent with the Sub-Fund’s investment scope.
Accordingly, the benchmark performance set out above uses the performance of the following:Inception to 1 November 2005: MSCI All Country Far East ex Japan IndexFrom 2 November 2005: MSCI AC Asia ex Japan Index
The Sub-Fund invests all or substantially all of its asset in the First State Asian Growth Fund (a Dublin-domiciled fund) with effect from 18 October 2002.
The performance prior to 18 October 2002 is in relation to the Sub-Fund before its conversion to a feederfund. Performance for 1 year and above has been annualised.
7

Annual Report for the financial year ended 31 December 2018
First State Asian Growth Fund
MANAGER'S REPORT
Performance
Transactions
Outlook
Significant purchases over the year included Cognizant Technology Solutions, on expectations of a turnaround inthe Indian technology outsourcing sector. The valuation seemed attractive for what looked like improving marginsand steady growth. The Sub-Fund also added DBS Group after a good meeting with the CEO. Its market share hadimproved and cost-to-income had declined due to investments in technology – which suggests that the bank couldearn higher returns-on-equity over this cycle.
The Sub-Fund divested Sun Art Retail Group, due to expensive valuations. Recent results were lacklustre, with aslowdown in same store sales growth and a fall in operating profit. The Sub-Fund also disposed of Vodafone Idea, on concerns around the competitive challenges in the Indian telecom industry.
Despite the flurry of market outlooks typically written at the start of a new year, not much has actually changed. Wefear that it is the same old issues – rising interest rates, slowing demand growth, lower global trade volumes, anddebt-laden companies and governments – that will challenge Asian equity markets again this year. If, as some macroforecasters suggest, the US economy weakens this year (as fiscal stimulus packages expire), perhaps China’sbolstering domestic policies might prop up the global economy instead. On the other hand, the ongoing war ofattrition between the two countries on trade imbalances and other ‘unfair trade practices’ seems likely to weigh onglobal markets for some time yet.
We do not pay too much attention to the gyrations of market forecasters, however, preferring to spend our timeresearching companies and talking to management. We remain resolutely-focused on quality (of management,franchise and financials), which has helped our Asian portfolios remain relatively defensive amidst the marketvolatility. While we understand that such periods are worrying for clients, they provide us with opportunities to top upour holdings and buy into quality companies at cheaper prices – thus contributing to better long-term absolutereturns.
The MSCI AC Asia ex Japan index declined by 14.4% in US dollar terms in the 12 months to the end of December2018. China and South Korea were the worst performers, while Malaysia and Thailand declined the least. On asector level, Information Technology and Consumer Discretionary lagged the most, while Utilities and ConsumerStaples were the strongest.
The Sub-Fund declined by 3.0% over the 12 months to 31st December 2018. Detracting from performance,Vodafone Idea weakened due to rising competitive pressure in the telecoms sector. Hanssem was lower, due toincreased competition and a weaker property cycle, and Naver declined as losses from Line, its Japan-based mobilemessaging unit, hit profits.
On the positive side, Tata Consultancy Services ("TCS") reported an uptick in revenue and margins. TCS’sbusiness model is evolving towards higher margin ‘digital transformation’ consultancy services, where it has secureda number of deals with large clients such as Transamerica, Marks and Spencer and Rolls Royce. Dairy Farm
International was boosted by the leadership of its new CEO, Ian McLeod, following significant personnel and culturalshifts within the company. The Hong Kong and China Gas Company benefitted from the government’s push fromcoal to gas, with growth accelerating as projects in China ramped up.
8

Annual Report for the financial year ended 31 December 2018
First State Asian Growth Fund
DISTRIBUTION OF INVESTMENTS
As at 31 December 2018
Holdings Market Value % of NAV
S$
FIRST STATE ASIAN GROWTH FUND
Ireland
First State Asian Growth Fund 965,600 58,935,513 99.19Total investments 58,935,513 99.19Other net assets 479,350 0.81Total net assets attributable to unitholders 59,414,863 100.00
DISTRIBUTION OF INVESTMENTS (UNDERLYING FUND)
Market Value % of NAV
S$
Top 10 holdings (as at 31 December 2018)
Housing Development Finance Corp Ltd 35,435,363 5.0Oversea-Chinese Banking Corp 35,365,194 5.0Tata Consultancy Services Ltd 35,295,025 5.0Newcrest Mining Ltd 34,663,504 4.9Taiwan Semiconductor Mfg Co Ltd 30,453,362 4.3Dairy Farm International Holdings Ltd 29,330,657 4.2HDFC Bank Limited 28,979,812 4.1Tech Mahindra Ltd 26,313,389 3.8Kotak Mahindra Bank 24,629,332 3.5Jardine Matheson Holdings Ltd 20,068,344 2.9
Top 10 holdings (as at 31 December 2017)
Taiwan Semiconductor Mfg Co Ltd 39,682,865 5.4Newcrest Mining Ltd 36,579,178 5.0Oversea-Chinese Banking Corp 36,505,280 4.9Tata Consultancy Services Ltd 31,258,570 4.2HDFC Bank Limited 30,076,213 4.1Housing Development Finance Corp Ltd 29,411,137 4.0Dairy Farm International Holdings Ltd 28,154,882 3.8CK Hutchison Holding 27,046,422 3.7Tech Mahindra Ltd 23,277,658 3.2Midea Group Co Ltd 23,203,761 3.1
9

Annual Report for the financial year ended 31 December 2018
First State Asian Growth Fund
DISCLOSURES
Subscriptions S$12,579,587
Redemptions S$21,667,059
31 December 2018 31 December 2017
Expense Ratio** 1.73% 1.75%(including that of the Underlying Fund)Portfolio Turnover 7.05% 8.38%
Disclosures on the Underlying Fund -
Portfolio Turnover 27.4% 29.3%
Expense Ratio** 1.60% 1.60%
** In accordance with IMAS guidelines, expense ratio is stated on an annualised basis.
Related Party Transactions
For the financial year ended 31 December 2018
The Trustee is HSBC Institutional Trust Services (Singapore) Limited, a subsidiary of the HSBC Group.S$
Bank service fees paid to HSBC 13,852
Bank balances outstanding with HSBC as at 31 December 2018
S$ equivalent
Singapore Dollar 277,779United States Dollar 1,363
Foreign exchange transacted with HSBC for the financial year ended 31 December 2018
Currency Amount Currency Amount
Singapore Dollar 10,709,928 Singapore Dollar 380,948United States Dollar 284,904 United States Dollar 7,936,788Others
Soft dollar commissions
In the normal course of business of the Sub-Fund, trustee’s fees and registration fees have been paid or are payableto the Trustee, while management fees have been paid or are payable to the Manager, as noted in the Statement ofTotal Return (Page 65 – 71). Transactions with related parties were at terms agreed between the parties and withinthe provisions of the Trust Deed.
There were no commission sharing arrangement in place during the year or at the year end 31 December 2018 or atthe year end 31 December 2017.
The expense ratio does not include brokerage and other transaction costs, performance fee, foreign exchange gainsor losses, front or back end loads arising from the purchase or sale of other funds, tax deducted at source or arisingout of income received and dividends and other distributions paid to unitholders.
Purchases Sales
As at 31 December 2018, the Sub-Fund did not hold any bonds, derivatives or other unit trusts, other than the FirstState Asian Growth Fund Class I shares, constituting 99.19% of the Sub-Fund’s Net Asset Value and at a marketvalue of S$58,935,513. In addition, the Sub-Fund did not hold any investment constituting more than 5% of acompany’s outstanding share capital and/or debt issue. There were also no borrowings, outstanding currencyforward contracts or material information that would adversely impact the valuation of the Sub-Fund.
In order to align with the policy of First State Investments internationally, the Investment Manager has ceased all ofits soft dollar arrangements previously made with brokers with effect from 13 June 2005.
Commission Sharing Arrangement
10

Annual Report for the financial year ended 31 December 2018
First State Asian Quality Bond
MANAGER'S REPORT
for the period from 1 January to 31 December 2018
Historical performance*
in Singapore dollarsSub-Fund Benchmark
% %
3-mths 0.2 0.96-mths 0.3 1.61-year -2.6 -0.73-years n/a n/a5-years n/a n/a10-years n/a n/aSince Inception – 1 November 2016 -0.5 0.7(Calculated since date of first valuation)
Note:
* Source: Lipper, First State Investments. No initial charges with income reinvested in Singapore dollars.
The Sub-Fund invests all or substantially all of its assets in the First State Asian Quality Bond (a Dublin-domiciled fund).
The benchmark of the Sub-Fund is the JP Morgan Asia Credit Investment Grade Index (Hedged to SGD).Performance for 1 year and above has been annualised
11

Annual Report for the financial year ended 31 December 2018
First State Asian Quality Bond
MANAGER'S REPORT
Outlook
2018 turned out to be a tumultuous year during which market sentiment was largely hampered by the escalatingtension around the trade war between China and the US coupled with the Fed and ECB’s continued tightening ofmonetary policies. Even though the Fed hiked policy rate gradually once a quarter, it brought about significant sellingpressure in both emerging markets spreads and currencies. Asian credits were not spared especially in the secondhalf of the year coinciding with a significant correction in global equity markets.
The year will also be best remembered as a year when we have a divergence in growth and monetary policies mostnotably between the US and China. As the negative impact of the trade war started to bite, the People’s Bank ofChina cut its reserve requirement ratio for banks and continued boosting liquidity in the banking system and vowed to remain on an easing mode for as long as the trade tension persists.
Despite widening spreads and US treasuries yield normalizing, the JP Morgan Asia Credit Investment Grade Index(JACI IG) lost only 0.04%. For the year, investment grade spread widened by 55bps to 214bps while 10 year UStreasury yield edged higher by 28bps to 2.68%.
New issuance market remained active though not as vibrant as the year before. Total issuance came in at USD192b, representing a 29% decline year over year. The default by Noble group during the first quarter of the yearalong with the bearish sentiments led to investors putting more focus on credit differentiation. This also resulted inhigher new issue premium in many of the issues that followed.
While we are comforted by the generally strong credit fundamentals in Asia, the biggest risk for Asian InvestmentGrade Bond ("IG") at the moment would be a continued weakness in US Investment Grade Bond ("IG") as marketcontinues to reprice to tighter global liquidity conditions. We believe focusing on credit fundamentals and relativevalue opportunities will yet again be key in delivering good performance in what could be another turbulent year.
Within China, we see value in the IG property space. Technology names look attractive too though they will still bevulnerable to headline news concerning US and China. We have turned cautious on Indian corporates amid thepolitical uncertainty and an uncertain macro backdrop. We are positive on Indonesian’s fundamentals though itsperformance will large hinge on how the broader emerging market performs.
12

Annual Report for the financial year ended 31 December 2018
First State Asian Quality Bond
DISTRIBUTION OF INVESTMENTS
As at 31 December 2018
Holdings Market Value % of NAV
S$
FIRST STATE ASIAN QUALITY BOND
Ireland
First State Asian Quality Bond 393,390 8,761,364 97.91Total investments 8,761,364 97.91Other net assets 186,916 2.09Total net assets attributable to unitholders 8,948,280 100.00
DISTRIBUTION OF INVESTMENTS (UNDERLYING FUND)
Market Value % of NAV
S$
Top 10 holdings (as at 31 December 2018)
Vanke Real Estate Co Ltd 3.975% 09/11/2027 36,428,132 3.9Vigorous Champion International Ltd 4.375% 10/09/2023 28,803,639 3.1Treasury Note (OTR) 2.50% 31/12/2020 27,391,696 2.9Hyundai Capital Services Inc 3.00% 29/08/2022 26,450,400 2.8Nuoxi Capital Ltd 5.35% 24/01/2023 25,320,846 2.7United Overseas Bank Ltd 3.875% 31/12/2049 24,850,198 2.6Azure Nova International Finance Ltd 3.50% 21/03/2022 23,814,773 2.5Cnac HK Finbridge Co Ltd 5.125% 14/03/2028 22,779,348 2.4Gohl Capital Ltd 4.25% 24/01/2027 21,743,923 2.3Franshion Brilliant Ltd 3.60% 03/03/2022 19,861,333 2.1
Top 10 holdings (as at 31 December 2017)
Hyundai Capital Services Inc 3.00% 29/08/2022 26,288,795 3.1Nexen Inc 6.40% 15/05/2037 24,783,632 2.9Azure Nova International Finance Ltd L MTN 3.50% 21/03/2022 20,947,545 2.4Oversea Chinese Banking Corp Ltd MTN RegS 4.25% 19/06/2024 20,005,894 2.3Pertamina (Persero) Pt RegS 6.00% 03/05/2042 19,887,971 2.3Franshion Brilliant Ltd RegS 3.60% 03/03/2022 19,905,210 2.3China Resources Land Ltd 4.375% 27/02/2019 19,292,477 2.2Huarong Finance Co Ltd 5.50% 27/04/2047 14,604,803 1.7Citic Ltd 2.80% 14/12/2021 13,985,363 1.6Hyundai Capital Services Inc 3.625% 29/08/2027 14,017,695 1.6
13

Annual Report for the financial year ended 31 December 2018
First State Asian Quality Bond
DISCLOSURES
Subscriptions S$2,055,616
Redemptions S$6,154,555
31 December 2018 31 December 2017
Expense Ratio** 1.55% 1.48%
Portfolio Turnover 12.16% 414.15%
Disclosures on the Underlying Fund -
Portfolio Turnover 45.9% 70.8%
Expense Ratio** 1.09% 1.08%
** In accordance with IMAS guidelines, expense ratio is stated on an annualised basis.
Related Party Transactions
For the financial year ended 31 December 2018
The Trustee is HSBC Institutional Trust Services (Singapore) Limited, a subsidiary of the HSBC Group.S$
Bank service fees paid to HSBC 5,321
Bank balances outstanding with HSBC as at 31 December 2018
S$ equivalent
Singapore Dollar * 62,209United States Dollar 7,779
Foreign exchange transacted with HSBC for the financial year ended 31 December 2018
There were no foreign exchange transaction with HSBC during the year from 1 January 2018 to 31 December 2018.
In the normal course of business of the Sub-Fund, trustee’s fees and registration fees have been paid or are payableto the Trustee, while management fees have been paid or are payable to the Manager, as noted in the Statement ofTotal Return (Page 65 – 71). Transactions with related parties were at terms agreed between the parties and withinthe provisions of the Trust Deed.
(including that of the Underlying Fund)
The expense ratio does not include brokerage and other transaction costs, performance fee, foreign exchange gainsor losses, front or back end loads arising from the purchase or sale of other funds, tax deducted at source or arisingout of income received and dividends and other distributions paid to unitholders.
14

Annual Report for the financial year ended 31 December 2018
First State Asian Quality Bond
Others
Financial Derivative Instruments
a. Global Exposure
i)
ii)
iii)
(a) the reduction of exposure to counterparties of OTC financial derivatives; and
(b) EPM techniques relating to securities lending and repurchase transactions, and that are reinvested.
b. Collateral
Nil for the year ended 31 December 2018.
c. Securities Lending or Repurchase Transactions
Nil for the year ended 31 December 2018.
Soft dollar commissions
There were no commission sharing arrangement in place during the year or at the year end 31 December 2018 or atthe year end 31 December 2017.
The global exposure of each Sub-Fund to financial derivatives or embedded financial derivatives will not exceed100% of that Sub-Fund’s net asset value at any time.
In order to align with the policy of First State Investments internationally, the Investment Manager has ceased all ofits soft dollar arrangements previously made with brokers with effect from 13 June 2005.
Commission Sharing Arrangement
the sum of the values of cash collateral received pursuant to:
the absolute value of the net exposure of each individual financial derivative after netting or hedgingarrangements; and
As at 31 December 2018, the Sub-Fund did not hold any bonds or other unit trusts, other than the First State AsianQuality Bond Fund Class I shares (constituting 97.91% of the Sub-Fund’s Net Asset Value and at a market value ofS$8,761,364). The Sub-Fund holds forward currency contracts with market value of unrealised gain of S$105,200(constituting 1.18% of the Sub-Fund’s Net Asset Value) as at end of the period, and realised loss of S$386,056 forthe period. In addition, the Sub-Fund did not hold any investment constituting more than 5% of a company’soutstanding share capital and/or debt issue. There were also no borrowings or material information that wouldadversely impact the valuation of the Sub-Fund.
The global exposure relating to derivative instruments is calculated using the commitment approach which iscalculated as the sum of:
the absolute value of the exposure of each individual financial derivative not involved in netting or hedgingarrangements;
15

Annual Report for the financial year ended 31 December 2018
First State Bridge
MANAGER'S REPORT
for the period from 1 January to 31 December 2018
Historical performance*
in Singapore dollars
Class A (Semi-Annually Distributing) Fund Benchmark
% %
3-mths -2.7 -3.96-mths -2.5 -4.21-year -2.8 -6.53-years 5.2 5.25-years 6.2 5.210-years 8.7 8.4Since Inception – 14 July 2003 6.9 6.2(Calculated since date of first valuation)
Class A (Monthly Distributing) Sub-Fund Benchmark
% %
3-mths -2.7 -3.96-mths -2.5 -4.21-year n/a n/a3-years n/a n/a5-years n/a n/a10-years n/a n/aSince Inception - 10 May 2018 -2.6 -6.0(Calculated since date of first valuation)
Note:
* Source: Lipper, First State Investments. No initial charges with income reinvested in Singapore dollars.
The Sub-Fund invests all or substantially all of its assets in the First State Asian Equity Plus Fund, a Dublin-domiciled fund (in relation to the equity portion) and the First State Asian Quality Bond Fund, a Dublin-domiciled fund (in relation to the fixed income portion).
Performance for 1 year and above has been annualised.
The benchmark is calculated by First State Investments comprising 50% MSCI AC Asia Pacific ex JapanIndex (Unhedged) and 50% JP Morgan Asia Credit Investment Grade Index (Hedged to SGD). There hasbeen a change in the data source for the JP Morgan Asia Credit Investment Grade Index which was computedinternally by the Manager based on the index in USD as the SGD hedged version of the index was notavailable when the Sub-Fund was launched. With effect from 1 November 2012, the benchmark data for theJP Morgan Asia Credit Investment Grade Index (Hedged to SGD) will be sourced directly from the indexcompiler JP Morgan.
16

Annual Report for the financial year ended 31 December 2018
First State Bridge
MANAGER'S REPORT
Outlook
2018 turned out to be a tumultuous year, during which market sentiment was largely hampered by the escalatingtension around the trade war between China and the US, coupled with the Fed and ECB’s continued tightening ofmonetary policies. Even though the Fed hiked the policy rate only gradually (once a quarter), it brought aboutsignificant selling pressure in both emerging markets spreads and currencies. Asian equities and Asian creditmarkets were not spared, coinciding with a significant correction over the year.
The MSCI AC Asia Pacific ex Japan index decreased by 14% in US dollar terms in 2018. China and South Koreaunderperformed, while Thailand and Malaysia posted a more moderate decline. On a sector level, InformationTechnology and Consumer Discretionary fell the most, while Utilities and Consumer Staples were strongest.
Despite widening spreads and US treasuries yield normalizing, the JP Morgan Asia Credit Investment Grade Index(JACI IG) lost only 0.04%. For the year, investment grade spread widened by 55bps to 214bps while 10 year UStreasury yield edged higher by 28bps to 2.68%.
New issuance market remained active though not as vibrant as the year before. Total issuance came in at USD192bn, representing a 29% decline year over year. The default by Noble group during the first quarter of the yearalong with the bearish sentiments led to investors putting more focus on credit differentiation. This also resulted inhigher new issue premium in many of the issues that followed.
The year will also be best remembered as a year of divergent growth and monetary policies, most notably betweenthe US and China. As the negative impact of the trade war started to bite, the People’s Bank of China cut its reserverequirement ratio for banks, boosted liquidity in the banking system and vowed to remain on an easing mode for aslong as the trade tension persists.
Despite the flurry of market outlooks typically written at the start of a new year, not much has actually changed. Wefear that it is the same old issues – rising interest rates, slowing demand growth, lower global trade volumes, anddebt-laden companies and governments – that will challenge Asian equity markets again this year. If, as some macroforecasters suggest, the US economy weakens this year (as fiscal stimulus packages expire), perhaps China’sbolstering domestic policies might prop up the global economy instead. On the other hand, the ongoing war ofattrition between the two countries on trade imbalances and other ‘unfair trade practices’ seems likely to weigh onglobal markets for some time yet.
We do not pay too much attention to the gyrations of market forecasters, however, preferring to spend our timeresearching companies and talking to management. We remain resolutely-focused on quality (of management,franchise and financials), which has helped our Asian portfolios remain relatively defensive amidst the marketvolatility. While we understand that such periods are worrying for clients, they provide us with opportunities to top upour holdings and buy into quality companies at cheaper prices – thus contributing to better long-term absolutereturns.
While we are comforted by the generally strong credit fundamentals in Asia, the biggest risk for Asian InvestmentGrade ("IG") at the moment would be a continued weakness in US Investment Grade Bond ("IG") as marketcontinues to reprice to tighter global liquidity conditions. We believe focusing on credit fundamentals and relativevalue opportunities will yet again be key in delivering good performance in what could be another turbulent year.
Within China, we see value in the IG property space. Technology names look attractive too though they will still bevulnerable to headline news concerning US and China. We have turned cautious on Indian corporates amid thepolitical uncertainty and an uncertain macro backdrop. We are positive on Indonesian’s fundamentals though itsperformance will large hinge on how the broader emerging market performs.
17

Annual Report for the financial year ended 31 December 2018
First State Bridge
DISTRIBUTION OF INVESTMENTS
As at 31 December 2018
Holdings Market Value % of NAV
S$
FIRST STATE BRIDGE
Ireland
First State Asian Equity Plus Fund 12,284,041 825,102,360 48.82First State Asian Quality Bond Fund 38,324,372 853,538,185 50.50Total investments 1,678,640,545 99.32Other net assets 11,429,436 0.68Total net assets attributable to unitholders 1,690,069,981 100.00
DISTRIBUTION OF INVESTMENTS (UNDERLYING FUND)
Market Value % of NAV
S$
Top 10 holdings (as at 31 December 2018)
Equities
HDFC Bank Limited 251,769,078 5.1Taiwan Semiconductor Mfg Co Ltd 245,287,893 4.9Oversea-Chinese Banking Corp 177,484,736 3.6Housing Development Finance Corp Ltd 171,502,104 3.4CSL Ltd 168,510,789 3.4Samsung Electronics Co Ltd 142,586,052 2.9ENN Energy Holdings Ltd 113,669,999 2.3Midea Group Co Ltd 112,174,341 2.3China Mengniu Dairy Company Limited 110,678,684 2.2AIA Group Limited 110,180,131 2.2
Fixed Income
Vanke Real Estate Co Ltd 3.975% 09/11/2027 36,428,132 3.9Vigorous Champion International Ltd 4.375% 10/09/2023 28,803,639 3.1Treasury Note (OTR) 2.50% 31/12/2020 27,391,696 2.9Hyundai Capital Services Inc 3.00% 29/08/2022 26,450,400 2.8Nuoxi Capital Ltd 5.35% 24/01/2023 25,320,846 2.7United Overseas Bank Ltd 3.875% 31/12/2049 24,850,198 2.6Azure Nova International Finance Ltd 3.50% 21/03/2022 23,814,773 2.5Cnac HK Finbridge Co Ltd 5.125% 14/03/2028 22,779,348 2.4Gohl Capital Ltd 4.25% 24/01/2027 21,743,923 2.3Franshion Brilliant Ltd 3.60% 03/03/2022 19,861,333 2.1
18

Annual Report for the financial year ended 31 December 2018
First State Bridge
DISTRIBUTION OF INVESTMENTS (UNDERLYING FUND)
Market Value % of NAV
S$
Top 10 holdings (as at 31 December 2017)
Equities
Taiwan Semiconductor Mfg Co Ltd 246,256,682 5.6HDFC Bank Limited 186,344,502 4.2Midea Group Co Ltd 159,472,127 3.6CSL Ltd 152,864,166 3.5Samsung Electronics Co Ltd 133,480,813 3.0Oversea-Chinese Banking Corp 130,397,098 3.0Housing Development Finance Corp Ltd 102,203,131 2.3CK Hutchison Holding 87,225,086 2.0AIA Group Limited 84,141,371 1.9ENN Energy Holdings Ltd 82,819,778 1.9
Fixed Income
Hyundai Capital Services Inc 3.00% 29/08/2022 26,288,795 3.1Nexen Inc 6.40% 15/05/2037 24,783,632 2.9Azure Nova International Finance Ltd L MTN 3.50% 21/03/2022 20,947,545 2.4Oversea Chinese Banking Corp Ltd MTN RegS 4.25% 19/06/2024 20,005,894 2.3Pertamina (Persero) Pt RegS 6.00% 03/05/2042 19,887,971 2.3Franshion Brilliant Ltd RegS 3.60% 03/03/2022 19,905,210 2.3China Resources Land Ltd 4.375% 27/02/2019 19,292,477 2.2Huarong Finance Co Ltd 5.50% 27/04/2047 14,604,803 1.7Citic Ltd 2.80% 14/12/2021 13,985,363 1.6Hyundai Capital Services Inc 3.625% 29/08/2027 14,017,695 1.6
19

Annual Report for the financial year ended 31 December 2018
First State Bridge
DISCLOSURES
Subscriptions S$570,557,811
Redemptions S$255,793,791
31 December 2018 31 December 2017
Expense Ratio** 1.44% 1.43%(including that of the Underlying Fund)Portfolio Turnover 198.63% 632.18%
Disclosures on the Underlying Fund -
Portfolio Turnover
First State Asian Equity Plus Fund 13.1% 27.5%First State Asian Quality Bond Fund 45.9% 70.8%
Expense Ratio**
First State Asian Equity Plus Fund 1.58% 1.58%First State Asian Quality Bond Fund 1.09% 1.08%
** In accordance with IMAS guidelines, expense ratio is stated on an annualised basis.
Related Party Transactions
For the financial year ended 31 December 2018
The Trustee is HSBC Institutional Trust Services (Singapore) Limited, a subsidiary of the HSBC Group.S$
Bank service fees paid to HSBC 29,815Interest received from Bank of HSBC (16,026)
Bank balances outstanding with HSBC as at 31 December 2018
S$ equivalent
Singapore Dollar 24,741United States Dollar 1,441,495
Foreign exchange transacted with HSBC for the financial year ended 31 December 2018
Currency Amount Currency Amount
Singapore Dollar 12,631,445 United States Dollar 9,361,131
In the normal course of business of the Sub-Fund, trustee’s fees and registration fees have been paid or are payableto the Trustee, while management fees have been paid or are payable to the Manager, as noted in the Statement ofTotal Return (Page 65 – 71). Transactions with related parties were at terms agreed between the parties and withinthe provisions of the Trust Deed.
The expense ratio does not include brokerage and other transaction costs, performance fee, foreign exchange gainsor losses, front or back end loads arising from the purchase or sale of other funds, tax deducted at source or arisingout of income received and dividends and other distributions paid to unitholders.
Purchases Sales
20

Annual Report for the financial year ended 31 December 2018
First State Bridge
Others
Financial Derivative Instruments
a. Global Exposure
i)
ii)
iii)
(a) the reduction of exposure to counterparties of OTC financial derivatives; and
(b) EPM techniques relating to securities lending and repurchase transactions, and that are reinvested.
b. Collateral
Nil for the year ended 31 December 2018.
c. Securities Lending or Repurchase Transactions
Nil for the year ended 31 December 2018.
Soft dollar commissions
There were no commission sharing arrangement in place during the year or at the year end 31 December 2018 or at the year end 31 December 2017.
Commission Sharing Arrangement
the absolute value of the exposure of each individual financial derivative not involved in netting or hedgingarrangements;
the absolute value of the net exposure of each individual financial derivative after netting or hedgingarrangements; and
the sum of the values of cash collateral received pursuant to:
The global exposure of each Sub-Fund to financial derivatives or embedded financial derivatives will not exceed100% of that Sub-Fund’s net asset value at any time.
In order to align with the policy of First State Investments internationally, the Investment Manager has ceased all ofits soft dollar arrangements previously made with brokers with effect from 13 June 2005.
The global exposure relating to derivative instruments is calculated using the commitment approach which iscalculated as the sum of:
As at 31 December 2018, the Sub-Fund did not hold any bonds or other unit trusts, other than the First State AsianEquity Plus Fund Class I (Dist) Shares (constituting 48.82% of the Sub-Fund’s Net Asset Value and at a marketvalue of S$825,102,360) and First State Asian Quality Bond Fund Class I shares (constituting 50.50% of the Sub-Fund’s Net Asset Value and at a market value of S$853,538,185). The Sub-Fund holds forward currency contractswith market value of unrealised gain of S$6,015,770 (constituting 0.36% of the Sub-Fund’s Net Asset Value) as atend of the period, and realised loss of S$28,266,660 for the period. In addition, the Sub-Fund did not hold anyinvestment constituting more than 5% of a company’s outstanding share capital and/or debt issue. There were alsono borrowings or material information that would adversely impact the valuation of the Sub-Fund.
21

Annual Report for the financial year ended 31 December 2018
First State Dividend Advantage
MANAGER'S REPORT
for the period from 1 January to 31 December 2018
Historical performance*
in Singapore dollarsSub-Fund Benchmark
% %
3-mths -5.9 -9.06-mths -5.6 -10.11-year -3.7 -12.03-years 8.0 6.85-years 9.3 5.110-years 11.7 9.5Since Inception - 20 December 2004 9.3 6.5(Calculated since date of first valuation)
Note:
* Source: Lipper, First State Investments. No initial charges with income reinvested in Singapore dollars.
Performance for 1 year and above has been annualised.
The benchmark of the Sub-Fund is the MSCI AC Asia Pacific ex Japan Index.
The Sub-Fund invests all or substantially all of its assets in the First State Asian Equity Plus Fund, a Dublin-domiciled fund.
22
Annual Report for the financial year ended 31 December 2018
First State Dividend Advantage
MANAGER'S REPORT
Performance
Transactions
Outlook
Significant purchases over the year included Cognizant Technology Solutions, on expectations of a turnaround inthe Indian technology outsourcing sector. The valuation seemed attractive for what looked like improving marginsand steady growth. The Sub-Fund also purchased Jardine Cycle & Carriage, on signs of a recovery at subsidiarycompany Astra and a promising outlook for its investments in Vietnam.
Over the year, the Sub-Fund disposed of Fast Retailing due to expensive valuations. The Sub-Fund also soldHanon Systems amid concerns over a downturn in the autos cycle. The company’s recent acquisition at the top ofthe market raised fears of a highly geared balance sheet with slowing growth.
Despite the flurry of market outlooks typically written at the start of a new year, not much has actually changed. Wefear that it is the same old issues – rising interest rates, slowing demand growth, lower global trade volumes, anddebt-laden companies and governments – that will challenge Asian equity markets again this year. If, as some macroforecasters suggest, the US economy weakens this year (as fiscal stimulus packages expire), perhaps China’sbolstering domestic policies might prop up the global economy instead. On the other hand, the ongoing war ofattrition between the two countries on trade imbalances and other ‘unfair trade practices’ seems likely to weigh onglobal markets for some time yet.
We do not pay too much attention to the gyrations of market forecasters, however, preferring to spend our timeresearching companies and talking to management. We remain resolutely-focused on quality (of management,franchise and financials), which has helped our Asian portfolios remain relatively defensive amidst the marketvolatility. While we understand that such periods are worrying for clients, they provide us with opportunities to top upour holdings and buy into quality companies at cheaper prices – thus contributing to better long-term absolutereturns.
The MSCI AC Asia Pacific ex Japan index decreased by 14% in US dollar terms in 2018. China and South Koreaunderperformed, while Thailand and Malaysia posted a more moderate decline. On a sector level, InformationTechnology and Consumer Discretionary fell the most, while Utilities and Consumer Staples were strongest.
The Sub-Fund declined by 5.4% over the 12 months to 31 December 2018. Detracting from performance, AAC
Technologies softened on concerns around weaker shipment expectations for the Apple iPhone in the second halfof 2018, while Minth Group weakened on softer than expected results and fears of US protectionism impacting itsNorth American business. Hanssem was also lower, due to increased competition and a weaker property cycle.
On the positive side, CSL Limited saw accelerating demand for both its flu vaccines and its core immunoglobulinproducts, which can increasingly be used as a secondary treatment for haematological cancers. ENN Energy
strengthened, driven by growth expectations for the year ahead. China’s environmental policies should continue tofuel higher levels of gas consumption. Tata Consultancy Services ("TCS") reported an uptick in revenue andmargins. TCS’s business model is evolving towards higher margin ‘digital transformation’ consultancy services,where it has secured a number of deals with large clients such as Transamerica, Marks and Spencer and RollsRoyce.
23

Annual Report for the financial year ended 31 December 2018
First State Dividend Advantage
DISTRIBUTION OF INVESTMENTS
As at 31 December 2018
Holdings Market Value % of NAV
S$
FIRST STATE DIVIDEND ADVANTAGE
Ireland
First State Asian Equity Plus Fund 37,048,301 2,488,484,007 100.55Total investments 2,488,484,007 100.55Other net liabilities (13,556,433) (0.55)Total net assets attributable to unitholders 2,474,927,574 100.00
DISTRIBUTION OF INVESTMENTS (UNDERLYING FUND)
Market Value % of NAV
S$
Top 10 holdings (as at 31 December 2018)
HDFC Bank Limited 251,769,078 5.1Taiwan Semiconductor Mfg Co Ltd 245,287,893 4.9Oversea-Chinese Banking Corp 177,484,736 3.6Housing Development Finance Corp Ltd 171,502,104 3.4CSL Ltd 168,510,789 3.4Samsung Electronics Co Ltd 142,586,052 2.9ENN Energy Holdings Ltd 113,669,999 2.3Midea Group Co Ltd 112,174,341 2.3China Mengniu Dairy Company Limited 110,678,684 2.2AIA Group Limited 110,180,131 2.2
Top 10 holdings (as at 31 December 2017)
Taiwan Semiconductor Mfg Co Ltd 246,256,682 5.6HDFC Bank Limited 186,344,502 4.2Midea Group Co Ltd 159,472,127 3.6CSL Ltd 152,864,166 3.5Samsung Electronics Co Ltd 133,480,813 3.0Oversea-Chinese Banking Corp 130,397,098 3.0Housing Development Finance Corp Ltd 102,203,131 2.3CK Hutchison Holding 87,225,086 2.0AIA Group Limited 84,141,371 1.9ENN Energy Holdings Ltd 82,819,778 1.9
24

Annual Report for the financial year ended 31 December 2018
First State Dividend Advantage
DISCLOSURES
Subscriptions S$1,056,841,386
Redemptions S$479,636,946
31 December 2018 31 December 2017
Expense Ratio** 1.71% 1.71%(including that of the Underlying Fund)Portfolio Turnover 367.96% 1220.20%
Disclosures on the Underlying Fund -
Portfolio Turnover 13.1% 27.5%
Expense Ratio** 1.58% 1.58%
** In accordance with IMAS guidelines, expense ratio is stated on an annualised basis.
Related Party Transactions
For the financial year ended 31 December 2018
The Trustee is HSBC Institutional Trust Services (Singapore) Limited, a subsidiary of the HSBC Group.S$
Bank service fees paid to HSBC 124,545Interest received from Bank of HSBC (45,048)Bank balances outstanding with HSBC as at 31 December 2018
S$ equivalent
Singapore Dollar 1,786,682United States Dollar 170,681
Foreign exchange transacted with HSBC for the financial year ended 31 December 2018
Currency Amount Currency Amount
Singapore Dollar 46,406,361 Singapore Dollar 378,803,098United States Dollar 280,550,095 United States Dollar 34,530,303
Others
Soft dollar commissions
In the normal course of business of the Sub-Fund, trustee’s fees and registration fees have been paid or are payableto the Trustee, while management fees have been paid or are payable to the Manager, as noted in the Statement ofTotal Return (Page 65 – 71). Transactions with related parties were at terms agreed between the parties and withinthe provisions of the Trust Deed.
The expense ratio does not include brokerage and other transaction costs, performance fee, foreign exchange gainsor losses, front or back end loads arising from the purchase or sale of other funds, tax deducted at source or arisingout of income received and dividends and other distributions paid to unitholders.
Purchases Sales
As at 31 December 2018, the Sub-Fund did not hold any bonds, derivatives or other unit trusts, other than the FirstState Asian Equity Plus Fund Class I shares (Dist), constituting 100.55% of the Sub-Fund’s Net Asset Value and at amarket value of S$2,488,484,007. In addition, the Sub-Fund did not hold any investment constituting more than 5%of a company’s outstanding share capital and/or debt issue. There were also no borrowings, outstanding currencyforward contracts or material information that would adversely impact the valuation of the Sub-Fund.
In order to align with the policy of First State Investments internationally, the Investment Manager has ceased all of its soft dollar arrangements previously made with brokers with effect from 13 June 2005.Commission Sharing Arrangement
There were no commission sharing arrangement in place during the year or at the year end 31 December 2018 or atthe year end 31 December 2017.
25

Annual Report for the financial year ended 31 December 2018
First State Global Balanced Fund
MANAGER'S REPORT
for the period from 1 January to 31 December 2018
Historical performance*
in Singapore dollarsSub-Fund Benchmark
% %
3-mths -3.4 -7.26-mths -3.1 -5.41-year -1.7 -3.73-years 3.5 4.25-years 3.9 5.110-years 4.6 6.4Since Inception – 4 January 1999 2.2 3.8(Calculated since date of first valuation)
Note:
Accordingly, the benchmark performance set out above uses the performance of the following:•
•
•
•
* Source: Lipper, First State Investments. No initial charges with income reinvested in Singapore dollars.
From 1 January 2002 to 23 February 2014: Composite comprising 60% MSCI World Index and 40%Citigroup World Government Bond Index (Unhedged)
From 24 February 2014: Composite comprising 60% MSCI AC World Index and 40% Citigroup WorldGovernment Bond Index (Unhedged)
The Sub-Fund invests all or substantially all of its assets in the Stewart Investors Worldwide Leaders FundClass I, a Dublin-domiciled fund (in relation to the equity portion) and the First State Global Bond Fund, aDublin-domiciled fund (in relation to the fixed income portion). Between 18 October 2002 to 23 February 2014,the Underlying Funds were the First State Global Opportunities Fund (in relation to the equity portion) and theFirst State Global Bond Fund (in relation to the fixed income portion). Due to a transition in management forthe Underlying Fund, First State Global Opportunities Fund has been renamed to Stewart InvestorsWorldwide Leaders Fund with effect from 24 February 2014.
The performance prior to 18 October 2002 is in relation to the Sub-Fund before its conversion to a feederfund. Performance for 1 year and above has been annualised.
The benchmark of the Sub-Fund is a composite comprising 60% MSCI AC World Index and 40% FTSE WorldGovernment Bond Index (Unhedged). It was renamed from 60% MSCI AC World Index and 40% CitigroupWorld Government Bond Index (Unhedged) with effect from 31 July 2018.
The First State Global Balanced Fund was previously known as the “Fortune Fund” with original inception dateof 13 March 1995. With the liberalisation of the CPF investment guidelines in 1998, and our communication toall unitholders, the “Fortune Fund” changed its investment objective and strategy from an Asia-focusedstrategy to a global balanced strategy with effect from 4 January 1999.
Inception to 31 December 2001: 50% MSCI World Index and 50% Citigroup World Government BondIndex (Unhedged)
From 31 July 2018: Composite comprising 60% MSCI AC World Index and 40% FTSE World GovernmentBond Index (Unhedged)
26

Annual Report for the financial year ended 31 December 2018
First State Global Balanced Fund
MANAGER'S REPORT
Outlook
Global equity markets declined in 2018 with the MSCI AC World Index falling by 8.9% in US dollar terms. At a sectorlevel, Health Care and Utilities outperformed, while Communication Services and Materials were particularly weak.
In bond markets, early 2018 saw widespread optimism in financial markets with global government bond yields risingsharply in most major markets. In the US, for example, 10-years Treasury yields rose to their highest levels for morethan four years. Risk appetite was supported by the passing of tax reforms in the US in late 2017 and economic datathat suggested inflationary forces were gaining momentum.
In the US, 10-years Treasury yields rose above 3.10% in mid-May, driven by increased expectations of higherinterest rates and rising oil prices. With yields breaking out of long-term trading ranges, investors suggested wecould finally be about to see a significant and sustainable increase in yields globally.
US 10-years Treasury yields moved 20 basis points higher over the third quarter, but were reasonably volatile indoing so as interest rate expectations shifted. The last quarter of the year saw a sharp deterioration in risk appetite inglobal markets. This supported demand for government bonds as investors favoured defensive exposures. Therewas an unrelenting focus on the economic outlook in the US and, more specifically, how much more US interestrates might be increased in 2019.
In equity markets, valuations for high-quality companies remain full. We prefer to back strong management teamswho are focusing on sustainable development rather than descend the quality spectrum for notionally lowervaluations.
In bond markets, there appears to be an increasing acceptance that global growth could tail off in 2019. Activitylevels in the US are likely to moderate from an exceptionally strong 2018 and we have started to see signs of aslowdown in Asia. In Europe, Brexit issues continue to hamper business confidence and capital expenditure. Theseissues suggest global growth projections might have to be revised lower over the next few months which shouldsupport returns from government bond markets.
27

Annual Report for the financial year ended 31 December 2018
First State Global Balanced Fund
DISTRIBUTION OF INVESTMENTS
As at 31 December 2018
Holdings Market Value % of NAV
S$
FIRST STATE GLOBAL BALANCED FUND
Ireland
Stewart Investors Worldwide Leaders Fund 631,572 10,080,345 58.28
First State Global Bond Fund 333,466 7,126,791 41.21Total investments 17,207,136 99.49Other net assets 87,422 0.51Total net assets attributable to unitholders 17,294,558 100.00
DISTRIBUTION OF INVESTMENTS (UNDERLYING FUND)
Market Value % of NAV
S$
Top 10 holdings (as at 31 December 2018)
Equities
Henkel AG & Co KGaA 5,395,791 8.5Beiersdorf AG 4,582,291 7.2Unilever Plc 4,569,580 7.2Unicharm Corp 3,533,639 5.6Tata Consultancy Services Ltd 3,222,221 5.1Merck KGaA 2,732,850 4.3Colgate-Palmolive Co 2,256,190 3.6Cerner Corporation 2,230,769 3.5Nestle S.A. 2,141,792 3.4Housing Development Finance Corp Ltd 2,001,972 3.2
Fixed Income
Santander Consumer Finance 0.68% 27/09/2022 1,241,865 5.6Spain (Kingdom of) 3.80% 30/04/2024 1,188,163 5.3US Treasury Bill 1.625% 15/08/2022 921,889 4.1UK GILT 4.50% 07/03/2019 879,375 3.9US Treasury Bill 3.125% 15/02/2043 789,871 3.5Italy (Republic of) 2.80% 01/12/2028 702,605 3.1Italy Buoni Poliennali Del Tesoro 4.50% 01/03/2019 684,704 3.1US Treasury Bill 2.625% 30/06/2023 481,083 2.2Italy Buoni Poliennali Del Tesoro 5.500% 01/11/2022 469,895 2.1Japan (Govt) 20YR # 123 2.100% 20/12/2030 447,519 2.0
28
Annual Report for the financial year ended 31 December 2018
First State Global Balanced Fund
DISTRIBUTION OF INVESTMENTS (UNDERLYING FUND)
Market Value % of NAV
S$
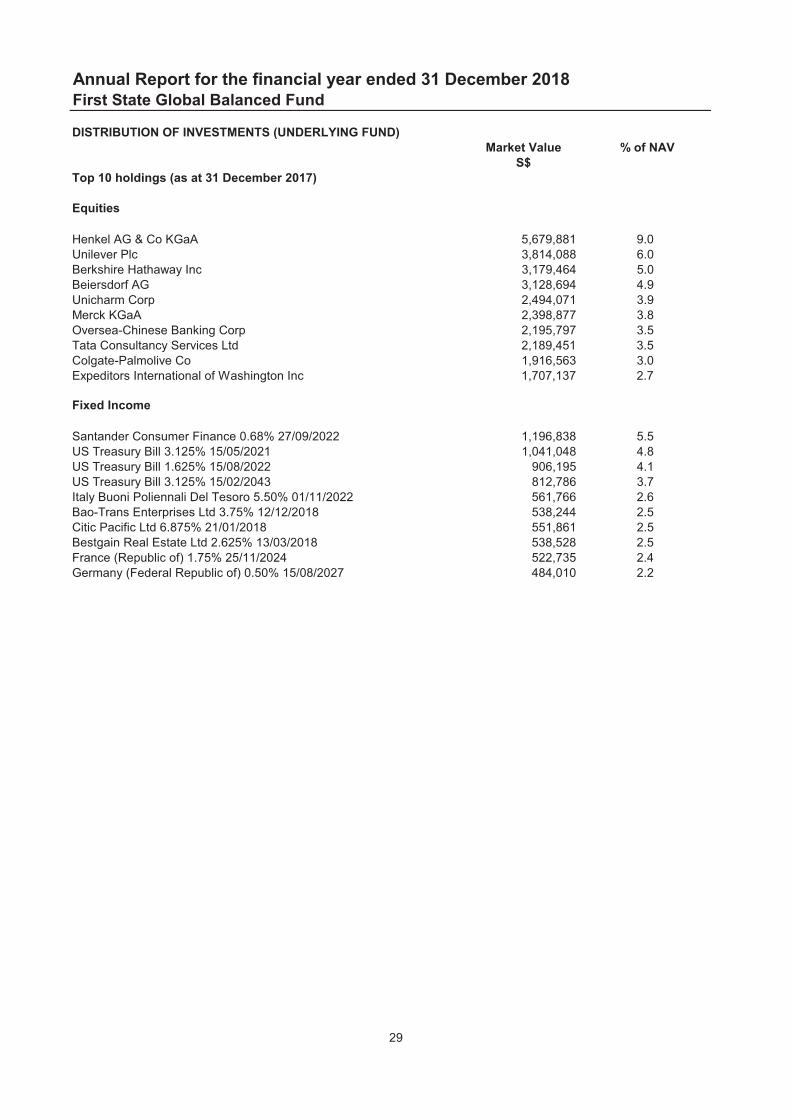
Top 10 holdings (as at 31 December 2017)
Equities
Henkel AG & Co KGaA 5,679,881 9.0Unilever Plc 3,814,088 6.0Berkshire Hathaway Inc 3,179,464 5.0Beiersdorf AG 3,128,694 4.9Unicharm Corp 2,494,071 3.9Merck KGaA 2,398,877 3.8Oversea-Chinese Banking Corp 2,195,797 3.5Tata Consultancy Services Ltd 2,189,451 3.5Colgate-Palmolive Co 1,916,563 3.0Expeditors International of Washington Inc 1,707,137 2.7
Fixed Income
Santander Consumer Finance 0.68% 27/09/2022 1,196,838 5.5US Treasury Bill 3.125% 15/05/2021 1,041,048 4.8US Treasury Bill 1.625% 15/08/2022 906,195 4.1US Treasury Bill 3.125% 15/02/2043 812,786 3.7Italy Buoni Poliennali Del Tesoro 5.50% 01/11/2022 561,766 2.6Bao-Trans Enterprises Ltd 3.75% 12/12/2018 538,244 2.5Citic Pacific Ltd 6.875% 21/01/2018 551,861 2.5Bestgain Real Estate Ltd 2.625% 13/03/2018 538,528 2.5France (Republic of) 1.75% 25/11/2024 522,735 2.4Germany (Federal Republic of) 0.50% 15/08/2027 484,010 2.2
29

Annual Report for the financial year ended 31 December 2018
First State Global Balanced Fund
DISCLOSURES
Subscriptions S$4,049,829Redemptions S$4,752,381
31 December 2018 31 December 2017
Expense Ratio** 1.75% 1.71%(including that of the Underlying Fund)Portfolio Turnover 17.26% 5.30%Disclosures on the Underlying Fund -
Portfolio Turnover
Stewart Investors Worldwide Leaders Fund 26.6% 17.9%First State Global Bond Fund 130.0% 69.5%Expense Ratio**
Stewart Investors Worldwide Leaders Fund 1.68% 1.71%First State Global Bond Fund 1.23% 1.19%
** In accordance with IMAS guidelines, expense ratio is stated on an annualised basis.
Related Party Transactions
For the financial year ended 31 December 2018
The Trustee is HSBC Institutional Trust Services (Singapore) Limited, a subsidiary of the HSBC Group.S$
Bank service fees paid to HSBC 7,204Bank balances outstanding with HSBC as at 31 December 2018
S$ equivalent
Singapore Dollar 203,706United States Dollar 1,363Foreign exchange transacted with HSBC for the financial year ended 31 December 2018
Currency Amount Currency Amount
Singapore Dollar 3,642,947 Singapore Dollar 2,412,214United States Dollar 1,764,331 United States Dollar 2,690,441Others
Soft dollar commissions
In the normal course of business of the Sub-Fund, trustee’s fees and registration fees have been paid or are payableto the Trustee, while management fees have been paid or are payable to the Manager, as noted in the Statement ofTotal Return (Page 65 – 71). Transactions with related parties were at terms agreed between the parties and withinthe provisions of the Trust Deed.
Commission Sharing Arrangement
In order to align with the policy of First State Investments internationally, the Investment Manager has ceased all of its soft dollar arrangements previously made with brokers with effect from 13 June 2005.
The expense ratio does not include brokerage and other transaction costs, performance fee, foreign exchange gainsor losses, front or back end loads arising from the purchase or sale of other funds, tax deducted at source or arisingout of income received and dividends and other distributions paid to unitholders.
Purchases Sales
As at 31 December 2018, the Sub-Fund did not hold any bonds, derivatives or other unit trusts, other than the FirstState Global Bond Fund Class I shares (constituting 41.21% of the Sub-Fund’s Net Asset Value and at a marketvalue of S$7,126,791) and Stewart Investors Worldwide Leaders Fund Class I (constituting 58.28% of the Sub-Fund’s Net Asset Value and at a market value of S$10,080,345). In addition, the Sub-Fund did not hold anyinvestment constituting more than 5% of a company’s outstanding share capital and/or debt issue. There were alsono borrowings, outstanding currency forward contracts or material information that would adversely impact thevaluation of the Sub-Fund.
There were no commission sharing arrangement in place during the year or at the year end 31 December 2018 or at the year end 31 December 2017.
30

Annual Report for the financial year ended 31 December 2018
First State Global Infrastructure
MANAGER'S REPORT
for the period from 1 January to 31 December 2018
Historical performance*
in Singapore dollarsSub-Fund Benchmark
% %
3-mths -2.6 -2.66-mths -4.9 -1.71-year -6.6 -1.33-years 4.8 7.45-years 6.1 8.310-years 7.8 8.1Since Inception – 3 March 2008 3.4 4.0(Calculated since date of first valuation)
Note:
Accordingly, the benchmark performance set out above uses the performance of the following:• • •
* Source: Lipper, First State Investments. No initial charges with income reinvested in Singapore dollars.
From 1 June 2008 to 31 March 2015: UBS Global Infrastructure and Utilities 50-50 Index
The Sub-Fund invests all or substantially all of its assets in Class A shares of the First State Global ListedInfrastructure Fund (a sub-fund of the England and Wales domiciled umbrella fund known as First StateInvestments ICVC).
Performance for 1 year and above has been annualised.
The benchmark of the Sub-Fund is the FTSE Global Core Infrastructure 50-50 Index. It was changed fromUBS Global Infrastructure and Utilities 50-50 Index with effect from 1 April 2015 as the new benchmark ismore representative of the Sub-Fund.
From 1 April 2015: FTSE Global Core Infrastructure 50-50 Index
Inception to 31 May 2008: S&P Global Infrastructure Index
31

Annual Report for the financial year ended 31 December 2018
First State Global Infrastructure
MANAGER'S REPORT
Performance
Transactions
Outlook
Global listed infrastructure, along with other defensive assets, was hit by macroeconomic headwinds at the start of2018. A sharp rise in US Treasury yields, together with synchronised global growth, resulted in a clear sector rotationaway from defensive areas of the market into cyclicals.
However global listed infrastructure made up ground relative to global equities in the second half of the year, asconcerns about slowing global growth rates highlighted the appeal of infrastructure’s stable, long-life assets andpredictable cashflows.
The largest positive contributor to Fund performance was NextEra Energy (US: Electric Utilities), whichoutperformed on investor enthusiasm for its robust balance sheet and renewables-driven earnings growth. Evergy
(US: Electric Utilities) gained on demand for defensive assets. The company is carrying out a substantial share buy-back (equivalent to 22% of shares on issue). American Tower (US: Towers) was supported by structural growth indemand for mobile data, reflecting growing numbers of smartphone subscriptions and the ever-increasing popularityof video streaming on these devices.
On the negative side, the tragic collapse of a bridge in Genoa led the Italian government to call for the revocation ofthe motorway concession controlled by Atlantia (Italy: Toll Roads). PG&E (US: Electric Utilities) fell on concernsabout potential liabilities for costs associated with California’s devastating wildfires. CCR (Brazil: Toll Roads)underperformed as economic and political turmoil and an investigation into corruption weighed on the stock.
A position was initiated in SBA Communications (US: Towers) after underperformance suggested that concernsabout the company’s exposure to Latin America had been discounted in valuations, providing an attractive entrypoint. TransCanada (Canada: Pipelines) was added after unfavourable sentiment towards the sector moved thestock higher in the Value/Quality rankings of our investment process. The portfolio also established a position inWilliams (US: Pipelines), whose pipeline networks connect rising natural gas production with growing demand fromeastern US population centres.
Enbridge Inc (Canada: Pipelines) was divested after the sale of non-core assets caused its share price to rise.Enterprise Products Partners (US: Pipelines) was sold after significant outperformance compared to its peersreduced mispricing. Power Assets Holdings (Hong Kong: Electric Utilities) was also sold following the payment ofits latest special dividend.
We anticipate slower global economic growth in 2019 as the robust US economy comes down from its tax cut-drivensugar high. This, combined with reduced monetary stimulus in Europe and Japan, implies a less positive economicgrowth environment in the year ahead.
Global listed infrastructure is well positioned to navigate a likely slower growth world in 2019, as its essential serviceshave the ability to price at or above inflation without destroying demand.
32

Annual Report for the financial year ended 31 December 2018
First State Global Infrastructure
DISTRIBUTION OF INVESTMENTS
As at 31 December 2018
Holdings Market Value % of NAV
S$
FIRST STATE GLOBAL INFRASTRUCTURE
Great Britain
First State Global Listed Infrastructure Fund 3,471,250 10,542,741 96.98Total investments 10,542,741 96.98Other net assets 328,398 3.02Total net assets attributable to unitholders 10,871,139 100.00
DISTRIBUTION OF INVESTMENTS (UNDERLYING FUND)
Market Value % of NAV
S$
Top 10 holdings (as at 31 December 2018)
Dominion Energy Inc 227,798,541 6.9Transurban Group 206,515,174 6.2NextEra Energy Inc 187,227,122 5.6Kinder Morgan Inc 163,615,887 4.9TransCanada Corporation 155,967,176 4.7American Electric Power Company Inc 138,341,888 4.2East Japan Railway Co 137,676,783 4.1Atlantia SpA 103,756,416 3.1Evergy Inc 97,437,916 2.9Williams Companies Inc 94,444,943 2.8
Top 10 holdings (as at 31 December 2017)
National Grid PLC 377,165,922 8.2Kinder Morgan Inc 281,260,651 6.1Transurban Group 273,422,239 5.9Dominion Energy Inc 224,086,355 4.9American Tower Corp 221,780,939 4.8NextEra Energy Inc 198,726,788 4.3Enbridge Inc 189,966,210 4.1East Japan Railway Co 189,505,127 4.1Atlantia SpA 176,594,802 3.8Southern Co 172,906,138 3.8
33

Annual Report for the financial year ended 31 December 2018
First State Global Infrastructure
DISCLOSURES
Subscriptions S$2,300,419
Redemptions S$5,408,866
31 December 2018 31 December 2017
Expense Ratio** 1.91% 1.93%(including that of the Underlying Fund)Portfolio Turnover 11.44% 989.78%
Disclosures on the Underlying Fund -
Portfolio Turnover 70.1% 76.2%
Expense Ratio** 1.53% 1.57%
** In accordance with IMAS guidelines, expense ratio is stated on an annualised basis.
Related Party Transactions
For the financial year ended 31 December 2018
The Trustee is HSBC Institutional Trust Services (Singapore) Limited, a subsidiary of the HSBC Group.S$
Bank service fees paid to HSBC 6,263Interest received from Bank of HSBC (1,653)
Bank balances outstanding with HSBC as at 31 December 2018
S$ equivalent
British Pound Sterling 33,705Singapore Dollar 277,798United States Dollar 1,363Foreign exchange transacted with HSBC for the financial year ended 31 December 2018
Currency Amount Currency Amount
British Pound Sterling 674,842 British Pound Sterling 2,531,550Singapore Dollar 3,865,316 Singapore Dollar 2,256,922United States Dollar 1,622,407 United States Dollar 323,922Others
Soft dollar commissions
In the normal course of business of the Sub-Fund, trustee’s fees and registration fees have been paid or are payableto the Trustee, while management fees have been paid or are payable to the Manager, as noted in the Statement ofTotal Return (Page 65 – 71). Transactions with related parties were at terms agreed between the parties and withinthe provisions of the Trust Deed.
The expense ratio does not include brokerage and other transaction costs, performance fee, foreign exchange gainsor losses, front or back end loads arising from the purchase or sale of other funds, tax deducted at source or arisingout of income received and dividends and other distributions paid to unitholders.
Purchases Sales
As at 31 December 2018, the Sub-Fund did not hold any bonds, derivatives or other unit trusts, other than the FirstState Global Listed Infrastructure Fund Class A shares, constituting 96.98% of the Sub-Fund’s Net Asset Value andat a market value of S$10,542,741. In addition, the Sub-Fund did not hold any investment constituting more than 5%of a company’s outstanding share capital and/or debt issue. There were also no borrowings, outstanding currencyforward contracts or material information that would adversely impact the valuation of the Sub-Fund.
In order to align with the policy of First State Investments internationally, the Investment Manager has ceased all of its soft dollar arrangements previously made with brokers with effect from 13 June 2005.
There were no commission sharing arrangement in place during the year or at the year end 31 December 2018 or at the year end 31 December 2017.
Commission Sharing Arrangement
34

Annual Report for the financial year ended 31 December 2018
First State Global Property Investments
MANAGER'S REPORT
for the period from 1 January to 31 December 2018
Historical performance*
in Singapore dollars
Class A - Distribution Sub-Fund Benchmark
% %
3-mths -10.5 -5.76-mths -11.3 -5.61-year -10.0 -2.83-years -3.0 2.35-years 3.7 7.110-years 7.6 10.2Since Inception – 11 April 2005 2.2 5.0(Calculated since date of first valuation)
Class A - Accumulation Sub-Fund Benchmark
% %
3-mths -10.5 -5.76-mths -11.3 -5.61-year -10.0 -2.83-years -3.0 2.35-years n/a n/a10-years n/a n/aSince Inception – 14 September 2015 -1.7 4.3(Calculated since date of first valuation)
Note:
First State Global Property Investment Class A (Accumulation) was incepted on 14 September 2015.
••••
* Source: Lipper, First State Investments. No initial charges with income reinvested in Singapore dollars.
The performance prior to 17 January 2014 is in relation to the First State Global Property Investment Class A(Distribution) before its conversion to a feeder fund. Performance for 1 year and above has been annualised.
The benchmark of the Sub-Fund is the FTSE EPRA/Nareit Developed Index. It was renamed from FTSEEPRA/NAREIT Developed Index with effect from 3 September 2018.
Accordingly, the benchmark performance set out above uses the performance of the following:Inception to 29 February 2008: Citigroup BMI World Property IndexFrom 1 March 2008 to 16 January 2014: UBS Global Real Estate Investors IndexFrom 17 January 2014: FTSE EPRA/NAREIT Developed Index
With effect from 17 January 2014, the Sub-Fund was converted to a feeder fund and invests all orsubstantially all of its asset in the First State Global Property Securities Fund (a Dublin-domiciled fund).
From 03 September 2018: FTSE EPRA Nareit Developed Index
35

Annual Report for the financial year ended 31 December 2018
First State Global Property Investments
MANAGER'S REPORT
Performance
Transactions
Outlook
The FTSE EPRA/NAREIT Developed Index Total Return (USD) fell 5.63% in 2018, outperforming the broader equitymarket.
Global REITs struggled in 2018 amid rising interest rates and due to increased uncertainty arising from tradetensions, political discourse and weaker global economic growth, although M&A activity remained strong acrossseveral markets.
The largest positive contributor to performance was the Sub-Fund’s average overweight position in Japanesedeveloper Mitsui Fudosan, which performed well during the year with the company generating continued rentalgrowth and posting positive quarterly results in August. The Sub-Fund’s overweight exposure to US apartment realestate investment trust Equity Residential also contributed to performance, with the stock trading well following itsQ3 results.
The largest detractors from the Sub-Fund’s performance were positions in Playa Hotels and Resorts and US datacentre company Equinix. Playa Hotels and Resorts underperformed after reducing its FY18 EBITDA guidance dueto an unanticipated increase in utilities in Mexico and given global economic concerns. Equinix underperformed afterthe company failed to dispel concerns on the impact of the Verizon portfolio integration on US revenue growth in its1Q earnings announcement. The stock was also impacted by the selloff in technology stocks late in the year.
The Sub-Fund established a position in US logistics real estate investment trust Prologis due to the positive outlookfor the industrial and logistics property sectors. A position was also initiated in the US apartment real estateinvestment trust Equity Residential, due to expectations of near-term improvements in market conditions and thatthe company’s earnings guidance would be raised.
The Sub-Fund reduced its holdings in Simon Property Group early in the year due to expectations of a challengingyear for the retail sector. The Sub-Fund also exited its position in UDR during the year after the stock started tradingin line with the Sub-Fund’s estimates.
The Sub-Fund has become more constructive on the outlook for US real estate investment trusts given slowingeconomic growth and increasing risks. The outlook for UK real estate investment trusts remains highly dependent onthe outcome of Brexit. On the Continent, the Sub-Fund prefers structural growth stories maintains selective exposureto offices and residential apartments.
The outlook for Australian real estate investment trusts with exposure to the residential development sector remainschallenged, while office operating metrics are broadly positive.
Within Asia, the overall strategy is to have a balanced portfolio with some quality defensive names, and some withstrong growth potential in the region.
36

Annual Report for the financial year ended 31 December 2018
First State Global Property Investments
DISTRIBUTION OF INVESTMENTS
As at 31 December 2018
Holdings Market Value % of NAV
S$
FIRST STATE GLOBAL PROPERTY INVESTMENTS
Ireland
First State Global Property Securities Fund 959,874 14,666,142 99.16Total investments 14,666,142 99.16Other net assets 124,901 0.84Total net assets attributable to unitholders 14,791,043 100.00
DISTRIBUTION OF INVESTMENTS (UNDERLYING FUND)
Market Value % of NAV
S$
Top 10 holdings (as at 31 December 2018)
Invitation Homes Inc 858,932 5.5Prologis Inc 841,627 5.3Sun Hung Kai Properties Ltd 807,018 5.1Simon Property Group Inc 728,362 4.6Equity Residential 668,582 4.2AvalonBay Communities Inc 633,973 4.0Kilroy Realty Corporation 608,803 3.9Grainger plc 583,633 3.7Inmobiliaria Colonial S.A 536,439 3.4Vicinity Centres 508,123 3.2
Top 10 holdings (as at 31 December 2017)
Simon Property Group Inc 1,920,906 7.2Equinix Inc 1,722,653 6.4Mitsui Fudosan Co Ltd 1,360,976 5.1Invitation Homes Inc 1,339,544 5.0Sun Hung Kai Properties Ltd 1,154,687 4.3UNITE Group PLC 1,074,314 4.0Host Hotels & Resorts Inc 1,068,956 4.0Hudson Pacific Properties Inc 1,028,770 3.8UDR Inc 1,018,053 3.8Vornado Realty Trust 967,150 3.6
37

Annual Report for the financial year ended 31 December 2018
First State Global Property Investments
DISCLOSURES
Subscriptions S$4,149,924
Redemptions S$14,187,886
31 December 2018 31 December 2017
Expense Ratio** 1.97% 1.97%(including that of the Underlying Fund)Portfolio Turnover 134.75% 217.34%Disclosures on the Underlying Fund -
Portfolio Turnover 75.0% 67.8%
Expense Ratio** 1.72% 1.68%
** In accordance with IMAS guidelines, expense ratio is stated on an annualised basis.
Related Party Transactions
For the financial year ended 31 December 2018
The Trustee is HSBC Institutional Trust Services (Singapore) Limited, a subsidiary of the HSBC Group.S$
Bank service fees paid to HSBC 7,570
Bank balances outstanding with HSBC as at 31 December 2018
S$ equivalent % NAV
Singapore Dollar (143,466)^ 0.97United States Dollar 1,363 0.01
Foreign exchange transacted with HSBC for the financial year ended 31 December 2018
Currency Amount Currency Amount
Singapore Dollar 10,828,902 Singapore Dollar 779,122United States Dollar 586,810 United States Dollar 8,115,850
Others
Soft dollar commissions
^The sub-fund has credit facility with a related party of the Trustee.
As at 31 December 2018, the Sub-Fund did not hold any bonds, derivatives or other unit trusts, other than the FirstState Global Property Securities Fund - Class I, constituting 99.16% of the Sub-Fund’s Net Asset Value and at amarket value of S$14,666,142. In addition, the Sub-Fund did not hold any investment constituting more than 5% of acompany’s outstanding share capital and/or debt issue. There were also no borrowings, outstanding currencyforward contracts or material information that would adversely impact the valuation of the Sub-Fund.
In order to align with the policy of First State Investments internationally, the Investment Manager has ceased all ofits soft dollar arrangements previously made with brokers with effect from 13 June 2005.
There were no commission sharing arrangement in place during the year or at the year end 31 December 2018 or at the year end 31 December 2017.
Commission Sharing Arrangement
The expense ratio does not include brokerage and other transaction costs, performance fee, foreign exchange gainsor losses, front or back end loads arising from the purchase or sale of other funds, tax deducted at source or arisingout of income received and dividends and other distributions paid to unitholders.
Purchases Sales
In the normal course of business of the Sub-Fund, trustee’s fees and registration fees have been paid or are payableto the Trustee, while management fees have been paid or are payable to the Manager, as noted in the Statement ofTotal Return (Page 65 – 71). Transactions with related parties were at terms agreed between the parties and withinthe provisions of the Trust Deed.
38

Annual Report for the financial year ended 31 December 2018
First State Regional China Fund
MANAGER'S REPORT
for the period from 1 January to 31 December 2018
Historical performance*
in Singapore dollarsSub-Fund Benchmark
% %
3-mths -11.4 -10.56-mths -15.5 -13.11-year -12.4 -12.93-years 7.9 7.85-years 7.2 7.110-years 11.6 9.7Since Inception – 1 November 1993 8.2 4.2(Calculated since date of first valuation)
Note:
* Source: Lipper, First State Investments. No initial charges with income reinvested in Singapore dollars.
The Sub-Fund invests all or substantially all of its assets in the First State Greater China Growth Fund (aDublin-domiciled fund) with effect from 18 October 2002.
The performance prior to 18 October 2002 is in relation to the Sub-Fund before its conversion to a feederfund. Performance for 1 year and above has been annualised.
The benchmark of the Sub-Fund is the MSCI Golden Dragon Index. It was changed from CLSA China WorldIndex and CLSA China B Index with effect from 2 January 2001 as the previous benchmark was not reflectiveof the Sub-Fund’s investment scope. It did not have any weighting in Taiwan.
39

Annual Report for the financial year ended 31 December 2018
First State Regional China Fund
MANAGER'S REPORT
Performance
Transactions
Outlook
The Greater China equity markets declined over the 12 months to 31 December 2018. The MSCI Golden DragonIndex fell by 14.8% in US dollar terms over the period, with China the worst-performing market, down 18.8% over theyear. The MSCI Hong Kong declined by 7.8%, while Taiwan decreased by 8.2%.
Significant new purchases over the periods included Silergy Corp, the largest analogue integrated circuit designer inAsia. Although Silergy is relatively small, its superior products and competitive pricing should help it gain marketshare. The Sub-Fund also purchased Mediatek, which had showed signs of a turnaround. Although a recovery isunlikely to follow a straight line, the smartphone business and other new growth areas seem to be progressing well.
The Sub-Fund divested Hangzhou Robam Appliances due to margin concerns on its single-product strategy. Sino
Biopharm was sold on portfolio consolidation; the proceeds were used to switch into CSPC Pharmaceutical, ahigher conviction stock.
The Chinese equity market corrected sharply in 2018. We took advantage of market weakness to add to our highquality portfolio holdings; and have started to reassess the companies on our watch-list which look more attractive onvaluation metrics.
However, we remain cautious in our outlook for the coming year and expect market volatility to continue over theshort term. Although the progress towards an entente cordiale with the US is encouraging, there remains a wide gulfbetween the two countries on a broad range of issues, which will take time to resolve.
In response to trade war uncertainties and slowing growth, we expect the Chinese government to continue itstargeted approach to bolster the economy, with policies designed to ease conditions for businesses and households,while maintaining its line of attack on debt reduction. In addition, ongoing structural reforms should continue toenhance market-based efficiencies and improve corporate profitability in the state-owned sector.
On a longer-term basis, we believe that China’s growth story remains intact. Chinese companies have been focusingmore on research and development, and product innovation, in order to compete with global peers. Meanwhile, thestructural trends of consumption upgrading and healthcare spending should persist as incomes continue to rise.
The Sub-Fund declined by 14.1% over the 12 months to 31st December 2018. Detracting from performance, AAC
Technologies softened on concerns around weaker shipment expectations for the Apple iPhone in the second halfof 2018, while Minth Group weakened on softer than expected results and fears of US protectionism impacting itsNorth American business. Tencent declined following a broad technology sell-off and on concerns around regulatorytightening.
On the positive side, ENN Energy outperformed on strong growth expectations. China’s environmental policies and“coal-to-gas” projects for local governments should continue to fuel higher levels of gas consumption. Shenzhou
International was boosted by a positive read-across from Nike’s earnings results, as China sales accelerated acrossboth apparel and footwear segments. Nike is one of Shenzhou’s largest customers, contributing around 30% ofsales. Dairy Farm was boosted by the leadership of its new CEO, Ian McLeod, with significant personnel and culturalshifts within the company. The company has started its rationalisation process in Southeast Asia, closing stores andcutting costs to improve business operations.
40

Annual Report for the financial year ended 31 December 2018
First State Regional China Fund
DISTRIBUTION OF INVESTMENTS
As at 31 December 2018
Holdings Market Value % of NAV
S$
FIRST STATE REGIONAL CHINA FUND
Ireland
First State Greater China Growth Fund 3,414,930 434,734,947 99.53Total investments 434,734,947 99.53Other net assets 2,059,580 0.47Total net assets attributable to unitholders 436,794,527 100.00
DISTRIBUTION OF INVESTMENTS (UNDERLYING FUND)
Market Value % of NAV
S$
Top 10 holdings (as at 31 December 2018)
Taiwan Semiconductor Mfg Co Ltd 53,341,912 7.1Tencent Holdings 45,710,845 6.0AIA Group Ltd 34,982,019 4.6ENN Energy Holdings Ltd 32,110,924 4.3China Merchants Bank Co Ltd 32,035,369 4.2China Mengniu Dairy Company Limited 29,617,605 3.9Advantech Co Ltd 24,404,302 3.2Jardine Matheson Holdings Ltd 24,026,527 3.2ASM Pacific Technology Ltd 23,573,196 3.1Dairy Farm International Holdings Ltd 23,346,531 3.1
Top 10 holdings (as at 31 December 2017)
Taiwan Semiconductor Mfg Co Ltd 59,631,168 6.9Tencent Holdings 56,861,651 6.6AIA Group Ltd 34,445,871 4.0China Merchants Bank Co Ltd 33,320,754 3.9China Taiping Insurance Holdings Co Ltd 33,234,207 3.8AAC Technologies Holdings Inc 32,628,375 3.8CSPC Pharmaceutical Group Ltd 32,109,091 3.7Minth Group Ltd 29,426,121 3.4Gree Electric Appliances Inc 27,781,720 3.2ENN Energy Holdings Ltd 27,435,530 3.2
41

Annual Report for the financial year ended 31 December 2018
First State Regional China Fund
DISCLOSURES
Subscriptions S$128,212,999
Redemptions S$120,806,790
31 December 2018 31 December 2017
Expense Ratio** 1.71% 1.71%(including that of the Underlying Fund)Portfolio Turnover 10.07% 6.36%
Disclosures on the Underlying Fund -
Portfolio Turnover 19.4% 14.2%
Expense Ratio** 1.59% 1.59%
** In accordance with IMAS guidelines, expense ratio is stated on an annualised basis.
Related Party Transactions
For the financial year ended 31 December 2018
The Trustee is HSBC Institutional Trust Services (Singapore) Limited, a subsidiary of the HSBC Group.S$
Bank service fees paid to HSBC 51,688
Bank balances outstanding with HSBC as at 31 December 2018
S$ equivalent
Singapore Dollar 268,763United States Dollar 107,004
Foreign exchange transacted with HSBC for the financial year ended 31 December 2018
Currency Amount Currency Amount
Singapore Dollar 19,882,745 Singapore Dollar 25,605,111United States Dollar 18,955,207 United States Dollar 14,896,757Others
Soft dollar commissions
Sales
As at 31 December 2018, the Sub-Fund did not hold any bonds, derivatives or other unit trusts, other than the FirstState Greater China Growth Fund Class I shares, constituting 99.53% of the Sub-Fund’s Net Asset Value and at amarket value of S$434,734,947. In addition, the Sub-Fund did not hold any investment constituting more than 5% ofa company’s outstanding share capital and/or debt issue. There were also no borrowings, outstanding currencyforward contracts or material information that would adversely impact the valuation of the Sub-Fund.
In order to align with the policy of First State Investments internationally, the Investment Manager has ceased all of its soft dollar arrangements previously made with brokers with effect from 13 June 2005.
There were no commission sharing arrangement in place during the year or at the year end 31 December 2018 or at the year end 31 December 2017.
Commission Sharing Arrangement
In the normal course of business of the Sub-Fund, trustee’s fees and registration fees have been paid or are payableto the Trustee, while management fees have been paid or are payable to the Manager, as noted in the Statement ofTotal Return (Page 65 – 71). Transactions with related parties were at terms agreed between the parties and withinthe provisions of the Trust Deed.
The expense ratio does not include brokerage and other transaction costs, performance fee, foreign exchange gainsor losses, front or back end loads arising from the purchase or sale of other funds, tax deducted at source or arisingout of income received and dividends and other distributions paid to unitholders.
Purchases
42

Annual Report for the financial year ended 31 December 2018
First State Regional India Fund
MANAGER'S REPORT
for the period from 1 January to 31 December 2018
Historical performance*
in Singapore dollarsSub-Fund Benchmark
% %
3-mths 5.4 2.36-mths -4.3 0.21-year -6.1 -5.53-years 7.7 6.85-years 16.4 9.710-years 17.8 10.0Since Inception – 22 August 1994 9.2 6.6(Calculated since date of first valuation)
Note:
* Source: Lipper, First State Investments. No initial charges with income reinvested in Singapore dollars.
The Sub-Fund invests all or substantially all of its assets in the First State Indian Subcontinent Fund (a Dublin-domiciled fund) with effect from 18 October 2002.
The performance prior to 18 October 2002 is in relation to the Sub-Fund before its conversion to a feederfund. Performance for 1 year and above has been annualised.
The benchmark of the Sub-Fund is the MSCI India Index.
Due to the increase in the investment management fee of the Underlying Sub-Fund, the annual management fee for units of the Regional India Fund will also increase from 1.50% to 1.75% effective from 1 July 2016.
With effect from 1 April 2016, the Sub-Fund is open for subscriptions again.
43

Annual Report for the financial year ended 31 December 2018
First State Regional India Fund
MANAGER'S REPORT
Performance
Transactions
The MSCI India declined by 7.3% in 2018 amid rising oil prices, inflationary pressures and a widening deficit, as wellas a broader regional sell-off on concerns over a US-China trade war and fears of a global slowdown. Brent crudesoared to four-year highs, which, in combination with a decreasing rupee, has translated into a significant increase indomestic headline fuel prices. On the other hand, the weakening rupee has been positive for exporters such as ITservices companies. Financials were shaken by the collapse and subsequent bailout of Infrastructure Leasing &Financial Services (IL&FS), one of the largest infrastructure lenders in India, as fears of worsening credit and liquidityissues at other non-banking financial companies (NBFCs) dampened sentiment towards the end of the year.Meanwhile, core CPI inflation rose to significantly in May, causing the Reserve Bank of India to raise interest rates by25bps in June – the first hike in more than four years.
On portfolio holdings, Bharti Airtel continued to face intense competitive pressure, as Reliance Jio released furtheraggressive tariff cuts, causing industry pricing to crash. Revenues are expected to fall significantly at all theincumbent telecom operators, with this market having shrunk to three main players. Blue Star reported weaker thanexpected results, mainly due to slower activity in its Electro Mechanical projects business. GST also had an impact,as customers renegotiated their projects contracts. An early onset of the monsoon season, as well as flooding inKerala, resulted in a disappointing summer for sales of air conditioning units.
Nestle India’s operating performance has been positive, with its strategy of focusing on volume growth starting topay dividends. The business has reported strong domestic sales growth after new product expansions and launches.Tech Mahindra reported expanded margins, with additional tailwinds from FX weakness. Digital revenue has grownin excess of 20% and there are anecdotal signs of a recovery in the finance sector (its biggest customer segment).
Significant purchases over the year included Bosch (India), the market leader in fuel injection systems in India.Bosch has a dominant franchise, with more than 50% market share in most segments that it operates in. Thereshould be significant growth potential from increased regulation on emission standards. The Sub-Fund also boughtback Infosys, after management changes at the company. The new CEO, Salil S. Parekh, is the second outsider atthe company and has the support of the ex-founders. The strength of the franchise seemed secure as, despite thenoise around the political, the business had continued to perform well throughout.
The Sub-Fund divested Lupin on concerns around the challenging environment in the US generics market and soldHindustan Unilever on concerns around expensive valuations and high margins.
44

Annual Report for the financial year ended 31 December 2018
First State Regional India Fund
Outlook
The challenging global backdrop of rising interest rates, slowing demand growth and trade war uncertainty continuesto weigh on investor sentiment. In India, much has been made of the upcoming General Elections, with swingingopinion polls having the potential to disrupt financial markets. Volatility, particularly over the short term, is likely topersist.
We do not pay too much attention to the gyrations of market forecasters, however, preferring to spend our timeresearching companies and talking to management. We remain resolutely-focused on quality (of management,franchise and financials), which has helped our portfolios remain relatively defensive amidst the market volatility.While we understand that such periods are worrying for clients, they provide us with opportunities to top up ourholdings and buy into quality companies at cheaper prices – thus contributing to better long-term absolute returns.
From a bottom-up perspective, our meetings with management suggest that earnings growth within our universe ofquality companies should be relatively robust, particularly those that are supported by long-term secular growththemes; and valuations remain stubbornly expensive. The portfolio currently has a relatively high cash weighting, sothat we have some ‘dry powder’ ready to invest when the market falls.
45

Annual Report for the financial year ended 31 December 2018
First State Regional India Fund
DISTRIBUTION OF INVESTMENTS
As at 31 December 2018
Holdings Market Value % of NAV
S$
FIRST STATE REGIONAL INDIA FUND
Ireland
First State Indian Subcontinent Fund 765,172 105,784,335 99.12Total investments 105,784,335 99.12Other net assets 940,428 0.88Total net assets attributable to unitholders 106,724,763 100.00
DISTRIBUTION OF INVESTMENTS (UNDERLYING FUND)
Market Value % of NAV
S$
Top 10 holdings (as at 31 December 2018)
HDFC Bank Limited 46,981,594 6.8Ambuja Cements Ltd 36,830,826 5.4Nestle India 33,264,340 4.8SKF India Ltd 30,452,303 4.4Godrej Consumer Products Limited 29,766,441 4.3Kotak Mahindra Bank 29,217,750 4.3Bharti Airtel Ltd 27,777,439 4.1Colgate-Palmolive (India) Limited 25,788,437 3.8Jyothy Laboratories Ltd 24,828,229 3.6Bosch Ltd 24,622,470 3.6
Top 10 holdings (as at 31 December 2017)
Nestle India 54,765,692 6.9HDFC Bank Limited 42,870,520 5.4Kotak Mahindra Bank 36,084,684 4.5Godrej Industries Limited 31,614,015 4.0SKF India Ltd 31,374,515 3.9Bharti Airtel Ltd 30,975,348 3.9Housing Development Finance Corp Ltd 30,177,014 3.8Tech Mahindra Ltd 29,698,014 3.7Blue Star Limited 24,508,845 3.1Ambuja Cements Ltd 21,634,843 2.7
46

Annual Report for the financial year ended 31 December 2018
First State Regional India Fund
DISCLOSURES
Subscriptions S$32,329,070
Redemptions S$28,752,58831 December 2018 31 December 2017
Expense Ratio** 2.06% 2.06%(including that of the Underlying Fund)Portfolio Turnover 16.30% 15.53%
Disclosures on the Underlying Fund -
Portfolio Turnover 41.2% 54.8%
Expense Ratio** 1.91% 1.89%
** In accordance with IMAS guidelines, expense ratio is stated on an annualised basis.
Related Party Transactions
For the financial year ended 31 December 2018
The Trustee is HSBC Institutional Trust Services (Singapore) Limited, a subsidiary of the HSBC Group.S$
Bank service fees paid to HSBC 20,905
Bank balances outstanding with HSBC as at 31 December 2018
S$ equivalent
Singapore Dollar 223,422United States Dollar 272,834
Foreign exchange transacted with HSBC for the financial year ended 31 December 2018
Currency Amount Currency Amount
Singapore Dollar 11,851,097 Singapore Dollar 12,299,172United States Dollar 9,138,452 United States Dollar 8,829,014
Others
Soft dollar commissions
In order to align with the policy of First State Investments internationally, the Investment Manager has ceased all ofits soft dollar arrangements previously made with brokers with effect from 13 June 2005.
There were no commission sharing arrangement in place during the year or at the year end 31 December 2018 or at the year end 31 December 2017.
Commission Sharing Arrangement
In the normal course of business of the Sub-Fund, trustee’s fees and registration fees have been paid or are payableto the Trustee, while management fees have been paid or are payable to the Manager, as noted in the Statement ofTotal Return (Page 65 – 71). Transactions with related parties were at terms agreed between the parties and withinthe provisions of the Trust Deed.
The expense ratio does not include brokerage and other transaction costs, performance fee, foreign exchange gainsor losses, front or back end loads arising from the purchase or sale of other funds, tax deducted at source or arisingout of income received and dividends and other distributions paid to unitholders.
Purchases Sales
As at 31 December 2018, the Sub-Fund did not hold any bonds, derivatives or other unit trusts, other than the FirstState Indian Subcontinent Fund Class I shares, constituting 99.12% of the Sub-Fund’s Net Asset Value and at amarket value of S$105,784,335. In addition, the Sub-Fund did not hold any investment constituting more than 5% ofa company’s outstanding share capital and/or debt issue. There were also no borrowings, outstanding currencyforward contracts or material information that would adversely impact the valuation of the Sub-Fund.
47

Annual Report for the financial year ended 31 December 2018
First State Singapore Growth Fund
MANAGER'S REPORT
for the period from 1 January to 31 December 2018
Historical performance*
in Singapore dollarsSub-Fund Benchmark
% %
3-mths -4.5 -6.66-mths -4.5 -3.71-year -0.3 -6.23-years 5.0 4.85-years 2.1 0.410-years 12.0 8.1Since Inception – 28 July 1969 8.2 n/a(Calculated since date of first valuation)
Note:
Accordingly, the benchmark performance set out above uses the performance of the following:••
* Source: Lipper, First State Investments. No initial charges with income reinvested in Singapore dollars.
From 1 December 2001: Market cap weighted of MSCI Singapore Index and MSCI Malaysia Index
The Sub-Fund invests all or substantially all of its assets in the First State Singapore and Malaysia GrowthFund (a Dublin-domiciled fund) with effect from 18 October 2002.
The performance prior to 18 October 2002 is in relation to the Sub-Fund before its conversion to a feederfund. Performance for 1 year and above has been annualised.
The benchmark of the Sub-Fund is the market capitalisation weighted of MSCI Singapore Index and MSCIMalaysia Index. It was changed from DBS 50 Index and KLCI with effect from 1 December 2001 due to thediscontinuation of the DBS 50 Index.
Inception to 30 November 2001: DBS 50 Index and KLCI
48

Annual Report for the financial year ended 31 December 2018
First State Singapore Growth Fund
MANAGER'S REPORT
Performance
Transactions
Outlook
The MSCI Singapore and Malaysia Index declined by 8.1% in 2018. Materials and Energy were the best performingsectors, while Information Technology and Consumer Discretionary lagged.
Significant purchases over the period included Kasikornbank, which had fallen to attractive valuations.Kasikornbank had been de-rated due to high credit costs, weak loan growth and pressure on fee income. However,the worst of it seems to be over and the bank should benefit from a recovery in exports and the trickle-down effect ofgovernment infrastructure projects. The Sub-Fund also bought Bank Central Asia (BCA), a high quality Indonesianbank that had outgrown the market on key metrics and has been a consistent compounder of growth. With bankingpenetration at just 40% of a population of 173 million, the long-term opportunity for BCA seems attractive.
The Sub-Fund divested Glow Energy due to its lack of growth and sold Kuala Lumpur Kepong (KLK) on concernsabout its low profitability metrics. KLK, which refines palm oil into oleo-chemicals for multinational corporations,lacked pricing power and was increasingly squeezed on margins due to chronic over-supply.
As Singapore’s economic growth is largely dependent on external factors, slowing global growth and weakeningdemand would imply a challenging environment for equities in the year ahead. As such, we maintain our cautiousapproach and remain resolutely-focused on quality (of management, franchise and financials), which has helped ourAsian portfolios remain relatively defensive amidst the market volatility. While we understand that such periods areworrying for clients, they provide us with opportunities to top up our holdings and buy into quality companies atcheaper prices – thus contributing to better long-term absolute returns.
The Sub-Fund declined by 2.1% over the 12 months to 31st December 2018. Detracting from performance, City
Developments declined after the Singapore government announced unexpected cooling measures and Great
Eastern Holdings was marked down by investor sentiment. Delfi, which derives the majority of revenue fromIndonesia, suffered from a weakening rupiah and rising interest rates, which put pressure on inflation and consumerspending.
On the positive side, Dairy Farm International was boosted by the leadership of its new CEO, Ian McLeod, withsignificant personnel and cultural shifts within the company. Nestle Malaysia continued to deliver steady businessperformance and earnings growth and Jardine Matheson strengthened on steady earnings results.
49

Annual Report for the financial year ended 31 December 2018
First State Singapore Growth Fund
DISTRIBUTION OF INVESTMENTS
As at 31 December 2018
Holdings Market Value % of NAV
S$
FIRST STATE SINGAPORE GROWTH FUND
Ireland
First State Singapore and Malaysia Growth Fund 536,552 41,582,870 99.34Total investments 41,582,870 99.34Other net assets 278,323 0.66Total net assets attributable to unitholders 41,861,193 100.00
DISTRIBUTION OF INVESTMENTS (UNDERLYING FUND)
Market Value % of NAV
S$
Top 10 holdings (as at 31 December 2018)
Haw Par Corp Ltd 4,821,465 7.8Great Eastern Holdings Ltd 4,014,808 6.5DBS Group Holdings Ltd 3,608,401 5.9United Overseas Bank Ltd 3,534,509 5.7Oversea-Chinese Banking Corp 3,534,509 5.7Dairy Farm International Holdings Ltd 3,214,310 5.2Jardine Matheson Holdings Ltd 2,826,376 4.6Jardine Cycle & Carriage Ltd 2,777,114 4.5Public Bank Bhd 2,112,085 3.4Heineken Malaysia Bhd. 2,081,296 3.4
Top 10 holdings (as at 31 December 2017)
Haw Par Corp Ltd 4,514,235 6.5Oversea-Chinese Banking Corp 4,486,412 6.5Great Eastern Holdings Ltd 4,451,634 6.4United Overseas Bank Ltd 3,693,465 5.3Singapore Telecommunications 3,345,681 4.8Dairy Farm International Holdings Ltd 3,116,144 4.5Nestle Malaysia Bhd 2,789,227 4.0Jardine Matheson Holdings Ltd 2,761,404 4.0Jardine Cycle & Carriage Ltd 2,344,063 3.4ComfortDelGro Corp Ltd 2,316,241 3.3
50
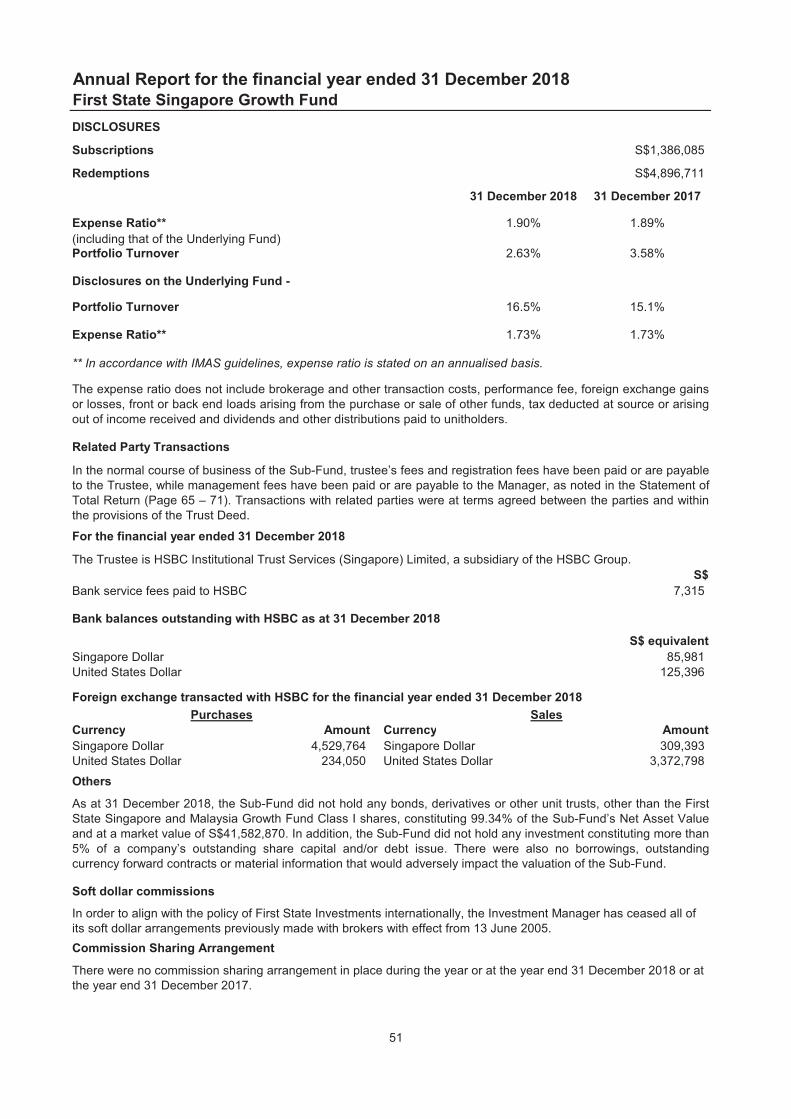
Annual Report for the financial year ended 31 December 2018
First State Singapore Growth Fund
DISCLOSURES
Subscriptions S$1,386,085
Redemptions S$4,896,711
31 December 2018 31 December 2017
Expense Ratio** 1.90% 1.89%(including that of the Underlying Fund)Portfolio Turnover 2.63% 3.58%
Disclosures on the Underlying Fund -
Portfolio Turnover 16.5% 15.1%
Expense Ratio** 1.73% 1.73%
** In accordance with IMAS guidelines, expense ratio is stated on an annualised basis.
Related Party Transactions
For the financial year ended 31 December 2018
The Trustee is HSBC Institutional Trust Services (Singapore) Limited, a subsidiary of the HSBC Group.S$
Bank service fees paid to HSBC 7,315
Bank balances outstanding with HSBC as at 31 December 2018
S$ equivalent
Singapore Dollar 85,981United States Dollar 125,396
Foreign exchange transacted with HSBC for the financial year ended 31 December 2018
Currency Amount Currency Amount
Singapore Dollar 4,529,764 Singapore Dollar 309,393United States Dollar 234,050 United States Dollar 3,372,798Others
Soft dollar commissions
Sales
In the normal course of business of the Sub-Fund, trustee’s fees and registration fees have been paid or are payableto the Trustee, while management fees have been paid or are payable to the Manager, as noted in the Statement ofTotal Return (Page 65 – 71). Transactions with related parties were at terms agreed between the parties and withinthe provisions of the Trust Deed.
The expense ratio does not include brokerage and other transaction costs, performance fee, foreign exchange gainsor losses, front or back end loads arising from the purchase or sale of other funds, tax deducted at source or arisingout of income received and dividends and other distributions paid to unitholders.
Purchases
As at 31 December 2018, the Sub-Fund did not hold any bonds, derivatives or other unit trusts, other than the FirstState Singapore and Malaysia Growth Fund Class I shares, constituting 99.34% of the Sub-Fund’s Net Asset Valueand at a market value of S$41,582,870. In addition, the Sub-Fund did not hold any investment constituting more than5% of a company’s outstanding share capital and/or debt issue. There were also no borrowings, outstandingcurrency forward contracts or material information that would adversely impact the valuation of the Sub-Fund.
In order to align with the policy of First State Investments internationally, the Investment Manager has ceased all of its soft dollar arrangements previously made with brokers with effect from 13 June 2005.
There were no commission sharing arrangement in place during the year or at the year end 31 December 2018 or at the year end 31 December 2017.
Commission Sharing Arrangement
51

Annual Report for the financial year ended 31 December 2018
Stewart Investors Global Emerging Markets Leaders Fund
MANAGER'S REPORT
for the period from 1 January to 31 December 2018
Historical performance*
in Singapore dollarsSub-Fund Benchmark
% %
3-mths -3.5 -7.66-mths -8.3 -8.31-year -12.0 -12.53-years 4.2 8.25-years 2.6 3.610-years 9.1 7.8Since Inception – 5 July 2004 7.8 7.0(Calculated since date of first valuation)
Note:
* Source: Lipper, Stewart Investors. No initial charges with income reinvested in Singapore dollars.
The Sub-Fund invests all or substantially all of its assets in the Stewart Investors Global Emerging MarketsLeaders Fund (a sub-fund of the England and Wales domiciled umbrella fund known as First StateInvestments ICVC).
Performance for 1 year and above has been annualised.
The benchmark of the Sub-Fund is the MSCI Emerging Markets Index.
52

Annual Report for the financial year ended 31 December 2018
Stewart Investors Global Emerging Markets Leaders Fund
MANAGER'S REPORT
Performance
Transactions
Outlook
Many companies remain expensive across emerging markets, despite falling in recent months. We continue to becautious with a low exposure to banks and a focus on net cash, cash-generative, companies with hard currencyearnings which are run and stewarded by high-quality management and owners.
Over the period, significant purchases included Ultrapar (Brazil: Energy), a quality, reasonably valued fueldistribution company, and Delta Electronics (Taiwan: Information Technology), an out-of-favour franchise with atrack record of evolution. We also bought VTech (Hong Kong: Information Technology), a cash-generative businessmanaged by the founder and largest shareholder Allan Wong.
We sold CCU (Chile: Consumer Staples) and Mahindra & Mahindra (India: Consumer Discretionary) on valuationconcerns. We also sold Klabin (Brazil: Materials) because of its level of debt in a highly cyclical industry.
Emerging markets declined over the twelve months to 31 December 2018 in US dollar terms with the MSCIEmerging Markets Index falling by 14.2% over the period. Qatar and Peru outperformed, while Greece and Turkeywere particularly weak. At a sector level, Energy and Utilities outperformed, while Consumer Discretionary andInformation Technology lagged.
Tata Consultancy Services (India: Information Technology) and Infosys (India: Information Technology) both roseon good results and rupee weakness, while Uni-President Enterprises (Taiwan: Consumer Staples) gained as itcontinued to show improvements in its Chinese business.
On the negative side, Vodafone Idea (India: Communication Services) declined on concerns about poor profitabilitycaused by intense competition (this company was called Idea Cellular until a merger with Vodafone was completedin August 2018). Tiger Brands (South Africa: Consumer Staples) was hit by a listeria outbreak which was traced totwo of its manufacturing facilities and Li & Fung (Hong Kong: Consumer Discretionary) was weak on concerns oversuccession and the strength of the franchise.
53

Annual Report for the financial year ended 31 December 2018
Stewart Investors Global Emerging Markets Leaders Fund
DISTRIBUTION OF INVESTMENTS
As at 31 December 2018
Holdings Market Value % of NAV
S$
Great Britain
1,146,358 11,097,928 99.15Total investments 11,097,928 99.15Other net assets 95,194 0.85Total net assets attributable to unitholders 11,193,122 100.00
DISTRIBUTION OF INVESTMENTS (UNDERLYING FUND)
Market Value % of NAV
S$
Top 10 holdings (as at 31 December 2018)
Tata Consultancy Services Ltd 161,567,337 4.0Tata Power Co Ltd 160,751,341 3.9Tiger Brands Ltd 159,935,344 3.9Unilever PLC 148,103,392 3.6Dr. Reddy's Laboratories Ltd 142,799,414 3.5Remgro Ltd 136,679,439 3.3Infosys Ltd 135,863,443 3.3Cipla Ltd 131,783,459 3.2Ultrapar Participacoes S.A. 122,399,498 3.0Newcrest Mining Limited 122,399,498 3.0
Top 10 holdings (as at 31 December 2017)
Uni-President Enterprises Corp 282,379,634 5.5Tata Consultancy Services Ltd 270,656,292 5.3Remgro Ltd 230,389,160 4.5Tata Power Co Ltd 201,845,370 4.0Tiger Brands Ltd 149,345,185 2.9Unilever PLC 144,248,080 2.8Cipla Ltd 142,209,238 2.8Compania Cervecerias Unidas S.A. 133,544,159 2.6MediaTek Inc 133,544,159 2.6Infosys Ltd 130,995,606 2.6
Stewart Investors Global Emerging Markets Leaders Fund
STEWART INVESTORS GLOBAL EMERGING
MARKETS LEADERS FUND
54

Annual Report for the financial year ended 31 December 2018
Stewart Investors Global Emerging Markets Leaders Fund
DISCLOSURES
Subscriptions -
Redemptions S$3,056,68631 December 2018 31 December 2017
Expense Ratio** 1.88% 1.84%(including that of the Underlying Fund)Portfolio Turnover 23.29% 22.82%
Disclosures on the Underlying Fund -
Portfolio Turnover 37.3% 31.3%
Expense Ratio** 1.55% 1.57%** In accordance with IMAS guidelines, expense ratio is stated on an annualised basis.
Related Party Transactions
For the financial year ended 31 December 2018
The Trustee is HSBC Institutional Trust Services (Singapore) Limited, a subsidiary of the HSBC Group.S$
Bank service fees paid to HSBC 2,370Bank balances outstanding with HSBC as at 31 December 2018
S$ equivalent
British Pound Sterling 55,723Singapore Dollar 13,416United States Dollar 1,322
Foreign exchange transacted with HSBC for the financial year ended 31 December 2018
Currency Amount Currency Amount
Singapore Dollar 3,260,328 British Pound Sterling 1,810,627United States Dollar 76,308 Singapore Dollar 104,244Others
Soft dollar commissions
In the normal course of business of the Sub-Fund, trustee’s fees and registration fees have been paid or are payableto the Trustee, while management fees have been paid or are payable to the Manager, as noted in the Statement ofTotal Return (Page 65 – 71). Transactions with related parties were at terms agreed between the parties and withinthe provisions of the Trust Deed.
The expense ratio does not include brokerage and other transaction costs, performance fee, foreign exchange gainsor losses, front or back end loads arising from the purchase or sale of other funds, tax deducted at source or arisingout of income received and dividends and other distributions paid to unitholders.
In order to align with the policy of First State Investments internationally, the Investment Manager has ceased all of its soft dollar arrangements previously made with brokers with effect from 13 June 2005.
There were no commission sharing arrangement in place during the year or at the year end 31 December 2018 or at the year end 31 December 2017.
Commission Sharing Arrangement
Purchases Sales
As at 31 December 2018, the Sub-Fund did not hold any bonds, derivatives or other unit trusts, other than theStewart Investors Global Emerging Markets Leaders Fund Class A shares, constituting 99.15% of the Sub-Fund’sNet Asset Value and at a market value of S$11,097,928. In addition, the Sub-Fund did not hold any investmentconstituting more than 5% of a company’s outstanding share capital and/or debt issue. There were also noborrowings, outstanding currency forward contracts or material information that would adversely impact the valuationof the Sub-Fund.
55

Annual Report for the financial year ended 31 December 2018
Stewart Investors Worldwide Leaders Fund
MANAGER'S REPORT
for the period from 1 January to 31 December 2018
Historical performance*
in Singapore dollarsSub-Fund Benchmark
% %
3-mths -6.3 -12.96-mths -4.9 -8.81-year -2.9 -7.13-years 5.9 5.85-years 6.1 6.510-years 8.1 9.6Since Inception – 24 August 1998 2.6 3.9(Calculated since date of first valuation)
Note:
Accordingly, the benchmark performance set out above uses the performance of the following:••
* Source: Lipper, Stewart Investors. No initial charges with income reinvested in Singapore dollars.
The performance prior to 18 October 2002 is in relation to the Sub-Fund before its conversion to a feederfund. Performance for 1 year and above has been annualised.
The Sub-Fund invests all or substantially all of its assets in the Stewart Investors Worldwide Leaders Fund, aDublin-domiciled fund.
The benchmark of the Sub-Fund is the MSCI AC World Index. With effect from 24 February 2014, thebenchmark was changed from MSCI World Index due to the change to the investment policy and approach ofthe underlying fund.
Inception to 23 February 2014: MSCI World IndexFrom 24 February 2014: MSCI AC World Index
56

Annual Report for the financial year ended 31 December 2018
Stewart Investors Worldwide Leaders Fund
MANAGER'S REPORT
Performance
Transactions
Outlook
Valuations for high-quality companies remain full. We prefer to back strong management teams who are focusing onsustainable development rather than descend the quality spectrum for notionally lower valuations.
Global markets declined in 2018 with the MSCI AC World Index falling by 8.9% in US dollar terms. At a sector level,Health Care and Utilities outperformed, while Communication Services and Materials were particularly weak.
Tata Consultancy Services (India: Information Technology) rose on good results and rupee weakness, whileUnicharm (Japan: Consumer Staples) contributed positively as it delivered reasonable earnings on the back ofcompelling demographic and sustainability tailwinds. Kikkoman (Japan: Consumer Staples) gained on solidearnings, robust performance in the US market, strong growth of soy milk and the hint of price hikes towards the endof the year.
On the negative side, Henkel KGaA (Germany: Consumer Staples) declined due to the impact of negative currencymoves, slower-than-expected M&A integration and soft end-markets. Cerner (US: Health Care) suffered onexpectations of weaker software demand, although we maintain that the long-term outlook for the franchise remainscompelling. Beiersdorf (Germany: Consumer Staples) declined on flattish earnings despite a robust balance sheetand long-term owner.
Major purchases during the period included Johnson & Johnson (US: Health Care), a quality health care companywith a positive long-term record and strong culture, and Tech Mahindra (India: Information Technology), a techoutsourcer which is part of the well-regarded Mahindra Group. We also bought Cerner (US: Health Care), acompany which is well placed for taking costs out of the US healthcare system.
We sold Varian Medical Systems (US: Health Care) because the valuation appeared increasingly stretched givenconcerns about the company’s Asian exposure. We sold Novo Nordisk (Denmark: Health Care) because of worriesthat excess profitability in the United States might pose a long-term risk to the franchise. We also sold Tesco (UK:Consumer Staples) on supply chain challenges and valuation concerns for what is increasingly a single-marketretailer.
57

Annual Report for the financial year ended 31 December 2018
Stewart Investors Worldwide Leaders Fund
DISTRIBUTION OF INVESTMENTS
As at 31 December 2018
Holdings Market Value % of NAV
S$
STEWART INVESTORS WORLDWIDE LEADERS FUND
Ireland
Stewart Investors Worldwide Leaders Fund 1,491,253 23,801,481 98.89Total investments 23,801,481 98.89Other net assets 266,824 1.11Total net assets attributable to unitholders 24,068,305 100.00
DISTRIBUTION OF INVESTMENTS (UNDERLYING FUND)
Market Value % of NAV
S$
Top 10 holdings (as at 31 December 2018)
Henkel AG & Co KGaA 5,395,791 8.5Beiersdorf AG 4,582,291 7.2Unilever Plc 4,569,580 7.2Unicharm Corp 3,533,639 5.6Tata Consultancy Services Ltd 3,222,221 5.1Merck KGaA 2,732,850 4.3Colgate-Palmolive Co 2,256,190 3.6Cerner Corporation 2,230,769 3.5Nestle S.A. 2,141,792 3.4Housing Development Finance Corp Ltd 2,001,972 3.1
Top 10 holdings (as at 31 December 2017)
Henkel AG & Co KGaA 5,679,881 9.0Unilever Plc 3,814,088 6.0Berkshire Hathaway Inc 3,179,464 5.0Beiersdorf AG 3,128,694 4.9Unicharm Corp 2,494,071 3.9Merck KGaA 2,398,877 3.8Oversea-Chinese Banking Corp 2,195,797 3.5Tata Consultancy Services Ltd 2,189,451 3.5Colgate-Palmolive Co 1,916,563 3.0Expeditors International of Washington Inc 1,707,137 2.7
58

Annual Report for the financial year ended 31 December 2018
Stewart Investors Worldwide Leaders Fund
DISCLOSURES
Subscriptions S$4,010,266
Redemptions S$5,632,704
31 December 2018 31 December 2017
Expense Ratio** 1.93% 1.96%(including that of the Underlying Fund)Portfolio Turnover 8.09% 15.50%
Disclosures on the Underlying Fund -
Portfolio Turnover 26.6% 17.9%
Expense Ratio** 1.68% 1.71%
** In accordance with IMAS guidelines, expense ratio is stated on an annualised basis.
Related Party Transactions
For the financial year ended 31 December 2018
The Trustee is HSBC Institutional Trust Services (Singapore) Limited, a subsidiary of the HSBC Group.S$
Bank service fees paid to HSBC 11,457
Bank balances outstanding with HSBC as at 31 December 2018
S$ equivalent
Singapore Dollar 157,193United States Dollar 1,363
Foreign exchange transacted with HSBC for the financial year ended 31 December 2018
Currency Amount Currency Amount
Singapore Dollar 2,504,869 Singapore Dollar 779,089United States Dollar 572,572 United States Dollar 1,844,178
Others
Soft dollar commissions
In the normal course of business of the Sub-Fund, trustee’s fees and registration fees have been paid or are payableto the Trustee, while management fees have been paid or are payable to the Manager, as noted in the Statement ofTotal Return (Page 65 – 71). Transactions with related parties were at terms agreed between the parties and withinthe provisions of the Trust Deed.
The expense ratio does not include brokerage and other transaction costs, performance fee, foreign exchange gainsor losses, front or back end loads arising from the purchase or sale of other funds, tax deducted at source or arisingout of income received and dividends and other distributions paid to unitholders.
Purchases
As at 31 December 2018 the Sub-Fund did not hold any bonds, derivatives or other unit trusts, other than theStewart Investors Worldwide Leaders Fund Class I, constituting 98.89% of the Sub-Fund’s Net Asset Value and at amarket value of S$23,801,481. In addition, the Sub-Fund did not hold any investment constituting more than 5% of acompany’s outstanding share capital and/or debt issue. There were also no borrowings, outstanding currencyforward contracts or material information that would adversely impact the valuation of the Sub-Fund.
Sales
In order to align with the policy of First State Investments internationally, the Investment Manager has ceased all of its soft dollar arrangements previously made with brokers with effect from 13 June 2005.
There were no commission sharing arrangement in place during the year or at the year end 31 December 2018 or at the year end 31 December 2017.
Commission Sharing Arrangement
59

First State Global Growth Funds
(Constituted under a Trust Deed in the Republic of Singapore)
Report of the Trustee
For the financial year ended 31 December 2018
The Trustee is under a duty to take into custody and hold the assets of the sub-funds of First State GlobalGrowth Funds, comprising First State Asia Opportunities Fund, First State Asian Growth Fund, First StateAsian Quality Bond, First State Bridge, First State Dividend Advantage, First State Global Balanced Fund, FirstState Global Infrastructure, First State Global Property Investments, First State Regional China Fund, FirstState Regional India Fund, First State Singapore Growth Fund, Stewart Investors Global Emerging MarketsLeaders Fund and Stewart Investors Worldwide Leaders Fund (collectively referred to as the "Sub-Funds"), intrust for the unitholders. In accordance with the Securities and Futures Act (Cap. 289), its subsidiary legislationand the Code on Collective Investment Schemes, the Trustee shall monitor the activities of the Manager forcompliance with the limitations imposed on the investment and the borrowing powers as set out in the TrustDeed in each annual accounting year and report thereon to unitholders in an annual report.
To the best knowledge of the Trustee, the Manager has, in all material respects, managed the Sub-Fundsduring the year covered by these financial statements, set out on pages 65 to 170, in accordance with thelimitations imposed on the investment and borrowing powers set out in the Trust Deed.
For and on behalf of the TrusteeHSBC INSTITUTIONAL TRUST SERVICES (SINGAPORE) LIMITED
Authorised signatory
12 March 2019
60

First State Global Growth Funds
(Constituted under a Trust Deed in the Republic of Singapore)
Statement by the Manager
For the financial year ended 31 December 2018
In the opinion of First State Investments (Singapore), the accompanying financial statements set out on pages65 to 170, comprising the Statements of Total Return, Statements of Financial Position, Statements ofMovements of Unitholders’ Funds, Statements of Portfolio and Notes to the Financial Statements are drawn upso as to present fairly, in all material respects, the financial positions and the portfolio holdings of the sub-fundsof First State Global Growth Funds, comprising First State Asia Opportunities Fund, First State Asian GrowthFund, First State Asian Quality Bond, First State Bridge, First State Dividend Advantage, First State GlobalBalanced Fund, First State Global Infrastructure, First State Global Property Investments, First State RegionalChina Fund, First State Regional India Fund, First State Singapore Growth Fund, Stewart Investors GlobalEmerging Markets Leaders Fund and Stewart Investors Worldwide Leaders Fund (collectively referred to as the“Sub-Funds”), as at 31 December 2018 and the financial performance and movement in unitholders’ funds forthe year then ended in accordance with the recommendations of Statement of Recommended AccountingPractice 7 “Reporting Framework for Unit Trusts” issued by the Institute of Singapore Chartered Accountants.
At the date of this statement, there are reasonable grounds to believe that the Sub-Funds will be able to meet itsfinancial obligations as and when they materialise.
For and on behalfof FIRST STATE INVESTMENTS (SINGAPORE)
Lauren Prendiville
Director
12 March 2019
61

Independent Auditor's Report to the Unitholders of
First State Global Growth Funds
(Constituted under a Trust Deed in the Republic of Singapore)
• the Statements of Total Return for the financial year ended 31 December 2018;• the Statements of Financial Position as at 31 December 2018;• the Statements of Movements of Unitholders’ Funds for the financial year ended 31 December 2018; and• the Statements of Portfolio as at 31 December 2018;• the notes to the financial statements, including a summary of significant accounting policies.
Our Opinion
In our opinion, the accompanying financial statements of the sub-funds of First State Global Growth Funds,comprising First State Asia Opportunities Fund, First State Asian Growth Fund, First State Asian Quality Bond,First State Bridge, First State Dividend Advantage, First State Global Balanced Fund, First State GlobalInfrastructure, First State Global Property Investments, First State Regional China Fund, First State RegionalIndia Fund, First State Singapore Growth Fund, Stewart Investors Global Emerging Markets Leaders Fund andStewart Investors Worldwide Leaders Fund (collectively referred to as the “Sub-Funds”) are properly drawn up inaccordance with the recommendations of Statement of Recommended Accounting Practice 7 “ReportingFramework for Unit Trusts” issued by the Institute of Singapore Chartered Accountants, so as to present fairly,in all material respects, the financial positions and portfolio holdings of the Sub-Funds as at 31 December 2018,and of the financial performance and movements of unitholders’ funds for the financial year ended on that date.
What we have audited
The financial statements of the Sub-Funds comprise:
Basis for Opinion
We conducted our audit in accordance with Singapore Standards on Auditing ("SSAs"). Our responsibilitiesunder those standards are further described in the Auditor’s Responsibilities for the Audit of the FinancialStatements section of our report.
We believe that the audit evidence we have obtained is sufficient and appropriate to provide a basis for our auditopinion.
Independence
We are independent of the Sub-Funds in accordance with the Accounting and Corporate Regulatory AuthorityCode of Professional Conduct and Ethics for Public Accountants and Accounting Entities ("ACRA Code")together with the ethical requirements that are relevant to our audit of the financial statements in Singapore, andwe have fulfilled our other ethical responsibilities in accordance with these requirements and the ACRA Code.
Other Information
The Sub-Funds’ Manager (the “Manager”) is responsible for the other information. The other informationcomprises all the sections of the annual report but does not include the financial statements and our auditor’sreport thereon.
Our opinion on the financial statements does not cover the other information and we do not express any form ofassurance conclusion thereon.
62

Independent Auditor's Report to the Unitholders of
First State Global Growth Funds
(Constituted under a Trust Deed in the Republic of Singapore)
• Identify and assess the risks of material misstatement of the financial statements, whether due to fraud orerror, design and perform audit procedures responsive to those risks, and obtain audit evidence that issufficient and appropriate to provide a basis for our opinion. The risk of not detecting a materialmisstatement resulting from fraud is higher than for one resulting from error, as fraud may involve collusion,forgery, intentional omissions, misrepresentations, or the override of internal control.
• Obtain an understanding of internal control relevant to the audit in order to design audit procedures that areappropriate in the circumstances, but not for the purpose of expressing an opinion on the effectiveness ofthe Sub-Funds’ internal control.
• Evaluate the appropriateness of accounting policies used and the reasonableness of accounting estimatesand related disclosures made by the Manager.
In connection with our audit of the financial statements, our responsibility is to read the other information and, indoing so, consider whether the other information is materially inconsistent with the financial statements or ourknowledge obtained in the audit, or otherwise appears to be materially misstated. If, based on the work we haveperformed, we conclude that there is a material misstatement of this other information, we are required to reportthat fact. We have nothing to report in this regard.
Responsibilities of the Manager for the Financial Statements
The Manager is responsible for the preparation and fair presentation of these financial statements inaccordance with the recommendations of Statement of Recommended Accounting Practice 7 “ReportingFramework for Unit Trusts” issued by the Institute of Singapore Chartered Accountants and for such internalcontrol as the Manager determines is necessary to enable the preparation of financial statements that are freefrom material misstatement, whether due to fraud or error.
In preparing the financial statements, the Manager is responsible for assessing the Sub-Funds’ ability tocontinue as a going concern, disclosing, as applicable, matters related to going concern and using the goingconcern basis of accounting unless the Manager either intends to terminate the Sub-Funds or to cease the Sub-Funds' operations, or has no realistic alternative but to do so.
Auditor’s Responsibilities for the Audit of the Financial Statements
The Manager's responsibilities include overseeing the Sub-Funds' financial reporting process.
Other Information (continued)
Our objectives are to obtain reasonable assurance about whether the financial statements as a whole are freefrom material misstatement, whether due to fraud or error, and to issue an auditor’s report that includes ouropinion. Reasonable assurance is a high level of assurance, but is not a guarantee that an audit conducted inaccordance with SSAs will always detect a material misstatement when it exists. Misstatements can arise fromfraud or error and are considered material if, individually or in the aggregate, they could reasonably be expectedto influence the economic decisions of users taken on the basis of these financial statements.
As part of an audit in accordance with SSAs, we exercise professional judgement and maintain professionalscepticism throughout the audit. We also:
63

Independent Auditor's Report to the Unitholders of
First State Global Growth Funds
(Constituted under a Trust Deed in the Republic of Singapore)
• Conclude on the appropriateness of the Manager’s use of the going concern basis of accounting and, basedon the audit evidence obtained, whether a material uncertainty exists related to events or conditions that maycast significant doubt on the Sub-Funds’ ability to continue as a going concern. If we conclude that a materialuncertainty exists, we are required to draw attention in our auditor’s report to the related disclosures in thefinancial statements or, if such disclosures are inadequate, to modify our opinion. Our conclusions are basedon the audit evidence obtained up to the date of our auditor’s report. However, future events or conditionsmay cause the Sub-Funds to cease to continue as a going concern.
• Evaluate the overall presentation, structure and content of the financial statements, including the disclosures,and whether the financial statements represent the underlying transactions and events in a manner thatachieves fair presentation.
Public Accountants and Chartered Accountants
Singapore, 12 March 2019
We communicate with the Manager regarding, among other matters, the planned scope and timing of the auditand significant audit findings, including any significant deficiencies in internal control that we identify during ouraudit.
PricewaterhouseCoopers LLP
Auditor’s Responsibilities for the Audit of the Financial Statements (continued)
64

First State Global Growth Funds
(Constituted under a Trust Deed in the Republic of Singapore)
Statements of Total Return
For the financial year ended 31 December 2018
Notes
2018 2017 2018 2017
S$ S$ S$ S$
Income - - - -
Less: Expenses
Management fees 11 383,627 439,787 980,157 1,056,390Management fee rebates 11 (383,834) (450,130) (974,471) (1,059,560)Registration fees 11 8,780 13,149 15,663 9,131Trustee's fees 11 16,559 19,422 49,008 52,819Audit fees 14,701 12,673 14,701 12,673Others 15,063 32,080 5,412 42,264
54,896 66,981 90,470 113,717Net loss (54,896) (66,981) (90,470) (113,717)
Net gains or losses on value
of investments
Net (losses)/gains on investments (910,175) 3,465,582 (1,551,970) 9,862,806Net foreign exchange gains/(losses) 5,370 (17,020) 7,820 (37,020)
(904,805) 3,448,562 (1,544,150) 9,825,786
Total (deficit)/return for the
financial year before taxation
Less: Income tax 3 - - - -
Total (deficit)/return for the
financial year after income tax
First State Asia
Opportunities Fund First State Asian Growth Fund
9,712,069
(1,634,620) 9,712,069
(959,701) 3,381,581 (1,634,620)
(959,701) 3,381,581
The accompanying notes form an integral part of these financial statements.
65
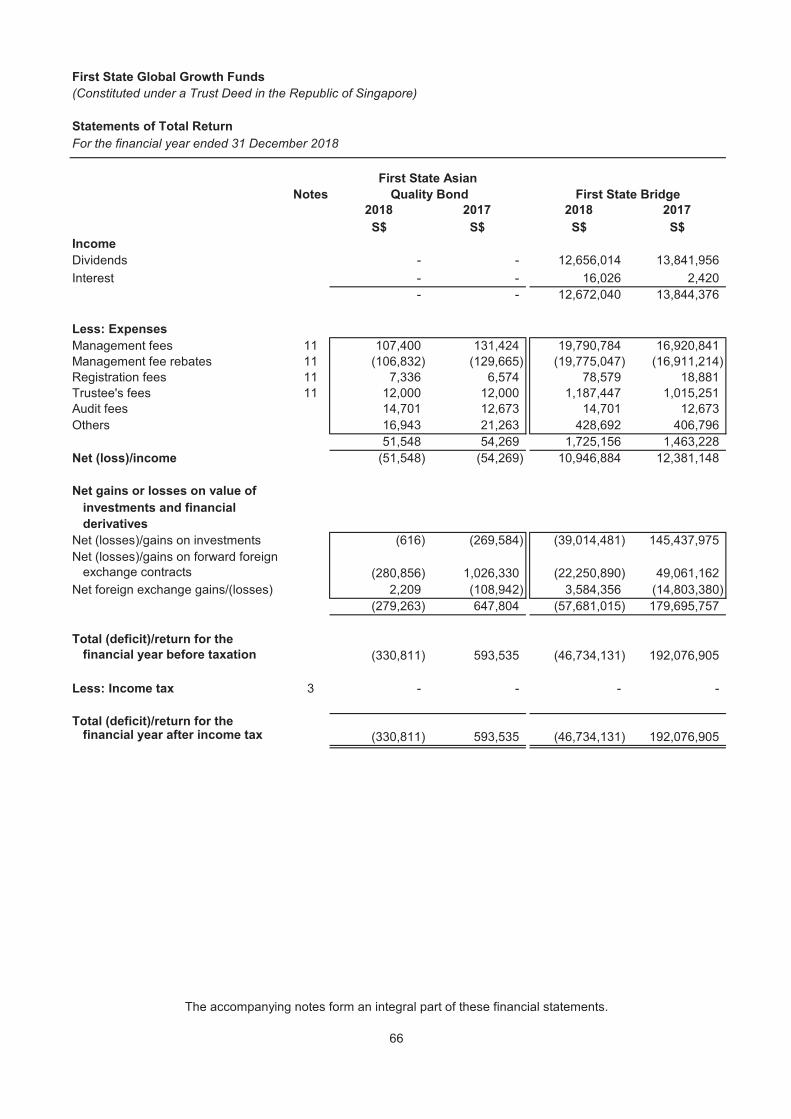
First State Global Growth Funds
(Constituted under a Trust Deed in the Republic of Singapore)
Statements of Total Return
For the financial year ended 31 December 2018
Notes
2018 2017 2018 2017
S$ S$ S$ S$
Income
Dividends - - 12,656,014 13,841,956Interest - - 16,026 2,420
- - 12,672,040 13,844,376
Less: Expenses
Management fees 11 107,400 131,424 19,790,784 16,920,841Management fee rebates 11 (106,832) (129,665) (19,775,047) (16,911,214)Registration fees 11 7,336 6,574 78,579 18,881Trustee's fees 11 12,000 12,000 1,187,447 1,015,251Audit fees 14,701 12,673 14,701 12,673Others 16,943 21,263 428,692 406,796
51,548 54,269 1,725,156 1,463,228Net (loss)/income (51,548) (54,269) 10,946,884 12,381,148
Net (losses)/gains on investments (616) (269,584) (39,014,481) 145,437,975Net (losses)/gains on forward foreign
exchange contracts (280,856) 1,026,330 (22,250,890) 49,061,162Net foreign exchange gains/(losses) 2,209 (108,942) 3,584,356 (14,803,380)
(279,263) 647,804 (57,681,015) 179,695,757
Total (deficit)/return for the
financial year before taxation (330,811) 593,535 (46,734,131) 192,076,905
Less: Income tax 3 - - - -
Total (deficit)/return for the
financial year after income tax (330,811) 593,535 (46,734,131) 192,076,905
investments and financial
derivatives
First State Bridge
First State Asian
Quality Bond
Net gains or losses on value of
The accompanying notes form an integral part of these financial statements.
66

First State Global Growth Funds
(Constituted under a Trust Deed in the Republic of Singapore)
Statements of Total Return
For the financial year ended 31 December 2018
Notes
2018 2017 2018 2017
S$ S$ S$ S$
Income
Dividends 37,851,916 40,431,548 - -Interest 45,048 11,906 - -
37,896,964 40,443,454 - -
Less: Expenses
Management fees 11 35,703,397 30,031,982 225,550 231,536Management fee rebates 11 (35,518,812) (29,925,694) (233,306) (240,791)Registration fees 11 122,750 39,457 9,001 6,552Trustee's fees 11 1,785,170 1,501,599 15,015 15,000Audit fees 14,701 12,673 14,701 12,673Others 808,534 730,138 16,253 13,155
2,915,740 2,390,155 47,214 38,125Net income/(loss) 34,981,224 38,053,299 (47,214) (38,125)
Net gains or losses on value
Net (losses)/gains on investments (144,046,547) 454,222,091 (262,039) 1,424,476Net foreign exchange gains/(losses) 7,003,138 (28,559,645) (3,454) (8,271)
(137,043,409) 425,662,446 (265,493) 1,416,205
Total (deficit)/return for the
financial year before taxation (102,062,185) 463,715,745 (312,707) 1,378,080
Less: Income tax 3 - - - -
Total (deficit)/return for the
financial year after income tax (102,062,185) 463,715,745 (312,707) 1,378,080
of investments
First State Global
Balanced Fund
First State
Dividend Advantage
The accompanying notes form an integral part of these financial statements.
67
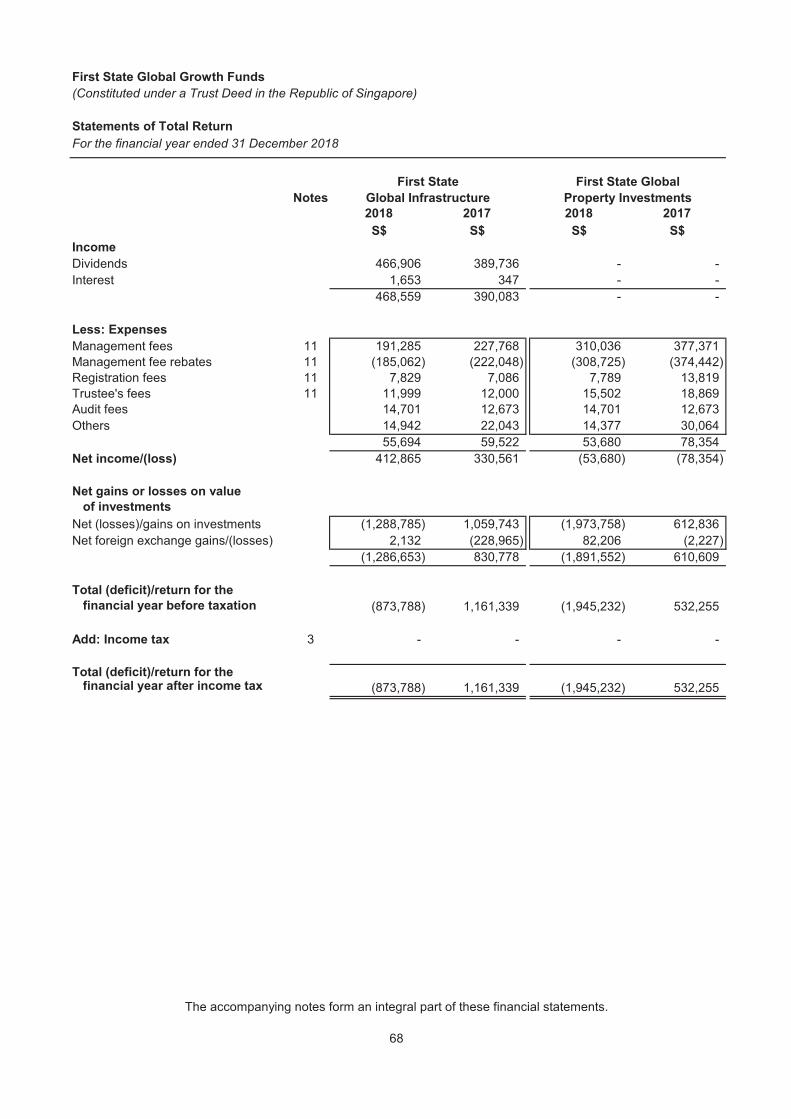
First State Global Growth Funds
(Constituted under a Trust Deed in the Republic of Singapore)
Statements of Total Return
For the financial year ended 31 December 2018
Notes
2018 2017 2018 2017
S$ S$ S$ S$
Income
Dividends 466,906 389,736 - -Interest 1,653 347 - -
468,559 390,083 - -
Less: Expenses
Management fees 11 191,285 227,768 310,036 377,371Management fee rebates 11 (185,062) (222,048) (308,725) (374,442)Registration fees 11 7,829 7,086 7,789 13,819Trustee's fees 11 11,999 12,000 15,502 18,869Audit fees 14,701 12,673 14,701 12,673Others 14,942 22,043 14,377 30,064
55,694 59,522 53,680 78,354Net income/(loss) 412,865 330,561 (53,680) (78,354)
Net gains or losses on value
of investments
Net (losses)/gains on investments (1,288,785) 1,059,743 (1,973,758) 612,836Net foreign exchange gains/(losses) 2,132 (228,965) 82,206 (2,227)
(1,286,653) 830,778 (1,891,552) 610,609
Total (deficit)/return for the
financial year before taxation (873,788) 1,161,339 (1,945,232) 532,255
Add: Income tax 3 - - - -
Total (deficit)/return for the
financial year after income tax (873,788) 1,161,339 (1,945,232) 532,255
First State Global
Property Investments
First State
Global Infrastructure
The accompanying notes form an integral part of these financial statements.
68

First State Global Growth Funds
(Constituted under a Trust Deed in the Republic of Singapore)
Statements of Total Return
For the financial year ended 31 December 2018
Notes
2018 2017 2018 2017
S$ S$ S$ S$
Income - - - -
Less: Expenses
Management fees 11 7,304,234 6,555,261 1,880,758 1,599,046Management fee rebates 11 (7,279,178) (6,541,279) (1,867,251) (1,586,576)Registration fees 11 42,788 10,604 21,148 10,413Trustee's fees 11 365,212 327,763 80,604 68,530Audit fees 14,701 12,673 14,701 12,673Transaction costs - - - -Others 164,230 173,244 55,110 67,093
611,987 538,266 185,070 171,179Net loss (611,987) (538,266) (185,070) (171,179)
Net gains or losses on value
of investments
Net (losses)/gains on investments (60,928,681) 141,272,027 (6,995,758) 22,719,520Net foreign exchange gains/(losses) 137,757 (555,737) (80,609) 26,604
(60,790,924) 140,716,290 (7,076,367) 22,746,124
Total (deficit)/return for the
financial year before taxation (61,402,911) 140,178,024 (7,261,437) 22,574,945
Less: Income tax 3 - - - -
Total (deficit)/return for the
financial year after income tax (61,402,911) 140,178,024 (7,261,437) 22,574,945
First State Regional
India Fund First State Regional China Fund
The accompanying notes form an integral part of these financial statements.
69

First State Global Growth Funds
(Constituted under a Trust Deed in the Republic of Singapore)
Statements of Total Return
For the financial year ended 31 December 2018
Notes
2018 2017 2018 2017
S$ S$ S$ S$
Income - - - -
Less: Expenses
Management fees 11 680,748 685,639 201,801 244,984Management fee rebates 11 (678,002) (683,194) (200,246) (243,560)Registration fees 11 10,696 5,824 6,599 3,925Trustee's fees 11 34,037 34,282 15,000 15,000Audit fees 14,701 12,673 14,701 12,673Others 19,524 23,854 7,404 11,470
81,704 79,078 45,259 44,492Net loss (81,704) (79,078) (45,259) (44,492)
Net gains or losses on value
of investments
Net gains/(losses) on investments 104,881 5,082,747 (1,624,189) 2,772,329Net foreign exchange losses (2,474) (33,289) (10,625) (6,573)
102,407 5,049,458 (1,634,814) 2,765,756
Total (deficit)/return for the
financial year before taxation 20,703 4,970,380 (1,680,073) 2,721,264
Less: Income tax 3 - - - -
Total (deficit)/return for the
financial year after income tax 20,703 4,970,380 (1,680,073) 2,721,264
First State Singapore
Growth Fund
Stewart Investors Global
Emerging Markets
The accompanying notes form an integral part of these financial statements.
70

First State Global Growth Funds
(Constituted under a Trust Deed in the Republic of Singapore)
Statements of Total Return
For the financial year ended 31 December 2018
Notes
2018 2017
S$ S$
Income - -
Less: Expenses
Management fees 11 387,491 384,260Management fee rebates 11 (384,857) (381,480)Registration fees 11 11,460 7,350Trustee's fees 11 19,375 19,213Audit fees 14,701 12,673Others 22,371 25,407
70,541 67,423Net loss (70,541) (67,423)
Net gains or losses on value
of investments
Net (losses)/gains on investments (621,629) 3,374,788Net foreign exchange gains/(losses) 1,055 (42,706)
(620,574) 3,332,082
Total (deficit)/return for the
financial year before taxation (691,115) 3,264,659
Less: Income tax 3 - -
Total (deficit)/return for the
financial year after income tax (691,115) 3,264,659
Stewart Investors Worldwide
Leaders Fund
The accompanying notes form an integral part of these financial statements.
71

First State Global Growth Funds
(Constituted under a Trust Deed in the Republic of Singapore)
Statements of Financial Position
As at 31 December 2018
Notes
2018 2017 2018 2017
S$ S$ S$ S$
ASSETS
Portfolio of investments 20,194,146 25,925,431 58,935,513 69,628,091Sales awaiting settlement - - 107,677 225,852Other receivables 5 122,427 209,727 305,796 537,574Cash and bank balances 11 152,644 157,616 279,142 490,432Total assets 20,469,217 26,292,774 59,628,128 70,881,949
LIABILITIES
Purchases awaiting settlement - - - 118,940Other payables 6 79,417 104,396 213,265 626,054Total liabilities 79,417 104,396 213,265 744,994
EQUITY
8 20,389,800 26,188,378 59,414,863 70,136,955
First State Asia
Opportunities Fund First State Asian Growth Fund
Net assets attributable to unitholders
The accompanying notes form an integral part of these financial statements.
72

First State Global Growth Funds
(Constituted under a Trust Deed in the Republic of Singapore)
Statements of Financial Position
As at 31 December 2018
Notes
2018 2017 2018 2017
S$ S$ S$ S$
ASSETS
Portfolio of investments 8,761,364 13,581,671 1,678,640,545 1,468,842,320Sales awaiting settlement 58,609 74,838 - -Other receivables 5 40,050 61,345 11,446,664 14,239,146Cash and bank balances 11 69,988 324,330 1,466,236 3,650,561Financial derivatives, at fair value 7 112,308 216,587 6,094,678 9,574,752Total assets 9,042,319 14,258,771 1,697,648,123 1,496,306,779
LIABILITIES
Distribution payable - - 248,589 -Financial derivatives, at fair value 7 7,108 15,310 78,908 11,136Purchases awaiting settlement - 243,225 1,679,216 4,646,663Other payables 6 86,931 181,957 5,571,429 5,678,149Total liabilities 94,039 440,492 7,578,142 10,335,948
EQUITY
8 8,948,280 13,818,279 1,690,069,981 1,485,970,831
First State Asian
Quality Bond First State Bridge
Net assets attributable to unitholders
The accompanying notes form an integral part of these financial statements.
73

First State Global Growth Funds
(Constituted under a Trust Deed in the Republic of Singapore)
Statements of Financial Position
As at 31 December 2018
Notes
2018 2017 2018 2017
S$ S$ S$ S$
ASSETS
Portfolio of investments 2,488,484,007 2,109,778,598 17,207,136 18,214,126Other receivables 5 20,704,967 22,858,302 66,498 86,704Cash and bank balances 11 1,957,363 4,489,628 205,069 60,533Total assets 2,511,146,337 2,137,126,528 17,478,703 18,361,363
LIABILITIES
Distribution payable 25,025,822 21,275,784 - -Purchases awaiting settlement 3,756,428 8,523,559 122,670 -Other payables 6 7,436,513 9,757,570 61,475 51,546Total liabilities 36,218,763 39,556,913 184,145 51,546
EQUITY
8 2,474,927,574 2,097,569,615 17,294,558 18,309,817
First State
Dividend Advantage
First State Global
Balanced Fund
Net assets attributable to unitholders
The accompanying notes form an integral part of these financial statements.
74

First State Global Growth Funds
(Constituted under a Trust Deed in the Republic of Singapore)
Statements of Financial Position
As at 31 December 2018
Notes
2018 2017 2018 2017
S$ S$ S$ S$
ASSETS
Portfolio of investments 10,542,741 14,881,756 14,666,142 26,688,222Sales awaiting settlement 39,926 - 242,614 -Other receivables 5 49,648 275,818 150,312 304,299Cash and bank balances 11 312,866 441,209 1,363 283,396Total assets 10,945,181 15,598,783 15,060,431 27,275,917
LIABILITIES
Bank overdraft 11 - - 143,466 -Purchases awaiting settlement - 310,944 - 187,096Other payables 6 74,042 61,400 125,922 99,194Total liabilities 74,042 372,344 269,388 286,290
EQUITY
8 10,871,139 15,226,439 14,791,043 26,989,627
First State
Global Infrastructure
First State Global
Property Investments
Net assets attributable to unitholders
The accompanying notes form an integral part of these financial statements.
75

First State Global Growth Funds
(Constituted under a Trust Deed in the Republic of Singapore)
Statements of Financial Position
As at 31 December 2018
Notes
2018 2017 2018 2017
S$ S$ S$ S$
ASSETS
Portfolio of investments 434,734,947 488,861,929 105,784,335 109,326,493Sales awaiting settlement 346,202 466,404 - -Other receivables 5 2,562,274 4,795,960 750,849 1,296,812Cash and bank balances 11 375,767 524,386 496,256 700,041Total assets 438,019,190 494,648,679 107,031,440 111,323,346
LIABILITIES
Purchases awaiting settlement - 1,282,944 - 558,615Other payables 6 1,224,663 2,574,506 306,677 355,013Total liabilities 1,224,663 3,857,450 306,677 913,628
EQUITY
8 436,794,527 490,791,229 106,724,763 110,409,718Net assets attributable to unitholders
First State Regional
India Fund
First State Regional China
Fund
The accompanying notes form an integral part of these financial statements.
76

First State Global Growth Funds
(Constituted under a Trust Deed in the Republic of Singapore)
Statements of Financial Position
As at 31 December 2018
Notes
2018 2017 2018 2017
S$ S$ S$ S$
ASSETS
Portfolio of investments 41,582,870 45,085,532 11,097,928 15,857,054Sales awaiting settlement - 45,438 26,039 -Other receivables 5 219,260 196,789 50,567 63,635Cash and bank balances 11 211,377 305,635 70,461 63,389Total assets 42,013,507 45,633,394 11,244,995 15,984,078
LIABILITIES
Purchases awaiting settlement - 21,382 - -Other payables 6 152,314 260,896 51,873 54,197Total liabilities 152,314 282,278 51,873 54,197
EQUITY
8 41,861,193 45,351,116 11,193,122 15,929,881
Stewart Investors Global
Emerging Markets
First State Singapore
Growth Fund
Net assets attributable to unitholders
The accompanying notes form an integral part of these financial statements.
77
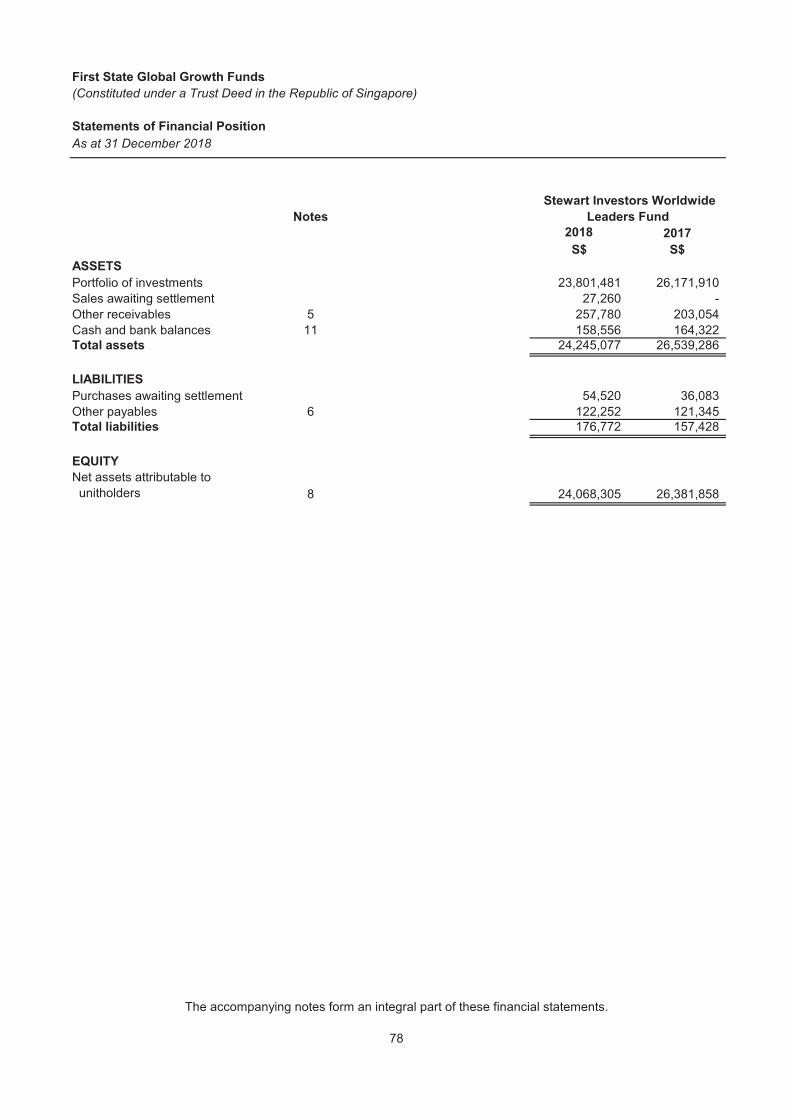
First State Global Growth Funds
(Constituted under a Trust Deed in the Republic of Singapore)
Statements of Financial Position
As at 31 December 2018
Notes
2018 2017
S$ S$
ASSETS
Portfolio of investments 23,801,481 26,171,910Sales awaiting settlement 27,260 -Other receivables 5 257,780 203,054Cash and bank balances 11 158,556 164,322Total assets 24,245,077 26,539,286
LIABILITIES
Purchases awaiting settlement 54,520 36,083Other payables 6 122,252 121,345Total liabilities 176,772 157,428
EQUITY
8 24,068,305 26,381,858Net assets attributable to unitholders
Stewart Investors Worldwide
Leaders Fund
The accompanying notes form an integral part of these financial statements.
78

First State Global Growth Funds
(Constituted under a Trust Deed in the Republic of Singapore)
Statements of Movements of Unitholders' Funds
For the financial year ended 31 December 2018
Notes
2018 2017 2018 2017
S$ S$ S$ S$
unitholders at the beginning
of financial year 26,188,378 24,677,751 70,136,955 69,963,215
Operations
unitholders resulting from operations (959,701) 3,381,581 (1,634,620) 9,712,069
Unitholders' contributions/
(withdrawals)
Creation of units 1,562,054 4,614,855 12,579,587 16,823,209Cancellation of units (6,400,931) (6,485,809) (21,667,059) (26,361,538)
unitholders resulting from netcreation and cancellation of units (4,838,877) (1,870,954) (9,087,472) (9,538,329)
assets attributable to unitholders (5,798,578) 1,510,627 (10,722,092) 173,740
unitholders at the end of
financial year 8 20,389,800 26,188,378 59,414,863 70,136,955
Change in net assets attributable to
First State Asian Growth Fund
First State Asia
Opportunities Fund
Total (decrease)/increase in net
Net assets attributable to
Net assets attributable to
Change in net assets attributable to
The accompanying notes form an integral part of these financial statements.
79

First State Global Growth Funds
(Constituted under a Trust Deed in the Republic of Singapore)
Statements of Movements of Unitholders' Funds
For the financial year ended 31 December 2018
Notes
2018 2017 2018 2017
S$ S$ S$ S$
unitholders at the beginning
of financial year 13,818,279 12,152,340 1,485,970,831 1,240,111,311
Operations
unitholders resulting from operations (330,811) 593,535 (46,734,131) 192,076,905
Unitholders' contributions/
(withdrawals)
Creation of units 2,055,616 4,183,308 570,557,811 360,158,643Cancellation of units (6,154,555) (2,579,670) (255,793,791) (266,216,802)
unitholders resulting from netcreation and cancellation of units (4,098,939) 1,603,638 314,764,020 93,941,841
Distributions 4 (440,249) (531,234) (63,930,739) (40,159,226)
assets attributable to unitholders (4,869,999) 1,665,939 204,099,150 245,859,520
unitholders at the end of
financial year 8 8,948,280 13,818,279 1,690,069,981 1,485,970,831
Change in net assets attributable to
Change in net assets attributable to
Net assets attributable to
First State Bridge
Net assets attributable to
First State Asian
Quality Bond
Total (decrease)/increase in net
The accompanying notes form an integral part of these financial statements.
80

First State Global Growth Funds
(Constituted under a Trust Deed in the Republic of Singapore)
Statements of Movements of Unitholders' Funds
For the financial year ended 31 December 2018
Notes
2018 2017 2018 2017
S$ S$ S$ S$
unitholders at the beginning
of financial year 2,097,569,615 1,867,770,247 18,309,817 18,615,395
Operations
unitholders resulting from operations (102,062,185) 463,715,745 (312,707) 1,378,080
Unitholders' contributions/
(withdrawals)
Creation of units 1,056,841,386 574,972,378 4,049,829 1,793,070Cancellation of units (479,636,946) (727,559,219) (4,752,381) (3,476,728)
unitholders resulting from netcreation and cancellation of units 577,204,440 (152,586,841) (702,552) (1,683,658)
Distributions 4 (97,784,296) (81,329,536) - -
assets attributable to unitholders 377,357,959 229,799,368 (1,015,259) (305,578)
unitholders at the end of
financial year 8 2,474,927,574 2,097,569,615 17,294,558 18,309,817
First State Global
Balanced Fund
Net assets attributable to
Change in net assets attributable to
First State
Dividend Advantage
Change in net assets attributable to
Total increase/(decrease) in net
Net assets attributable to
The accompanying notes form an integral part of these financial statements.
81

First State Global Growth Funds
(Constituted under a Trust Deed in the Republic of Singapore)
Statements of Movements of Unitholders' Funds
For the financial year ended 31 December 2018
Notes
2018 2017 2018 2017
S$ S$ S$ S$
unitholders at the beginning
of financial year 15,226,439 13,457,538 26,989,627 23,824,432
Operations
unitholders resulting from operations (873,788) 1,161,339 (1,945,232) 532,255
Unitholders' contributions/
(withdrawals)
Creation of units 2,300,419 9,884,706 4,149,924 9,035,511Cancellation of units (5,408,866) (8,812,225) (14,187,886) (6,065,844)
unitholders resulting from netcreation and cancellation of units (3,108,447) 1,072,481 (10,037,962) 2,969,667
Distributions 4 (373,065) (464,919) (215,390) (336,727)
assets attributable to unitholders (4,355,300) 1,768,901 (12,198,584) 3,165,195
unitholders at the end of
financial year 8 10,871,139 15,226,439 14,791,043 26,989,627
First State
Global Infrastructure
Net assets attributable to
Change in net assets attributable to
Total (decrease)/increase in net
Net assets attributable to
First State Global
Property Investments
Change in net assets attributable to
The accompanying notes form an integral part of these financial statements.
82

First State Global Growth Funds
(Constituted under a Trust Deed in the Republic of Singapore)
Statements of Movements of Unitholders' Funds
For the financial year ended 31 December 2018
Notes
2018 2017 2018 2017
S$ S$ S$ S$
unitholders at the beginning
of financial year 490,791,229 401,966,348 110,409,718 72,760,480
Operations
unitholders resulting from operations (61,402,911) 140,178,024 (7,261,437) 22,574,945
Unitholders' contributions/
(withdrawals)
Creation of units 128,212,999 88,068,196 32,329,070 42,107,491Cancellation of units (120,806,790) (139,421,339) (28,752,588) (27,033,198)
unitholders resulting from netcreation and cancellation of units 7,406,209 (51,353,143) 3,576,482 15,074,293
assets attributable to unitholders (53,996,702) 88,824,881 (3,684,955) 37,649,238
unitholders at the end of
financial year 8 436,794,527 490,791,229 106,724,763 110,409,718
Total (decrease)/increase in net
Net assets attributable to
Net assets attributable to
Change in net assets attributable to
First State Regional
India Fund
First State Regional China
Fund
Change in net assets attributable to
The accompanying notes form an integral part of these financial statements.
83

First State Global Growth Funds
(Constituted under a Trust Deed in the Republic of Singapore)
Statements of Movements of Unitholders' Funds
For the financial year ended 31 December 2018
Notes
2018 2017 2018 2017
S$ S$ S$ S$
unitholders at the beginning
of financial year 45,351,116 44,911,230 15,929,881 16,876,190
Operations
unitholders resulting from operations 20,703 4,970,380 (1,680,073) 2,721,264
Unitholders' contributions/
(withdrawals)
Creation of units 1,386,085 1,749,999 - -Cancellation of units (4,896,711) (6,280,493) (3,056,686) (3,667,573)
unitholders resulting from netcreation and cancellation of units (3,510,626) (4,530,494) (3,056,686) (3,667,573)
attributable to unitholders (3,489,923) 439,886 (4,736,759) (946,309)
unitholders at the end of
financial year 8 41,861,193 45,351,116 11,193,122 15,929,881
Stewart Investors Global
Emerging Markets
Total (decrease)/increase in net
Net assets attributable to
First State Singapore
Growth Fund
Net assets attributable to
Change in net assets attributable to
Change in net assets attributable to
The accompanying notes form an integral part of these financial statements.
84

First State Global Growth Funds
(Constituted under a Trust Deed in the Republic of Singapore)
Statements of Movements of Unitholders' Funds
For the financial year ended 31 December 2018
Notes
2018 2017
S$ S$
unitholders at the beginning
of financial year 26,381,858 23,305,916
Operations
unitholders resulting from operations (691,115) 3,264,659
Unitholders' contributions/
(withdrawals)
Creation of units 4,010,266 6,799,347Cancellation of units (5,632,704) (6,988,064)
unitholders resulting from netcreation and cancellation of units (1,622,438) (188,717)
assets attributable to unitholders (2,313,553) 3,075,942
unitholders at the end of
financial year 8 24,068,305 26,381,858
Total (decrease)/increase in net
Net assets attributable to
Stewart Investors Worldwide
Leaders Fund
Net assets attributable to
Change in net assets attributable to
Change in net assets attributable to
The accompanying notes form an integral part of these financial statements.
85

First State Global Growth Funds
(Constituted under a Trust Deed in the Republic of Singapore)
Statements of Portfolio
As at 31 December 2018
Percentage of Percentage of
total net assets total net assets
attributable to attributable to
Holdings at Fair value at unitholders at unitholders at
31 December 31 December 31 December 31 December
2018 2018 2018 2017
S$ % %
First State Asia Opportunities Fund (1)
Quoted
Ireland
First State Global Umbrella Fund plc -First State Asia Opportunities Fund Class I 342,328 20,194,146 99.04 99.00
Portfolio of investments 20,194,146 99.04 99.00Other net assets 195,654 0.96 1.00
Net assets attributable to unitholders 20,389,800 100.00 100.00
First State Asian Growth Fund(1)
Quoted
Ireland
First State Global Umbrella Fund plc -First State Asian Growth Fund Class I 965,600 58,935,513 99.19 99.27
Portfolio of investments 58,935,513 99.19 99.27Other net assets 479,350 0.81 0.73
Net assets attributable to unitholders 59,414,863 100.00 100.00
First State Asian Quality Bond(1)
Quoted
Ireland
First State Global Umbrella Fund plc -First State Asian Quality Bond Fund Class I 393,390 8,761,364 97.91 98.29
Portfolio of investments 8,761,364 97.91 98.29Other net assets 186,916 2.09 1.71
Net assets attributable to unitholders 8,948,280 100.00 100.00
The accompanying notes form an integral part of these financial statements.
86

First State Global Growth Funds
(Constituted under a Trust Deed in the Republic of Singapore)
Statements of Portfolio
As at 31 December 2018
Percentage of Percentage of
total net assets total net assets
attributable to attributable to
Holdings at Fair value at unitholders at unitholders at
31 December 31 December 31 December 31 December
2018 2018 2018 2017
S$ % %
First State Bridge(1)
Quoted
Ireland
First State Global Umbrella Fund plc -First State Asian Equity Plus Fund Class I 12,284,041 825,102,360 48.82 50.73
First State Global Umbrella Fund plc -First State Asian Quality Bond Fund Class I 38,324,372 853,538,185 50.50 48.12
Portfolio of investments 1,678,640,545 99.32 98.85Other net assets 11,429,436 0.68 1.15
Net assets attributable to unitholders 1,690,069,981 100.00 100.00
First State Dividend Advantage (1)
Quoted
Ireland
First State Global Umbrella Fund plc -First State Asian Equity Plus Fund Class I 37,048,301 2,488,484,007 100.55 100.58
Portfolio of investments 2,488,484,007 100.55 100.58Other net liabilities (13,556,433) (0.55) (0.58)
Net assets attributable to unitholders 2,474,927,574 100.00 100.00
First State Global Balanced Fund(1)
Quoted
Ireland
First State Global Umbrella Fund plc -First State Global Bond Fund Class I 333,466 7,126,791 41.21 38.61
First State Global Umbrella Fund plc -Stewart Investors Worldwide Leaders Fund Class I 631,572 10,080,345 58.28 60.87
Portfolio of investments 17,207,136 99.49 99.48Other net assets 87,422 0.51 0.52
Net assets attributable to unitholders 17,294,558 100.00 100.00
The accompanying notes form an integral part of these financial statements.
87

First State Global Growth Funds
(Constituted under a Trust Deed in the Republic of Singapore)
Statements of Portfolio
As at 31 December 2018
Percentage of Percentage of
total net assets total net assets
attributable to attributable to
Holdings at Fair value at unitholders at unitholders at
31 December 31 December 31 December 31 December
2018 2018 2018 2017
S$ % %
First State Global Infrastructure(2)
Quoted
Great Britain
First State Investments ICVC -First State Global Listed Infrastructure Fund Class A 3,471,250 10,542,741 96.98 97.74
Portfolio of investments 10,542,741 96.98 97.74Other net assets 328,398 3.02 2.26
Net assets attributable to unitholders 10,871,139 100.00 100.00
First State Global Property Investments (1)
Quoted
Ireland
First State Global Umbrella Fund plc -First State Global Property Securities Fund Class I 959,874 14,666,142 99.16 98.88
Portfolio of investments 14,666,142 99.16 98.88Other net assets 124,901 0.84 1.12
Net assets attributable to unitholders 14,791,043 100.00 100.00
First State Regional China Fund(1)
Quoted
Ireland
First State Global Umbrella Fund plc -First State Greater China Growth Fund Class I 3,414,930 434,734,947 99.53 99.61
Portfolio of investments 434,734,947 99.53 99.61Other net assets 2,059,580 0.47 0.39
Net assets attributable to unitholders 436,794,527 100.00 100.00
The accompanying notes form an integral part of these financial statements.
88

First State Global Growth Funds
(Constituted under a Trust Deed in the Republic of Singapore)
Statements of Portfolio
As at 31 December 2018
Percentage of Percentage of
total net assets total net assets
attributable to attributable to
Holdings at Fair value at unitholders at unitholders at
31 December 31 December 31 December 31 December
2018 2018 2018 2017
S$ % %
First State Regional India Fund(1)
Quoted
Ireland
First State Global Umbrella Fund plc -First State Indian Subcontinent Fund Class I 765,172 105,784,335 99.12 99.02
Portfolio of investments 105,784,335 99.12 99.02Other net assets 940,428 0.88 0.98
Net assets attributable to unitholders 106,724,763 100.00 100.00
First State Singapore Growth Fund(1)
Quoted
Ireland
First State Global Umbrella Fund plc -First State Singapore and Malaysia Growth Fund Class I 536,552 41,582,870 99.34 99.41
Portfolio of investments 41,582,870 99.34 99.41Other net assets 278,323 0.66 0.59
Net assets attributable to unitholders 41,861,193 100.00 100.00
Stewart Investors Global Emerging Markets Leaders Fund(2)
Quoted
Great Britain
First State Investments ICVC - Stewart Investors Global Emerging Markets Leaders Fund Class A 1,146,358 11,097,928 99.15 99.54
Portfolio of investments 11,097,928 99.15 99.54Other net assets 95,194 0.85 0.46
Net assets attributable to unitholders 11,193,122 100.00 100.00
The accompanying notes form an integral part of these financial statements.
89

First State Global Growth Funds
(Constituted under a Trust Deed in the Republic of Singapore)
Statements of Portfolio
As at 31 December 2018
Percentage of Percentage of
total net assets total net assets
attributable to attributable to
Holdings at Fair value at unitholders at unitholders at
31 December 31 December 31 December 31 December
2018 2018 2018 2017
S$ % %
Quoted
Ireland
First State Global Umbrella Fund plc -Stewart Investors Worldwide Leaders Fund Class I 1,491,253 23,801,481 98.89 99.20
Portfolio of investments 23,801,481 98.89 99.20Other net assets 266,824 1.11 0.80
Net assets attributable to unitholders 24,068,305 100.00 100.00
Note: Information on investment portfolio by industry segments is not presented as the sub-funds are invested whollyor substantially into other underlying funds.
(1) These sub-funds are invested wholly or substantially into other underlying funds domiciled in Dublin, Ireland anddenominated in United States dollars ("US dollars").
(2) These sub-funds are invested wholly or substantially into other underlying funds domiciled in England and Walesand denominated in Great British Pounds.
Stewart Investors Worldwide Leaders Fund (1)
The accompanying notes form an integral part of these financial statements.
90

First State Global Growth Funds
(Constituted under a Trust Deed in the Republic of Singapore)
NOTES TO THE FINANCIAL STATEMENTS
For the financial year ended 31 December 2018
1. General
First State Dividend Advantage (“DIVA”)
First State Global Infrastructure (“GIFT”)
Stewart Investors Global Emerging Markets Leaders Fund ("GEML")
First State Regional India Fund (“RIFD”)First State Singapore Growth Fund (“SPGF”)
First State Regional China Fund (“RCFD”)
The investment objectives of the remaining sub-funds have been detailed below:
Sub-Fund: First State Asia Opportunities Fund (AIAT)
The Sub-Funds are established as feeder funds investing directly into corresponding sub-funds (the “UnderlyingSub-Funds”) under the First State Global Umbrella Fund plc (“GUFD”), an umbrella fund domiciled in Dublin,Ireland or under the First State Investments ICVC (“ICVC”), an umbrella fund domiciled in England and Wales.
First State Global Resources (“GRES”) was terminated on 4 December 2018, hence it is not presented in thesefinancial statements.
First State Global Growth Funds (the "Fund") is a Singapore domiciled umbrella fund constituted by a Trust Deeddated 16 April 1998 between First State Investments (Singapore) (the "Manager") and HSBC Institutional TrustServices (Singapore) Limited (the "Trustee"). The Trust Deed and all supplemental deeds are governed by thelaws of the Republic of Singapore.
The financial statements of the Fund for the year ended 31 December 2018 comprise the following sub-funds,(collectively referred to as the "Sub-Funds"):
First State Asian Quality Bond (“QBON”)
These notes form an integral part of and should be read in conjunction with the accompanying financial statements.
GUFD is an open-ended investment company incorporated under the laws of the Republic of Ireland andstructured as an umbrella fund. GUFD is managed by First State Investments (Hong Kong) Limited ("First StateHK"), a related corporation of the Manager and incorporated in Hong Kong.
Stewart Investors Worldwide Leaders Fund ("G100")
First State Asia Opportunities Fund (“AIAT”)First State Asian Growth Fund (“APGF”)
First State Bridge (“BRDG”)
First State Global Property Investments (“GLPR”)
First State Global Balanced Fund (“GBFD”)
Launch date: 18 October 1999
Underlying Fund(s): GUFD – First State Asia Opportunities Fund
The investment objective of the First State Asia Opportunities Fund is to achieve long term capital appreciation.
Investment objectives
ICVC is an open-ended investment company incorporated under the laws of England and Wales and structuredas an umbrella fund. ICVC is managed by First State Investments Management (UK) Limited ("First State UK"), arelated corporation of the Manager and incorporated in the United Kingdom.
91

First State Global Growth Funds
(Constituted under a Trust Deed in the Republic of Singapore)
NOTES TO THE FINANCIAL STATEMENTS
For the financial year ended 31 December 2018
1. General (continued)
The Underlying Sub-Fund invests primarily (at least 70% of its net asset value) in equity and equity relatedsecurities (such as preference shares, rights issues and warrants) of companies that are listed, or have theirregistered offices in, or conduct a majority of their economic activity in the Asia region (excluding Australia, NewZealand and Japan).
The Underlying Sub-Fund is not subject to any limitation on the portion of its net asset value that may be investedin any one or more emerging markets in the Asian region (excluding Australia, New Zealand and Japan), anysector or any limitation on the market capitalisation of the companies in which it may invest.
Although the Underlying Sub-Fund has a regional investment universe, the securities selected for investmentbased on the approach of the investment manager of the Underlying Sub-Fund may at times result in a portfoliothat is concentrated in certain countries.
Investment objectives (continued)
The Underlying Sub-Fund’s maximum exposure to China A Shares (directly via the Stock Connects and/orindirectly through equity linked or participation notes) and China B Shares (through direct investment) inaggregate will not exceed 25% of the Underlying Sub-Fund’s net asset value.
The Underlying Sub-Fund may employ a portion of its assets in futures contracts, options, swaps (including creditdefault swaps), forward currency transactions and securities lending transactions for the purposes of efficientportfolio management and to hedge against exchange rate risk under the conditions and limitations as laid downby the Central Bank of Ireland. It is not intended that the Underlying Sub-Fund will avail of the opportunity toinvest in Foreign Direct Investments ("FDIs") for investment purposes.
The Underlying Sub-Fund invests primarily in equity and equity related securities (including warrants, preferenceshares, rights issues, convertible bonds, depository receipts such as American Depository Receipt ("ADR") andGlobal Depository Receipt ("GDR"), equity linked or participation notes etc.) that are listed, traded or dealt inregulated markets provided the Underlying Sub-Fund may not invest more than 15% in aggregate of its net assetvalue in warrants or equity linked or participation notes. The Underlying Sub-Fund may invest up to 10% of its netasset value in transferable securities that are not listed, traded or dealt in regulated markets and up to 5% of itsnet asset value in open ended collective investment schemes (including exchange traded funds).
The Underlying Sub-Fund may invest cash balances in short-term securities listed, traded or dealt in on aregulated market. The short-term securities in which the Underlying Sub-Fund may invest will include securitiessuch as commercial paper, certificates of deposit, treasury bills, and bankers' acceptances all rated aboveinvestment grade or in the opinion of the investment manager of the Underlying Sub-Fund to be of comparablequality. For defensive purposes during periods of perceived 75 uncertainty and volatility (e.g. market crash ormajor financial crisis), the Underlying Sub-Fund may also hold all or part of its assets in fixed or floating ratecorporate and/or government debt securities, asset-backed and mortgage-backed securities which must be ratedat least investment grade or in the opinion of the investment manager of the Underlying Sub-Fund to be ofcomparable quality and which are listed, traded or dealt in on a regulated market.
92

First State Global Growth Funds
(Constituted under a Trust Deed in the Republic of Singapore)
NOTES TO THE FINANCIAL STATEMENTS
For the financial year ended 31 December 2018
1. General (continued)
The investment objective of the First State Asian Growth Fund is to achieve long term capital appreciation.
Launch date: 17 September 1984
Underlying Fund(s): GUFD – First State Asian Growth Fund
Sub-Fund: First State Asian Growth Fund (APGF)
The Underlying Sub-Fund invests primarily (at least 70% of its net asset value) in equity securities of companiesthat are listed, or have their registered offices in, or conduct a majority of their economic activity in Asia (excluding Japan).
The Underlying Sub-Fund is not subject to any limitation on the portion of its net asset value that may be investedin any one or more emerging markets in Asia (excluding Japan), any sector, or any limitation on the marketcapitalisation of the companies in which it may invest.
Although the Underlying Sub-Fund has a regional investment universe, the securities selected for investmentbased on the approach of the investment manager of the Underlying Sub-Fund may at times result in a portfoliothat is concentrated in certain countries.
The Underlying Sub-Fund’s maximum exposure to China A Shares (directly via the Stock Connects and/orindirectly through equity linked or participation notes and collective investment schemes) and China B Shares(through direct investment) in aggregate will not exceed 25% of the Underlying SubFund’s net asset value.
The Underlying Sub-Fund may also employ a portion of its assets in futures contracts, options, swaps (includingcredit default swaps), forward currency transactions and securities lending transactions for the purposes ofefficient portfolio management and to hedge against exchange rate risk under the conditions and limitations aslaid down by the Central Bank of Ireland. It is not intended that the Underlying Sub-Fund will avail of theopportunity to invest in FDIs for investment purposes.
The Underlying Sub-Fund invests primarily in equity and equity related securities (including warrants, preferenceshares, rights issues, convertible bonds, depository receipts such as ADR and GDR, equity linked or participationnotes etc.) that are listed, traded or dealt in regulated markets provided the Underlying Sub-Fund may not investmore than 15% in aggregate of its net asset value in warrants or equity linked or participation notes. TheUnderlying Sub-Fund may invest up to 10% of its net asset value in transferable securities that are not listed,traded or dealt in regulated markets and up to 5% of its net asset value in open ended collective investmentschemes (including exchange traded funds).
The Underlying Sub-Fund may invest cash balances in short-term securities listed, traded or dealt in on aregulated market. The short-term securities in which the Underlying Sub-Fund may invest will include securitiessuch as commercial paper, certificates of deposit, treasury bills, and bankers' acceptances all rated aboveinvestment grade or in the opinion of the sub-manager of the Underlying Sub-Fund to be of comparable quality.For defensive purposes during periods of perceived uncertainty and volatility (e.g. market crash or major financialcrisis), the Underlying Sub-Fund may also hold all or part of its assets in fixed or floating rate corporate and/orgovernment debt securities, asset-backed and mortgage-backed securities which must be rated at leastinvestment grade or in the opinion of the sub-manager of the Underlying Sub-Fund to be of comparable qualityand which are listed, traded or dealt in on a regulated market.
Investment objectives
93

First State Global Growth Funds
(Constituted under a Trust Deed in the Republic of Singapore)
NOTES TO THE FINANCIAL STATEMENTS
For the financial year ended 31 December 2018
1. General (continued)
The investment objective of the First State Asian Quality Bond is to achieve long term returns through investmentin a diversified portfolio of investment grade fixed income and similar transferable instruments issued primarily bygovernment and corporate entities in Asia.
The Underlying Sub-Fund invests primarily (at least 70% of its net asset value) in debt securities of governmentsor quasi-government organization issuers in Asia and/or issuers organised, headquartered or having their primary business operations in Asia. The Underlying Sub-Fund invests at least 70% of its net asset value in investmentgrade debt securities and convertible securities (rated as Baa3 or above by Moody’s Investor Services Inc or BBB-or above by Standard & Poor’s Corporation or other recognised rating agencies) or if unrated, of comparablequality as determined by the investment manager of the Underlying Sub-Fund.
The Underlying Sub-Fund is not subject to any limitation on the portion of its net asset value that may be investedin debt securities in any one or more emerging markets in Asia, or any sector. In respect of the Underlying Sub-Fund’s exposure to PRC, investment in onshore People's Republic of China ("PRC") debt securities and offshoredebt securities denominated in Chinese Renminbi ("RMB") (including Dim Sum bonds) will be less than 30% ofthe Underlying Sub-Fund’s net asset value respectively.
The debt securities in which the Underlying Sub-Fund invests are mainly denominated in US dollars or othermajor currencies.
Although the Underlying Sub-Fund has a regional investment universe, the securities selected for investmentbased on the approach of the investment manager of the Underlying Sub-Fund may at times result in a portfoliothat is concentrated in certain countries.
The Underlying Sub-Fund will not invest more than 10% of its net asset value in debt securities issued by and/orguaranteed by a single sovereign issuer which is below investment grade.
The Underlying Sub-Fund may employ a portion of its assets in futures contracts, options, swaps (including creditdefault swaps), forward currency transactions and securities lending transactions for the purposes of efficientportfolio management and to hedge against exchange rate risk under the conditions and limitations as laid downby the Central Bank of Ireland. It is not intended that the Underlying Sub-Fund will avail of the opportunity toinvest in FDIs for investment purposes.
The securities in which the Underlying Sub-Fund invests include but are not limited to convertible, exchangeableand non-exchangeable and non-convertible debt securities, fixed and floating rate bonds, zero coupon anddiscount bonds, transferable notes, mortgaged-backed and asset-backed securities, commercial paper,certificates of deposits of variable and fixed interest rates listed, traded or dealt in regulated markets.
Sub-Fund: First State Asian Quality Bond (QBON)
Launch date: 1 November 2016
Underlying Fund(s): GUFD – First State Asian Quality Bond Fund
Investment objectives
94

First State Global Growth Funds
(Constituted under a Trust Deed in the Republic of Singapore)
NOTES TO THE FINANCIAL STATEMENTS
For the financial year ended 31 December 2018
1. General (continued)
The investment objective of the First State Bridge is to provide investors with income and medium term capitalstability from investments focused in the Asia Pacific ex-Japan region.
The Underlying Sub-Fund invests primarily (at least 70% of its net asset value) in debt securities of governmentsor quasi-government organisation issuers in Asia and/or issuers organised, headquartered or having theirprimary business operations in Asia. The Underlying Sub-Fund invests at least 70% of its net asset value ininvestment grade debt securities and convertible securities (rated as Baa3 or above by Moody’s or BBB- orabove by S&P or other recognised rating agencies) or if unrated, of comparable quality as determined by theinvestment manager of the Underlying Sub-Fund.
Investment objectives
The Underlying Sub-Fund is not subject to any limitation on the portion of its net asset value that may be investedin debt securities in any one or more emerging markets in Asia, or any sector. In respect of the Underlying Sub-Fund’s exposure to PRC, investment in onshore PRC debt securities and offshore debt securities denominated inRMB (including Dim Sum bonds) will be less than 30% of the Underlying Sub-Fund’s net asset value respectively.
The debt securities in which the Underlying Sub-Fund invests are mainly denominated in US dollars or othermajor currencies.
Although the Underlying Sub-Fund has a regional investment universe, the securities selected for investmentbased on the approach of the investment manager of the Underlying Sub-Fund may at times result in a portfoliothat is concentrated in certain countries.
The Underlying Sub-Fund will not invest more than 10% of its net asset value in debt securities issued by and/orguaranteed by a single sovereign issuer which is below investment grade.
The Underlying Sub-Fund may employ a portion of its assets in futures contracts, options, swaps (including creditdefault swaps), forward currency transactions and securities lending transactions for the purposes of efficientportfolio management and to hedge against exchange rate risk under the conditions and limitations as laid downby the Central Bank of Ireland. It is not intended that the Underlying Sub-Fund will avail of the opportunity toinvest in FDIs for investment purposes.
The securities in which the Underlying Sub-Fund invests include but are not limited to convertible, exchangeableand non-exchangeable and non-convertible debt securities, fixed and floating rate bonds, zero coupon anddiscount bonds, transferable notes, mortgaged backed and asset-backed securities, commercial paper,certificates of deposits of variable and fixed interest rates listed, traded or dealt in regulated markets.
Underlying Fund(s): Fixed income portion - GUFD – First State Asian Quality Bond Fund
Sub-Fund: First State Bridge (BRDG)
Launch date: 2 June 2003
95

First State Global Growth Funds
(Constituted under a Trust Deed in the Republic of Singapore)
NOTES TO THE FINANCIAL STATEMENTS
For the financial year ended 31 December 2018
1. General (continued)
The Underlying Sub-Fund invests primarily in equity and equity related securities (including warrants, preferenceshares, rights issues, convertible bonds, depository receipts such as ADR and GDR, equity linked or participationnotes etc.) that are listed, traded or dealt in regulated markets provided the Underlying Sub-Fund may not investmore than 15% in aggregate of its net asset value in warrants or equity linked or participation notes. TheUnderlying Sub-Fund may invest up to 10% of its net asset value in transferable securities that are not listed,traded or dealt in regulated markets and up to 5% of its net asset value in open ended collective investmentschemes (including exchange traded funds).
Underlying Fund(s): Equity portion GUFD – First State Asian Equity Plus Fund
Investment objectives
The Underlying Sub-Fund invests primarily (at least 70% of its net asset value) in equity securities of companiesthat are listed, or have their registered offices in, or conduct a majority of their economic activity in the AsiaPacific region (excluding Japan). Such companies will be selected on the basis of their potential dividend growthand long term capital appreciation.
The investment manager of the Underlying Sub-Fund will select investments which it believes offer the potentialfor dividend growth and price appreciation.
The Underlying Sub-Fund is not subject to any limitation on the portion of its net asset value that may be investedin any one or more emerging markets in the Asia Pacific region (excluding Japan), any sector or any limitation onthe market capitalisation of the companies in which it may invest.
Although the Underlying Sub-Fund has a regional investment universe, the securities selected for investmentbased on the approach of the investment manager of the Underlying Sub-Fund may at times result in a portfoliothat is concentrated in certain countries.
The Underlying Sub-Fund’s maximum exposure to China A Shares (whether directly through the QFII quota,directly via the Stock Connects or indirectly through equity linked or participation notes and collective investmentschemes) and China B Shares (through direct investment) in aggregate will not exceed 25% of the UnderlyingSub-Fund’s net asset value.
Direct investment in China A Shares through the QFII quota is limited to 10% of the Underlying Sub-Fund’s netasset value.
The Underlying Sub-Fund may employ a portion of its assets in futures contracts, options, swaps (including creditdefault swaps), forward currency transactions and securities lending transactions for the purposes of efficientportfolio management and to hedge against exchange rate risk under the conditions and limitations as laid downby the Central Bank of Ireland. It is not intended that the Underlying Sub-Fund will avail of the opportunity toinvest in FDIs for investment purposes.
96

First State Global Growth Funds
(Constituted under a Trust Deed in the Republic of Singapore)
NOTES TO THE FINANCIAL STATEMENTS
For the financial year ended 31 December 2018
1. General (continued)
The Underlying Sub-Fund may invest cash balances in short-term securities listed, traded or dealt in on aregulated market. The short-term securities in which the Underlying Sub-Fund may invest will include securitiessuch as commercial paper, certificates of deposit, treasury bills, and bankers' acceptances all rated aboveinvestment grade or in the opinion of the investment manager of the Underlying Sub-Fund to be of comparablequality. For defensive purposes during periods of perceived uncertainty and volatility (e.g. market crash or majorfinancial crisis), the Underlying Sub-Fund may also hold all or part of its assets in fixed or floating rate corporateand/or government debt securities, asset-backed and mortgage-backed securities which must be rated at leastinvestment grade or in the opinion of the investment manager of the Underlying Sub-Fund to be of comparablequality and which are listed, traded or dealt in on a regulated market.
Investment objectives (continued)
Underlying Fund(s): GUFD – First State Asian Equity Plus Fund
Investment objectives
Sub-Fund: First State Dividend Advantage (DIVA)
Launch date: 16 November 2004
The investment objective of the First State Dividend Advantage is to provide investors with regular distributionsand long-term growth from high dividend yielding equity investments focused in the Asia Pacific region (excludingJapan).
The Underlying Sub-Fund invests primarily (at least 70% of its net asset value) in equity securities of companiesthat are listed, or have their registered offices in, or conduct a majority of their economic activity in the AsiaPacific region (excluding Japan). Such companies will be selected on the basis of their potential dividend growthand long-term capital appreciation.
The investment manager of the Underlying Sub-Fund will select investments which it believes offer the potentialfor dividend growth and price appreciation.
The Underlying Sub-Fund is not subject to any limitation on the portion of its net asset value that may be investedin any one or more emerging markets in the Asia Pacific region (excluding Japan), any sector or any limitation onthe market capitalisation of the companies in which it may invest.
Although the Underlying Sub-Fund has a regional investment universe, the securities selected for investmentbased on the approach of the investment manager of the Underlying Sub-Fund may at times result in a portfoliothat is concentrated in certain countries.
The Underlying Sub-Fund’s maximum exposure to China A Shares (whether directly through the QFII quota,directly via the Stock Connects or indirectly through equity linked or participation notes and collective investmentschemes) and China B Shares (through direct investment) in aggregate will not exceed 25% of the UnderlyingSub-Fund’s net asset value.
Direct investment in China A Shares through the QFII quota is limited to 10% of the Underlying SubFund’s netasset value.
97

First State Global Growth Funds
(Constituted under a Trust Deed in the Republic of Singapore)
NOTES TO THE FINANCIAL STATEMENTS
For the financial year ended 31 December 2018
1. General (continued)
The Underlying Sub-Fund may employ a portion of its assets in futures contracts, options, swaps (including creditdefault swaps), forward currency transactions and securities lending transactions for the purposes of efficientportfolio management and to hedge against exchange rate risk under the conditions and limitations as laid downby the Central Bank of Ireland. It is not intended that the Underlying Sub-Fund will avail of the opportunity toinvest in FDIs for investment purposes.
Underlying Fund(s): Fixed income portion - GUFD – First State Global Bond Fund
Investment objectives (continued)
The Underlying Sub-Fund invests primarily in equity and equity related securities (including warrants, preferenceshares, rights issues, convertible bonds, depository receipts such as ADR and GDR, equity linked or participationnotes etc.) that are listed, traded or dealt in regulated markets provided the Underlying Sub-Fund may not investmore than 15% in aggregate of its net asset value in warrants or equity linked or participation notes. TheUnderlying Sub-Fund may invest up to 10% of its net asset value in transferable securities that are not listed,traded or dealt in regulated markets and up to 5% of its net asset value in open ended collective investmentschemes (including exchange traded funds).
The Underlying Sub-Fund may invest cash balances in short-term securities listed, traded or dealt in on aregulated market. The short-term securities in which the Underlying Sub-Fund may invest will include securitiessuch as commercial paper, certificates of deposit, treasury bills, and bankers' acceptances all rated aboveinvestment grade or in the opinion of the investment manager of the Underlying Sub-Fund to be of comparablequality. For defensive purposes during periods of perceived uncertainty and volatility (e.g. market crash or majorfinancial crisis), the Underlying Sub-Fund may also hold all or part of its assets in fixed or floating rate corporateand/or government debt securities, asset-backed and mortgage-backed securities which must be rated at leastinvestment grade or in the opinion of the investment manager of the Underlying Sub-Fund to be of comparablequality and which are listed, traded or dealt in on a regulated market.
Investment objectives
The investment objective of the First State Global Balanced Fund is to achieve a balance of long term capitalappreciation and current income.
Investment policy
The Underlying Sub-Fund invests primarily (at least 70% of its net asset value) in debt securities of governmentsor quasi-government organisation issuers and/or issuers organised, headquartered or having their primarybusiness operations in the countries included in the World Government Bond Index ("WGBI"), although in theevent of unusual market conditions, investments in countries not included in the WGBI index may be includedand may constitute up to 50% of the net asset value of the Underlying Sub-Fund.
No more than 10% of the Underlying Sub-Fund’s net asset value will be invested in any country outside of theUnited States, the European Union, the United Kingdom, Switzerland, Australia, Canada, New Zealand, Japan orNorway and less than 30% of the Underlying Sub-Fund’s net asset value in aggregate will be invested outsidethese countries. The Underlying Sub-Fund will hold securities of issuers from at least three countries.
Sub-Fund: First State Global Balanced Fund (GBFD)
Launch date: 6 February 1995
98

First State Global Growth Funds
(Constituted under a Trust Deed in the Republic of Singapore)
NOTES TO THE FINANCIAL STATEMENTS
For the financial year ended 31 December 2018
1. General (continued)
Investment objectives (continued)
Underlying Fund(s): Equity portion- GUFD –Stewart Investors Worldwide Leaders Fund
Investment objectives
The Underlying Sub-Fund will normally invest at least 70% of its net asset value in investment grade debtsecurities (rated as Baa3 or above by Moody’s or BBB- or above by S&P or other recognised rating agencies), or,if unrated, of comparable quality as determined by the investment manager of the Underlying Sub-Fund. TheUnderlying Sub-Fund is not constrained as to the maximum maturity of its portfolio securities.
The Underlying Sub-Fund may hold less than 30% of its net asset value in debt securities rated below investmentgrade or if unrated, of comparable quality as determined by the investment manager of the Underlying Sub-Fund.
The Underlying Sub-Fund is not subject to any limitation on the portion of its Net Asset Value that may beinvested in debt securities in any sector.
Although the Underlying Sub-Fund has a global investment universe, the securities selected for investmentbased on the approach of the investment manager of the Underlying Sub-Fund may at times result in a portfoliothat is concentrated in certain geographical area(s).
The Underlying Sub-Fund will not invest more than 10% of its net asset value in debt securities issued by and/orguaranteed by a single sovereign issuer which is below investment grade.
The Underlying Sub-Fund may employ a portion of its assets in futures contracts, options, swaps (including creditdefault swaps), forward currency transactions and securities lending transactions for the purposes of efficientportfolio management and to hedge against exchange rate risk under the conditions and limitations as laid downby the Central Bank of Ireland. It is not intended that the Underlying Sub-Fund will avail of the opportunity toinvest in FDIs for investment purposes.
The securities in which the Underlying Sub-Fund invests include but are not limited to convertible, exchangeableand non-exchangeable and non-convertible debt securities, fixed and floating rate bonds, zero coupon anddiscount bonds, transferable notes, mortgaged-backed and asset-backed securities, commercial paper,certificates of deposits of variable and fixed interest rates listed, traded or dealt in regulated markets.
The Underlying Sub-Fund invests primarily (at least 70% of its net asset value) in a diverse portfolio of equitysecurities of larger capitalisation companies which are listed, traded or dealt in on any of the regulated marketsworldwide. Larger capitalisation companies are currently defined for the purposes of this policy as companieswith a minimum investible market cap (free float) of US$3 billion at the time of investment. The investmentmanager of the Underlying Sub-Fund may review this definition as considered appropriate.
In relation to the term Leaders, this indicates the Underlying Sub-Fund will not invest in securities of smallcapitalisation companies. Small capitalisation companies are currently defined for the purposes of this policy ascompanies with a minimum investible market cap (free float) of less than US$1 billion at the time of investment.The investment manager / sub-manager for the Underlying Sub-Fund gives particular consideration to investmentin companies that are positioned to benefit from, and contribute to, the sustainable development of the countriesin which they operate.
99

First State Global Growth Funds
(Constituted under a Trust Deed in the Republic of Singapore)
NOTES TO THE FINANCIAL STATEMENTS
For the financial year ended 31 December 2018
1. General (continued)
Investment objectives (continued)
Although the Underlying Sub-Fund has a global investment universe, the securities selected for investmentbased on the approach of the investment manager of the Underlying Sub-Fund may at times result in a portfoliothat is concentrated in certain geographical area(s).
The Underlying Sub-Fund’s maximum exposure to China A Shares (directly via the Stock Connects and/orindirectly through equity linked or participation notes and collective investment schemes) and China B Shares(through direct investment) in aggregate will not exceed 25% of the Underlying Sub Fund’s Net Asset Value.
The Underlying Sub-Fund may employ a portion of its assets in futures contracts, options, swaps (including creditdefault swaps), forward currency transactions and securities lending transactions for the purposes of efficientportfolio management and to hedge against exchange rate risk under the conditions and limitations as laid downby the Central Bank of Ireland. It is not intended that the Underlying Sub-Fund will avail of the opportunity toinvest in FDIs for investment purposes.
The Underlying Sub-Fund invests primarily in equity and equity related securities (including warrants, preferenceshares, rights issues, convertible bonds, depository receipts such as ADR and GDR, equity linked or participationnotes etc.) that are listed, traded or dealt in regulated markets provided the Underlying Sub-Fund may not investmore than 15% in aggregate of its net asset value in warrants or equity linked or participation notes. TheUnderlying Sub-Fund may invest up to 10% of its net asset value in transferable securities that are not listed,traded or dealt in regulated markets and up to 5% of its net asset value in open ended collective investmentschemes (including exchange traded funds).
The Underlying Sub-Fund may invest cash balances in short-term securities listed, traded or dealt in on aregulated market. The short-term securities in which the Underlying Sub-Fund may invest will include securitiessuch as commercial paper, certificates of deposit, treasury bills, and bankers' acceptances all rated aboveinvestment grade or in the opinion of the investment manager of the Underlying Sub-Fund to be of comparablequality. For defensive purposes during periods of perceived uncertainty and volatility (e.g. market crash or majorfinancial crisis), the Underlying Sub-Fund may also hold all or part of its assets in fixed or floating rate corporateand/or government debt securities, asset-backed and mortgage-backed securities which must be rated at leastinvestment grade or in the opinion of the investment manager of the Underlying Sub-Fund to be of comparablequality and which are listed, traded or dealt in on a regulated market.
The Underlying Sub-Fund is not managed to a benchmark.
The Underlying Sub-Fund is not subject to any limitation on the portion of its net asset value that may be investedin any one or more emerging markets or any sector.
100

First State Global Growth Funds
(Constituted under a Trust Deed in the Republic of Singapore)
NOTES TO THE FINANCIAL STATEMENTS
For the financial year ended 31 December 2018
1. General (continued)
Sub-Fund: First State Global Infrastructure (GIFT)
The investment objective of the First State Global Property Investments is to maximize the total return toinvestors.
The Underlying Sub-Fund invests primarily (at least 70% of its net asset value) in a broad selection of equitysecurities issued by real estate investment trusts or companies that own, develop or manage real property fromaround the world (including initially the EEA, Russia, Switzerland, United States, and the Asian region) and whichare listed, traded or dealt in on regulated markets worldwide.
The Underlying Sub-Fund is not subject to any limitation on the portion of its net asset value that may be investedin any one or more emerging markets or any limitation on the market capitalisation of the companies in which itmay invest.
Although the Underlying Sub-Fund has a global investment universe, the securities selected for investmentbased on the approach of the investment manager of the Underlying Sub-Fund may at times result in a portfoliothat is concentrated in certain geographical area(s).
The Underlying Sub-Fund may employ a portion of its assets in futures contracts, options, swaps (including creditdefault swaps), forward currency transactions and securities lending transactions for the purposes of efficientportfolio management and to hedge against exchange rate risk under the conditions and limitations as laid downby the Central Bank of Ireland. It is not intended that the Underlying Sub-Fund will avail of the opportunity toinvest in FDIs for investment purposes.
Sub-Fund: First State Global Property Investments (GLPR)
Launch date: 21 February 2005
Underlying Fund(s): ICVC – First State Global Listed Infrastructure Fund
Investment objectives
The investment objective of the First State Global Infrastructure is to achieve total investment return consistentwith income and long term capital growth.
The Underlying Sub-Fund invests in a diversified portfolio of listed infrastructure and infrastructure relatedsecurities from around the world. The Underlying Sub-Fund will at all times be invested in accordance with itsinvestment policy and therefore at least two thirds of the Underlying Sub-Fund's total assets will at all times beinvested in listed infrastructure securities or infrastructure related securities from around the world.
The Underlying Sub-Fund may invest up to 5% of its net assets in warrants. The Underlying Sub-Fund mayemploy a portion of its assets in futures contracts, options and forward currency transactions and securitieslending transactions for the purposes of efficient portfolio management.
Launch date: 16 January 2008
Investment objectives
Underlying Fund(s): GUFD- First State Global Property Securities Fund
101

First State Global Growth Funds
(Constituted under a Trust Deed in the Republic of Singapore)
NOTES TO THE FINANCIAL STATEMENTS
For the financial year ended 31 December 2018
1. General (continued)
The investment objective of the First State Regional China Fund is to achieve long term capital appreciation.
The Underlying Sub-Fund invests primarily (at least 70% of its net asset value) in equity securities issued bycompanies with either assets in, or revenues derived from, the People’s Republic of China, Hong Kong, andTaiwan and which are listed, traded or dealt in on regulated markets in the People’s Republic of China, HongKong, Taiwan, the U.S., Singapore, Korea, Thailand and Malaysia or in a member state of the OECD.
The Underlying Sub-Fund is not subject to any limitation on the portion of its net asset value that may be investedin any sector or any limitation on the market capitalisation of the companies in which it may invest.
Although the Underlying Sub-Fund has a regional investment universe, the securities selected for investmentbased on the approach of the investment manager of the Underlying Sub-Fund may at times result in a portfoliothat is concentrated in certain countries.
The Underlying Sub-Fund’s maximum exposure to China A Shares (whether directly through the QFII quota,directly through the RQFII quota, directly via the Stock Connects or indirectly through equity linked or participationnotes and collective investment schemes) and China B Shares (through direct investment) in aggregate will notexceed 25% of the Underlying Sub-Fund’s net asset value.
Direct investment in China A Shares through the QFII quota is limited to 10% of the Underlying Sub Fund’s netasset value.
Sub-Fund: First State Regional China Fund (RCFD)
Investment objectives
The Underlying Sub-Fund invests primarily in equity and equity related securities (including warrants, preferenceshares, rights issues, convertible bonds, depository receipts such as ADR and GDR, equity linked or participationnotes etc.) that are listed, traded or dealt in regulated markets provided the Underlying Sub-Fund may not investmore than 15% in aggregate of its net asset value in warrants or equity linked or participation notes. TheUnderlying Sub-Fund may invest up to 10% of its net asset value in transferable securities that are not listed,traded or dealt in regulated markets and up to 5% of its net asset value in open ended collective investmentschemes (including exchange traded funds).
The Underlying Sub-Fund may invest cash balances in short-term securities listed, traded or dealt in on aregulated market. The short-term securities in which the Underlying Sub-Fund may invest will include securitiessuch as commercial paper, certificates of deposit, treasury bills, and bankers' acceptances all rated aboveinvestment grade or in the opinion of the investment manager of the Underlying Sub-Fund to be of comparablequality. For defensive purposes during periods of perceived uncertainty and volatility (e.g. market crash or majorfinancial crisis), the Underlying Sub-Fund may also hold all or part of its assets in fixed or floating rate corporateand/or government debt securities, asset-backed and mortgage-backed securities which must be rated at leastinvestment grade or in the opinion of the investment manager of the Underlying Sub-Fund to be of comparablequality and which are listed, traded or dealt in on a regulated market.
Investment objectives (continued)
Launch date: 27 September 1993
Underlying Fund(s): GUFD – First State Greater China Growth Fund
102

First State Global Growth Funds
(Constituted under a Trust Deed in the Republic of Singapore)
NOTES TO THE FINANCIAL STATEMENTS
For the financial year ended 31 December 2018
1. General (continued)
The investment objective of the First State Regional India Fund is to achieve long term capital appreciation.
The Underlying Sub-Fund invests primarily (at least 70% of its net asset value) in a diversified portfolio of equitysecurities issued by companies of the Indian subcontinent. Countries of the Indian subcontinent include India,Pakistan, Sri Lanka and Bangladesh. The Underlying Sub-Fund concentrates on securities that are listed, tradedor dealt in on regulated markets in the Indian subcontinent and offshore instruments issued by companiesestablished or operating or have significant interests in the Indian subcontinent and listed on other regulatedmarkets.
The Underlying Sub-Fund is not subject to any limitation on the portion of its net asset value that may be investedin any one or more emerging markets of the Indian subcontinent, any sector, or any limitation on the marketcapitalisation of the companies in which it may invest.
Although the Underlying Sub-Fund has a regional investment universe, the securities selected for investmentbased on the approach of the investment manager of the Underlying Sub-Fund may at times result in a portfoliothat is concentrated in certain countries.
Investment objectives (continued)
Underlying Fund(s): GUFD – First State Indian Subcontinent Fund
Sub-Fund: First State Regional India Fund (RIFD)
The Underlying Sub-Fund may employ a portion of its assets in futures contracts, options, swaps (including creditdefault swaps), forward currency transactions and securities lending transactions for the purposes of efficientportfolio management and to hedge against exchange rate risk under the conditions and limitations as laid downby the Central Bank of Ireland. It is not intended that the Underlying Sub-Fund will avail of the opportunity toinvest in FDIs for investment purposes.
The Underlying Sub-Fund invests primarily in equity and equity related securities (including warrants, preferenceshares, rights issues, convertible bonds, depository receipts such as ADR and GDR, equity linked or participationnotes etc.) that are listed, traded or dealt in regulated markets provided the Underlying Sub-Fund may not investmore than 15% in aggregate of its net asset value in warrants or equity linked or participation notes. TheUnderlying Sub-Fund may invest up to 10% of its net asset value in transferable securities that are not listed,traded or dealt in regulated markets and up to 5% of its net asset value in open ended collective investmentschemes (including exchange traded funds).
The Underlying Sub-Fund may invest cash balances in short-term securities listed, traded or dealt in on aregulated market. The short-term securities in which the Underlying Sub-Fund may invest will include securitiessuch as commercial paper, certificates of deposit, treasury bills, and bankers' acceptances all rated aboveinvestment grade or in the opinion of the investment manager of the Underlying Sub-Fund to be of comparablequality. For defensive purposes during periods of perceived uncertainty and volatility (e.g. market crash or majorfinancial crisis), the Underlying Sub-Fund may also hold all or part of its assets in fixed or floating rate corporateand/or government debt securities, asset-backed and mortgage-backed securities which must be rated at leastinvestment grade or in the opinion of the investment manager of the Underlying Sub-Fund to be of comparablequality and which are listed, traded or dealt in on a regulated market.
Launch date: 18 July 1994
Investment objectives
103
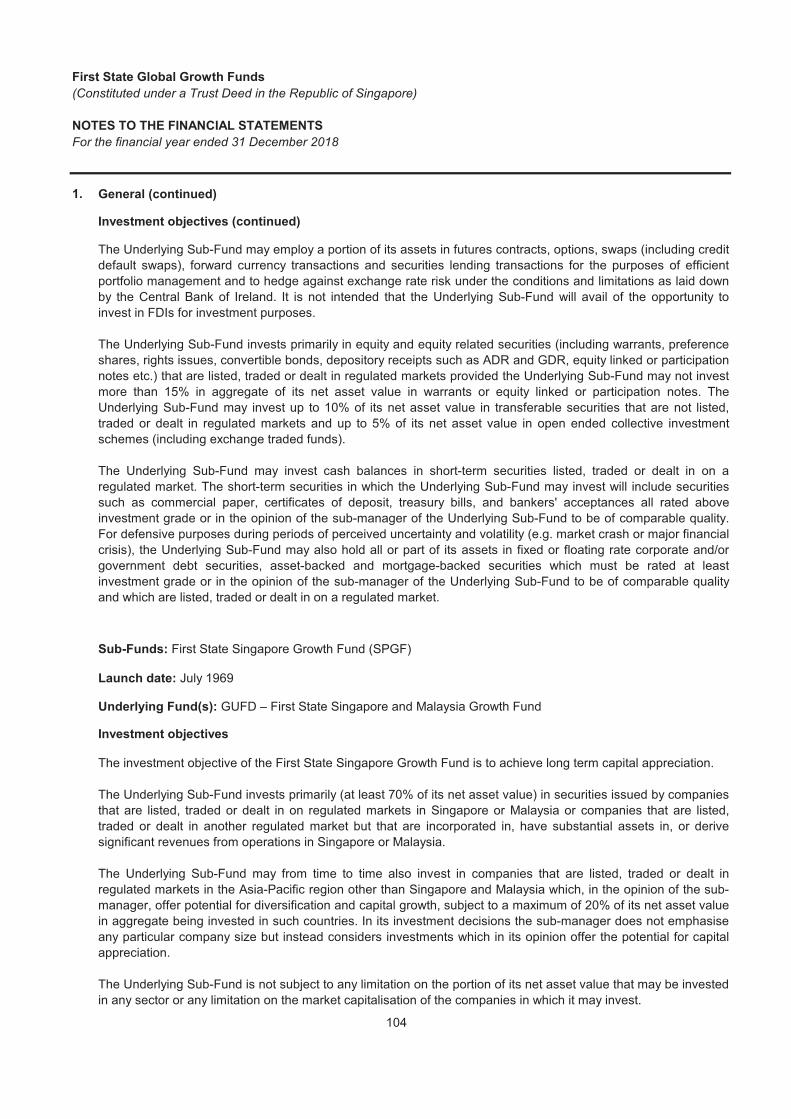
First State Global Growth Funds
(Constituted under a Trust Deed in the Republic of Singapore)
NOTES TO THE FINANCIAL STATEMENTS
For the financial year ended 31 December 2018
1. General (continued)
Investment objectives
Investment objectives (continued)
The investment objective of the First State Singapore Growth Fund is to achieve long term capital appreciation.
The Underlying Sub-Fund invests primarily (at least 70% of its net asset value) in securities issued by companiesthat are listed, traded or dealt in on regulated markets in Singapore or Malaysia or companies that are listed,traded or dealt in another regulated market but that are incorporated in, have substantial assets in, or derivesignificant revenues from operations in Singapore or Malaysia.
The Underlying Sub-Fund may from time to time also invest in companies that are listed, traded or dealt inregulated markets in the Asia-Pacific region other than Singapore and Malaysia which, in the opinion of the sub-manager, offer potential for diversification and capital growth, subject to a maximum of 20% of its net asset valuein aggregate being invested in such countries. In its investment decisions the sub-manager does not emphasiseany particular company size but instead considers investments which in its opinion offer the potential for capitalappreciation.
The Underlying Sub-Fund is not subject to any limitation on the portion of its net asset value that may be investedin any sector or any limitation on the market capitalisation of the companies in which it may invest.
Sub-Funds: First State Singapore Growth Fund (SPGF)
Launch date: July 1969
Underlying Fund(s): GUFD – First State Singapore and Malaysia Growth Fund
The Underlying Sub-Fund may employ a portion of its assets in futures contracts, options, swaps (including creditdefault swaps), forward currency transactions and securities lending transactions for the purposes of efficientportfolio management and to hedge against exchange rate risk under the conditions and limitations as laid downby the Central Bank of Ireland. It is not intended that the Underlying Sub-Fund will avail of the opportunity toinvest in FDIs for investment purposes.
The Underlying Sub-Fund invests primarily in equity and equity related securities (including warrants, preferenceshares, rights issues, convertible bonds, depository receipts such as ADR and GDR, equity linked or participationnotes etc.) that are listed, traded or dealt in regulated markets provided the Underlying Sub-Fund may not investmore than 15% in aggregate of its net asset value in warrants or equity linked or participation notes. TheUnderlying Sub-Fund may invest up to 10% of its net asset value in transferable securities that are not listed,traded or dealt in regulated markets and up to 5% of its net asset value in open ended collective investmentschemes (including exchange traded funds).
The Underlying Sub-Fund may invest cash balances in short-term securities listed, traded or dealt in on aregulated market. The short-term securities in which the Underlying Sub-Fund may invest will include securitiessuch as commercial paper, certificates of deposit, treasury bills, and bankers' acceptances all rated aboveinvestment grade or in the opinion of the sub-manager of the Underlying Sub-Fund to be of comparable quality.For defensive purposes during periods of perceived uncertainty and volatility (e.g. market crash or major financialcrisis), the Underlying Sub-Fund may also hold all or part of its assets in fixed or floating rate corporate and/orgovernment debt securities, asset-backed and mortgage-backed securities which must be rated at leastinvestment grade or in the opinion of the sub-manager of the Underlying Sub-Fund to be of comparable qualityand which are listed, traded or dealt in on a regulated market.
104

First State Global Growth Funds
(Constituted under a Trust Deed in the Republic of Singapore)
NOTES TO THE FINANCIAL STATEMENTS
For the financial year ended 31 December 2018
1. General (continued)
Investment objectives (continued)
The investment objective of the Stewart Investors Global Emerging Markets Leaders Fund is to achieve long termcapital growth.
The Underlying Sub-Fund invests in large and mid-capitalisation equities in emerging economies, including thosecompanies listed on developed market exchanges whose activities predominantly take place in emerging marketcountries.
The Underlying Sub-Fund may invest up to 5% of its net assets in warrants. The Underlying Sub-Fund mayemploy a portion of its assets in futures contracts, options and forward currency transactions and securitieslending transactions for the purposes of efficient portfolio management.
Sub-Fund: Stewart Investors Global Emerging Markets Leaders Fund (GEML)
Launch date: 1 June 2004
Underlying Fund(s): ICVC – Stewart Investors Global Emerging Markets Leaders Fund
Investment objectives
The Underlying Sub-Fund may employ a portion of its assets in futures contracts, options, swaps (including creditdefault swaps), forward currency transactions and securities lending transactions for the purposes of efficientportfolio management and to hedge against exchange rate risk under the conditions and limitations as laid downby the Central Bank of Ireland. It is not intended that the Underlying Sub-Fund will avail of the opportunity toinvest in FDIs for investment purposes.
The Underlying Sub-Fund invests primarily in equity and equity related securities (including warrants, preferenceshares, rights issues, convertible bonds, depository receipts such as ADR and GDR, equity linked or participationnotes etc.) that are listed, traded or dealt in regulated markets provided the Underlying Sub-Fund may not investmore than 15% in aggregate of its net asset value in warrants or equity linked or participation notes. TheUnderlying Sub-Fund may invest up to 10% of its net asset value in transferable securities that are not listed,traded or dealt in regulated markets and up to 5% of its net asset value in open ended collective investmentschemes (including exchange traded funds).
The Underlying Sub-Fund may invest cash balances in short-term securities listed, traded or dealt in on aregulated market. The short-term securities in which the Underlying Sub-Fund may invest will include securitiessuch as commercial paper, certificates of deposit, treasury bills, and bankers' acceptances all rated aboveinvestment grade or in the opinion of the sub-manager of the Underlying Sub-Fund to be of comparable quality.For defensive purposes during periods of perceived uncertainty and volatility (e.g. market crash or major financialcrisis), the Underlying Sub-Fund may also hold all or part of its assets in fixed or floating rate corporate and/orgovernment debt securities, asset-backed and mortgage-backed securities which must be rated at leastinvestment grade or in the opinion of the sub-manager of the Underlying Sub-Fund to be of comparable qualityand which are listed, traded or dealt in on a regulated market.
105

First State Global Growth Funds
(Constituted under a Trust Deed in the Republic of Singapore)
NOTES TO THE FINANCIAL STATEMENTS
For the financial year ended 31 December 2018
1. General (continued)
The Underlying Sub-Fund may employ a portion of its assets in futures contracts, options, swaps (including creditdefault swaps), forward currency transactions and securities lending transactions for the purposes of efficientportfolio management and to hedge against exchange rate risk under the conditions and limitations as laid downby the Central Bank of Ireland. It is not intended that the Underlying Sub-Fund will avail of the opportunity toinvest in FDIs for investment purposes.
Launch date: 15 July 1998
Sub-Fund: Stewart Investors Worldwide Leaders Fund (G100)
Investment objectives
The investment objective of the Stewart Investors Worldwide Leaders Fund is to achieve long term capitalappreciation.
The Underlying Sub-Fund invests primarily (at least 70% of its net asset value) in a diverse portfolio of equitysecurities of larger capitalisation companies which are listed, traded or dealt in on any of the regulated marketsworldwide. Larger capitalisation companies are currently defined for the purposes of this policy as companieswith a minimum investible market cap (free float) of US$3 billion at the time of investment. The investmentmanager of the Underlying Sub-Fund may review this definition as considered appropriate.
In relation to the term Leaders, this indicates the Underlying Sub-Fund will not invest in securities of smallcapitalisation companies. Small capitalisation companies are currently defined for the purposes of this policy ascompanies with a minimum investible market cap (free float) of less than US$1 billion at the time of investment.
The investment manager / sub-manager for the Underlying Sub-Fund gives particular consideration to investmentin companies that are positioned to benefit from, and contribute to, the sustainable development of the countriesin which they operate.
The Underlying Sub-Fund is not managed to a benchmark.
The Underlying Sub-Fund is not subject to any limitation on the portion of its net asset value that may be investedin any one or more emerging markets or any sector.
Although the Underlying Sub-Fund has a global investment universe, the securities selected for investmentbased on the approach of the investment manager of the Underlying Sub-Fund may at times result in a portfoliothat is concentrated in certain geographical area(s).
The Underlying Sub-Fund’s maximum exposure to China A Shares (directly via the Stock Connects and/orindirectly through equity linked or participation notes and collective investment schemes) and China B Shares(through direct investment) in aggregate will not exceed 25% of the Underlying SubFund’s net asset value.
Underlying Fund(s): GUFD –Stewart Investors Worldwide Leaders Fund
106

First State Global Growth Funds
(Constituted under a Trust Deed in the Republic of Singapore)
NOTES TO THE FINANCIAL STATEMENTS
For the financial year ended 31 December 2018
1. General (continued)
The following sub-funds are included under the Central Provident Fund Investment Scheme (“CPFIS”):
First State Asian Growth FundFirst State BridgeFirst State Dividend AdvantageFirst State Regional China Fund
As at 31 December 2018, only Class A units and Class B units are being offered in relation to the AIAT and onlyClass A units are being offered in relation to the other sub-funds. AIAT's Class A units and Class B units havedifferent minimum initial class investment, minimum subsequent class investment and minimum class holdingamounts and are subject to a different annual investment management fee. As at 31 December 2018, only ClassA units are being offered in relation to the BRDG. BRDG has Class A (Semi-Annually Distributing) units andClass A (Monthly Distributing) units. As at 31 December 2018, only Class A units are being offered in relation tothe GLPR. GLPR has Class A (Distribution) units and Class A (Accumulation) units.
Investment objectives (continued)
The Underlying Sub-Fund invests primarily in equity and equity related securities (including warrants, preferenceshares, rights issues, convertible bonds, depository receipts such as ADR and GDR, equity linked or participationnotes etc.) that are listed, traded or dealt in regulated markets provided the Underlying Sub-Fund may not investmore than 15% in aggregate of its net asset value in warrants or equity linked or participation notes. TheUnderlying Sub-Fund may invest up to 10% of its net asset value in transferable securities that are not listed,traded or dealt in regulated markets and up to 5% of its net asset value in open ended collective investmentschemes (including exchange traded funds).
The Underlying Sub-Fund may invest cash balances in short-term securities listed, traded or dealt in on aregulated market. The short-term securities in which the Underlying Sub-Fund may invest will include securitiessuch as commercial paper, certificates of deposit, treasury bills, and bankers' acceptances all rated aboveinvestment grade or in the opinion of the investment manager of the Underlying Sub-Fund to be of comparablequality. For defensive purposes during periods of perceived uncertainty and volatility (e.g. market crash or majorfinancial crisis), the Underlying Sub-Fund may also hold all or part of its assets in fixed or floating rate corporateand/or government debt securities, asset-backed and mortgage-backed securities which must be rated at leastinvestment grade or in the opinion of the investment manager of the Underlying Sub-Fund to be of comparablequality and which are listed, traded or dealt in on a regulated market.
The Manager may establish Classes of units within the Sub-Funds. Different Classes within a sub-fund havedifferent features. Where a new Class is established, the Manager may at its discretion re-designate any existingClass as long as there is no prejudice to existing holders of such Class.
During the year ended 31 December 2018 the Manager has, at its own discretion, chosen to absorb certainexpenses of APGF (2017: APGF and GRES).
107

First State Global Growth Funds
(Constituted under a Trust Deed in the Republic of Singapore)
NOTES TO THE FINANCIAL STATEMENTS
For the financial year ended 31 December 2018
2. Significant accounting policies
The principal accounting policies in the preparation of these financial statements are set out below:
(a) Basis of preparation
(b) Recognition of income
(c) Investments
(d) Foreign currency translation
The financial statements are prepared in Singapore dollars (S$), which is the functional currency of the Sub-Funds.
lnvestments are classified as financial assets held at fair value through profit or loss. Purchases ofinvestments are recognised on trade date. lnvestments are recorded at fair value on initial recognition, andsubsequently carried at fair value. The fair value of investments held in Underlying Sub-Funds' is the quotednet asset value of the Underlying Sub-Funds' determined by the Underlying Sub-Funds' administrator. Netchanges in fair value of investments are included in the Statement of Total Return in the year in which theyarise.
The financial statements have been prepared under the historical cost convention, as modified by therevaluation of financial instruments at fair value through profit or loss, and in accordance with therecommendations of Statement of Recommended Accounting Practice 7 “Reporting Framework for UnitTrusts” issued by the Institute of Singapore Chartered Accountants.
Dividend income is recorded gross in the Statement of Total Return in the financial year in which a dividendis declared payable by the investee company. Interest income on deposits is recognised on a time proportionbasis using the effective interest method.
Investments are derecognised on the trade date of disposal. The resultant realised gains and losses on thedisposal of investments are taken up in the Statement of Total Return as at trade date.
Foreign currency transactions during the year are translated into Singapore dollars at the rates of exchangeruling on the transaction dates. Foreign currency monetary assets and liabilities are translated intoSingapore dollars at the rates of exchange ruling at the reporting date. Foreign exchange gains and lossesresulting from the settlement of foreign currency transactions and from the translation at year end exchangerates of foreign currency monetary assets and liabilities, are taken to the Statement of Total Return.
108

First State Global Growth Funds
(Constituted under a Trust Deed in the Republic of Singapore)
NOTES TO THE FINANCIAL STATEMENTS
For the financial year ended 31 December 2018
2. Significant accounting policies (continued)
(e) Financial derivatives
(f)
(g)
(h)
Financial derivatives are recognised at fair value on the date in which a derivative contract is entered intoand are subsequently re-measured at their fair values. Fair values are obtained from quoted market prices inactive markets, including recent market transactions, and valuation techniques, including discounted cashflow models and options pricing models, as appropriate. A derivative is carried as an asset when its fairvalue is positive, and as a liability when its fair value is negative. Subsequent changes in the fair value of anyderivative instruments are recognised immediately in the Statement of Total Return.
Structured entities
The Manager shall has the absolute discretion to determine whether a distribution is to be made. In the eventthat the Manager determines that a distribution will be made, an amount required to effect such a distributionshall be transferred to a distribution account for payment on distribution date. This amount shall not betreated as part of the property of the Sub-Funds. Distributions are accrued for at the point in time when thenecessary approvals have been obtained and a legal or constructive obligation has been created.
Distribution
Net gains and losses on financial derivatives held for protection or enhancement of investments are taken tothe Statement of Total Return as gains or losses on financial derivatives. Such gains or losses on financialderivatives held for generating or protecting income are taken to the Statement of Total Return as incomegains or losses.
A structured entity is an entity that has been designed so that voting or similar rights are not the dominantfactor in deciding who controls the entity, such as when any voting rights relate to administrative tasks onlyand the relevant activities are directed by means of contractual arrangements. A structured entity often hassome or all of the following features or attributes: (a) restricted activities, (b) a narrow and well-definedobjective, such as to provide investment opportunities for investors by passing on risks and rewardsassociated with the assets of the structured entity to investors, (c) insufficient equity to permit the structuredentity to finance its activities without subordinated financial support and (d) financing in the form of multiplecontractually linked instruments to investors that create concentrations of credit or other risks (tranches).
The Sub-Funds consider its investment in the Underlying Sub-Funds to be investment in unconsolidatedstructured entities. The Sub-Funds invest in the Underlying Sub-Funds whose objectives range fromachieving short to long term capital growth and whose investment strategies do not include the use ofleverage. The Underlying Sub-Funds are managed by related asset managers and apply various investmentstrategies to accomplish their respective investment objectives. The Underlying Sub-Funds finance theiroperations by issuing redeemable shares which are puttable at the holder's option and entitles the holder toa proportional stake in the respective fund's net assets. The Sub-Funds hold redeemable shares in each ofthe Underlying Sub-Funds.
The change in fair value of the Underlying Sub-Funds is included in the net gains or losses on investmentstaken up in the Statement of Total Return as described in Note 2(c).
Offsetting financial instruments
Financial assets and liabilities are offset and the net amount reported in the Statement of Financial Positionwhen there is a legally enforceable right to offset the recognised amounts and there is an intention to settleon a net basis or realise the asset and settle the liability simultaneously. The legally enforceable right mustnot be contingent on future events and must be enforceable in the normal course of business and in theevent of default, insolvency or bankruptcy of the Sub-Funds or the counterparty.
109

First State Global Growth Funds
(Constituted under a Trust Deed in the Republic of Singapore)
NOTES TO THE FINANCIAL STATEMENTS
For the financial year ended 31 December 2018
3. Income tax
(a) gains or profits derived from Singapore or elsewhere from the disposal of securities;
(b) interest (other than interest for which tax has been deducted under section 45 of the Income Tax Act);
(c) dividends derived from outside Singapore and received in Singapore;
(d)
(e) distributions from foreign unit trusts derived from outside Singapore and received in Singapore.
4. Distributions
Entitlement
cut off date
Payment
date
Distribution
amount
S$
Distribution at 0.98 cents per unit 31 January 2018 15 February 2018 126,291Distribution at 0.95 cents per unit 30 April 2018 16 May 2018 114,608Distribution at 0.94 cents per unit 31 July 2018 16 August 2018 102,126Distribution at 0.92 cents per unit 31 October 2018 15 November 2018 97,224
440,249
gains or profits derived from foreign exchange transactions, transactions in futures contracts, transactions ininterest rate or currency forwards, swaps or option contracts and transactions in forwards, swaps or optioncontracts relating to any securities or financial index; and
The Sub-Funds were granted the status of Designated Unit Trusts ("DUT") in Singapore.The Trustee of the Sub-Funds will ensure the Sub-Funds fulfill its reporting obligations under the DUT scheme.
Under the DUT scheme, subject to certain conditions and reporting obligations being met. Certain income of theDUT Sub-Funds are not taxable in accordance with section 35(12) and (12A) of the Income Tax Act (Cap 134)including:
The foreign income tax represents tax deducted at source on dividends derived from outside Singapore andreceived in Singapore and tax deducted with respect to gains on disposal of investments.
The Sub-Funds are required to recognise a tax liability when it is probable that the tax laws of foreign countriesrequire a tax liability to be assessed on the Sub-Funds' gains on investments sourced from such foreigncountries, assuming the relevant taxing authorities have full knowledge of all the facts and circumstances. Thetax liability is then measured at the amount expected to be paid to the relevant taxation authorities using the taxlaws and rates that have been enacted or substantively enacted by the end of the reporting period. There issometimes uncertainty about the way enacted tax law is applied to offshore investment funds. This createsuncertainty about whether or not a tax liability will ultimately be paid by the Sub-Funds. Therefore whenmeasuring any uncertain tax liabilities management considers all of the relevant facts and circumstancesavailable at the time which could influence the likelihood of payment, including any formal or informal practices ofthe relevant tax authorities.
First State Asian Quality Bond
2018
As at 31 December 2018 and 2017, the Sub-Funds' uncertain tax exposure with respect to gains on investment ofwhich the tax liability is estimated to be nil. While this represents the Manager's best estimate, the estimatedvalue could differ significantly from the amount ultimately payable.
110

First State Global Growth Funds
(Constituted under a Trust Deed in the Republic of Singapore)
NOTES TO THE FINANCIAL STATEMENTS
For the financial year ended 31 December 2018
4. Distributions (continued)
Entitlement
cut off date
Payment
date
Distribution
amount
S$
Distribution at 0.98 cents per unit 31 January 2017 15 February 2017 123,060Distribution at 0.99 cents per unit 28 April 2017 17 May 2017 124,065Distribution at 0.99 cents per unit 31 July 2017 16 August 2017 137,793Distribution at 0.99 cents per unit 31 October 2017 15 November 2017 146,316
531,234
Entitlement
cut off date
Payment
date
Distribution
amount
S$
Class A (Semi-annually distributing)
Distribution at 3.55 cents per unit 28 February 2018 15 March 2018 30,300,069
Distribution at 3.51 cents per unit 31 August 201820 September
2018 32,639,961
Class A (Monthly distributing)
Distribution at 0.58 cents per unit 29 June 2018 16 July 2018 17,931Distribution at 0.58 cents per unit 31 July 2018 16 August 2018 51,657
Distribution at 0.59 cents per unit 31 August 201817 September
2018 106,847Distribution at 0.58 cents per unit 28 September 2018 15 October 2018 154,529Distribution at 0.55 cents per unit 31 October 2018 16 November 2018 187,133Distribution at 0.56 cents per unit 30 November 2018 17 December 2018 224,023Distribution at 0.56 cents per unit 31 December 2018 16 January 2019 248,589
63,930,739
Entitlement
cut off date
Payment
date
Distribution
amount
S$
Distribution at 2.46 cents per unit 28 February 2017 16 March 2017 19,215,935
Distribution at 2.60 cents per unit 31 August 201721 September
2017 20,943,29140,159,226
First State Asian Quality Bond
2017
2018
First State Bridge
2017
First State Bridge
111
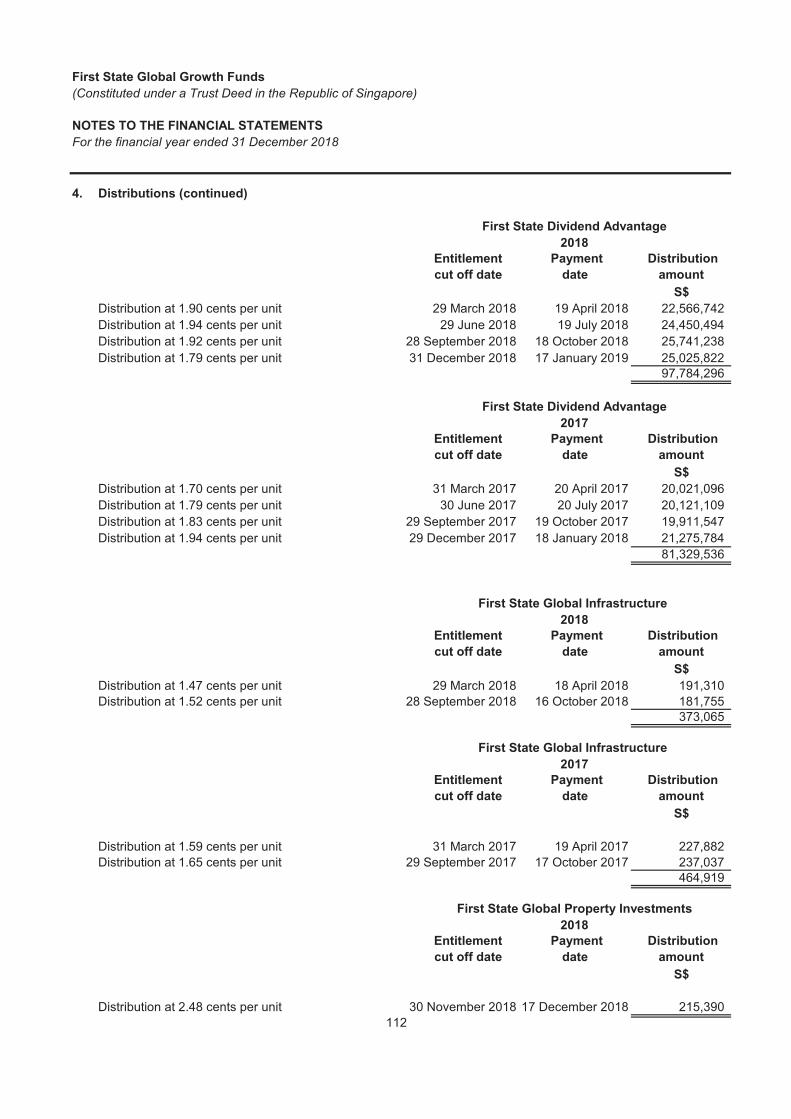
First State Global Growth Funds
(Constituted under a Trust Deed in the Republic of Singapore)
NOTES TO THE FINANCIAL STATEMENTS
For the financial year ended 31 December 2018
4. Distributions (continued)
Entitlement
cut off date
Payment
date
Distribution
amount
S$
Distribution at 1.90 cents per unit 29 March 2018 19 April 2018 22,566,742Distribution at 1.94 cents per unit 29 June 2018 19 July 2018 24,450,494Distribution at 1.92 cents per unit 28 September 2018 18 October 2018 25,741,238Distribution at 1.79 cents per unit 31 December 2018 17 January 2019 25,025,822
97,784,296
Entitlement
cut off date
Payment
date
Distribution
amount
S$
Distribution at 1.70 cents per unit 31 March 2017 20 April 2017 20,021,096Distribution at 1.79 cents per unit 30 June 2017 20 July 2017 20,121,109Distribution at 1.83 cents per unit 29 September 2017 19 October 2017 19,911,547Distribution at 1.94 cents per unit 29 December 2017 18 January 2018 21,275,784
81,329,536
Entitlement
cut off date
Payment
date
Distribution
amount
S$
Distribution at 1.47 cents per unit 29 March 2018 18 April 2018 191,310Distribution at 1.52 cents per unit 28 September 2018 16 October 2018 181,755
373,065
Entitlement
cut off date
Payment
date
Distribution
amount
S$
Distribution at 1.59 cents per unit 31 March 2017 19 April 2017 227,882Distribution at 1.65 cents per unit 29 September 2017 17 October 2017 237,037
464,919
Entitlement
cut off date
Payment
date
Distribution
amount
S$
Distribution at 2.48 cents per unit 30 November 2018 17 December 2018 215,390
2017
2018
2018
First State Dividend Advantage
First State Global Infrastructure
2018
First State Dividend Advantage
First State Global Infrastructure
First State Global Property Investments
2017
112

First State Global Growth Funds
(Constituted under a Trust Deed in the Republic of Singapore)
NOTES TO THE FINANCIAL STATEMENTS
For the financial year ended 31 December 2018
4. Distributions (continued)
Entitlement
cut off date
Payment
date
Distribution
amount
S$
Distribution at 3.51 cents per unit 30 November 2017 15 December 2017 336,727
5. Other receivables
2018 2017 2018 2017
S$ S$ S$ S$
Amounts receivable from unitholders for creation of units 18,039 87,743 22,906 248,123
90,141 114,448 226,812 271,676Other receivables 14,247 7,536 56,078 17,775
122,427 209,727 305,796 537,574
2018 2017 2018 2017
S$ S$ S$ S$
Amounts receivable from unitholders for creation of units 11,006 21,736 5,564,508 9,406,375
23,665 35,169 5,263,211 4,563,606Other receivables 5,379 4,440 618,945 269,165
40,050 61,345 11,446,664 14,239,146
2018 2018 2017
S$ S$ S$ S$
Amounts receivable from unitholders for creation of units 10,232,023 14,602,646 1,050 23,374
9,387,433 7,762,427 57,018 59,311Other receivables 1,085,511 493,229 8,430 4,019
20,704,967 22,858,302 66,498 86,704
First State Asian
Quality Bond
First State Asian
Growth Fund
First State Global Balanced
Fund
2017
First State
Dividend Advantage
2017
Management fee rebates receivable
Management fee rebates receivable
First State Global Property Investments
Management fee rebates receivable
First State Asia
Opportunities Fund
First State Bridge
113

First State Global Growth Funds
(Constituted under a Trust Deed in the Republic of Singapore)
NOTES TO THE FINANCIAL STATEMENTS
For the financial year ended 31 December 2018
5. Other receivables (continued)
2018 2017 2018 2017
S$ S$ S$ S$
Amounts receivable from unitholders for creation of units - 213,344 73,602 199,605
41,244 58,499 63,558 98,409Other receivables 8,404 3,975 13,152 6,285
49,648 275,818 150,312 304,299
2018 2017 2018 2017
S$ S$ S$ S$
Amounts receivable from unitholders for creation of units 592,451 2,906,819 239,144 817,052
1,725,501 1,785,074 449,084 455,447Other receivables 244,322 104,067 62,621 24,313
2,562,274 4,795,960 750,849 1,296,812
2018 2017 2018 2017
S$ S$ S$ S$
Amounts receivable from unitholders for creation of units 33,555 15,602 - -
161,777 169,529 42,200 59,341Other receivables 23,928 11,658 8,367 4,294
219,260 196,789 50,567 63,635
2018 2017
S$ S$
Amounts receivable from unitholders for creation of units 150,608 99,369
93,407 97,291Other receivables 13,765 6,394
257,780 203,054
Stewart Investors Worldwide
Leaders Fund
Management fee rebates receivable
First State Regional India Fund
First State Global Property
Investments
Management fee rebates receivable
Management fee rebates receivable
First State Singapore Growth
Fund
Stewart Investors Global
Emerging Markets
First State Global
Infrastructure
Management fee rebates receivable
First State Regional China Fund
114

First State Global Growth Funds
(Constituted under a Trust Deed in the Republic of Singapore)
NOTES TO THE FINANCIAL STATEMENTS
For the financial year ended 31 December 2018
6. Other payables
2018 2017 2018 2017
S$ S$ S$ S$
24,975 43,372 107,412 504,221Accrued management fees 31,377 37,860 78,361 91,419Accrued trustee's fees 1,302 1,650 3,794 4,428Other accrued expenses 21,763 21,514 23,698 25,986
79,417 104,396 213,265 626,054
2018 2017 2018 2017
S$ S$ S$ S$
53,314 149,082 3,486,974 3,815,880Accrued management fees 7,849 12,075 1,844,417 1,606,843Accrued trustee's fees 1,665 1,227 107,209 93,429Other accrued expenses 24,103 19,573 132,829 161,997
86,931 181,957 5,571,429 5,678,149
2018 2017 2018 2017
S$ S$ S$ S$
3,724,460 6,663,466 21,839 13,024Accrued management fees 3,292,905 2,739,368 19,015 20,004Accrued trustee's fees 159,455 132,739 1,989 2,029Other accrued expenses 259,693 221,997 18,632 16,489
7,436,513 9,757,570 61,475 51,546
Amounts payable to unitholders for cancellation of units
Amounts payable to unitholders for cancellation of units
First State Bridge
First State Asian
Quality Bond
First State Asia
Opportunities Fund First State Asian Growth Fund
First State Global Balanced Fund
Amounts payable to unitholders for cancellation of units
First State
Dividend Advantage
115

First State Global Growth Funds
(Constituted under a Trust Deed in the Republic of Singapore)
NOTES TO THE FINANCIAL STATEMENTS
For the financial year ended 31 December 2018
6. Other payables (continued)
2018 2017 2018 2017
S$ S$ S$ S$
35,768 21,702 83,676 41,026Accrued management fees 14,849 19,987 20,841 34,881Accrued trustee's fees 3,154 1,295 1,008 1,689Other accrued expenses 20,271 18,416 20,397 21,598
74,042 61,400 125,922 99,194
2018 2017 2018 2017
S$ S$ S$ S$
563,986 1,862,334 113,995 159,747Accrued management fees 589,892 633,839 161,046 165,662Accrued trustee's fees 28,553 30,714 6,683 6,883Other accrued expenses 42,232 47,619 24,953 22,721
1,224,663 2,574,506 306,677 355,013
2018 2017 2018 2017
S$ S$ S$ S$
74,691 180,833 15,598 13,996Accrued management fees 55,484 59,855 14,788 20,377Accrued trustee's fees 2,686 2,900 2,506 2,430Other accrued expenses 19,453 17,308 18,981 17,394
152,314 260,896 51,873 54,197
First State Global Infrastructure
First State Global Property
Investments
Amounts payable to unitholders for cancellation of units
First State Singapore Growth
Fund
Amounts payable to unitholders for cancellation of units
Amounts payable to unitholders for cancellation of units
First State Regional India
Fund
First State Regional China
Fund
Stewart Investors Global
Emerging Markets
116

First State Global Growth Funds
(Constituted under a Trust Deed in the Republic of Singapore)
NOTES TO THE FINANCIAL STATEMENTS
For the financial year ended 31 December 2018
6. Other payables (continued)
2018 2017
S$ S$
67,790 67,489Accrued management fees 32,031 34,446Accrued trustee's fees 1,551 1,669Other accrued expenses 20,880 17,741
122,252 121,345
7. Financial derivatives, at fair value
Notional Fair value Fair value
amount assets liabilities
S$ S$ S$
Forward foreign exchange contracts 10,656,102 112,308 7,108
Notional Fair value Fair value
amount assets liabilities
S$ S$ S$
Forward foreign exchange contracts 16,336,882 216,587 15,310
Notional Fair value Fair value
amount assets liabilities
S$ S$ S$
Forward foreign exchange contracts 871,851,652 6,094,678 78,908
Notional Fair value Fair value
amount assets liabilities
S$ S$ S$
Forward foreign exchange contracts 724,731,467 9,574,752 11,136
31 December 2018
First State Asian Quality Bond
First State Bridge
First State Asian Quality Bond
Financial derivative contracts comprise forward foreign exchange contracts for the sale and purchase of foreigncurrencies.
First State Bridge
The contract or underlying principal amounts of these financial derivatives and their corresponding gross positiveand negative fair values at the reporting date are as follows:
31 December 2018
31 December 2017
Amounts payable to unitholders for cancellation of units
31 December 2017
Stewart Investors Worldwide
Leaders Fund
117

First State Global Growth Funds
(Constituted under a Trust Deed in the Republic of Singapore)
NOTES TO THE FINANCIAL STATEMENTS
For the financial year ended 31 December 2018
8. Units in issue
Class A Class B Class A Class B
Units at beginning of year 19,323,802 2,319,177 23,168,987 91,853Units created 1,068,955 229,925 1,006,875 2,993,367Units cancelled (2,694,609) (2,517,357) (4,852,060) (766,043)Units at end of year* 17,698,148 31,745 19,323,802 2,319,177
444,198 - 661,525 -
20,352,701 37,099 23,360,618 2,827,760
Net asset value per unit (S$) 1.1500 1.1686 1.2089 1.2193
2018 2017 2018 2017
Units Units Units Units
Units at beginning of year 25,544,917 29,230,407 14,162,104 12,537,531Units created 4,558,556 6,455,147 2,198,301 4,255,305Units cancelled (7,852,734) (10,140,637) (6,550,598) (2,630,732)Units at end of year* 22,250,739 25,544,917 9,809,807 14,162,104
117,857 115,908 - -
59,414,863 70,136,955 8,948,280 13,818,279
Net asset value per unit (S$) 2.6702 2.7456 0.9121 0.9757
Class A
(Distribution)
* Included above are units denominated in USD
Net assets attributable to unitholders (S$)
First State Asian Growth Fund
First State Asian
Quality Bond
Net assets attributable to unitholders (S$)
2017
Units
First State Asia
Opportunities Fund
* Included above are units denominated in USD
2018
Units
During the year ended 31 December 2018 and 2017 the number of units issued, redeemed and outstanding wereas follows:
118

First State Global Growth Funds
(Constituted under a Trust Deed in the Republic of Singapore)
NOTES TO THE FINANCIAL STATEMENTS
For the financial year ended 31 December 2018
8. Units in issue (continued)
Class A
(Semi-Annually
Distributing)
Class A
(Monthly
Distributing)
Class A
(Semi-Annually
Distributing)
Class A
(Monthly
Distributing)
Units at beginning of year 838,801,348 - 784,197,782 NAUnits created 286,605,235 45,620,490 212,076,432 NAUnits cancelled (147,436,151) (1,229,595) (157,472,866) NAUnits at end of year* 977,970,432 44,390,895 838,801,348 NA
1,616,919,715 73,150,266 1,485,970,831 NA
Net asset value per unit (S$) 1.6533 1.6479 1.7715 NA
2018 2017 2018 2017
Units Units Units Units
Units at beginning of year 1,096,689,908 1,184,325,242 18,342,185 20,088,929Units created 552,384,903 326,554,214 3,988,298 1,841,185Units cancelled (250,984,171) (414,189,548) (4,704,691) (3,587,929)Units at end of year* 1,398,090,640 1,096,689,908 17,625,792 18,342,185
249,847,737 183,925,633 545,088 415,300
2,474,927,574 2,097,569,615 17,294,558 18,309,817
Net asset value per unit (S$) 1.7702 1.9126 0.9812 0.9982
2018 2017
Units Units
Units at beginning of year 14,276,638 13,210,425Units created 2,218,176 9,353,490Units cancelled (5,251,098) (8,287,277)Units at end of year* 11,243,716 14,276,638
3,416,075 5,190,617
10,871,139 15,226,439
Net asset value per unit (S$) 0.9669 1.0665
* Included above are units denominated in USD
Net assets attributable to unitholders (S$)
First State Global Balanced Fund
* Included above are units
First State Bridge
First State
Dividend Advantage
First State Global Infrastructure
2018
Units
2017
Units
Net assets attributable to unitholders (S$)
Net assets attributable to
119

First State Global Growth Funds
(Constituted under a Trust Deed in the Republic of Singapore)
NOTES TO THE FINANCIAL STATEMENTS
For the financial year ended 31 December 2018
8. Units in issue (continued)
Class A
(Distribution)
Class A
(Accumulation)
Class A
(Distribution)
Class A
(Accumulation)
Units at beginning of year 9,646,517 19,583,777 10,815,529 15,363,962Units created 316,282 4,155,812 680,848 8,981,602Units cancelled (1,635,796) (13,769,304) (1,849,860) (4,761,787)Units at end of year 8,327,003 9,970,285 9,646,517 19,583,777
6,177,207 8,613,836 8,194,064 18,795,563
Net asset value per unit (S$) 0.7418 0.8640 0.8495 0.9598
2018 2017 2018 2017
Units Units Units Units
Units at beginning of year 123,120,134 139,499,569 12,817,074 10,893,631Units created 31,865,220 24,821,975 3,911,429 5,461,521Units cancelled (29,854,395) (41,201,410) (3,527,618) (3,538,078)Units at end of year* 125,130,959 123,120,134 13,200,885 12,817,074
10,878,247 12,090,432 1,101,050 877,821
436,794,527 490,791,229 106,724,763 110,409,718
Net asset value per unit (S$) 3.4907 3.9863 8.0847 8.6143
Units
First State Regional India Fund
Net assets attributable to unitholders (S$)
2017
First State Regional China Fund
Net assets attributable to unitholders (S$)
First State Global Property Investments
* Included above are units denominated in USD
Units
2018
120
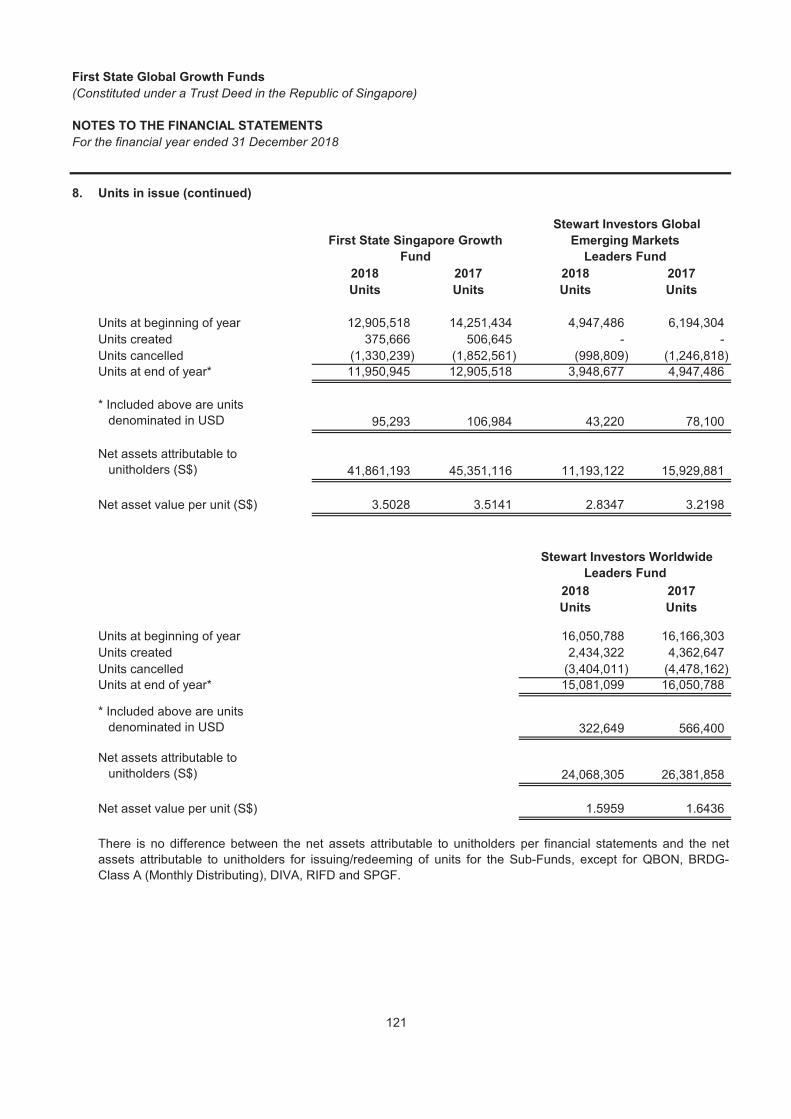
First State Global Growth Funds
(Constituted under a Trust Deed in the Republic of Singapore)
NOTES TO THE FINANCIAL STATEMENTS
For the financial year ended 31 December 2018
8. Units in issue (continued)
2018 2017 2018 2017
Units Units Units Units
Units at beginning of year 12,905,518 14,251,434 4,947,486 6,194,304Units created 375,666 506,645 - -Units cancelled (1,330,239) (1,852,561) (998,809) (1,246,818)Units at end of year* 11,950,945 12,905,518 3,948,677 4,947,486
95,293 106,984 43,220 78,100
41,861,193 45,351,116 11,193,122 15,929,881
Net asset value per unit (S$) 3.5028 3.5141 2.8347 3.2198
2018 2017
Units Units
Units at beginning of year 16,050,788 16,166,303Units created 2,434,322 4,362,647Units cancelled (3,404,011) (4,478,162)Units at end of year* 15,081,099 16,050,788
322,649 566,400
24,068,305 26,381,858
Net asset value per unit (S$) 1.5959 1.6436
Stewart Investors Worldwide
Leaders Fund
* Included above are units denominated in USD
There is no difference between the net assets attributable to unitholders per financial statements and the netassets attributable to unitholders for issuing/redeeming of units for the Sub-Funds, except for QBON, BRDG-Class A (Monthly Distributing), DIVA, RIFD and SPGF.
First State Singapore Growth
Fund
Stewart Investors Global
Emerging Markets
Leaders Fund
* Included above are units denominated in USD
Net assets attributable to unitholders (S$)
Net assets attributable to unitholders (S$)
121

First State Global Growth Funds
(Constituted under a Trust Deed in the Republic of Singapore)
NOTES TO THE FINANCIAL STATEMENTS
For the financial year ended 31 December 2018
8. Units in issue (continued)
2018 2017 2018 2017
S$ S$ S$ S$
0.9124 0.9760 1.6535 NA
Effect of preliminary expenses (0.0003) (0.0003) - NA
Effect of distribution per unit - - (0.0056) NA
0.9121 0.9757 1.6479 NA
2018 2017 2018 2017
S$ S$ S$ S$
1.7881 1.9320 8.0846 8.6143
Effect of accrued expenses - - 0.0001 -
Effect of distribution per unit (0.0179) (0.0194) -
1.7702 1.9126 8.0847 8.6143
2018 2017
S$ S$
3.5027 3.5141
Effect of accrued expenses 0.0001 -
3.5028 3.5141
Net asset attributable to unitholders per unit for issuing/redeeming units (S$)
Net asset attributable to unitholders per unit for issuing/redeeming units (S$)
First State Dividend Advantage
Net asset attributable to unitholders per unit per the financial statements (S$)
First State Asian
Quality Bond
Net asset attributable to unitholders per unit per the financial statements (S$)
A reconciliation of the net assets attributable to unitholders per unit per the financial statements and the netassets attributable to unitholders per unit for issuing/redeeming units at the financial year end date is presentedbelow:
First State Singapore Growth Fund
First State Bridge
Class A (Monthly Distributing)
First State Regional India Fund
Net asset attributable to unitholders per unit for issuing/redeeming units (S$)
Net asset attributable to unitholders per unit per the financial statements (S$)
122

First State Global Growth Funds
(Constituted under a Trust Deed in the Republic of Singapore)
NOTES TO THE FINANCIAL STATEMENTS
For the financial year ended 31 December 2018
9. Financial risk management
a. Market risk
(i)
The Fund’s activities expose it to a variety of financial risks including but not limited to market risk (includingcurrency risk, interest rate risk and price risk), liquidity risk and credit risk. The Fund comprises the sub-funds asdisclosed in Note 1. The sub-funds (collectively, the “Sub-Funds”), invest all or substantially all of their assets intounderlying funds as disclosed in Note 1. These underlying funds are separately managed by their respectivemanager and the Manager does not view the risk exposures of the Feeder Funds to be the same as those of theunderlying funds in which they hold investments.
The data used and assumptions made in the sensitivity analyses below may not reflect actual market conditions,nor is it representative of any potential future market conditions. The sensitivity analyses can be complex and thedisclosures made here are not exhaustive. The market exposures change regularly and the assumptions madebelow may not be representative of the risk taken throughout the year. The sensitivity analyses below should notbe solely relied upon by investors in making their investment decisions.
At the reporting date, the Fund’s financial risks comprise market risk (mainly price risk and currency risk), liquidityrisk and credit risk.
The Sub-Funds invest all or substantially all of their assets into the respective underlying funds whose investmentobjectives are disclosed in Note 1.
Market risk is the risk of loss arising from uncertainty concerning movements in market prices and rates, including interest rates, credit spreads and exchange rates. Market risk includes such factors as changes in the economicenvironment, consumption pattern and investor’s expectation which may have a significant impact on the value ofthe investments. The Fund’s investments are substantially dependent on changes in market prices. The Fund’sinvestments are monitored by the Manager on a regular basis so as to assess changes in fundamentals andvaluation. Although the Manager makes reasonable efforts in the choice of investments, events beyondreasonable control of the Manager could affect the prices of the underlying investments and hence the net assetvalue of the Fund. Guidelines are set to reduce the Fund’s risk exposures to market volatility such as diversifyingthe portfolio by investing across various industry sectors and geographies. Alternatively, the Fund may be hedgedusing derivative strategies.
Price risk is the risk that the fair values of equities or future cash flows of a financial instrument will fluctuatebecause of changes in market prices (other than those arising from interest rate risk or currency risk).
Price Risk
The overall responsibility for the management of the Fund’s financial risks lies with the Manager. The Fund’soverall risk management programme seeks to minimise potential adverse effects on the Fund’s financialperformance. The Fund may use financial futures contracts, financial options contracts and/or forward foreignexchange contracts subject to the terms of the Trust Deed to moderate certain risk exposures. Specific guidelineson exposures to individual securities and certain industries are in place for the Fund at any time as part of theoverall financial risk management to reduce the Fund’s risk exposures.
The Fund’s assets are held in accordance with the published investment policies of the Fund. The allocation ofassets between the various types of investments is determined by the Manager to achieve their investmentobjectives.
123

First State Global Growth Funds
(Constituted under a Trust Deed in the Republic of Singapore)
NOTES TO THE FINANCIAL STATEMENTS
For the financial year ended 31 December 2018
9. Financial risk management (continued)
a.
(i)
The reasonable possible change in the benchmark market indices has been determined by using the one yearbenchmark returns for the financial year ended 31 December 2018 and 2017, respectively. This is a reasonablepossible change in the benchmark assuming similar volatility in the respective financial markets will beexperienced in the next twelve months.
The table below summarises the effect on the net assets attributable to unitholders for each sub-fund, as at 31December 2018 and 2017, from a reasonable possible change in the benchmark market indices as applied to therespective beta reported by Lipper.
The Sub-Funds Review Committee of the Manager meets on a quarterly basis to perform an overall review of theSub-Funds. Areas under review include performance of the Sub-Funds as well as their underlying funds,operational and compliance matters and specific issues that occurred in the relevant year. The objective of thismeeting is to ensure delegation and management of the Sub-Funds have been performed in accordance withconstituted documents and regulatory requirements.
The investments held by the Sub-Funds in the underlying funds are subject to the fluctuations in the quoted netasset value of the underlying funds. Such risk is primarily managed by the respective manager of the underlyingfunds. The Manager also monitors the performance of the Sub-Funds against their respective benchmarks on aregular basis. A Sub-Fund Review Committee has also been established to ensure that there is appropriate andadequate oversight on the performance of the underlying sub-funds.
Market risk (continued)
Price Risk (continued)
124

First State Global Growth Funds
(Constituted under a Trust Deed in the Republic of Singapore)
NOTES TO THE FINANCIAL STATEMENTS
For the financial year ended 31 December 2018
9. Financial risk management (continued)
a.
(i)
Effect on Effect on
Change in net assets Change in net assets
Benchmark attributable to Benchmark attributable to
Market Index unitholders Market Index unitholders
31 December
2018
31 December
2018
31 December
2017
31 December
2017
% S$ % S$
12.41 1,779,326 31.43 7,112,653
12.41 5,924,257 31.43 23,853,679
0.73 58,202 5.12 702,335
6.53 93,172,943 17.25 174,828,957
11.97 268,084,383 27.03 387,785,744
MSCI AC Asia ex-Japan
Index
Price Risk (continued)
First State Dividend Advantage
Sub-Funds
Components
Benchmark
MSCI AC Asia ex-Japan
Index
First State Asia Opportunities Fund
Market risk (continued)
JP Morgan Asia Credit Investment
Grade Index (SGD Index) (Hedged to
SGD)
MSCI AC Asia Pacific ex-
Japan Index
First State Bridge 50% MSCI Asia Pacific ex-Japan Index (Unhedged) and 50% JP Morgan Asia
Credit Investment
Grade Index (Hedged to
SGD)
First State Asian Growth Fund
First State Asian Quality Bond
125

First State Global Growth Funds
(Constituted under a Trust Deed in the Republic of Singapore)
NOTES TO THE FINANCIAL STATEMENTS
For the financial year ended 31 December 2018
9. Financial risk management (continued)
a.
(i)Effect on Effect on
Change in net assets Change in net assets
Benchmark attributable to Benchmark attributable to
Market Index unitholders Market Index unitholders
31 December
2018
31 December
2018
31 December
2017
31 December
2017
% S$ % S$
3.65 515,011 8.74 2,515,224
1.25 134,420 10.37 1,342,617
2.85 388,726 3.07 966,808
12.86 53,111,568 33.38 93,013,804
5.46 4,678,419 28.36 21,393,446
Market risk (continued)
MSCI India Index
FTSE EPRA/ Nareit
Developed Index
First State Regional China Fund
First State Regional India Fund
Price Risk (continued)
First State Global Balanced Fund
Components
MSCI Golden Dragon Index
FTSE Global Core
Infrastructure 50-50 Index
Benchmark
Sub-Funds
60% MSCI AC World Index
and 40% FTSE World Government Bond Index (Unhedged)(2017: 60% MSCI AC
World Index and 40% Citygroup
World Government Bond Index
(Unhedged))
First State Global Property Investments
First State Global Infrastructure
126

First State Global Growth Funds
(Constituted under a Trust Deed in the Republic of Singapore)
NOTES TO THE FINANCIAL STATEMENTS
For the financial year ended 31 December 2018
9. Financial risk management (continued)
a.
(i)
Effect on Effect on
Change in net assets Change in net assets
Benchmark attributable to Benchmark attributable to
Market Index unitholders Market Index unitholders
31 December
2018
31 December
2018
31 December
2017
31 December
2017
% S$ % S$
6.22 1,681,195 21.55 7,578,427
12.54 765,425 27.43 3,392,679
6.38 1,108,531 13.85 4,748,501
(ii) Currency Risk
The Sub-Funds may hold assets and liabilities denominated in currencies other than Singapore dollars andtherefore the Sub-Funds may be affected favourably or unfavourably by exchange rate regulators or changes inthe exchange rates between the Singapore dollars and such other currencies. The Sub-Funds may enter intoforward foreign exchange contracts designed to either hedge some or all of this exposure having regard tofactors such as the currency denomination of units issued by the Sub-Funds, or alternatively increase exposureto preferred foreign currencies .
First State Singapore Growth Fund
Market Capitalisation weighted of
MSCI Singapore Indices and
MSCI Malaysia Index
Sub-Funds
Price Risk (continued)
Stewart Investors Global Emerging Markets Leaders Fund
MSCI AC World Index
The disclosure above is shown in absolute terms. Changes and impacts could be positive or negative.
Currency risk is the risk that the fair value of future cash flows of a financial instrument will fluctuate because ofchanges in foreign exchange rates.
Benchmark
Components
Market risk (continued)
Stewart Investors Worldwide Leaders Fund
MSCI Emerging
Markets Index
127

First State Global Growth Funds
(Constituted under a Trust Deed in the Republic of Singapore)
NOTES TO THE FINANCIAL STATEMENTS
For the financial year ended 31 December 2018
9. Financial risk management (continued)
a.
(ii) Currency Risk (continued)
USD SGD Total
S$ S$ S$
ASSETS
Portfolio of investments 20,194,146 - 20,194,146Other receivables 90,141 32,286 122,427Cash and bank balances 16,356 136,288 152,644Total assets 20,300,643 168,574 20,469,217
LIABILITIES
Other payables - 79,417 79,417Total liabilities - 79,417 79,417
20,300,643 89,157
USD SGD Total
S$ S$ S$
ASSETS
Portfolio of investments 25,925,431 - 25,925,431Other receivables 114,448 95,279 209,727Cash and bank balances 70,709 86,907 157,616Total assets 26,110,588 182,186 26,292,774
LIABILITIES
Other payables - 104,396 104,396Total liabilities - 104,396 104,396
26,110,588 77,790
First State Asia Opportunities Fund
As at 31 December 2017
Market risk (continued)
SGD Equivalent
The table below summarises the Sub-Funds' exposure to key foreign currencies from its monetary and non-monetary assets and liabilities.
SGD Equivalent
Currency exposure
Currency exposure
As at 31 December 2018
128

First State Global Growth Funds
(Constituted under a Trust Deed in the Republic of Singapore)
NOTES TO THE FINANCIAL STATEMENTS
For the financial year ended 31 December 2018
9. Financial risk management (continued)
a.
(ii) Currency Risk (continued)
USD SGD Total
S$ S$ S$
ASSETS
Portfolio of investments 58,935,513 - 58,935,513Sales awaiting settlement 107,677 - 107,677Other receivables 226,812 78,984 305,796Cash and bank balances 1,363 277,779 279,142Total assets 59,271,365 356,763 59,628,128
LIABILITIES
- 213,265 213,265Total liabilities - 213,265 213,265
59,271,365 143,498
USD SGD Total
S$ S$ S$
ASSETS
Portfolio of investments 69,628,091 - 69,628,091Sales awaiting settlement 225,852 - 225,852Other receivables 263,055 274,519 537,574Cash and bank balances 150,078 340,354 490,432Total assets 70,267,076 614,873 70,881,949
LIABILITIES
Purchases awaiting settlement 118,940 - 118,940Other payables 626,054 626,054Total liabilities 118,940 626,054 744,994
70,148,136 (11,181)
Market risk (continued)
Currency exposure
SGD Equivalent
First State Asian Growth Fund
As at 31 December 2018
Currency exposure
As at 31 December 2017
Other payables
SGD Equivalent
129

First State Global Growth Funds
(Constituted under a Trust Deed in the Republic of Singapore)
NOTES TO THE FINANCIAL STATEMENTS
For the financial year ended 31 December 2018
9. Financial risk management (continued)
a.
(ii) Currency Risk (continued)
USD SGD Total
S$ S$ S$
ASSETS
Portfolio of investments 8,761,364 - 8,761,364Sales awaiting settlement 58,609 - 58,609Other receivables 23,665 16,385 40,050Cash and bank balances 7,779 62,209 69,988Total assets 8,851,417 78,594 8,930,011
LIABILITIES
Other payables - 86,931 86,931Total liabilities - 86,931 86,931Notional value of forward
foreign exchange contracts (8,826,413) 8,931,61325,004 8,923,276
USD SGD Total
S$ S$ S$
ASSETS
Portfolio of investments 13,581,671 - 13,581,671Sales awaiting settlement 74,838 - 74,838Other receivables 35,169 26,176 61,345Cash and bank balances 73,184 251,146 324,330Total assets 13,764,862 277,322 14,042,184
LIABILITIES
Purchases awaiting settlement 243,225 - 243,225Other payables - 181,957 181,957Total liabilities 243,225 181,957 425,182Notional value of forward
foreign exchange contracts (13,406,232) 13,607,509115,405 13,702,874
As at 31 December 2017
SGD Equivalent
First State Asian Quality Bond
As at 31 December 2018
Currency exposure
Market risk (continued)
SGD Equivalent
Currency exposure
130

First State Global Growth Funds
(Constituted under a Trust Deed in the Republic of Singapore)
NOTES TO THE FINANCIAL STATEMENTS
For the financial year ended 31 December 2018
9. Financial risk management (continued)
a.
(ii) Currency Risk (continued)
USD SGD Total
S$ S$ S$
ASSETS
Portfolio of investments 1,678,640,545 - 1,678,640,545Other receivables 5,263,247 6,183,417 11,446,664Cash and bank balances 1,441,495 24,741 1,466,236Total assets 1,685,345,287 6,208,158 1,691,553,445
LIABILITIES
Purchases awaiting settlement 1,679,216 - 1,679,216- 5,571,429 5,571,429
Distribution payable - 248,589 248,589Total liabilities 1,679,216 5,820,018 7,499,234Notional value of forward
foreign exchange contracts (853,410,591) 859,426,361830,255,480 859,814,501
USD SGD Total
S$ S$ S$
ASSETS
Portfolio of investments 1,468,842,320 - 1,468,842,320Other receivables 4,563,613 9,675,533 14,239,146Cash and bank balances 1,199,472 2,451,089 3,650,561Total assets 1,474,605,405 12,126,622 1,486,732,027
LIABILITIES
Purchases awaiting settlement 4,646,663 - 4,646,663Other payables - 5,678,149 5,678,149Total liabilities 4,646,663 5,678,149 10,324,812Notional value of forward
foreign exchange contracts (705,850,514) 715,414,130764,108,228 721,862,603
As at 31 December 2017
SGD Equivalent
SGD Equivalent
Other payables
Market risk (continued)
First State Bridge
Currency exposure
Currency exposure
As at 31 December 2018
131

First State Global Growth Funds
(Constituted under a Trust Deed in the Republic of Singapore)
NOTES TO THE FINANCIAL STATEMENTS
For the financial year ended 31 December 2018
9. Financial risk management (continued)
a.
(ii) Currency Risk (continued)
USD SGD Total
S$ S$ S$
ASSETS
Portfolio of investments 2,488,484,007 - 2,488,484,007Other receivables 10,647,657 10,057,310 20,704,967Cash and bank balances 170,681 1,786,682 1,957,363Total assets 2,499,302,345 11,843,992 2,511,146,337
LIABILITIES
Distribution payable - 25,025,822 25,025,822Purchases awaiting settlement 3,756,428 - 3,756,428
383,820 7,052,693 7,436,513Total liabilities 4,140,248 32,078,515 36,218,763
2,495,162,097 (20,234,523)
USD SGD Total
S$ S$ S$
ASSETS
Portfolio of investments 2,109,778,598 - 2,109,778,598Other receivables 11,154,630 11,703,672 22,858,302Cash and bank balances 985,411 3,504,217 4,489,628Total assets 2,121,918,639 15,207,889 2,137,126,528
LIABILITIES
Distribution payable - 21,275,784 21,275,784Purchases awaiting settlement 8,523,559 - 8,523,559Other payables 632,820 9,124,750 9,757,570Total liabilities 9,156,379 30,400,534 39,556,913
2,112,762,260 (15,192,645)
As at 31 December 2017
As at 31 December 2018
Currency exposure
Other payables
First State Dividend Advantage
Market risk (continued)
Currency exposure
SGD Equivalent
SGD Equivalent
132

First State Global Growth Funds
(Constituted under a Trust Deed in the Republic of Singapore)
NOTES TO THE FINANCIAL STATEMENTS
For the financial year ended 31 December 2018
9. Financial risk management (continued)
a.
(ii) Currency Risk (continued)
USD SGD Total
S$ S$ S$
ASSETS
Portfolio of investments 17,207,136 - 17,207,136Other receivables 57,018 9,480 66,498Cash and bank balances 1,363 203,706 205,069Total assets 17,265,517 213,186 17,478,703
LIABILITIES
Purchases awaiting settlement 122,670 - 122,670- 61,475 61,475
Total liabilities 122,670 61,475 184,14517,142,847 151,711
USD SGD Total
S$ S$ S$
ASSETS
Portfolio of investments 18,214,126 - 18,214,126Other receivables 59,311 27,393 86,704Cash and bank balances 1,337 59,196 60,533Total assets 18,274,774 86,589 18,361,363
LIABILITIES
- 51,546 51,546Total liabilities - 51,546 51,546
18,274,774 35,043
Currency exposure
Currency exposure
Other payables
SGD Equivalent
First State Global Balanced Fund
As at 31 December 2017
Other payables
SGD Equivalent
As at 31 December 2018
Market risk (continued)
133

First State Global Growth Funds
(Constituted under a Trust Deed in the Republic of Singapore)
NOTES TO THE FINANCIAL STATEMENTS
For the financial year ended 31 December 2018
9. Financial risk management (continued)
a.
(ii) Currency Risk (continued)
GBP SGD USD Total
S$ S$ S$ S$
ASSETS
Portfolio of investments 10,542,741 - - 10,542,741Sales awaiting settlement 39,926 39,926Other receivables 41,244 8,404 49,648Cash and bank balances 33,705 277,798 1,363 312,866Total assets 10,657,616 286,202 1,363 10,945,181
LIABILITIES
Other payables - 74,042 - 74,042Total liabilities - 74,042 - 74,042
10,657,616 212,160 1,363
GBP SGD USD Total
S$ S$ S$ S$
ASSETS
Portfolio of investments 14,881,756 - - 14,881,756Other receivables 58,499 18,362 198,957 275,818Cash and bank balances 43,568 396,305 1,336 441,209Total assets 14,983,823 414,667 200,293 15,598,783
LIABILITIES
Purchases awaiting settlement 310,944 310,944Other payables - 61,400 - 61,400Total liabilities 310,944 61,400 - 372,344
14,672,879 353,267 200,293
First State Global Infrastructure
As at 31 December 2017
Currency exposure
Market risk (continued)
SGD Equivalent
Currency exposure
As at 31 December 2018
SGD Equivalent
134

First State Global Growth Funds
(Constituted under a Trust Deed in the Republic of Singapore)
NOTES TO THE FINANCIAL STATEMENTS
For the financial year ended 31 December 2018
9. Financial risk management (continued)
a.
(ii) Currency Risk (continued)
First State Global Property Investments
USD SGD Total
S$ S$ S$
ASSETS
14,666,142 - 14,666,142242,614 - 242,614
63,558 86,754 150,3121,363 - 1,363
Total assets 14,973,677 86,754 15,060,431
LIABILITIES
Bank overdraft - 143,466 143,466- 125,922 125,922
Total liabilities - 269,388 269,388Currency exposure 14,973,677 (182,634)
As at 31 December 2017
USD SGD Total
S$ S$ S$
ASSETS
Portfolio of investments 26,688,222 - 26,688,222Other receivables 98,409 205,890 304,299Cash and bank balances 8,018 275,378 283,396Total assets 26,794,649 481,268 27,275,917
LIABILITIES
Purchases awaiting settlement 187,096 - 187,096Other payables - 99,194 99,194Total liabilities 187,096 99,194 286,290Currency exposure 26,607,553 382,074
Other receivables
Other payables
SGD Equivalent
Sales awaiting settlement
SGD Equivalent
Cash and bank balances
Market risk (continued)
Portfolio of investments
As at 31 December 2018
135

First State Global Growth Funds
(Constituted under a Trust Deed in the Republic of Singapore)
NOTES TO THE FINANCIAL STATEMENTS
For the financial year ended 31 December 2018
9. Financial risk management (continued)
a.
(ii) Currency Risk (continued)
First State Regional China Fund
USD SGD Total
S$ S$ S$
ASSETS
Portfolio of investments 434,734,947 - 434,734,947Sales awaiting settlement 346,202 - 346,202Other receivables 1,725,501 836,773 2,562,274Cash and bank balances 107,004 268,763 375,767Total assets 436,913,654 1,105,536 438,019,190
LIABILITIES
2,725 1,221,938 1,224,663Total liabilities 2,725 1,221,938 1,224,663
436,910,929 (116,402)
USD SGD Total
S$ S$ S$
ASSETS
Portfolio of investments 488,861,929 - 488,861,929Sales awaiting settlement 466,404 - 466,404Other receivables 1,879,995 2,915,965 4,795,960Cash and bank balances 112,291 412,095 524,386Total assets 491,320,619 3,328,060 494,648,679
LIABILITIES
Purchases awaiting settlement 1,282,944 - 1,282,944Other payables - 2,574,506 2,574,506Total liabilities 1,282,944 2,574,506 3,857,450
490,037,675 753,554
Market risk (continued)
Other payables
Currency exposure
As at 31 December 2018
SGD Equivalent
Currency exposure
As at 31 December 2017
SGD Equivalent
136

First State Global Growth Funds
(Constituted under a Trust Deed in the Republic of Singapore)
NOTES TO THE FINANCIAL STATEMENTS
For the financial year ended 31 December 2018
9. Financial risk management (continued)
a.
(ii) Currency Risk (continued)
First State Regional India Fund
USD SGD Total
S$ S$ S$
ASSETS
Portfolio of investments 105,784,335 - 105,784,335Other receivables 449,084 301,765 750,849Cash and bank balances 272,834 223,422 496,256Total assets 106,506,253 525,187 107,031,440
LIABILITIES
- 306,677 306,677Total liabilities - 306,677 306,677
106,506,253 218,510
USD SGD Total
S$ S$ S$
ASSETS
Portfolio of investments 109,326,493 - 109,326,493Other receivables 533,226 763,586 1,296,812Cash and bank balances 2,167 697,874 700,041Total assets 109,861,886 1,461,460 111,323,346
LIABILITIES
Purchases awaiting settlement 558,615 - 558,615Other payables - 355,013 355,013Total liabilities 558,615 355,013 913,628
109,303,271 1,106,447
Currency exposure
SGD Equivalent
As at 31 December 2017
Currency exposure
As at 31 December 2018
SGD Equivalent
Other payables
Market risk (continued)
137
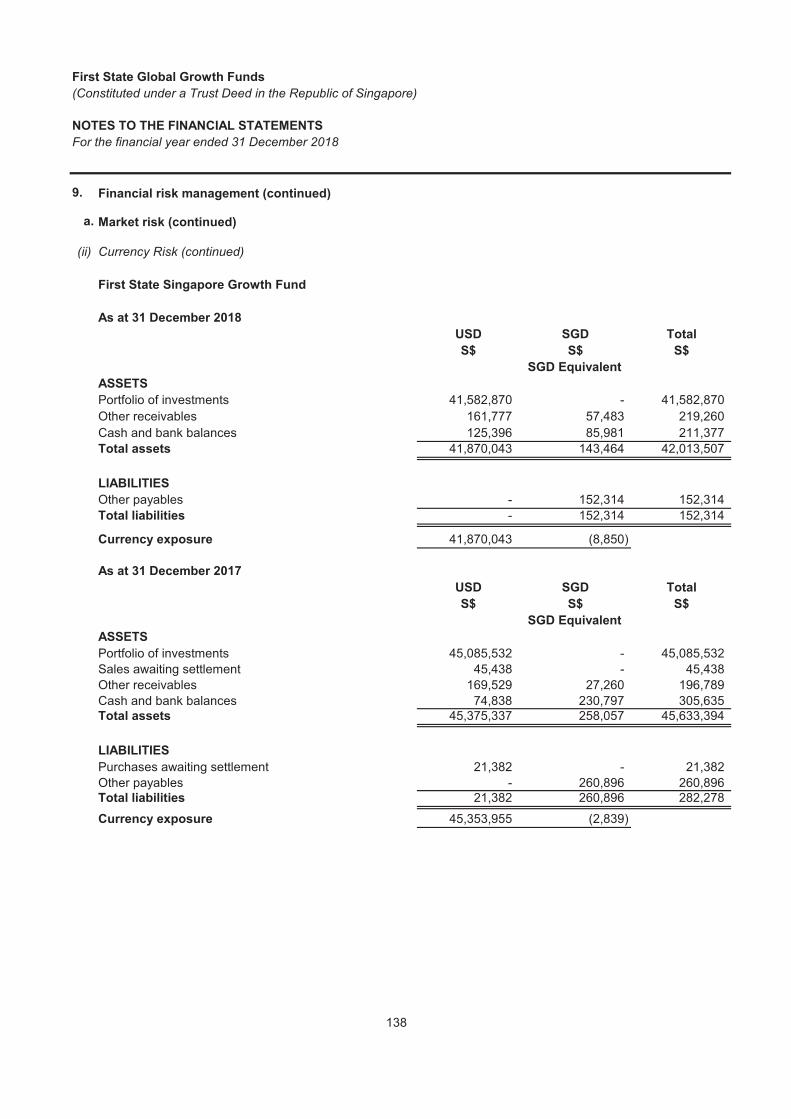
First State Global Growth Funds
(Constituted under a Trust Deed in the Republic of Singapore)
NOTES TO THE FINANCIAL STATEMENTS
For the financial year ended 31 December 2018
9. Financial risk management (continued)
a.
(ii) Currency Risk (continued)
First State Singapore Growth Fund
USD SGD Total
S$ S$ S$
ASSETS
Portfolio of investments 41,582,870 - 41,582,870Other receivables 161,777 57,483 219,260Cash and bank balances 125,396 85,981 211,377Total assets 41,870,043 143,464 42,013,507
LIABILITIES
- 152,314 152,314Total liabilities - 152,314 152,314
41,870,043 (8,850)
USD SGD Total
S$ S$ S$
ASSETS
Portfolio of investments 45,085,532 - 45,085,532Sales awaiting settlement 45,438 - 45,438Other receivables 169,529 27,260 196,789Cash and bank balances 74,838 230,797 305,635Total assets 45,375,337 258,057 45,633,394
LIABILITIES
Purchases awaiting settlement 21,382 - 21,382Other payables - 260,896 260,896Total liabilities 21,382 260,896 282,278
45,353,955 (2,839)
SGD Equivalent
As at 31 December 2018
Currency exposure
As at 31 December 2017
Market risk (continued)
Currency exposure
Other payables
SGD Equivalent
138
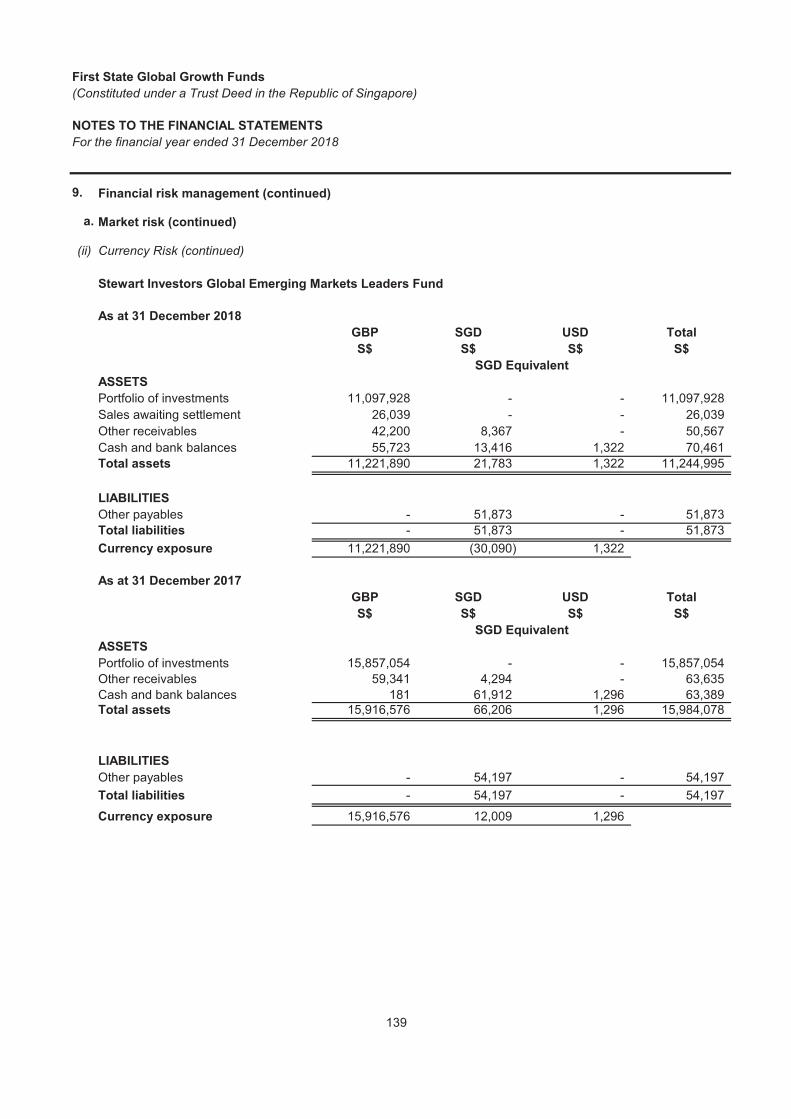
First State Global Growth Funds
(Constituted under a Trust Deed in the Republic of Singapore)
NOTES TO THE FINANCIAL STATEMENTS
For the financial year ended 31 December 2018
9. Financial risk management (continued)
a.
(ii) Currency Risk (continued)
Stewart Investors Global Emerging Markets Leaders Fund
GBP SGD USD Total
S$ S$ S$ S$
ASSETS
Portfolio of investments 11,097,928 - - 11,097,928Sales awaiting settlement 26,039 - - 26,039Other receivables 42,200 8,367 - 50,567Cash and bank balances 55,723 13,416 1,322 70,461Total assets 11,221,890 21,783 1,322 11,244,995
LIABILITIES
- 51,873 - 51,873Total liabilities - 51,873 - 51,873
11,221,890 (30,090) 1,322
GBP SGD USD Total
S$ S$ S$ S$
ASSETS
Portfolio of investments 15,857,054 - - 15,857,054Other receivables 59,341 4,294 - 63,635Cash and bank balances 181 61,912 1,296 63,389Total assets 15,916,576 66,206 1,296 15,984,078
LIABILITIES
Other payables - 54,197 - 54,197Total liabilities - 54,197 - 54,197
15,916,576 12,009 1,296Currency exposure
As at 31 December 2018
Currency exposure
As at 31 December 2017
Market risk (continued)
Other payables
SGD Equivalent
SGD Equivalent
139

First State Global Growth Funds
(Constituted under a Trust Deed in the Republic of Singapore)
NOTES TO THE FINANCIAL STATEMENTS
For the financial year ended 31 December 2018
9. Financial risk management (continued)
a.
(ii) Currency Risk (continued)
Stewart Investors Worldwide Leaders Fund
USD SGD Total
S$ S$ S$
ASSETS
Portfolio of investments 23,801,481 - 23,801,481Sales awaiting settlement 27,260 - 27,260Other receivables 93,407 164,373 257,780Cash and bank balances 1,363 157,193 158,556Total assets 23,923,511 321,566 24,245,077
LIABILITIES
Purchases awaiting settlement 54,520 - 54,520- 122,252 122,252
Total liabilities 54,520 122,252 176,77223,868,991 199,314
USD SGD Total
S$ S$ S$
ASSETS
Portfolio of investments 26,171,910 - 26,171,910Other receivables 97,291 105,763 203,054Cash and bank balances 1,336 162,986 164,322Total assets 26,270,537 268,749 26,539,286
LIABILITIES
Purchases awaiting settlement 36,083 - 36,083Other payables - 121,345 121,345Total liabilities 36,083 121,345 157,428
26,234,454 147,404
Other payables
As at 31 December 2018
Currency exposure
SGD Equivalent
As at 31 December 2017
Market risk (continued)
Currency exposure
SGD Equivalent
140
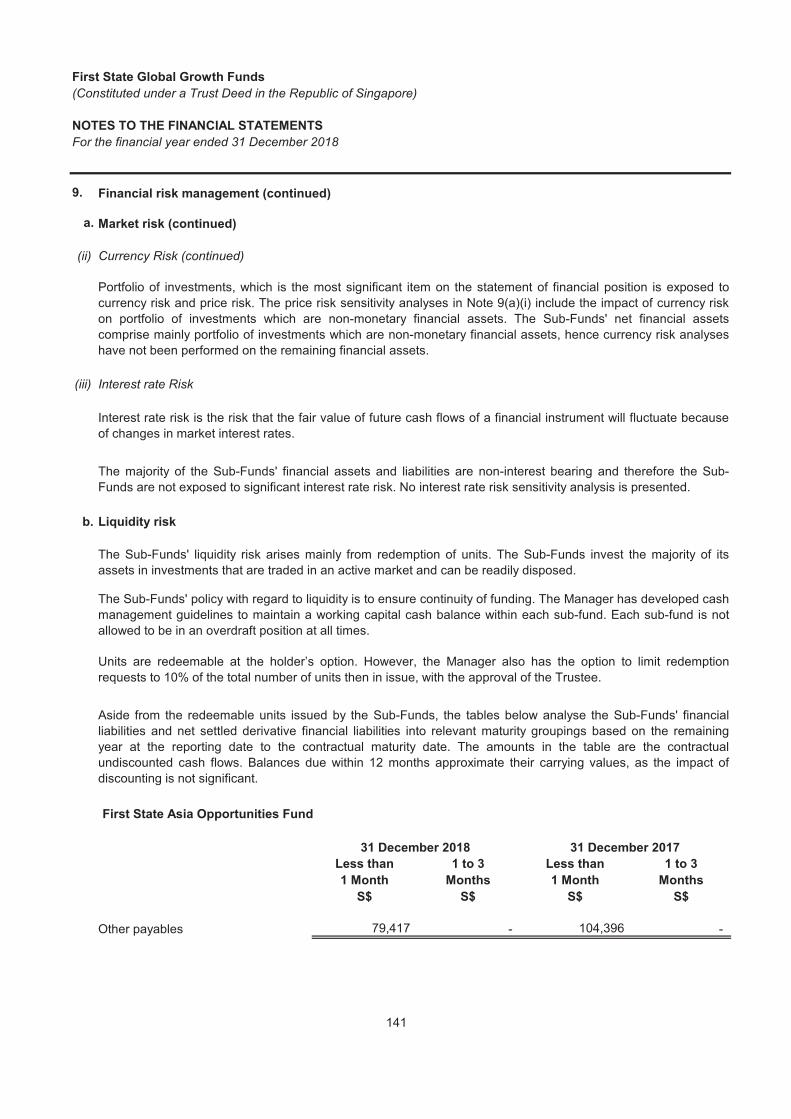
First State Global Growth Funds
(Constituted under a Trust Deed in the Republic of Singapore)
NOTES TO THE FINANCIAL STATEMENTS
For the financial year ended 31 December 2018
9. Financial risk management (continued)
a.
(ii) Currency Risk (continued)
(iii) Interest rate Risk
b. Liquidity risk
First State Asia Opportunities Fund
Less than 1 to 3 Less than 1 to 3
1 Month Months 1 Month Months
S$ S$ S$ S$
79,417 - 104,396 -
The Sub-Funds' policy with regard to liquidity is to ensure continuity of funding. The Manager has developed cashmanagement guidelines to maintain a working capital cash balance within each sub-fund. Each sub-fund is notallowed to be in an overdraft position at all times.
Interest rate risk is the risk that the fair value of future cash flows of a financial instrument will fluctuate becauseof changes in market interest rates.
Aside from the redeemable units issued by the Sub-Funds, the tables below analyse the Sub-Funds' financialliabilities and net settled derivative financial liabilities into relevant maturity groupings based on the remainingyear at the reporting date to the contractual maturity date. The amounts in the table are the contractualundiscounted cash flows. Balances due within 12 months approximate their carrying values, as the impact ofdiscounting is not significant.
The Sub-Funds' liquidity risk arises mainly from redemption of units. The Sub-Funds invest the majority of itsassets in investments that are traded in an active market and can be readily disposed.
31 December 2018
The majority of the Sub-Funds' financial assets and liabilities are non-interest bearing and therefore the Sub-Funds are not exposed to significant interest rate risk. No interest rate risk sensitivity analysis is presented.
31 December 2017
Units are redeemable at the holder’s option. However, the Manager also has the option to limit redemptionrequests to 10% of the total number of units then in issue, with the approval of the Trustee.
Other payables
Portfolio of investments, which is the most significant item on the statement of financial position is exposed tocurrency risk and price risk. The price risk sensitivity analyses in Note 9(a)(i) include the impact of currency riskon portfolio of investments which are non-monetary financial assets. The Sub-Funds' net financial assetscomprise mainly portfolio of investments which are non-monetary financial assets, hence currency risk analyseshave not been performed on the remaining financial assets.
Market risk (continued)
141

First State Global Growth Funds
(Constituted under a Trust Deed in the Republic of Singapore)
NOTES TO THE FINANCIAL STATEMENTS
For the financial year ended 31 December 2018
9. Financial risk management (continued)
b. Liquidity risk (continued)
First State Asian Growth Fund
Less than 1 to 3 Less than 1 to 3
1 Month Months 1 Month Months
S$ S$ S$ S$
- - 118,940 - 213,265 - 626,054 -
First State Asian Quality Bond
Less than 1 to 3 Less than 1 to 3
1 Month Months 1 Month Months
S$ S$ S$ S$
Purchases awaiting settlement - - 243,225 - 86,931 - 181,957 -
First State Bridge
Less than 1 to 3 Less than 1 to 3
1 Month Months 1 Month Months
S$ S$ S$ S$
248,589 - - - 1,679,216 - 4,646,663 - 5,571,429 - 5,678,149 -
First State Dividend Advantage
Less than 1 to 3 Less than 1 to 3
1 Month Months 1 Month Months
S$ S$ S$ S$
25,025,822 - 21,275,784 - 3,756,428 - 8,523,559 - 7,436,513 - 9,757,570 -
First State Global Balanced Fund
Less than 1 to 3 Less than 1 to 3
1 Month Months 1 Month Months
S$ S$ S$ S$
122,670 - - - 61,475 - 51,546 -
31 December 2017
31 December 2017
Purchases awaiting settlementOther payables
31 December 2017
31 December 2018
Purchases awaiting settlement
31 December 2018
31 December 2018
Other payables
Other payables
Purchases awaiting settlementOther payables
Distribution payable
Purchases awaiting settlement
31 December 201731 December 2018
31 December 2018
31 December 2017
Other payables
Distribution payable
142

First State Global Growth Funds
(Constituted under a Trust Deed in the Republic of Singapore)
NOTES TO THE FINANCIAL STATEMENTS
For the financial year ended 31 December 2018
9. Financial risk management (continued)
b. Liquidity risk (continued)
First State Global Infrastructure
Less than 1 to 3 Less than 1 to 3
1 Month Months 1 Month Months
S$ S$ S$ S$
- - 310,944 - 74,042 - 61,400 -
First State Global Property Investments
Less than 1 to 3 Less than 1 to 3
1 Month Months 1 Month Months
S$ S$ S$ S$
143,466 - - - - - 187,096 -
Other payables 125,922 - 99,194 -
First State Regional China Fund
Less than 1 to 3 Less than 1 to 3
1 Month Months 1 Month Months
S$ S$ S$ S$
- - 1,282,944 - 1,224,663 - 2,574,506 -
First State Regional India Fund
Less than 1 to 3 Less than 1 to 3
1 Month Months 1 Month Months
S$ S$ S$ S$
Purchases awaiting settlement - - 558,615 - 306,677 - 355,013 -
31 December 2017
31 December 2018
Purchases awaiting settlement
Other payables
31 December 201731 December 2018
31 December 2018
31 December 2018
Other payablesPurchases awaiting settlement
31 December 2017
31 December 2017
Other payables
Purchases awaiting settlementBank overdraft
143

First State Global Growth Funds
(Constituted under a Trust Deed in the Republic of Singapore)
NOTES TO THE FINANCIAL STATEMENTS
For the financial year ended 31 December 2018
9. Financial risk management (continued)
b. Liquidity risk (continued)
First State Singapore Growth Fund
Less than 1 to 3 Less than 1 to 3
1 Month Months 1 Month Months
S$ S$ S$ S$
- - 21,382 - 152,314 - 260,896 -
Stewart Investors Global Emerging Markets Leaders Fund
Less than 1 to 3 Less than 1 to 3
1 Month Months 1 Month Months
S$ S$ S$ S$
51,873 - 54,197 -
Stewart Investors Worldwide Leaders Fund
Less than 1 to 3 Less than 1 to 3
1 Month Months 1 Month Months
S$ S$ S$ S$
54,520 - 36,083 - 122,252 - 121,345 -
31 December 31 December 31 December 31 December
2018 2017 2018 2017
S$ S$ S$ S$
(865,798) (1,372,342) (10,905,457) (3,358,144) 858,690 1,357,032 10,826,549 3,347,008 (7,108) (15,310) (78,908) (11,136)
First State Asian
Quality Bond
31 December 2018
-Outflow
Net inflow/(outflow)
Less than 3 months
Currency forwards
-Inflow
Other payables
31 December 2018
31 December 2017
31 December 2017
First State Bridge
31 December 2017
Other payables
Purchases awaiting settlement
31 December 2018
The table below analyses the Sub-Fund's derivative financial instruments in a loss position that will be settled ona gross basis into relevant maturity groupings based on the remaining period at the reporting date to thecontractual maturity date. The amounts in the table are the contractual undiscounted cash flows. Balances duewithin 3 months equal their carrying balances, as the impact of discounting is not significant.
Purchases awaiting settlementOther payables
144

First State Global Growth Funds
(Constituted under a Trust Deed in the Republic of Singapore)
NOTES TO THE FINANCIAL STATEMENTS
For the financial year ended 31 December 2018
9. Financial risk management (continued)
c. Credit risk
Concentrations of credit risk are minimised primarily by:
- ensuring counterparties, together with the respective credit limits, are approved,
- ensuring that transactions are undertaken with a large number of counterparties, and
- ensuring that the majority of transactions are undertaken on recognised exchanges.
The Sub-Funds' credit risk exposure arises mainly from portfolio of investments and cash and bank balancesheld with custodians and financial institutions. The maximum exposure to credit risk at the reporting date is thecarrying amount of the financial assets. As at 31 December 2018, all investments are placed in custody withHSBC Institutional Trust Services (Singapore) Limited and UBS AG which had a credit rating of aa- (2017: aa-)and a+ (2017: a+), respectively. There are risks involved in dealing with custodians who settle trades with regardto segregation of assets. It is expected that all investments and other assets deposited with custodians will beclearly identified as being assets of the Sub-Funds; the Sub-Funds should not therefore be exposed to credit riskwith respect to such parties. However, it may not always be possible to achieve this segregation, so the portfolioof the Sub-Funds may experience increased exposure to credit risk associated with the applicable custodian.The custodian of the underlying funds under GUFD and ICVC (the "underlying custodians") is The HongkongShanghai Banking Corporation Limited.
The Sub-Funds take on exposure to credit risk, which is the risk that a counterparty will be unable to pay amountsin full when due, including transactions with counterparties such as issuers, brokers, custodians and banks.Impairment provisions are provided for losses that have been incurred by the reporting date, if any.
All transactions in listed securities and collective investment schemes (underlying funds) are settled or paid upondelivery using approved brokers or the Sub-Funds' dealer. The risk of default is considered minimal, as deliveryof securities is only made once the broker or Sub-Funds' dealer has received payment. Payment is made on apurchase once the securities have been received by the broker or Sub-Funds' dealer. The trade will fail if eitherparty fails to meet its obligation.
As at 31 December 2018, the underlying custodian had a credit rating of aa- (2017: aa-) based on the viability ofFitch.The table below summarises the credit rating of banks with whom each sub-fund's cash and bank balancesare held as at 31 December 2018 and 2017 and other key counterparties, where applicable.
145

First State Global Growth Funds
(Constituted under a Trust Deed in the Republic of Singapore)
NOTES TO THE FINANCIAL STATEMENTS
For the financial year ended 31 December 2018
9. Financial risk management (continued)
c. Credit risk (continued)
First State Asia Opportunities Fund
Credit rating
Source of credit
rating
aa- Fitch
Credit rating
Source of credit
rating
aa- Fitch
First State Asian Growth Fund
Credit rating
Source of credit
rating
aa- Fitch
Credit rating
Source of credit
rating
aa- Fitch
First State Asian Quality Bond
Credit rating
Source of credit
rating
aa- Fitch
Australia & New Zealand Banking Group Limited aa- FitchCitibank NA a Fitch
Credit rating
Source of credit
rating
aa- Fitch
Australia & New Zealand Banking Group Limited aa- FitchCitibank NA a Fitch
As at 31 December 2017
Bank
The Hongkong Shanghai Banking Corporation Limited
The Hongkong Shanghai Banking Corporation Limited
Counterparty-Forward foreign exchange contracts
As at 31 December 2018
Bank
The Hongkong Shanghai Banking Corporation Limited
Bank
As at 31 December 2018
As at 31 December 2017
Bank
Counterparty-Forward foreign exchange contracts
The Hongkong Shanghai Banking Corporation Limited
BankThe Hongkong Shanghai Banking Corporation Limited
The Hongkong Shanghai Banking Corporation Limited
As at 31 December 2017
As at 31 December 2018
Bank
146

First State Global Growth Funds
(Constituted under a Trust Deed in the Republic of Singapore)
NOTES TO THE FINANCIAL STATEMENTS
For the financial year ended 31 December 2018
9. Financial risk management (continued)
c. Credit risk (continued)
First State Bridge
Credit rating
Source of credit
rating
aa- Fitch
Australia & New Zealand Banking Group Limited aa- FitchCitibank NA a FitchUBS AG a+ Fitch
Credit rating
Source of credit
rating
aa- Fitch
Australia & New Zealand Banking Group Limited aa- FitchCitibank NA a FitchUBS AG a+ Fitch
First State Dividend Advantage
Credit rating
Source of credit
rating
aa- Fitch
Credit rating
Source of credit
rating
aa- Fitch
First State Global Balanced Fund
Credit rating
Source of credit
rating
aa- Fitch
Credit rating
Source of credit
rating
aa- Fitch
The Hongkong Shanghai Banking Corporation Limited
BankThe Hongkong Shanghai Banking Corporation Limited
The Hongkong Shanghai Banking Corporation Limited
Bank
Bank
As at 31 December 2018
As at 31 December 2017
The Hongkong Shanghai Banking Corporation Limited
The Hongkong Shanghai Banking Corporation Limited
As at 31 December 2017
Bank
Counterparty-Forward foreign exchange contracts
As at 31 December 2018
Bank
As at 31 December 2017
Counterparty-Forward foreign exchange contracts
BankAs at 31 December 2018
The Hongkong Shanghai Banking Corporation Limited
147

First State Global Growth Funds
(Constituted under a Trust Deed in the Republic of Singapore)
NOTES TO THE FINANCIAL STATEMENTS
For the financial year ended 31 December 2018
9. Financial risk management (continued)
c. Credit risk (continued)
First State Global Infrastructure
Credit rating
Source of credit
rating
aa- Fitch
Credit rating
Source of credit
rating
aa- Fitch
First State Global Property Investments
Credit rating
Source of credit
rating
aa- Fitch
Credit rating
Source of credit
rating
aa- FitchBank
The Hongkong Shanghai Banking Corporation Limited
The Hongkong Shanghai Banking Corporation Limited
As at 31 December 2017
The Hongkong Shanghai Banking Corporation Limited
Bank
As at 31 December 2018
As at 31 December 2017
The Hongkong Shanghai Banking Corporation Limited
Bank
Bank
As at 31 December 2018
148

First State Global Growth Funds
(Constituted under a Trust Deed in the Republic of Singapore)
NOTES TO THE FINANCIAL STATEMENTS
For the financial year ended 31 December 2018
9. Financial risk management (continued)
c. Credit risk (continued)
First State Regional China Fund
Credit rating
Source of credit
rating
aa- Fitch
Credit rating
Source of credit
rating
aa- Fitch
First State Regional India Fund
Credit rating
Source of credit
rating
aa- Fitch
Credit rating
Source of credit
rating
aa- Fitch
First State Singapore Growth Fund
Credit rating
Source of credit
rating
aa- Fitch
Credit rating
Source of credit
rating
aa- FitchBankThe Hongkong Shanghai Banking Corporation Limited
Bank
As at 31 December 2018
Bank
The Hongkong Shanghai Banking Corporation Limited
The Hongkong Shanghai Banking Corporation LimitedBankAs at 31 December 2017
As at 31 December 2018
The Hongkong Shanghai Banking Corporation LimitedBank
Bank
As at 31 December 2017
As at 31 December 2018
As at 31 December 2017
The Hongkong Shanghai Banking Corporation Limited
The Hongkong Shanghai Banking Corporation Limited
149

First State Global Growth Funds
(Constituted under a Trust Deed in the Republic of Singapore)
NOTES TO THE FINANCIAL STATEMENTS
For the financial year ended 31 December 2018
9. Financial risk management (continued)
c. Credit risk (continued)
Stewart Investors Global Emerging Markets Leaders Fund
Credit rating
Source of credit
rating
aa- Fitch
Credit rating
Source of credit
rating
aa- Fitch
Stewart Investors Worldwide Leaders Fund
Credit rating
Source of credit
rating
aa- Fitch
Credit rating
Source of credit
rating
aa- Fitch
d. Capital management
e. Fair value estimation
•
•
•
As at 31 December 2018
The Hongkong Shanghai Banking Corporation Limited
Bank
As at 31 December 2017
Inputs other than quoted prices included within level 1 that are observable for the asset or liability, either directly (that is, as prices) or indirectly (that is, derived from prices) (Level 2).
The Hongkong Shanghai Banking Corporation Limited
Bank
The Sub-Funds' capital is represented by the net assets attributable to unitholders. The Sub-Funds strive toinvest the subscriptions of redeemable participating units in investments that meet the Sub-Funds' investmentobjectives while maintaining sufficient liquidity to meet unitholders' redemptions.
As at 31 December 2017
Bank
Bank
The Sub-Funds' classify fair value measurements using a fair value hierarchy that reflects the significance of theinputs used in making the measurements. The fair value hierarchy has the following levels:
The Hongkong Shanghai Banking Corporation Limited
The Hongkong Shanghai Banking Corporation Limited
Inputs for the asset or liability that are not based on observable market data (that is, unobservable inputs) (Level 3).
Quoted prices (unadjusted) in active markets for identical assets or liabilities (Level 1).
As at 31 December 2018
150

First State Global Growth Funds
(Constituted under a Trust Deed in the Republic of Singapore)
NOTES TO THE FINANCIAL STATEMENTS
For the financial year ended 31 December 2018
9. Financial risk management (continued)
e. Fair value estimation (continued)
First State Asia Opportunities Fund
As at 31 December 2018 Level 1 Level 2 Level 3 Total
$ $ $ $
Assets
Financial assets designated at fair value through profit or loss - Quoted investment fund 20,194,146 - - 20,194,146
20,194,146 - - 20,194,146
As at 31 December 2017 Level 1 Level 2 Level 3 Total
$ $ $ $
Assets
Financial assets designated at fair value through profit or loss - Quoted investment fund 25,925,431 - - 25,925,431
25,925,431 - - 25,925,431
First State Asian Growth Fund
As at 31 December 2018 Level 1 Level 2 Level 3 Total
$ $ $ $
Assets
Financial assets designated at fair value through profit or loss - Quoted investment fund 58,935,513 - - 58,935,513
58,935,513 - - 58,935,513
As at 31 December 2017 Level 1 Level 2 Level 3 Total
$ $ $ $
Assets
Financial assets designated at fair value through profit or loss - Quoted investment fund 69,628,091 - - 69,628,091
69,628,091 - - 69,628,091
The following table analyses within the fair value hierarchy the Sub-Funds' financial assets and liabilities (byclass) measured at fair value at 31 December 2018 and 2017:
151

First State Global Growth Funds
(Constituted under a Trust Deed in the Republic of Singapore)
NOTES TO THE FINANCIAL STATEMENTS
For the financial year ended 31 December 2018
9. Financial risk management (continued)
e. Fair value estimation (continued)
First State Asian Quality Bond
As at 31 December 2018 Level 1 Level 2 Level 3 Total
$ $ $ $
Assets
Financial assets designated at fair value through profit or loss - Quoted investment funds 8,761,364 - - 8,761,364 - Financial derivatives - 112,308 - 112,308
8,761,364 112,308 - 8,873,672
Liabilities
- Financial derivatives - 7,108 - 7,108- 7,108 - 7,108
As at 31 December 2017 Level 1 Level 2 Level 3 Total
$ $ $ $
Assets
Financial assets designated at fair value through profit or loss - Quoted investment funds 13,581,671 - - 13,581,671 - Financial derivatives - 216,587 - 216,587
13,581,671 216,587 - 13,798,258
Liabilities
- Financial derivatives - 15,310 - 15,310- 15,310 - 15,310
First State Bridge
As at 31 December 2018 Level 1 Level 2 Level 3 Total
$ $ $ $
Assets
Financial assets designated at fair value through profit or loss - Quoted investment funds 1,678,640,545 - - 1,678,640,545 - Financial derivatives - 6,094,678 - 6,094,678
1,678,640,545 6,094,678 - 1,684,735,223
Liabilities
- Financial derivatives - 78,908 - 78,908- 78,908 - 78,908
152

First State Global Growth Funds
(Constituted under a Trust Deed in the Republic of Singapore)
NOTES TO THE FINANCIAL STATEMENTS
For the financial year ended 31 December 2018
9. Financial risk management (continued)
e. Fair value estimation (continued)
First State Bridge
As at 31 December 2017 Level 1 Level 2 Level 3 Total
$ $ $ $
Assets
Financial assets designated at fair value through profit or loss - Quoted investment funds 1,468,842,320 - - 1,468,842,320 - Financial derivatives - 9,574,752 - 9,574,752
1,468,842,320 9,574,752 - 1,478,417,072
Liabilities
- Financial derivatives - 11,136 - 11,136- 11,136 - 11,136
First State Dividend Advantage
As at 31 December 2018 Level 1 Level 2 Level 3 Total
$ $ $ $
Assets
Financial assets designated at fair value through profit or loss - Quoted investment fund 2,488,484,007 - - 2,488,484,007
2,488,484,007 - - 2,488,484,007
As at 31 December 2017 Level 1 Level 2 Level 3 Total
$ $ $ $
Assets
Financial assets designated at fair value through profit or loss - Quoted investment fund 2,109,778,598 - - 2,109,778,598
2,109,778,598 - - 2,109,778,598
First State Global Balanced Fund
As at 31 December 2018 Level 1 Level 2 Level 3 Total
$ $ $ $
Assets
Financial assets designated at fair value through profit or loss - Quoted investment funds 17,207,136 - - 17,207,136
17,207,136 - - 17,207,136
153

First State Global Growth Funds
(Constituted under a Trust Deed in the Republic of Singapore)
NOTES TO THE FINANCIAL STATEMENTS
For the financial year ended 31 December 2018
9. Financial risk management (continued)
e. Fair value estimation (continued)
First State Global Balanced Fund
As at 31 December 2017 Level 1 Level 2 Level 3 Total
$ $ $ $
Assets
Financial assets designated at fair value through profit or loss - Quoted investment funds 18,214,126 - - 18,214,126
18,214,126 - - 18,214,126
First State Global Infrastructure
As at 31 December 2018 Level 1 Level 2 Level 3 Total
$ $ $ $
Assets
Financial assets designated at fair value through profit or loss - Quoted investment fund 10,542,741 - - 10,542,741
10,542,741 - - 10,542,741
As at 31 December 2017 Level 1 Level 2 Level 3 Total
$ $ $ $
Assets
Financial assets designated at fair value through profit or loss - Quoted investment fund 14,881,756 - - 14,881,756
14,881,756 - - 14,881,756
First State Global Property Investments
As at 31 December 2018 Level 1 Level 2 Level 3 Total
$ $ $ $
Assets
Financial assets designated at fair value through profit or loss - Quoted investment fund 14,666,142 - - 14,666,142
14,666,142 - - 14,666,142
As at 31 December 2017 Level 1 Level 2 Level 3 Total
$ $ $ $
Assets
Financial assets designated at fair value through profit or loss - Quoted investment fund 26,688,222 - - 26,688,222
26,688,222 - - 26,688,222
154

First State Global Growth Funds
(Constituted under a Trust Deed in the Republic of Singapore)
NOTES TO THE FINANCIAL STATEMENTS
For the financial year ended 31 December 2018
9. Financial risk management (continued)
e. Fair value estimation (continued)
First State Regional China Fund
As at 31 December 2018 Level 1 Level 2 Level 3 Total
$ $ $ $
Assets
Financial assets designated at fair value through profit or loss - Quoted investment fund 434,734,947 - - 434,734,947
434,734,947 - - 434,734,947
As at 31 December 2017 Level 1 Level 2 Level 3 Total
$ $ $ $
Assets
Financial assets designated at fair value through profit or loss - Quoted investment fund 488,861,929 - - 488,861,929
488,861,929 - - 488,861,929
First State Regional India Fund
As at 31 December 2018 Level 1 Level 2 Level 3 Total
$ $ $ $
Assets
Financial assets designated at fair value through profit or loss - Quoted investment fund 105,784,335 - - 105,784,335
105,784,335 - - 105,784,335
155

First State Global Growth Funds
(Constituted under a Trust Deed in the Republic of Singapore)
NOTES TO THE FINANCIAL STATEMENTS
For the financial year ended 31 December 2018
9. Financial risk management (continued)
e. Fair value estimation (continued)
First State Regional India Fund
As at 31 December 2017 Level 1 Level 2 Level 3 Total
$ $ $ $
Assets
Financial assets designated at fair value through profit or loss - Quoted investment fund 109,326,493 - - 109,326,493
109,326,493 - - 109,326,493
First State Singapore Growth Fund
As at 31 December 2018 Level 1 Level 2 Level 3 Total
$ $ $ $
Assets
Financial assets designated at fair value through profit or loss - Quoted investment fund 41,582,870 - - 41,582,870
41,582,870 - - 41,582,870
As at 31 December 2017 Level 1 Level 2 Level 3 Total
$ $ $ $
Assets
Financial assets designated at fair value through profit or loss - Quoted investment fund 45,085,532 - - 45,085,532
45,085,532 - - 45,085,532
Stewart Investors Global Emerging Markets Leaders Fund
As at 31 December 2018 Level 1 Level 2 Level 3 Total
$ $ $ $
Assets
Financial assets designated at fair value through profit or loss - Quoted investment fund 11,097,928 - - 11,097,928
11,097,928 - - 11,097,928
As at 31 December 2017 Level 1 Level 2 Level 3 Total
$ $ $ $
Assets
Financial assets designated at fair value through profit or loss - Quoted investment fund 15,857,054 - - 15,857,054
15,857,054 - - 15,857,054
156

First State Global Growth Funds
(Constituted under a Trust Deed in the Republic of Singapore)
NOTES TO THE FINANCIAL STATEMENTS
For the financial year ended 31 December 2018
9. Financial risk management (continued)
e. Fair value estimation (continued)
Stewart Investors Worldwide Leaders Fund
As at 31 December 2018 Level 1 Level 2 Level 3 Total
$ $ $ $
Assets
Financial assets designated at fair value through profit or loss - Quoted investment fund 23,801,481 - - 23,801,481
23,801,481 - - 23,801,481
As at 31 December 2017 Level 1 Level 2 Level 3 Total
$ $ $ $
Assets
Financial assets designated at fair value through profit or loss - Quoted investment fund 26,171,910 - - 26,171,910
26,171,910 - - 26,171,910
f. Offsetting financial assets and financial liabilities
Except for cash and cash equivalents which are classified as Level 1, the Sub-Funds' assets and liabilities notmeasured at fair value at 31 December 2018 and 2017 have been classified as Level 2. The carrying amounts ofthese assets and liabilities approximate their fair values as at the end of reporting date.
The following tables present the Sub-Funds’ financial assets and liabilities subject to offsetting, enforceablemaster netting arrangements or similar agreements.
Financial derivatives that trade in markets that are not considered to be active but are valued based on quotedmarket prices, dealer quotations or alternative pricing sources supported by observable inputs are classifiedwithin Level 2.
Investments in listed equities whose values are based on quoted market prices in active markets are classifiedwithin Level 1. Investments in open-ended investment funds whose net asset value is struck daily, priceinformation is published and readily available and units are subscribed and redeemable on demand at thepublished price, are classified within Level 1. The Sub-Funds do not adjust the quoted price for theseinstruments.
157

First State Global Growth Funds
(Constituted under a Trust Deed in the Republic of Singapore)
NOTES TO THE FINANCIAL STATEMENTS
For the financial year ended 31 December 2018
9. Financial risk management (continued)
f. Offsetting financial assets and financial liabilities (continued)
First State Asian Quality Bond
As at 31 December 2018
Gross
amounts of
recognised
financial
assets
Net amounts of
financial assets
presented in the
Statements of
Financial
Position
Financial
instruments
Cash
collateral Net amount
S$ S$ S$ S$ S$
112,308 112,308 - - 112,308
Gross
amounts of
recognised
financial
liabilities
Net amounts of
financial liabilities
presented in the
Statements of
Financial
Position
Financial
instruments
Cash
collateral Net amount
S$ S$ S$ S$ S$
6,799 6,799 - - 6,799
Gross amounts
of recognised
financial
liabilities set-
off in the
Statements of
Financial
Position
Related amounts not set-off
in the Statements of
Financial Position
Forward foreign
exchange -
S$
The gross and net positions of financial assets and liabilities that have been offset in the Statements of FinancialPosition are disclosed in the first three columns of the tables below.
Forward foreign
exchange -
Gross amounts
of recognised
financial assets
set-off in the
Statements of
Financial
Position
S$
Related amounts not set-off
in the Statements of
Financial Position
158

First State Global Growth Funds
(Constituted under a Trust Deed in the Republic of Singapore)
NOTES TO THE FINANCIAL STATEMENTS
For the financial year ended 31 December 2018
9. Financial risk management (continued)
f. Offsetting financial assets and financial liabilities (continued)
First State Asian Quality Bond
As at 31 December 2017
Gross
amounts of
recognised
financial
assets
Net amounts of
financial assets
presented in the
Statements of
Financial
Position
Financial
instruments
Cash
collateral Net amount
S$ S$ S$ S$ S$
216,587 216,587 - - 216,587
Gross
amounts of
recognised
financial
liabilities
Net amounts of
financial liabilities
presented in the
Statements of
Financial
Position
Financial
instruments
Cash
collateral Net amount
S$ S$ S$ S$ S$
15,310 15,310 - - 15,310
Forward foreign
exchange -
Gross amounts
of recognised
financial
liabilities set-
off in the
Statements of
Financial
Position
S$
Related amounts not set-off
in the Statements of
Financial Position
Gross amounts
of recognised
financial assets
set-off in the
Statements of
Financial
Position
S$
Forward foreign
exchange -
Related amounts not set-off
in the Statements of
Financial Position
159

First State Global Growth Funds
(Constituted under a Trust Deed in the Republic of Singapore)
NOTES TO THE FINANCIAL STATEMENTS
For the financial year ended 31 December 2018
9. Financial risk management (continued)
f. Offsetting financial assets and financial liabilities (continued)
First State Bridge
As at 31 December 2018
Gross
amounts of
recognised
financial
assets
Net amounts of
financial assets
presented in the
Statements of
Financial
Position
Financial
instruments
Cash
collateral Net amount
S$ S$ S$ S$ S$
3,302,514 3,302,514 - - 3,302,514
Gross
amounts of
recognised
financial
liabilities
Net amounts of
financial liabilities
presented in the
Statements of
Financial
Position
Financial
instruments
Cash
collateral Net amount
S$ S$ S$ S$ S$
77,308 77,308 - - 77,308
Forward foreign
exchange -
Gross amounts
of recognised
financial assets
set-off in the
Statements of
Financial
Position
S$
Related amounts not set-off
in the Statements of
Financial Position
Gross amounts
of recognised
financial
liabilities set-
off in the
Statements of
Financial
Position
Related amounts not set-off
in the Statements of
Financial Position
S$
Forward foreign
exchange -
160

First State Global Growth Funds
(Constituted under a Trust Deed in the Republic of Singapore)
NOTES TO THE FINANCIAL STATEMENTS
For the financial year ended 31 December 2018
9. Financial risk management (continued)
f. Offsetting financial assets and financial liabilities (continued)
First State Bridge
As at 31 December 2017
Gross
amounts of
recognised
financial
assets
Net amounts of
financial assets
presented in the
Statements of
Financial
Position
Financial
instruments
Cash
collateral Net amount
S$ S$ S$ S$ S$
9,574,752 9,574,752 (3,472) - 9,571,280
Gross
amounts of
recognised
financial
liabilities
Net amounts of
financial liabilities
presented in the
Statements of
Financial
Position
Financial
instruments
Cash
collateral Net amount
S$ S$ S$ S$ S$
11,136 11,136 (3,472) - 7,664
Related amounts not set-off
in the Statements of
Financial Position
Gross amounts
of recognised
financial
liabilities set-
off in the
Statements of
Financial
Position
-
Forward foreign
exchange -
Related amounts not set-off
in the Statements of
Financial Position
Forward foreign
exchange
S$
Gross amounts
of recognised
financial assets
set-off in the
Statements of
Financial
Position
S$
161

First State Global Growth Funds
(Constituted under a Trust Deed in the Republic of Singapore)
NOTES TO THE FINANCIAL STATEMENTS
For the financial year ended 31 December 2018
10. Interests in unconsolidated structured entities
The exposure to investments in the Underlying Sub-Funds at fair value is disclosed under the Statements ofPortfolio. These investments are included within “Portfolio of investments” in the Statement of Financial Position.
The Sub-Funds’ holdings in the Underlying Sub-Fund, as a percentage of the Underlying Sub-Fund total netasset value, will vary from time to time dependent on the volume of subscriptions and redemptions at theUnderlying Sub-Fund level. It is possible that the Sub-Funds may, at any point in time, hold a majority of anUnderlying Sub-Fund's total units in issue.
The Sub-Funds’ maximum exposure to loss from its interests in the Underlying Sub-Funds is equal to the total fairvalue of its investments in the Underlying Sub-Funds.
The Sub-Funds’ investment in the Underlying Sub-Fund is subject to the terms and conditions of the respectiveUnderlying Sub-Fund's offering documentation and is susceptible to market price risk arising from uncertaintiesabout future values of the Underlying Sub-Fund. The Manager makes investment decisions after extensive duediligence of each Underlying Sub-Fund, its investment strategies and the overall quality of the Underlying Sub-Fund's manager. The Underlying Sub-Funds in the investment portfolio are managed by portfolio managers whoare compensated by the respective Underlying Sub-Fund for their services. Such compensation generallyconsists of an asset based fee and is reflected in the valuation of the Sub-Funds’ investments in each of theUnderlying Sub-Fund.
The Sub-Funds have right to request redemption of its investments in the Underlying Sub-Fund on a daily basis.
Once the Sub-Funds have disposed of its shares in any of the Underlying Sub-Funds, the Sub-Funds ceases tobe exposed to any risk from it.
162

First State Global Growth Funds
(Constituted under a Trust Deed in the Republic of Singapore)
NOTES TO THE FINANCIAL STATEMENTS
For the financial year ended 31 December 2018
11. Related party transactions
2018 2017 2018 2017
S$ S$ S$ S$
152,644 157,616 279,142 490,432
Bank service fees charged by a related party of the Trustee 9,720 8,936 13,852 13,600
- - - (8,622)#
#
Bank balances with a related party of the Trustee
First State Asia
Opportunities Fund First State Asian Growth Fund
Expense ratio rebate for the fund manager is presented in the Statement of Total Return within"Management fee rebate".
Expense ratio rebate from the fund manager
In addition to related party transactions shown elsewhere in the financial statements, including management feescharged by the Manager, management fee rebates received from the Underlying Sub-Fund's Manager, trustee'sfees charged by the Trustee and registration fees charged by a related company of the Trustee, the significanttransactions that took place during the financial year between the Sub-Funds and related parties and significantbalances with related parties at the end of the financial year, at terms agreed between the parties and within theprovisions of the Trust Deed, are as follows:
The Manager of the Sub-Funds is First State Investments (Singapore). The Trustee is HSBC Institutional TrustServices (Singapore) Limited, a subsidiary of the HSBC Group.
163

First State Global Growth Funds
(Constituted under a Trust Deed in the Republic of Singapore)
NOTES TO THE FINANCIAL STATEMENTS
For the financial year ended 31 December 2018
11. Related party transactions (continued)
2018 2017 2018 2017
S$ S$ S$ S$
69,988 324,330 1,466,236 3,650,561
Bank service fees charged by a related party of the Trustee 5,321 4,719 29,815 27,419
Interest income from a related party of - - (16,026) (2,420)
2018 2017 2018 2017
S$ S$ S$ S$
1,957,363^ 4,489,628^ 205,069 60,533
Bank service fees charged by a related party of the Trustee 124,545 124,209 7,204 4,103
Interest income from a related party of the Trustee (45,048) (11,906) - -
2018 2017 2018 2017
S$ S$ S$ S$
312,866* 441,209* (142,103)^ 283,396^
Bank service fees charged by a related party of the Trustee 6,263 9,359 7,570 15,037
Interest income from a related party of (1,653) (347) - -
*
^
SGD USDDIVA 2,500,000.00 1,576,734.41 GLPR 500,000.00 315,346.88
the Trustee
First State Global Balanced Fund
First State Global Property
Investments
As at 31 December 2018, bank balances include fixed deposit with a related party of the Trustee ofS$243,704 (2017: S$228,901), which has a maturity of 4 months (2017: 4 months) from the end of thefinancial year with effective interest rate of 0.20 % (2017: 0.20%).
First State Bridge
First State
Dividend Advantage
the Trustee
Bank balances with a related party of the Trustee
First State Asian
Quality Bond
Bank balances with a related party of the Trustee
First State Global Infrastructure
Bank balances with a related party of the Trustee
DIVA and GLPR have the following credit facilities with a related party of the Trustee. The sub-funds havenot utilised the overdraft facility (in SGD or USD) as at 31 December 2018, except for GLPR which has bankoverdraft of S$143,466 (2017: S$Nil).
164

First State Global Growth Funds
(Constituted under a Trust Deed in the Republic of Singapore)
NOTES TO THE FINANCIAL STATEMENTS
For the financial year ended 31 December 2018
11. Related party transactions (continued)
2018 2017 2018 2017
S$ S$ S$ S$
375,767 524,386 496,256 700,041
Bank service fees charged by a related party of the Trustee 51,688 42,445 20,905 21,517
2018 2017 2018 2017
S$ S$ S$ S$
211,377 305,635 70,461^ 63,389^
Bank service fees chargedby a related party of the Trustee 7,315 7,444 2,370 3,299
2018 2017
S$ S$
158,556 164,322
Bank service fees chargedby a related party of the Trustee 11,457 12,371
^
GBP SGD USDGEML 83,036.96 200,000.00 126,138.75
GEML has the following credit facilities with a related party of the Trustee. The sub-fund has not utilised theoverdraft facility (in SGD or USD or GBP) as at 31 December 2018.
First State Singapore Growth
Fund
Bank balances with a related party of the Trustee
Bank balances with a related party of the Trustee
First State Regional China Fund First State Regional India Fund
Bank balances with a related party of the Trustee
Stewart Investors Global
Emerging Markets
Leaders Fund
Stewart Investors Worldwide
Leaders Fund
165

First State Global Growth Funds
(Constituted under a Trust Deed in the Republic of Singapore)
NOTES TO THE FINANCIAL STATEMENTS
For the financial year ended 31 December 2018
12. Financial ratios
2018 2017 2018 2017
% % % %
Expense ratio1 2.25 2.27 1.53 1.51
Turnover ratio2 5.95 9.98 5.95 9.98
2018 2017 2018 2017
% % % %
Expense ratio1 1.73 1.75 1.55 1.48
Turnover ratio2 7.05 8.38 12.16 414.15
2018 2017 2018 2017
% % % %
Expense ratio1 1.44 1.43 1.71 1.71
Turnover ratio2 198.63 632.18 367.96 1,220.20
2018 2017 2018 2017
% % % %
Expense ratio1 1.75 1.71 1.91 1.93
Turnover ratio2 17.26 5.30 11.44 989.78
2018 2017 2018 2017
% % % %
Expense ratio1 1.97 1.97 1.71 1.71
Turnover ratio2 134.75 217.34 10.07 6.36
First State Global Balanced Fund
First State Global Property
Investments
Class A - Accumulation Class B - Accumulation
First State
Dividend Advantage
First State Asian Growth Fund
First State Regional China Fund
First State Global Infrastructure
First State Bridge
First State Asia Opportunities Fund
First State Asian
Quality Bond
166

First State Global Growth Funds
(Constituted under a Trust Deed in the Republic of Singapore)
NOTES TO THE FINANCIAL STATEMENTS
For the financial year ended 31 December 2018
12. Financial ratios (continued)
2018 2017 2018 2017
% % % %
Expense ratio1 2.06 2.06 1.90 1.89
Turnover ratio2 16.30 15.53 2.63 3.58
2018 2017 2018 2017
% % % %
Expense ratio1 1.88 1.84 1.93 1.96
Turnover ratio2 23.29 22.82 8.09 15.50
1.
2018 2017 2018 2017
Total operating expenses (annualised in S$56,644 S$74,848 S$ (1,748) S$ (7,867)accordance with IMAS guidelines)Average daily net asset value S$21,710,028 S$24,119,838 S$379,715 S$1,772,389Weighted average of the underlying funds' unaudited expense ratio 1.99% 1.96% 1.99% 1.96%
Total operating expenses, average net asset value of the Sub-Funds and weighted average of the Underlying Funds’ unaudited expenseratio are as below:
Class A Class B
Stewart Investors Worldwide
Leaders Fund
The unaudited expense ratio of the Underlying Funds are obtained from the Underlying Funds’ Manager.
The expense ratios have been computed based on the guidelines laid down by the Investment Management Association of Singapore("IMAS"). This is the sum of the Sub-Funds' expense ratio and the weighted average of the underlying funds’ unaudited expense ratio.
Stewart Investors Global
Emerging Markets
Leaders Fund
First State Asia Opportunities Fund
The calculation of the Sub-Funds' expense ratios at financial year end was based on total operating expenses divided by the average netasset value respectively for the year. The total operating expenses do not include (where applicable) brokerage and other transactioncosts, performance fee, interest expense, distribution paid out to unitholders, foreign exchange gains/losses, front or back end loadsarising from the purchase or sale of other funds and tax deducted at source or arising out of income received. The Sub-Funds do not payany performance fee. The average net asset value is based on the published daily balances.
First State Singapore Growth
Fund First State Regional India Fund
167

First State Global Growth Funds
(Constituted under a Trust Deed in the Republic of Singapore)
NOTES TO THE FINANCIAL STATEMENTS
For the financial year ended 31 December 2018
12. Financial ratios (continued)
2018 2017 2018 2017
Total operating expenses (annualised in S$90,470 S$113,717 S$51,548 S$54,269accordance with IMAS guidelines)Average daily net asset value S$65,341,857 S$70,430,857 S$10,744,655 S$13,142,710Weighted average of the underlying funds' unaudited expense ratio 1.59% 1.59% 1.07% 1.06%
2018 2017 2018 2017
Total operating expenses S$1,725,156 S$1,463,228 S$2,915,740 S$2,390,155Average daily net asset value S$1,582,727,406 S$1,353,440,807 S$2,379,432,194 S$2,001,981,662Weighted average of the underlying funds' unaudited expense ratio 1.33% 1.32% 1.59% 1.59%
2018 2017 2018 2017
Total operating expenses S$47,214 S$38,125 S$55,694 S$59,522
Average daily net asset value S$18,044,691 S$18,522,178 S$12,760,619 S$15,181,813Weighted average of the underlying funds' unaudited expense ratio 1.49% 1.50% 1.47% 1.52%
2018 2017 2018 2017
Total operating expenses S$53,679 S$78,354 S$611,987 S$538,266
Average daily net asset value S$20,691,144 S$25,152,895 S$486,991,919 S$436,915,496Weighted average of the underlying funds' unaudited expense ratio 1.71% 1.66% 1.58% 1.58%
First State Asian Growth Fund
First State
Dividend Advantage First State Bridge
First State Global Property Investments
First State Asian
Quality Bond
First State Global Infrastructure First State Global Balanced Fund
First State Regional China Fund
168

First State Global Growth Funds
(Constituted under a Trust Deed in the Republic of Singapore)
NOTES TO THE FINANCIAL STATEMENTS
For the financial year ended 31 December 2018
12. Financial ratios (continued)
2018 2017 2018 2017
Total operating expenses S$185,070 S$171,179 S$81,704 S$79,078Average daily net asset value S$107,433,032 S$91,303,036 S$45,380,235 S$45,702,051Weighted average of the underlying funds' unaudited expense ratio 1.89% 1.87% 1.72% 1.72%
2018 2017 2018 2017
Total operating expenses S$45,259 S$44,492 S$70,541 S$67,423Average daily net asset value S$13,457,771 S$16,331,785 S$25,838,206 S$25,615,024Weighted average of the underlying funds' unaudited expense ratio 1.54% 1.56% 1.66% 1.70%
2
2018 2017 2018 2017
S$ S$ S$ S$
Total value of purchases or sales of the underlying investments 1,314,450 2,584,373 4,609,230 5,900,337Average daily net asset value 22,089,742 25,894,023 65,341,857 70,430,857
2018 2017 2018 2017
S$ S$ S$ S$
Total value of purchases or sales of the underlying investments 1,306,059 54,431,026 3,143,723,652 8,556,137,332Average daily net asset value 10,744,655 13,142,710 1,582,727,406 1,353,440,807
2018 2017 2018 2017
S$ S$ S$ S$
Total value of purchases or sales of the underlying investments 8,755,450,707 24,428,155,272 3,115,308 980,959Average daily net asset value 2,379,432,194 2,001,981,662 18,044,691 18,522,178
The portfolio turnover ratios are calculated in accordance with the formula stated in the Code on Collective Investment Schemes. Thecalculation of the portfolio turnover ratio was based on the lower of the total value of purchases or sales of the underlying investmentsdivided by the average daily net asset value is based on the published daily balances respectively as below:
First State Global Balanced Fund
First State Bridge
First State
Dividend Advantage
Stewart Investors Worldwide
Leaders Fund
First State Asia
Opportunities Fund
Stewart Investors Global Emerging
Markets Leaders Fund
First State Regional India Fund
First State Asian Growth Fund
First State Asian
Quality Bond
First State Singapore Growth Fund
169

First State Global Growth Funds
(Constituted under a Trust Deed in the Republic of Singapore)
NOTES TO THE FINANCIAL STATEMENTS
For the financial year ended 31 December 2018
12. Financial ratios (continued)
2018 2017 2018 2017
S$ S$ S$ S$
Total value of purchases or sales of the underlying investments 1,460,376 150,266,492 27,881,339 54,667,708Average daily net asset value 12,760,619 15,181,813 20,691,144 25,152,895
2018 2017 2018 2017
S$ S$ S$ S$
Total value of purchases or sales of the underlying investments 49,025,054 27,784,464 17,507,067 14,180,563Average daily net asset value 486,991,919 436,915,496 107,433,032 91,303,036
2018 2017 2018 2017
S$ S$ S$ S$
Total value of purchases or sales of the underlying investments 1,194,470 1,634,353 3134937.68# 3727054#
Average daily net asset value 45,380,235 45,702,051 13,457,771 16,331,785
2018 2017
S$ S$
Total value of purchases or sales of the underlying investments 2,090,980 3,971,014Average daily net asset value 25,838,206 25,615,024
# There were no purchases during the financial year ended 31 December 2018 and 2017. Therefore, the total value of sales is used in the calculation of portfolio turnover ratio.
First State Global Infrastructure First State Global Property Investments
First State Regional India Fund
Stewart Investors Global Emerging Markets
Leaders FundFirst State Singapore Growth Fund
First State Regional China Fund
Stewart Investors Worldwide
Leaders Fund
170


First State Investments (Singapore)38 Beach Road#06-11 South Beach TowerSingapore 189767
Telephone: +65 6538 0008Facsimile: +65 6538 0800www.firststateinvestments.com Company registration number: 196900420D
First State Investments (Singapore)38 Beach Road#06-11 South Beach TowerSingapore 189767
Telephone: +65 6538 0008Facsimile: +65 6538 0800www.firststateinvestments.com Company registration number: 196900420D
First State Global Growth Funds
2018 Annual Report