first stakeholder round table - european commission · · 2016-07-15current market situation 2010...
TRANSCRIPT

First Stakeholder Round Table:
Contribution RRM group to Session 3:„Methodology and Partners
for Market Pillar“Dietrich Wittmeyer, ERRMA
1
1. Role and function of RRM Group
2. 2002 Report “Current Situation and future prospectives of EU-Industry using RRM”
3. Update 2012
4. New Template 2013
5. Summary
2
1.Role and Function of RRM Group1.Role and Function of RRM Group
3
• Establishment of RRM Group 2001 by DG Enterprise and Industry
• Objective: Providing the expertise of EU industry for the wider use of renewable materials
• Members are national agencies (ERRMA), EU-based companies, institutes

4
• Organisation of EU-RRM-Group: − Chairmanship and secretariat 2001-2006: DG
Enterprise and Industry
− 2006 until today: chairmanship and secretariat with ERRMA (Wittmeyer)
• Report prepared on request of DG Enterprise: "Current Situation and Future Prospects of EU Industry using Renewable Raw Materials" in February 2002.
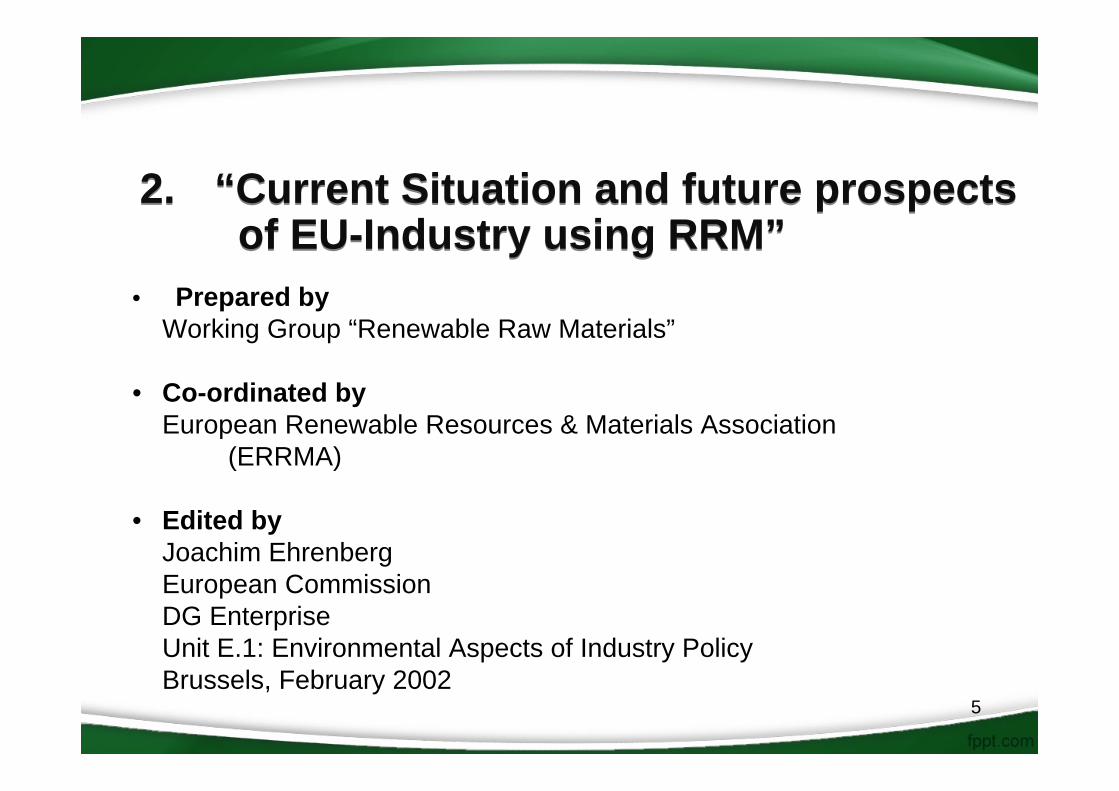
2. “Current Situation and future prospects of EU-Industry using RRM”
2. “Current Situation and future prospects of EU-Industry using RRM”
5
• Prepared byWorking Group “Renewable Raw Materials”
• Co-ordinated byEuropean Renewable Resources & Materials Association
(ERRMA)
• Edited byJoachim EhrenbergEuropean CommissionDG EnterpriseUnit E.1: Environmental Aspects of Industry PolicyBrussels, February 2002
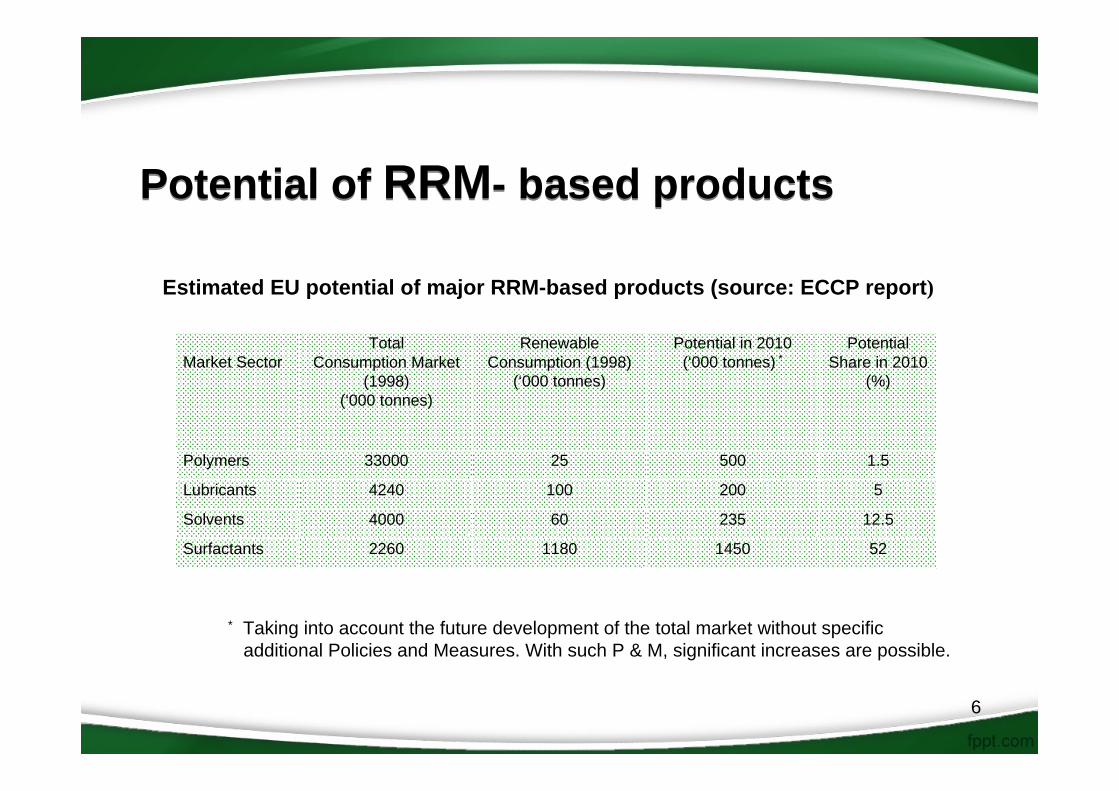
Potential of RRM- based productsPotential of RRM- based products
6
Market SectorTotal
Consumption Market (1998)
(‘000 tonnes)
Renewable Consumption (1998)
(‘000 tonnes)
Potential in 2010(‘000 tonnes) *
Potential Share in 2010
(%)
Polymers 33000 25 500 1.5
Lubricants 4240 100 200 5
Solvents 4000 60 235 12.5
Surfactants 2260 1180 1450 52
Estimated EU potential of major RRM-based products (source: ECCP report)
* Taking into account the future development of the total market without specificadditional Policies and Measures. With such P & M, significant increases are possible.
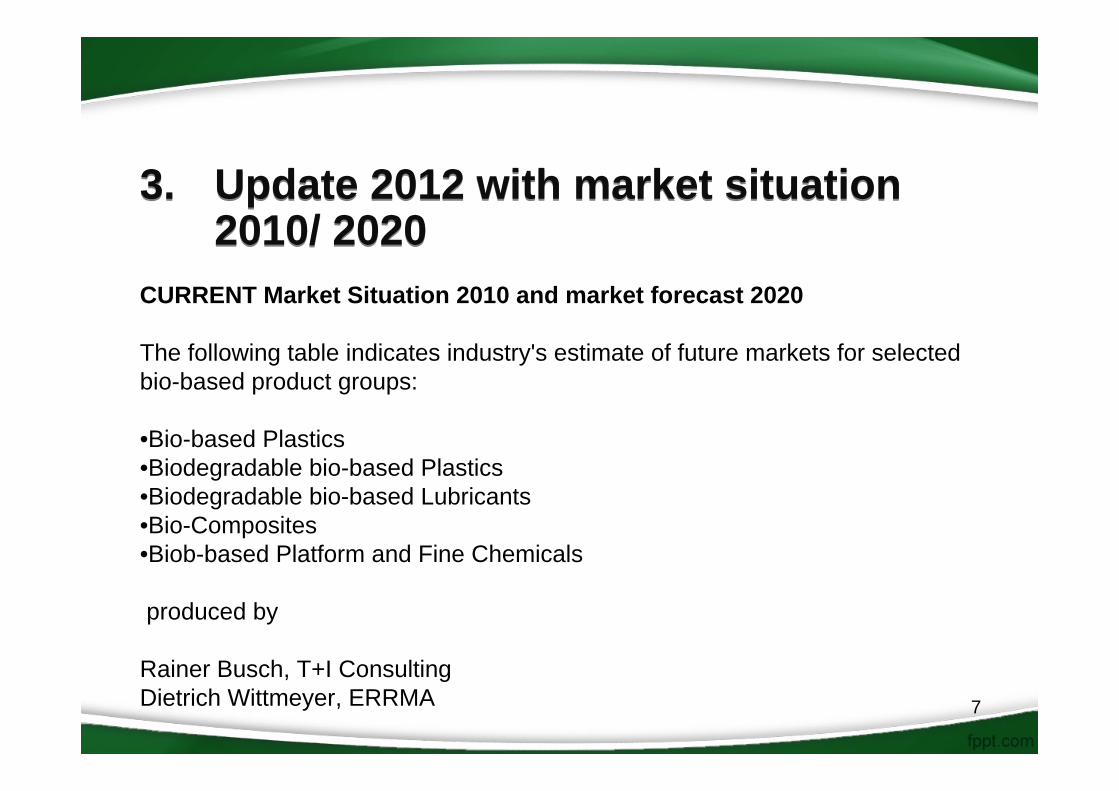
3. Update 2012 with market situation 2010/ 2020
3. Update 2012 with market situation 2010/ 2020
7
CURRENT Market Situation 2010 and market forecast 2020
The following table indicates industry's estimate of future markets for selected bio-based product groups:
•Bio-based Plastics•Biodegradable bio-based Plastics•Biodegradable bio-based Lubricants •Bio-Composites•Biob-based Platform and Fine Chemicals
produced by
Rainer Busch, T+I ConsultingDietrich Wittmeyer, ERRMA

4. Template 2013
• Structure of biomass flow and updated market data for most promising biobased platform chemicals, materials and biobased products
4. Template 2013
• Structure of biomass flow and updated market data for most promising biobased platform chemicals, materials and biobased products
8

5. Summary
9
• ERRMA is a founding member of EU PPP Bioindustries.• The members of the RRM group are well prepared to
contribute to the Bioeconomy Observatory cooperating with JRC since the beginning of 2013
• ERRMA‘s close coopreration with National RRM Agencies, important EU- RRM Federations and Sector Groups of CEFIC guarantee a close contact to markets for biomass flows
Biobased Products Value Chain- Feedstocks, Products & Markets -
Dietrich Wittmeyer, ERRMARainer Busch, T+I Consulting
Results of the presentation and contributions of EU federations, companies and institutes, November 2013
11
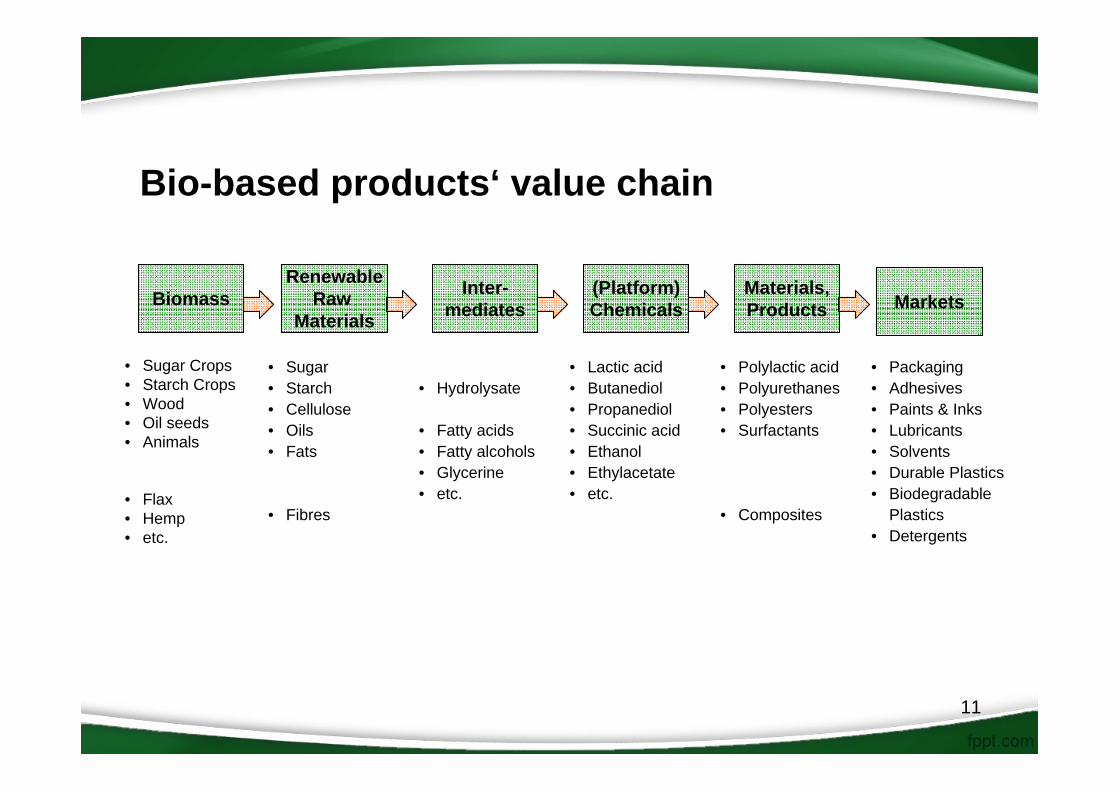
Biomass Inter-mediates
RenewableRaw
Materials
(Platform)Chemicals
Materials,Products
• Sugar Crops• Starch Crops• Wood• Oil seeds• Animals
• Flax• Hemp• etc.
• Sugar• Starch• Cellulose• Oils• Fats
• Fibres
Bio-based products‘ value chain
• Polylactic acid• Polyurethanes• Polyesters• Surfactants
• Composites
• Hydrolysate
• Fatty acids• Fatty alcohols• Glycerine• etc.
• Lactic acid• Butanediol• Propanediol• Succinic acid• Ethanol• Ethylacetate• etc.
Markets
• Packaging• Adhesives• Paints & Inks• Lubricants• Solvents• Durable Plastics• Biodegradable
Plastics• Detergents

Production & Trade data available of
•Sugar•Starch•Cellulosic Materials•Plant Oils•Animal Fats•Biobased Platform Chemicals
•Markets
12

13
SugarStarchCellulosic MaterialsPlant OilsAnimal FatsBiobased Platform Chemicals
Markets
14
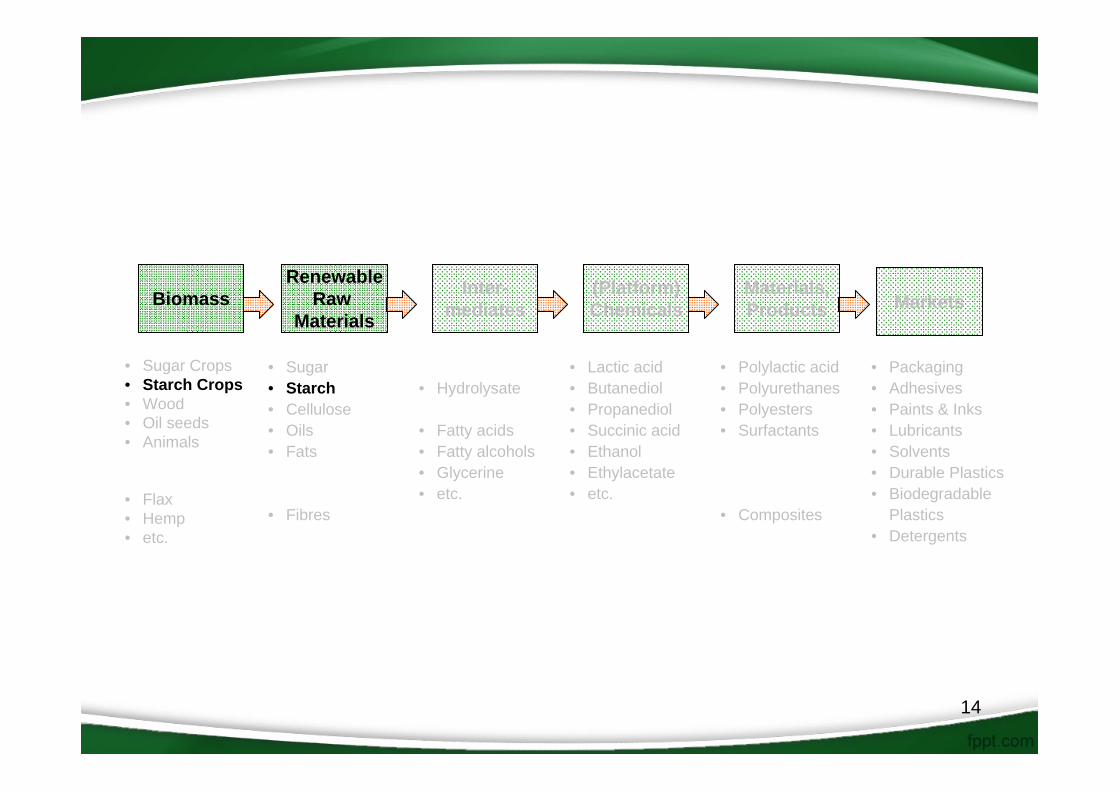
Biomass Inter-mediates
RenewableRaw
Materials
(Platform)Chemicals
Materials,Products
• Sugar Crops• Starch Crops• Wood• Oil seeds• Animals
• Flax• Hemp• etc.
• Sugar• Starch• Cellulose• Oils• Fats
• Fibres
• Polylactic acid• Polyurethanes• Polyesters• Surfactants
• Composites
• Hydrolysate
• Fatty acids• Fatty alcohols• Glycerine• etc.
• Lactic acid• Butanediol• Propanediol• Succinic acid• Ethanol• Ethylacetate• etc.
Markets
• Packaging• Adhesives• Paints & Inks• Lubricants• Solvents• Durable Plastics• Biodegradable
Plastics• Detergents

EU-27 Cereals ProductionSource: DG AGRI
15
Feedstock 2010/2011 2011/2012 2012/2013 (est.) 2020 (est.)
Wheat 135,5 136,9 132 146Maize 57,2 68,6 58,1 73,6Barley 52,4 51,3 54,1 55,5Oats 7,4 7,7 7,8 -Rye 7,3 6,7 8,6 -Triticale 10,5 9,9 9,8 -Rice 1,8 1,9 1,9 1,8Others 4,1 4,3 5,4 30,4
Total Cereals 276,2 287,3 277,7
Potatoes 57,5 - - -
Production of Cereals (million tonnes)
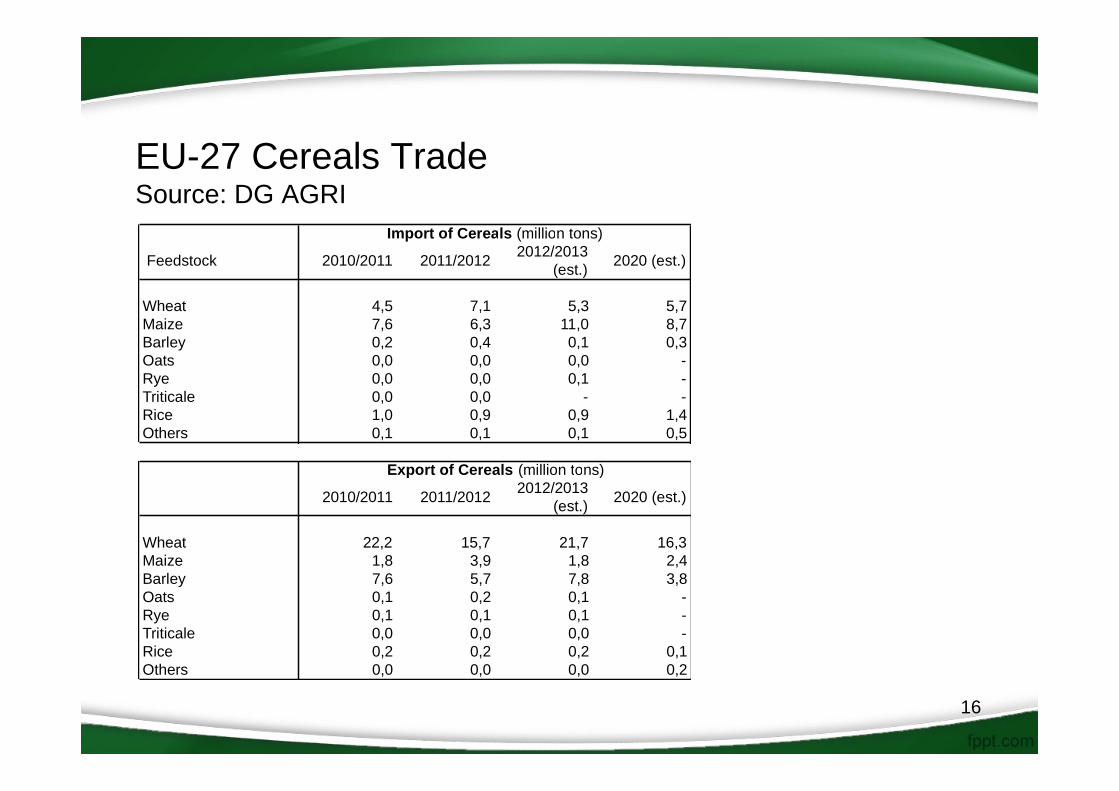
EU-27 Cereals TradeSource: DG AGRI
16
Feedstock 2010/2011 2011/2012 2012/2013 (est.) 2020 (est.)
Wheat 4,5 7,1 5,3 5,7Maize 7,6 6,3 11,0 8,7Barley 0,2 0,4 0,1 0,3Oats 0,0 0,0 0,0 -Rye 0,0 0,0 0,1 -Triticale 0,0 0,0 - -Rice 1,0 0,9 0,9 1,4Others 0,1 0,1 0,1 0,5
Import of Cereals (million tons)
2010/2011 2011/2012 2012/2013 (est.) 2020 (est.)
Wheat 22,2 15,7 21,7 16,3Maize 1,8 3,9 1,8 2,4Barley 7,6 5,7 7,8 3,8Oats 0,1 0,2 0,1 -Rye 0,1 0,1 0,1 -Triticale 0,0 0,0 0,0 -Rice 0,2 0,2 0,2 0,1Others 0,0 0,0 0,0 0,2
Export of Cereals (million tons)
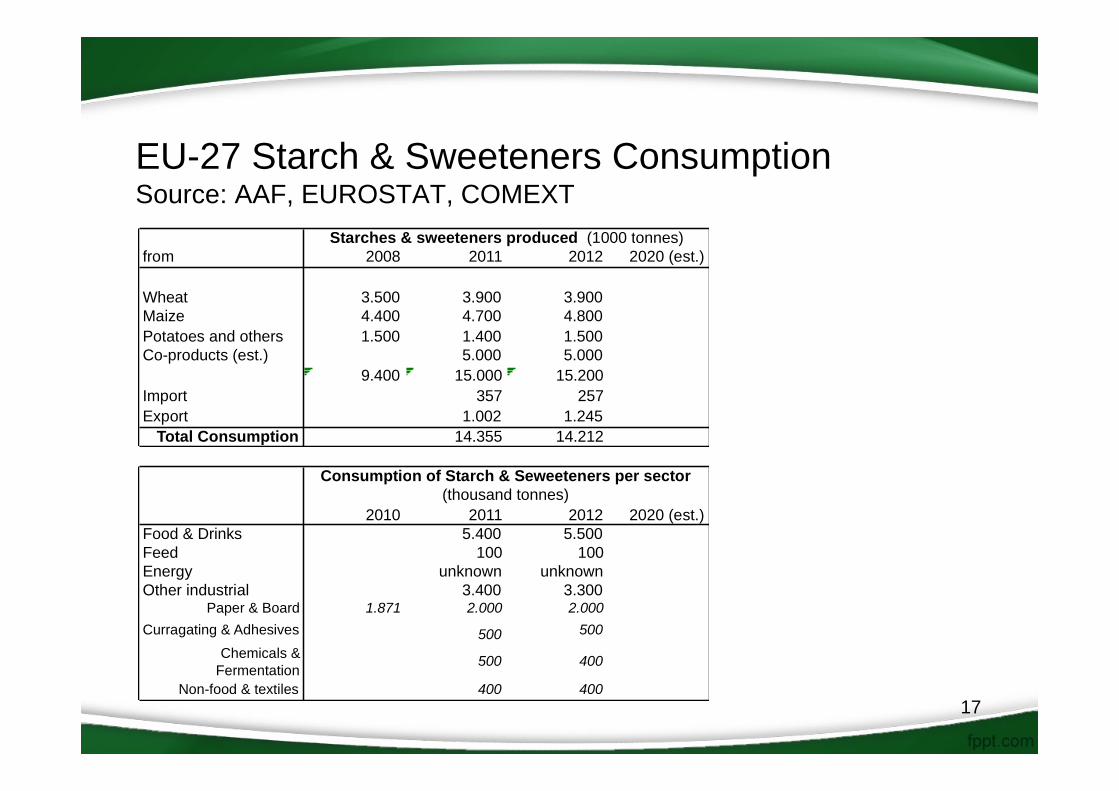
EU-27 Starch & Sweeteners ConsumptionSource: AAF, EUROSTAT, COMEXT
17
from 2008 2011 2012 2020 (est.)
Wheat 3.500 3.900 3.900Maize 4.400 4.700 4.800Potatoes and others 1.500 1.400 1.500Co-products (est.) 5.000 5.000
9.400 15.000 15.200Import 357 257Export 1.002 1.245
Total Consumption 14.355 14.212
Starches & sweeteners produced (1000 tonnes)
2010 2011 2012 2020 (est.)Food & Drinks 5.400 5.500Feed 100 100Energy unknown unknownOther industrial 3.400 3.300
Paper & Board 1.871 2.000 2.000Curragating & Adhesives 500 500
Non-food & textiles 400 400
Chemicals & Fermentation 500 400
Consumption of Starch & Seweeteners per sector(thousand tonnes)
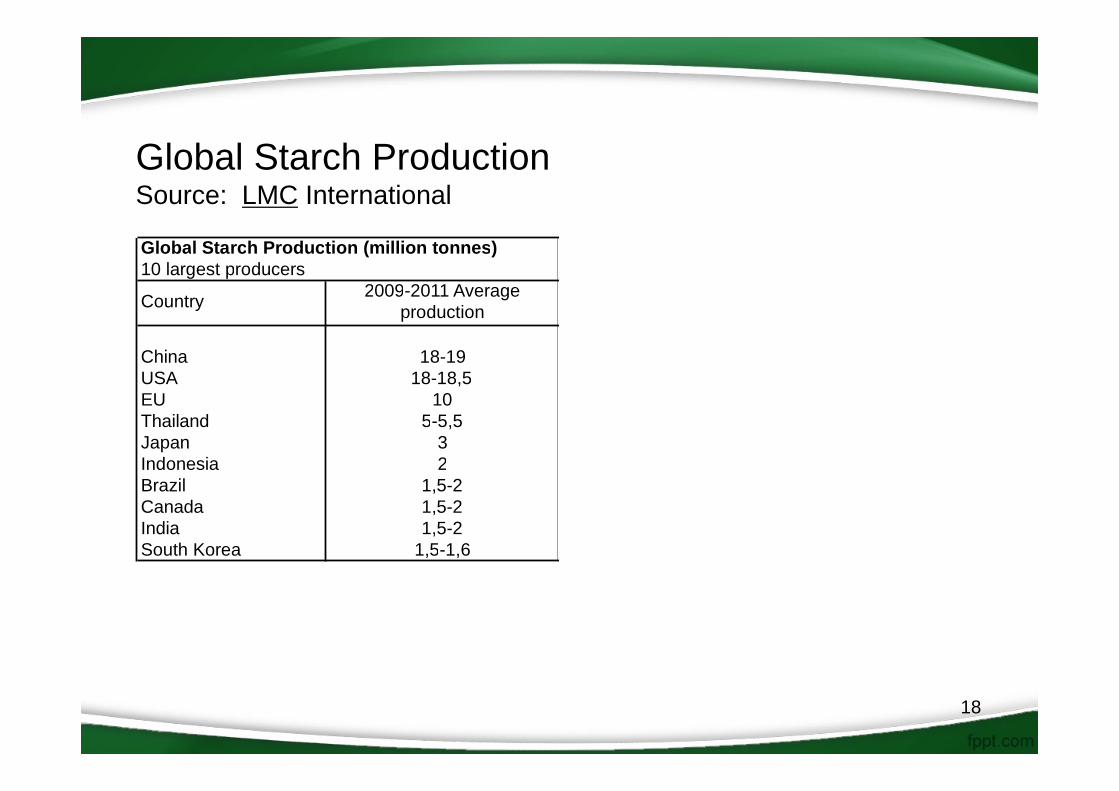
Global Starch ProductionSource: LMC International
18
Country
ChinaUSAEUThailandJapanIndonesiaBrazilCanadaIndiaSouth Korea
2009-2011 Averageproduction
18-1918-18,5
10
1,5-21,5-1,6
10 largest producersGlobal Starch Production (million tonnes)
5-5,532
1,5-21,5-2
19
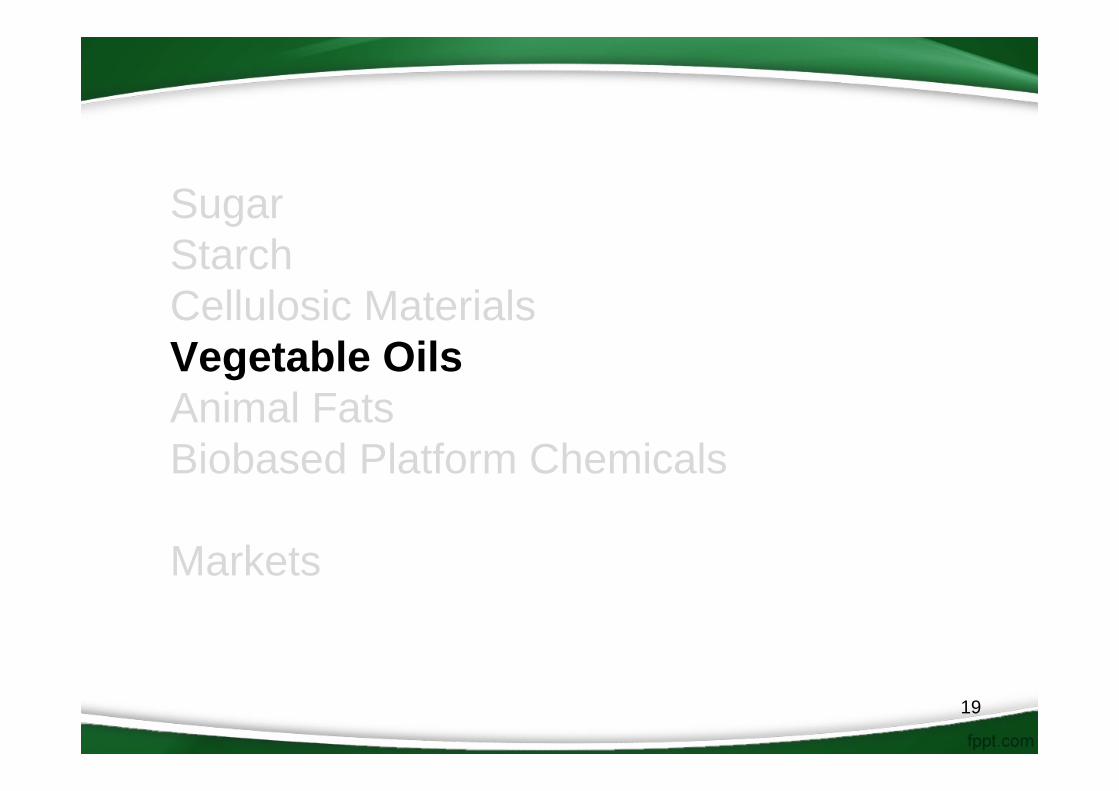
SugarStarchCellulosic MaterialsVegetable OilsAnimal FatsBiobased Platform Chemicals
Markets
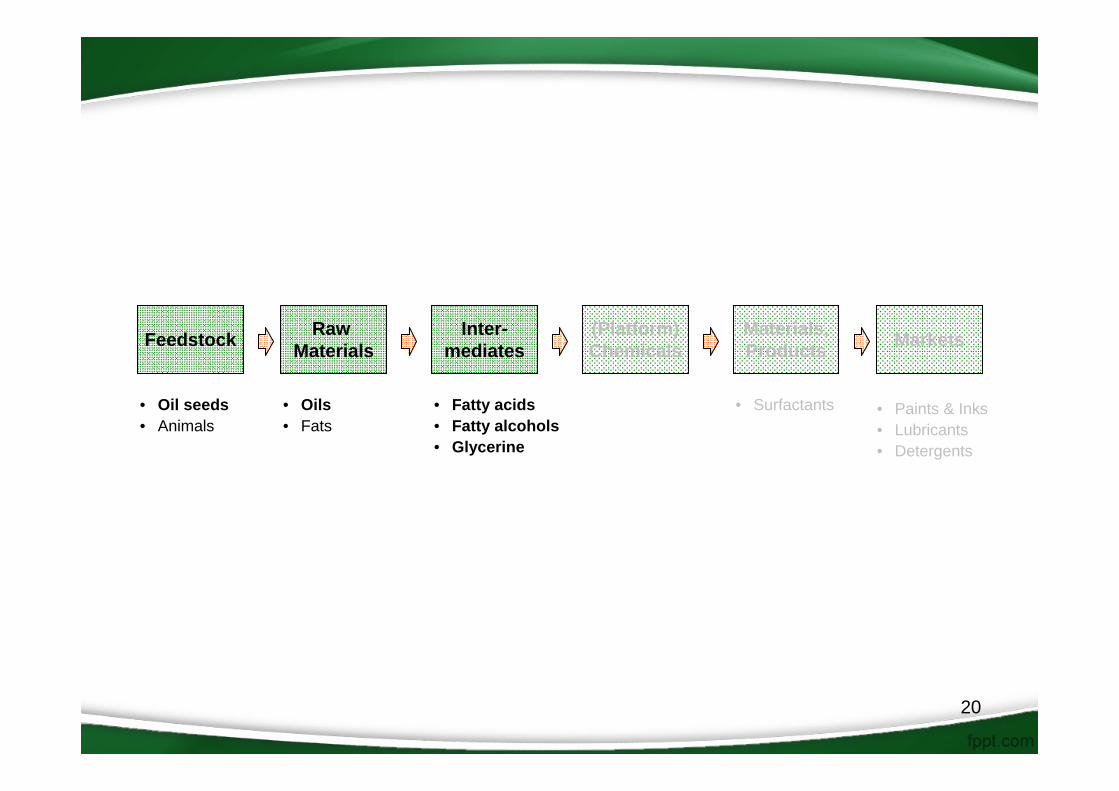
Feedstock Inter-mediates
Raw Materials
(Platform)Chemicals
Materials,Products
• Oil seeds• Animals
• Oils• Fats
• Surfactants• Fatty acids• Fatty alcohols• Glycerine
Markets
• Paints & Inks• Lubricants• Detergents
20
21
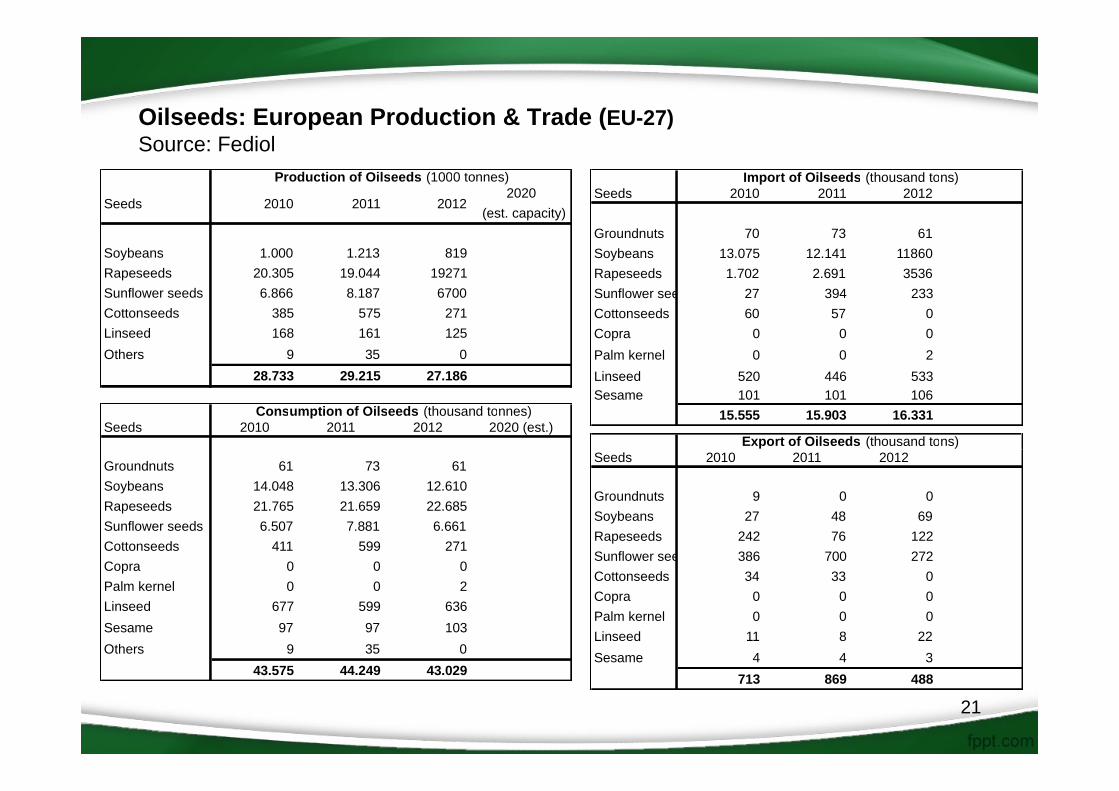
Oilseeds: European Production & Trade (EU-27)Source: Fediol
Seeds 2010 2011 2012
Groundnuts 70 73 61Soybeans 13.075 12.141 11860Rapeseeds 1.702 2.691 3536Sunflower see 27 394 233Cottonseeds 60 57 0Copra 0 0 0Palm kernel 0 0 2Linseed 520 446 533Sesame 101 101 106
15.555 15.903 16.331
Import of Oilseeds (thousand tons)
Seeds 2010 2011 2012 2020 (est.)
Groundnuts 61 73 61Soybeans 14.048 13.306 12.610Rapeseeds 21.765 21.659 22.685Sunflower seeds 6.507 7.881 6.661Cottonseeds 411 599 271Copra 0 0 0Palm kernel 0 0 2Linseed 677 599 636Sesame 97 97 103Others 9 35 0
43.575 44.249 43.029
Consumption of Oilseeds (thousand tonnes)
2020 (est. capacity)
Soybeans 1.000 1.213 819Rapeseeds 20.305 19.044 19271Sunflower seeds 6.866 8.187 6700Cottonseeds 385 575 271Linseed 168 161 125Others 9 35 0
28.733 29.215 27.186
Production of Oilseeds (1000 tonnes)
Seeds 2010 2011 2012
Seeds 2010 2011 2012
Groundnuts 9 0 0Soybeans 27 48 69Rapeseeds 242 76 122Sunflower see 386 700 272Cottonseeds 34 33 0Copra 0 0 0Palm kernel 0 0 0Linseed 11 8 22Sesame 4 4 3
713 869 488
Export of Oilseeds (thousand tons)
22
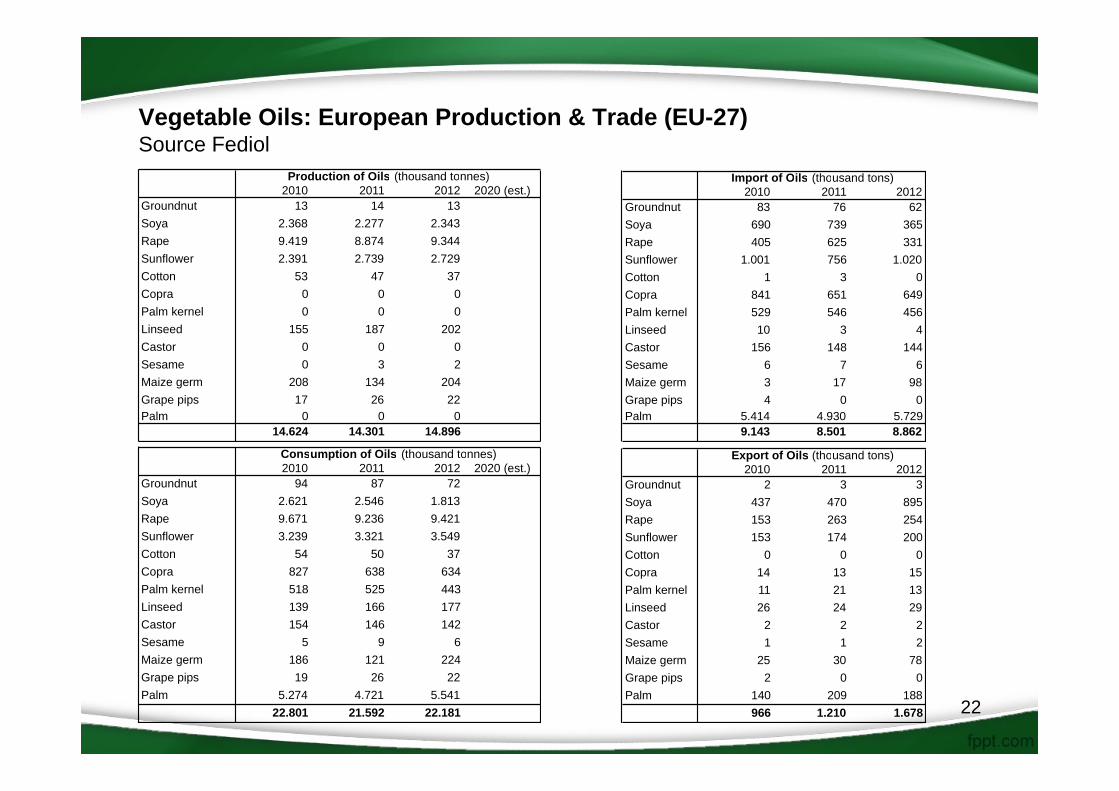
Vegetable Oils: European Production & Trade (EU-27) Source Fediol
2010 2011 2012 2020 (est.)Groundnut 13 14 13Soya 2.368 2.277 2.343Rape 9.419 8.874 9.344Sunflower 2.391 2.739 2.729Cotton 53 47 37Copra 0 0 0Palm kernel 0 0 0Linseed 155 187 202Castor 0 0 0Sesame 0 3 2Maize germ 208 134 204Grape pips 17 26 22Palm 0 0 0
14.624 14.301 14.896
Production of Oils (thousand tonnes)2010 2011 2012
Groundnut 83 76 62Soya 690 739 365Rape 405 625 331Sunflower 1.001 756 1.020Cotton 1 3 0Copra 841 651 649Palm kernel 529 546 456Linseed 10 3 4Castor 156 148 144Sesame 6 7 6Maize germ 3 17 98Grape pips 4 0 0Palm 5.414 4.930 5.729
9.143 8.501 8.862
Import of Oils (thousand tons)
2010 2011 2012 2020 (est.)Groundnut 94 87 72Soya 2.621 2.546 1.813Rape 9.671 9.236 9.421Sunflower 3.239 3.321 3.549Cotton 54 50 37Copra 827 638 634Palm kernel 518 525 443Linseed 139 166 177Castor 154 146 142Sesame 5 9 6Maize germ 186 121 224Grape pips 19 26 22Palm 5.274 4.721 5.541
22.801 21.592 22.181
Consumption of Oils (thousand tonnes)2010 2011 2012
Groundnut 2 3 3Soya 437 470 895Rape 153 263 254Sunflower 153 174 200Cotton 0 0 0Copra 14 13 15Palm kernel 11 21 13Linseed 26 24 29Castor 2 2 2Sesame 1 1 2Maize germ 25 30 78Grape pips 2 0 0Palm 140 209 188
966 1.210 1.678
Export of Oils (thousand tons)
23
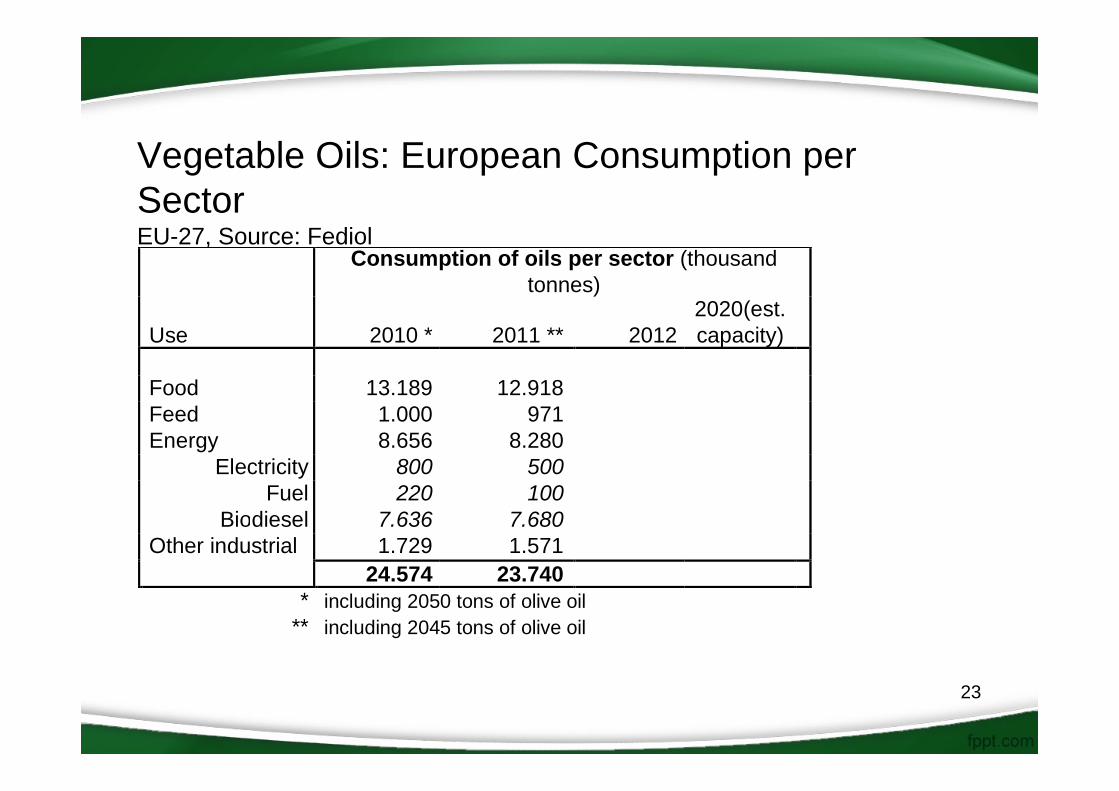
Vegetable Oils: European Consumption per SectorEU-27, Source: Fediol
Consumption of oils per sector (thousand
tonnes)
Use 2010 * 2011 ** 2012 2020(est.capacity)
Food 13.189 12.918Feed 1.000 971Energy 8.656 8.280
Electricity 800 500Fuel 220 100
Biodiesel 7.636 7.680Other industrial 1.729 1.571 24.574 23.740
* including 2050 tons of olive oil** including 2045 tons of olive oil
24
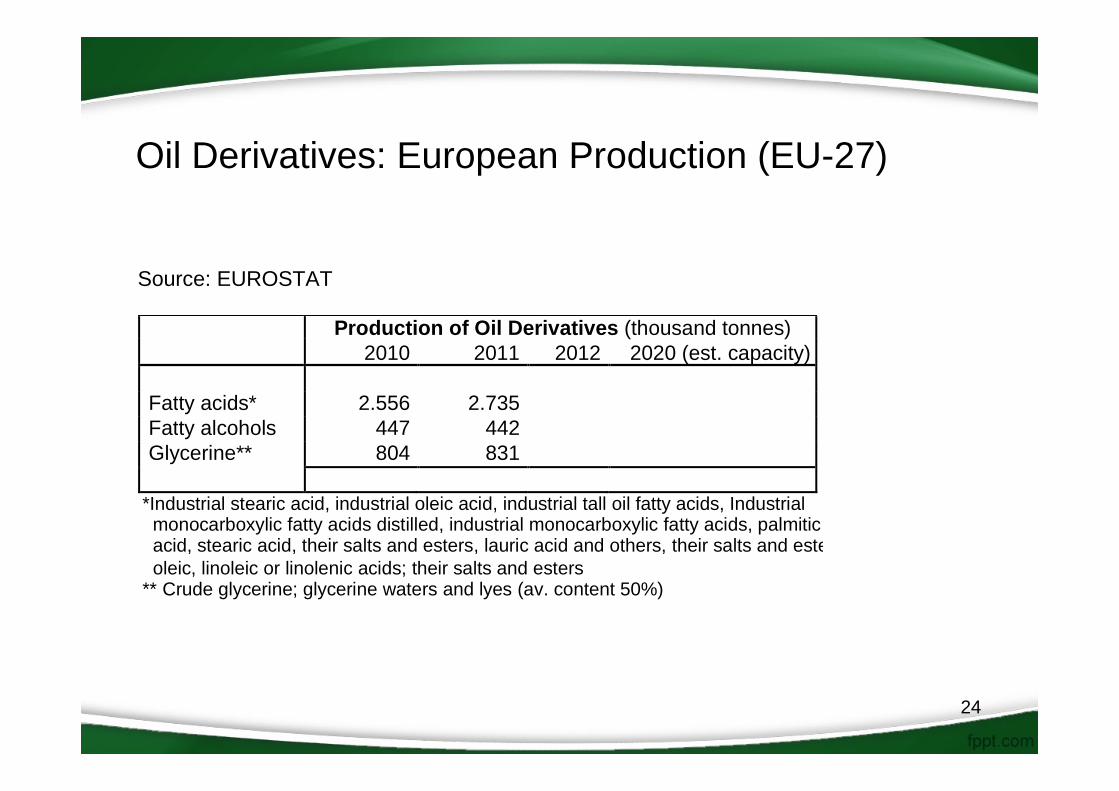
Oil Derivatives: European Production (EU-27)
Source: EUROSTAT
Production of Oil Derivatives (thousand tonnes) 2010 2011 2012 2020 (est. capacity)
Fatty acids* 2.556 2.735 Fatty alcohols 447 442Glycerine** 804 831
*Industrial stearic acid, industrial oleic acid, industrial tall oil fatty acids, Industrial monocarboxylic fatty acids distilled, industrial monocarboxylic fatty acids, palmitic acid, stearic acid, their salts and esters, lauric acid and others, their salts and este oleic, linoleic or linolenic acids; their salts and esters **Crude glycerine; glycerine waters and lyes (av. content 50%)
25
SugarStarchCellulosic MaterialsPlant OilsAnimal FatsBiobased Platform Chemicals
Markets
26
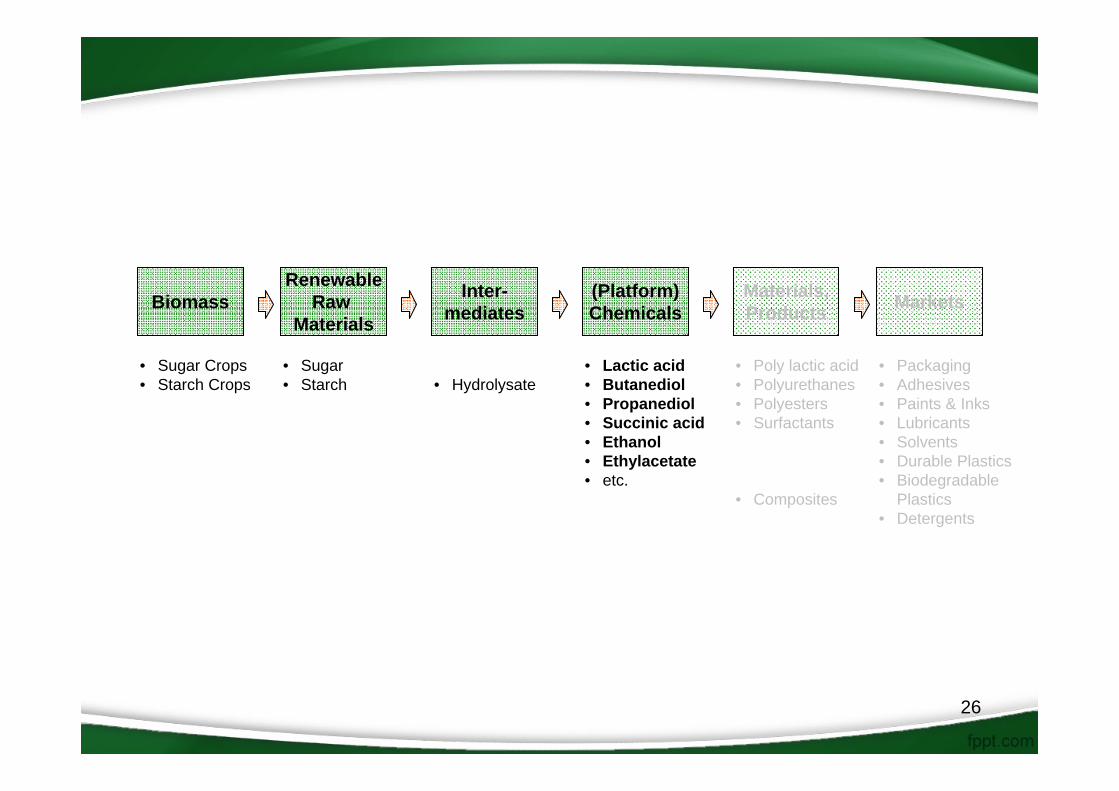
Biomass Inter-mediates
RenewableRaw
Materials
(Platform)Chemicals
Materials,Products
• Sugar Crops• Starch Crops
• Sugar• Starch
• Poly lactic acid• Polyurethanes• Polyesters• Surfactants
• Composites
• Hydrolysate• Lactic acid• Butanediol• Propanediol• Succinic acid• Ethanol• Ethylacetate• etc.
Markets
• Packaging• Adhesives• Paints & Inks• Lubricants• Solvents• Durable Plastics• Biodegradable
Plastics• Detergents

27
Platform Chemicals
Source: Bio-based Polymers Producer Database, nova-Institute 2013
EUROPE
Bio-based building blocksProducing companies
2013*Production capacities 2011*
(t/a)Production capacities
2013* (t/a)Production capacities
2020* (t/a)1,4-Butanediol 0 0 0 40.000Adipic acid 1 0 n.a. n.a.Azelaic acid 0 0 0 n.a.Epichlorohydrin 2 44.000 50.000 50.000Isosorbide 1 3.000 3.000 3.000Lactic acid (L-D-L+D) 2 36.000 36.000 45.000Monoethylene glycol 1 < 50 < 50 < 50Natural oil polyols 4 n.a. n.a. n.a.Polyether polyol 3 n.a. n.a. n.a.Propylene 1 0 n.a. n.a.Propylene glycol 1 0 20.000 20.000Succinic acid 4 3.200 28.200 28.200Other building blocks 2 45.000 45.000 45.000Total 22 131.250 222.250 231.250

28
SugarStarchCellulosic MaterialsPlant OilsAnimal FatsBiobased Platform Chemicals
Markets

29
Biomass Inter-mediates
RenewableRaw
Materials
(Platform)Chemicals
Materials,Products
• Sugar Crops• Starch Crops
• Sugar• Starch
• Poly lactic acid
• Polyurethanes• Polyesters• Surfactants
• Composites
• Hydrolysate• Lactic acid• Butanediol• Propanediol• Succinic acid• Ethanol• Ethylacetate• etc.
Markets
• Packaging• Adhesives• Paints & Inks• Lubricants• Solvents• Durable Plastics• Biodegradable
Plastics• Detergents

30
Product Group Market Volume"Bio" 2020 (in tons)
Biolubricants 420.000
Bioplastics 2.810.000Biodegradable and bio-based plastics 333.000
Bio-Composites 830.000Bio-Surfactants (2012)
Under the condtion that the Lead Market Initiative recomendations #5, 6, 7 and 8 will be implemented at this time
1.089.000
137.000 800.000
Market Volume "Bio"2008 (in tons)
Market Volume "Bio"2030 (in tons) *
315.000
35.000
260.000