first quarterly accounts (un - audited)
TRANSCRIPT
UGof Companies
FIRST QUARTERLY ACCOUNTS2018-2019
(UN - AUDITED)
UMER GROUP OF COMPANIES
FAISAL SPINNING MILLS LIMITED

Directors’ Review
On behalf of the board of directors of Faisal Spinning Mills Limited, I am presenting the un-audited condensed interim financial statements for the first quarter ended September 30, 2018.
Significant financial performance of the first quarter ended September 30, 2018;
Profit after tax for the first quarter ended 30th September, 2018 is PKR 155.311 million as compared to PKR 107.446 million in the corresponding period ended 30th September, 2018.
Earnings per share for the first quarter ended 30th September, 2018 is PKR 15.53 (30th September, 2017 PKR 10.74)
Break-up value of the share as on 30th September, 2018 is PKR 473.04 as compared to period ended 30th June, 2018 where it stands at PKR 457.51.
During the quarter ended 30th September, 2018 sales has been increased by 9.81% as compared to corresponding period ended 30th September, 2017.
Future Outlook
The newly elected government which is in the phase of reshaping economic policies announced a reduction in regulatory duty on the import of raw material by the export industry, especially for the five zero-rated sectors which was a long pending demand of textile sector. This will certainly assist in colossal cut of input costs in order to achieve the target to double the exports in the next five years. It is expected that this would give a benefit of almost five billion to the textile industry in remaining months of the current fiscal year 2018-19.Further, the government also ensures more benefits in electricity policy for zero rated sectors on the floor of National Assembly .The proclamation is highly appreciated at all the major economic forums as this eventually prop the sector to retain competiveness among the regional peers.
On the contrary, the country economic forums like FPCCI, KCCI and LCCI are disappointed at the government over the sharp rupee depreciation against the US dollar, fearing it will stoke up inflation and halt economic growth by hurting all important sectors. They believe that the benefit expected by the textile industry due to reduction in duty will be nullified if the rupee continues to plunge against dollar. Further, they are dismayed as the devaluation will led rising prices of essential goods and utilities for the common man besides enhancing the cost of doing business.
However, management is believe that they have to strive hard to maintain the level of profitability in upcoming quarter.
Acknowledgment
The Board highly appreciates the contribution of employees, bankers, corporate regulators, stakeholders and other government authorities for their continuous support.
On behalf of the Board
_____________
Bilal Sharif (Chief Executive) Karachi: October 29, 2018
1

NoteSeptember 30, 2018 June 30, 2018
NoteSeptember 30, 2018 June 30, 2018
Un-Audited Audited Un-Audited AuditedEQUITY AND LIABILITIES Rupees Rupees ASSETS Rupees Rupees
SHARE CAPITAL AND RESERVES NON CURRENT ASSETS Authorized capital Property, plant and equipment 8 3,457,603,769 3,511,191,266
120,000,000 120,000,000 Long term investment 618,233,218 599,526,101
Issued, subscribed and paid up capital 100,000,000 100,000,000 Long term deposits 9,154,135 9,154,135 Reserves 4,200,000,000 4,200,000,000 4,084,991,122 4,119,871,502 Unappropriated profits 430,396,478 275,085,662
4,730,396,478 4,575,085,662
NON CURRENT LIABILITIES
Long term financing - secured 1,421,282,786 1,475,536,209 CURRENT ASSETS
Deferred liabilities 6 864,754,523 818,451,774
2,286,037,309 2,293,987,983 Stores, spare parts and loose tools 62,562,395 70,806,434 Stock in trade 3,411,726,724 2,403,295,127
CURRENT LIABILITIES Trade debts 9 748,024,722 1,035,166,834 Loans and advances 50,500,277 71,454,064
Trade and other payables 771,903,411 599,665,652 Trade deposits and prepayments 109,137,956 93,073,897 Unclaimed Dividend 7,212,437 7,226,735 Other receivables 20,462,425 13,271,023 Accrued markup / interest 18,919,716 19,613,533 Advance income tax 304,032,328 304,036,327 Short term borrowings - secured 1,009,587,961 645,651,760 Sales tax refundable 150,347,008 129,563,165 Current portion of non current liabilities 237,994,338 224,493,423 Cash and bank balances 120,266,693 125,186,375
2,045,617,863 1,496,651,103 4,977,060,528 4,245,853,246
CONTINGENCIES AND COMMITMENTS 7 - -
TOTAL EQUITY AND LIABILITIES 9,062,051,650 8,365,724,748 TOTAL ASSETS 9,062,051,650 8,365,724,748
The annexed notes form an integral part of this condensed interim financial information.
Chief Executive Director Chief Financial Officer Karachi: October 29, 2018
Faisal Spinning Mills Limited
Condensed Interim Statement of Financial Position (Un-Audited)As at September 30, 2018
12,000,000 (June 30, 2018: 12,000,000) ordinaryshares of PKR 10 each
2

Faisal Spinning Mills Limited
Condensed Interim Profit and Loss Account (Un-Audited)For the Quarter ended September 30, 2018
NoteSeptember 30, 2018 September 30, 2017
Rupees Rupees
Sales 2,943,979,233 2,680,984,886 Cost of goods sold 2,624,414,408 2,408,811,372 Gross profit 319,564,825 272,173,514
Distribution cost 79,200,829 81,667,146 Administrative expenses 28,985,051 26,833,798
108,185,880 108,500,944 Other income 1,736,944 954,200
213,115,889 164,626,770 Other operating expenses 11,786,385 9,783,935 Finance cost 34,250,691 25,331,331
46,037,076 35,115,266 Operating Profit 167,078,813 129,511,504 Share of profit of associated undertaking 18,707,117 11,446,629 Profit before tax 185,785,930 140,958,133
Provision for taxation - current year 10 30,475,114 33,512,311
Profit after tax 155,310,816 107,445,822
Earnings per share - basic and diluted 15.53 10.74
The annexed notes form an integral part of this condensed interim financial information.
Chief Executive Director Chief Financial Officer Karachi: October 29, 2018
Quarter Ended
3

Faisal Spinning Mills Limited
Condensed Interim Statement of Comprehensive Income (Un-Audited)For the Quarter ended September 30, 2018
NoteSeptember 30, 2018 September 30, 2017
Rupees Rupees
Profit for the period after taxation 155,310,816 107,445,822
Other comprehensive income for the year - -
Total comprehensive Income for the period 155,310,816 107,445,822
The annexed notes form an integral part of this condensed interim financial information.
Chief Executive Director Chief Financial Officer Karachi: October 29, 2018
Quarter Ended
4

Faisal Spinning Mills Limited
Condensed Interim Statement of Changes in Equity (Un-Audited)For the Quarter ended September 30, 2018
PKR PKR PKR PKR PKR
Balance as at 30th June, 2017 100,000,000 24,150,000 3,865,850,000 181,011,828 4,046,861,828 4,171,011,828
Total comprehensive income for the quarter ended Sep 30, 2017 - - - 107,445,822 107,445,822 107,445,822
Balance as at Sep 30 , 2017 100,000,000 24,150,000 3,865,850,000 288,457,650 4,154,307,650 4,278,457,650
- - - (172,499,970) (172,499,970) (172,499,970) - -
Total comprehensive income for the remaining - - - 469,127,982 469,127,982 469,127,982 - -
Transferred to general reserve - - 310,000,000 (310,000,000) - -
Balance as at 30th June, 2018 100,000,000 24,150,000 4,175,850,000 275,085,662 4,450,935,662 4,575,085,662
Total comprehensive income for the quarter ended Sep 30, 2018 - - - 155,310,816 155,310,816 155,310,816
Balance as at Sep 30, 2018 100,000,000 24,150,000 4,175,850,000 430,396,478 4,606,246,478 4,730,396,478
The annexed notes form an integral part of this condensed interim financial information.
Chief Executive Director Chief Financial Officer Karachi: October 29, 2018
Final dividend for the year ended June 30, 2017PKR 17.25 per share
Share Capital General Reserves Unappropriated Profit
Revenue Reserves
TotalCapital Reserves Grand Total
5

Faisal Spinning Mills Limited
Condensed Interim Statement of Cash Flows (Un-Audited)For the Quarter ended September 30, 2018
September 30, 2018
September 30, 2017
Rupees RupeesCash flows from operating activities
Profit before tax 185,785,930 140,958,133 Adjustments for:
Depreciation of property, plant and equipment 86,463,737 86,517,000 Share of profit of associated undertaking (18,707,117) (11,446,629) Infrastructure fee - ETO 2,947,218 224,397 Infrastructure fee - Gas 37,726,931 - Provision for employee benefits 13,275,000 12,105,000 Gain on disposal of property, plant and equipment (197,335) (143,021) Finance cost 34,250,691 25,331,331
155,759,125 112,588,078 Operating cash flows before movements in working capital 341,545,055 253,546,211
Decrease in stores, spares and loose tools 8,244,039 882,058 Increase in stock in trade (1,008,431,597) 683,601,466 Increase in trade debts 287,142,112 (611,104,532) Increase in loans and advances 20,953,787 (38,950,963) Increase in trade deposits (16,064,059) (4,673,897) Decrease in sales tax refund and other receivables (20,783,843) 62,310,242 Increase in trade and other payables 172,237,759 43,268,210
(563,893,204) 135,332,584 Cash (used in) / generated from operations (222,348,149) 388,878,795
Finance cost paid (34,944,508) (30,731,222) Employee benefit costs paid (7,646,400) (2,761,723) Income taxes paid (30,471,115) (25,689,694)
(73,062,023) (59,182,639) Net cash (used in) / generated from operating activities (295,410,172) 329,696,156
6

Faisal Spinning Mills Limited
Condensed Interim Statement of Cash Flows (Un-Audited)For the Quarter ended September 30, 2018
September 30, 2018
September 30, 2017
Rupees RupeesCash flows from investing activities
Proceeds from disposal of property, plant and equipment 31,037,458 250,000 Addition in property plant and equipment (63,716,363) (160,934,638)
Net cash used in investing activities (32,678,905) (160,684,638)
Cash flows from financing activities
Proceed from long term finance 9,769,800 - Repayment of long term financing (50,522,308) (36,701,581) Increase in short term borrowings 363,936,201 (164,039,661) Dividends paid (14,298) (10,062)
Net cash generated from / (used in) financing activities 323,169,395 (200,751,304)
Net decrease in cash and cash equivalents (4,919,682) (31,739,786) Cash and cash equivalent at the beginning of period 125,186,375 110,714,973 Cash and cash equivalent at the end of period 120,266,693 78,975,187
The annexed notes form an integral part of this condensed interim financial information.
Chief Executive Director Chief Financial Officer Karachi: October 29, 2018
7

Faisal Spinning Mills LimitedNotes to the Condensed Interim Financial Information (Un-audited)
1 REPORTING ENTITY
2 BASIS OF PREPARATION
2.1 Statement of compliance
2.2 Basis of measurement
2.3 Judgments, estimates and assumptions
2.4 Functional currency
3 NEW AND REVISED STANDARDS, INTERPRETATIONS AND AMENDMENTS EFFECTIVE DURING THE PERIOD
The following new and revised standards, interpretations and amendments are effective in the current period.
IFRS 9 – Financial Instruments (2014)
-
-
-
Classification of financial instruments
Under IAS 39, the Company classified its financial instruments, on initial recognition, into following classes depending on the purpose for whichfinancial assets and liabilities were acquired or incurred.
Estimates and underlying assumptions are reviewed on an ongoing basis. Revisions to accounting estimates are recognized in the periodin which the estimate is revised and in any future periods affected.
This financial information is prepared in Pak Rupees which is the Company's functional currency.
IFRS 9 replaces IAS 39 - Financial Instruments: Recognition and Measurement. The standard contains requirements in the following areas:
Classification and measurement: Financial assets are classified by reference to the business model within which they are held and theircash flow characteristics. The standard introduces a 'fair value through comprehensive income' category for certain debt instruments.Financial liabilities are classified in a similar manner to under IAS 39, however there are differences in the requirements applying tomeasurement of entity's own credit risk.
Impairment: IFRS 9 introduces an 'expected credit loss' model for the measurement of the impairment of financial assets, so it is nolonger necessary for a credit loss to have occurred before a credit loss is recognized.
Hedge accounting: IFRS 9 introduces a new hedge accounting model that is designed to be more closely aligned with how entitiesundertake risk management activities when hedging financial and non-financial risk exposure.Derecognition: The requirements for the derecognition of financial assets and liabilities are carried forward from IAS 39.
The Company has applied IFRS 9 in accordance with the transition provisions set out in IFRS 9. Adoption of IFRS 9 has resulted in the followingchanges:
For the Quarter ended September 30, 2018
Faisal Spinning Mills Limited ('the Company') is incorporated in Pakistan as a Public Limited Company under the Companies Ordinance, 1984and is listed on Pakistan Stock Exchange Limited. The Company is primarily a spinning and weaving unit engaged in the manufacture and sale ofyarn and woven fabric, however, it is also engaged in the generation of electricity for self consumption. The registered office of the Company issituated at Umer House, 23/1, Sector 23, S.M. Farooq Road, Korangi Industrial Area, Karachi. The manufacturing facility is located at NooriabadDistrict Dadu in the Province of Sindh and District Sheikhupura in the Province of Punjab.
This interim financial information is not audited and has been presented in condensed form and does not include all the information as isrequired to be provided in a full set of annual financial statements. This condensed interim financial information should be read in conjunctionwith the audited financial statements of the Company for the year ended June 30, 2018.
This condensed interim financial information has been prepared in accordance with the requirements of International AccountingStandard 34 - Interim Financial Reporting, and provisions of and directives issued under the Companies Act, 2017. In case whererequirements differ, the provisions of and directives issued under the Companies Act, 2017 have been followed.
This condensed interim financial information has been prepared under the historical cost convention except for certain financialinstruments at fair value, certain financial liabilities at amortized cost and employees retirement benefits at present value. In thisfinancial information, except for the amounts reflected in the statement of cash flows, all transactions have been accounted for onaccrual basis.
The preparation of financial information requires management to make judgments, estimates and assumptions that affect theapplication of accounting policies and the reported amounts of assets, liabilities, income and expenses. The estimates and associatedassumptions and judgments are based on historical experience and various other factors that are believed to be reasonable under thecircumstances, the result of which forms the basis of making judgments about carrying values of assets and liabilities that are not readilyapparent from other sources. Actual results may differ from these estimates.
8

(a) Loans and receivables
(b) Financial liabilities at amortized cost
(a) Financial assets at amortized cost
(b) Financial assets at fair value
(c) Financial liabilities at fair value
As a result of the application of IFRS 9, the classification of the Company's financial assets and liabilities is as follows:
Borrowings Financial liabilities at amortized cost Financial liabilities at amortized costTrade and other payables Financial liabilities at amortized cost Financial liabilities at amortized costTrade and other receivables Loans and receivables Financial assets at amortized costBank balances Loans and receivables Financial assets at amortized cost
Impairment of financial assets
Impairment of financial assets
4 CHANGE IN ACCOUNTING POLICY
There is no impact of the change on the amounts reported in all periods presented in these interim financial statements.
5 SIGNIFICANT ACCOUNTING POLICIESThe accounting policies and methods of computation adopted in the preparation of these interim financial statements are the same as thoseapplied in the preparation of preceding annual financial statements of the Company for the year ended June 30, 2018, except of changereferred to in note 4.
There is no change in the particular measurement methods adopted for each individual financial instrument resulting from application of IFRS9.
IFRS 9 introduces an 'expected credit loss' model for the measurement of the impairment of financial assets, so it is no longer necessary for acredit loss to have occurred before a credit loss is recognized. This has resulted in change in the Company's approach to measurement of
IAS 39 Impairment IFRS 9 ImpairmentA financial asset is assessed at each reporting date to determine whether thereis any objective evidence that it is impaired. Individually significant financialassets are tested for impairment on an individual basis. The remaining financialassets are assessed collectively in groups that share similar credit riskcharacteristics. A financial asset is considered to be impaired if objectiveevidence indicates that one or more events have had a negative effect on theestimated future cash flows of the asset.An impairment loss in respect of a financial asset measured at amortized cost iscalculated as the difference between its carrying amount, and the present valueof the estimated future cash flows discounted at the original effective interestrate. Impairment loss in respect of a financial asset measured at fair value isdetermined by reference to that fair value. All impairment losses are recognizedin profit or loss. An impairment loss is reversed if the reversal can be relatedobjectively to an event occurring after the impairment loss was recognized. Animpairment loss is reversed only to the extent that the financial asset’s carryingamount after the reversal does not exceed the carrying amount that would havebeen determined, net of amortization, if no impairment loss had beenrecognized.
A financial asset is assessed at each reporting date todetermine whether there is any objective evidence that thecredit risk has increased resulting in an increase in expectedcredit losses.Impairment is recognized at an amount equal to lifetimeexpected credit losses for financial assets for which creditrisk has increased significantly since initial recognition. Forfinancial assets for which credit risk is low, impairment isrecognized at an amount equal to 12 months' expectedcredit losses.All impairment losses are recognized in profit or loss. Animpairment loss is reversed if the reversal can be relatedobjectively to an event occurring after the impairment losswas recognized. An impairment loss is reversed only to theextent that the financial asset’s carrying amount after thereversal does not exceed the carrying amount that wouldhave been determined, net of amortization, if no impairmentloss had been recognized.
Financial assets, that do not meet the classification criteria for 'financial assets at amortized cost'.
All financial liabilities that are held for trading or are designated as such on initial recognition.
IAS 39 Classification IFRS 9 Classification
The Company has changed its accounting policy for certain financial instruments resulting changes in policies for classification andmeasurement of those financial instruments. Refer to note 3 for details.
Non-derivative financial assets with fixed or determinable payments that are not quoted in an active market.
Non-derivative financial liabilities that are not financial liabilities at fair value through profit or loss.
IFRS 9 has introduced new requirements for classification of financial instruments, whereby financial assets and liabilities can be classified intothe following categories:
Assets held in a business model whose objective is to hold assets in order to collect contractual cash flows and whose contractual termsgive rise on specified dates to cash flows that are solely payments of principal and interest on the principal amount.
9

Note September 30, 2018
June 30, 2018
Rupees Rupees
(Un-Audited) (Audited)6 DEFERRED LIABILITIES
Infra structure fee payable - ETO 94,250,062 91,302,844 Infra structure fee payable - Gas 536,159,412 498,432,481 Staff retirement benefits - gratuity 170,536,249 164,907,649 Deferred taxation 63,808,800 63,808,800
864,754,523 818,451,774 7 CONTINGENCIES AND COMMITMENTS
7.1 3,311,451,334
Commitments
1,723,675,983
Note September 30, 2018
June 30, 2017
Rupees Rupees
(Un-Audited) (Audited)8 PROPERTY, PLANT AND EQUIPMENT
Operating fixed assets- assets owned by the Company 8.1 3,414,760,508 3,491,381,821
Capital work in progress 42,843,261 19,809,445
3,457,603,769 3,511,191,266
8.1 Assets owned by the Company
Net book value at the beginning of the period/year 3,491,381,821 3,256,739,268 Additions during the period/year
Freehold land - 446,237,501 Factory buildings - 19,674,282 Non factory buildings - 473,999 Plant and machinery 28,750,131 81,580,398 Office Equipment - 31,500 Equipment and other assets - 21,723,467 Vehicles 11,932,416 6,963,116
40,682,547 576,684,263 Net book value of assets disposed / impaired during the period/year (30,840,123) (12,618,232) Depreciation for the period/year (86,463,737) (329,423,478)
Net book value at the end of the period/year 3,414,760,508 3,491,381,821
9 TRADE DEBTSConsidered good
Foreign secured 249,320,444 743,434,353 Local unsecured 498,704,278 291,732,481
748,024,722 1,035,166,834 Considered doubtful: -
Export 14,204,494 14,204,494 Local 77,156,656 77,156,656
91,361,150 91,361,150 Provision for doubtful debts (91,361,150) (91,361,150)
748,024,722 1,035,166,834
10 PROVISION FOR TAXATION
10.1
Bills Discounted
Letter of credit (for store, raw material and machinery)
There is no material change in contingencies and commitments as disclosed in annual financial statements for the year ended June 30, 2018except following:
Provision for current tax has been made in accordance with the requirements of Income Tax Ordinance, 2001.
10

11 TRANSACTIONS AND BALANCES WITH RELATED PARTIES
Names and details of transactions and balances with related parties are as under:
Name Nature of relationship Shareholding percentageBhanero Textile Mills Limited Associated companies N/ABlessed Textiles Limited Associated companies 18.49Bhanero Energy Limited Associated companies N/AAdmiral (Private) Limited Associated companies N/A
September 30, 2018
September 30, 2017
Rupees Rupees
(Un-Audited) (Un-Audited)11.1 Transactions with related parties
Nature of transactionPurchases 353,381,334 318,188,971 Sales 2,550,343 9,353,614 Services received 77,250 77,250 Purchase of electricity 32,745,673 88,817,599
11.2 Balances with related parties
There are no balances with related parties as at the reporting date.
12 SEGMENT REPORTING
Reportable segment Principal activity
Spinning Manufacture and sale of yarnWeaving Manufacture and sale of woven fabric
Information about operating segments as at September 30, 2018 is as follows:
Spinning Weaving TotalRupees Rupees Rupees
Revenue from external customers 1,264,553,533 1,679,425,700 2,943,979,233 Inter-segment transfers 21,313,800 - 21,313,800 Segment results 97,385,122 115,730,767 213,115,889
Spinning Weaving TotalRupees Rupees Rupees
Revenue from external customers 1,277,589,414 1,403,395,472 2,680,984,886 Inter-segment transfers 51,996,700 - 51,996,700 Segment results 71,855,223 92,771,547 164,626,770
Related parties from the Company's perspective comprise associated companies and key management personnel. Key management personnelare those persons having authority and responsibility for planning, directing and controlling the activities of the Company, directly or indirectly,and include the Chief Executive and Directors of the Company.
Transactions with key management personnel are limited to payment of short term employee benefits only. The Company in the normal course of business carries out various transactions with associated companies and continues to have a policy whereby all such transactions are carriedout on commercial terms and conditions which are equivalent to those prevailing in an arm's length transaction.
Quarter Ended
The Company has two reportable segments, which offer different products and are managed separately. The following summary describes theoperations in each of the company's reportable segments.
September 30, 2018Quarter ended
September 30, 2017Quarter ended
11
Weaving Un-allocated TotalRupees Rupees Rupees
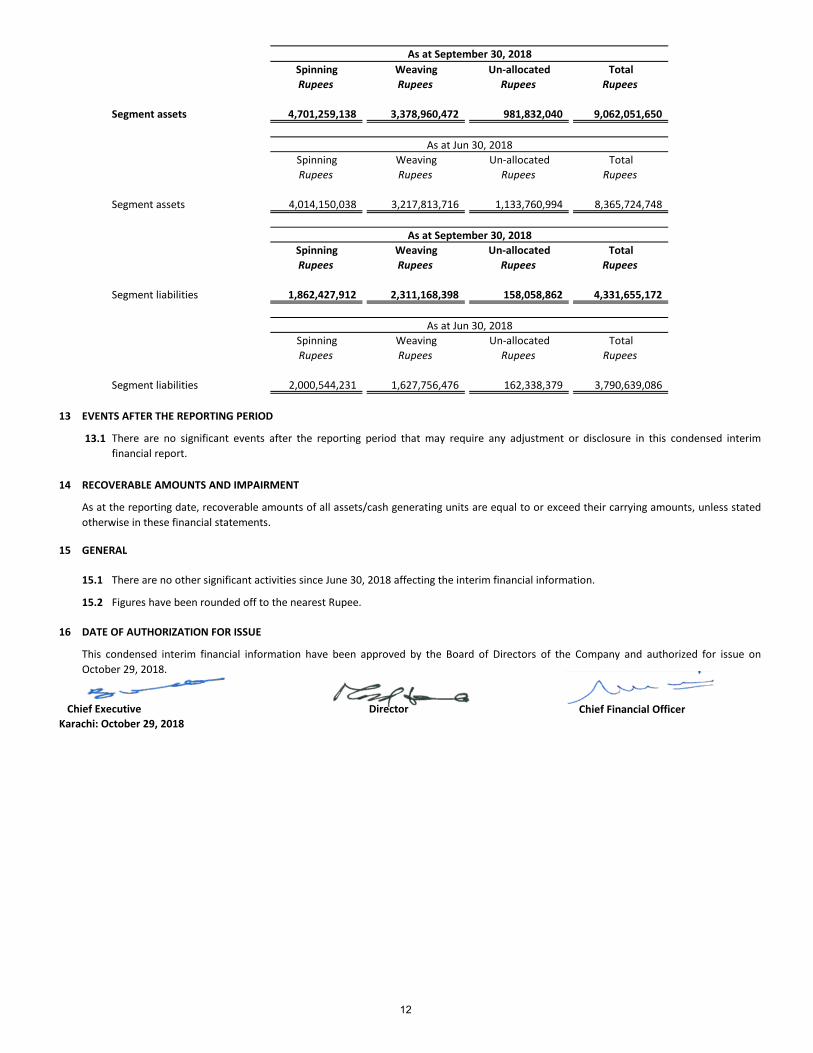
Segment assets 3,378,960,472 981,832,040 9,062,051,650
Weaving Un-allocated TotalRupees Rupees Rupees
Segment assets 3,217,813,716 1,133,760,994 8,365,724,748
Weaving Un-allocated TotalRupees Rupees Rupees
Segment liabilities 2,311,168,398 158,058,862 4,331,655,172
Weaving Un-allocated TotalRupees Rupees Rupees
Segment liabilities 1,627,756,476 162,338,379 3,790,639,086
13 EVENTS AFTER THE REPORTING PERIOD
13.1
14 RECOVERABLE AMOUNTS AND IMPAIRMENT
15 GENERAL
15.1 There are no other significant activities since June 30, 2018 affecting the interim financial information.
15.2 Figures have been rounded off to the nearest Rupee.
16 DATE OF AUTHORIZATION FOR ISSUE
Chief Executive Director Chief Financial Officer Karachi: October 29, 2018
As at September 30, 2018
4,701,259,138
SpinningRupees
Spinning
1,862,427,912
SpinningRupees
2,000,544,231
As at the reporting date, recoverable amounts of all assets/cash generating units are equal to or exceed their carrying amounts, unless statedotherwise in these financial statements.
This condensed interim financial information have been approved by the Board of Directors of the Company and authorized for issue onOctober 29, 2018.
As at Jun 30, 2018
There are no significant events after the reporting period that may require any adjustment or disclosure in this condensed interimfinancial report.
4,014,150,038
RupeesSpinning
Rupees
As at September 30, 2018
As at Jun 30, 2018
12