first quarter ended march 31, 2015 financial...
TRANSCRIPT

CRH Medical Corporation
522 – 999 Canada Place
Vancouver, BC
V6C 3E1
First Quarter Ended March 31, 2015
Financial Report
Trading Information: Toronto Stock Exchange (Symbol “CRH”)
For Information Contact: Richard Bear, Chief Financial Officer Email: [email protected] Web: www.crhmedcorp.com
For further information about CRH Medical Corporation, please visit the Company website at
www.crhmedcorp.com or www.sedar.com or email us at [email protected].

1
CRH MEDICAL CORPORATION
MANAGEMENT DISCUSSION AND ANALYSIS OF FINANCIAL CONDITION AND RESULTS OF
OPERATIONS FOR THE THREE MONTHS ENDED MARCH 31, 2015
The following discussion and analysis should be read in conjunction with CRH Medical Corporation’s
(the “Company” or “CRH”) unaudited condensed consolidated interim financial statements for the three
months ended March 31, 2015 and 2014 and the annual consolidated financial statements and the
corresponding notes thereto for the year ended December 31, 2014. The unaudited condensed
consolidated interim financial statements have been prepared in accordance with International
Financial Reporting Standards (“IFRS”).
Unless otherwise specified, all financial data is presented in United States dollars. This management
discussion and analysis is as of April 28, 2015.
CAUTION REGARDING FORWARD-LOOKING STATEMENTS
Information included or incorporated by reference in this report may contain forward-looking
statements. This information may involve known and unknown risks, uncertainties, and other factors
which may cause our actual results, performance, or achievements to be materially different from the
future results, performance, or achievements expressed or implied by any forward-looking statements.
Forward-looking statements, which involve assumptions and describe our future plans, strategies, and
expectations, are generally identifiable by use of the words “may,” “will,” “should,” “expect,” “anticipate,”
“estimate,” “believe,” “plan,” “intend” or “project” or the negative of these words or other variations on
these words or comparable terminology. Readers are cautioned regarding statements discussing
profitability; growth strategies; anticipated trends in our industry; our future financing plans; and our
anticipated needs for working capital. Forward looking statements in this report include statements
regarding additional acquisitions, increasing revenue and operating EBITDA, continued growth of our
business and leveraging our capabilities. Actual events or results may differ materially from those
discussed in forward-looking statements. There can be no assurance that the forward-looking
statements currently contained in this report will in fact occur. The Company bases its forward-looking
statements on information currently available to it, and assumes no obligation to update them. The
Company disclaims any intent or obligations to update or revise publicly any forward-looking statements
whether as a result of new information, estimates or options, future events or results or otherwise,
unless required to do so by law.
Forward-looking information reflects current expectations of management regarding future events and
operating performance as of the date of this document. Such information involves significant risks and
uncertainties, should not be read as guarantees of future performance or results, and will not
necessarily be accurate indications of whether or not such results will be achieved. A number of factors
could cause actual results to differ materially from the results discussed in forward-looking information,
including, without limitation: our need for additional financing and our estimates regarding our capital
requirements, future revenues and profitability; unfavourable economic conditions could have an
adverse effect on our business; risks related to the Company’s credit facilities; the policies of heal th
insurance carriers may affect the amount of revenue the Company receives; our ability to successfully
market and sell our products and services; our estimates of the size of the potential markets for our
products and services; we may be subject to competition and technological risk which may impact the
price and amount of product we can sell and nature of services we can provide; our ability to and the
cost of compliance with extensive existing regulation and any changes or amendments thereto;

2
changes within the medical industry and third-party reimbursement policies and our estimates of
associated timing and costs with the same; changes in key United States federal or state laws, rules,
and regulations; our ability to establish, maintain and defend intellectual property rights; risks related to
U.S. antitrust regulations; risks related to record keeping and confidentiality by our affiliated physicians;
our ability to recruit and retain qualified physicians to provide our services; our ability to enforce non-
competition covenants of any departed physicians; risks related to corporate practice of medicine and
our ability to renew and maintain agreements with anesthesiologists and other contractors; risks related
to our ability to renegotiate, renew or replace services agreements under which we provide anesthesia
services; risks related to changes in regulations that would necessitate adapting or re-negotiating our
existing operating agreements; our ability and forecasts of expansion and the Company’s management
of anticipated growth; our senior management has been key to our growth and we may be adversely
affected if we are unable to retain, conflicts of interest develop with or we lose any key member of our
senior management; risks associated with manufacture of our products and our economic dependence
on suppliers; changes in the industry and the economy may affect the Company’s business; risks
related to the competitive nature of the medical industry; evolving regulation of corporate governance
and public disclosure may result in additional corporate expenses; adverse events relating to our
product or services could result risks relating to in product liability, medical malpractice, other legal
claims, insurance, product recalls and other liabilities; risks associated with use of our products in
unapproved circumstances; various risks associated with legal, regulatory or investigative proceedings;
health and safety risks are intrinsic within our industry; our ability to successfully identify evaluation and
complete future transactions; anti-takeover provisions create risks related to lost opportunities; we may
not continue to attract gastroenterologists and other licensed providers to purchase and use the CRH
O’Regan System or to provide our services; risks associated with the trading of our common shares on
a public marketplace; risks related to adverse movements in foreign currency exchange rates; and risks
related to maintaining our foreign private issuer status.
Although the GAA acquisition has diversified the Company’s revenue sources, any adverse event
directly or indirectly related to the CRH O’Regan System will have a material impact on the Company’s
financial performance. In addition, there is a risk that some or all of the expected benefits from the
GAA acquisition will not be realized, and risks associated with the integration of the GAA business, as
planned.
OVERVIEW
CRH Medical Corporation is a North American company focused on providing physicians with
innovative products and services for the treatment of gastrointestinal diseases. The Company’s product
distribution strategy focuses on physician education, patient outcomes, and patient awareness. The
Company’s first product, the CRH O’Regan System, is a single use, disposable, hemorrhoid banding
technology that is safe and highly effective in treating hemorrhoid grades I – IV. CRH distributes the
CRH O’Regan System, treatment protocols, operational and marketing expertise as a complete,
turnkey package directly to physicians, allowing CRH to create meaningful relationships with the
physicians it serves. In 2014, CRH acquired a full service gastroenterology anesthesia company,
Gastroenterology Anesthesia Associates, LLC (“GAA”), which provides anesthesia services for patients
undergoing endoscopies and colonoscopies and has complemented this acquisition with further
acquisitions of anesthesia transactions announced during the first quarter of 2015. Anesthesia assisted
endoscopies makes these procedures more comfortable for patients and allows gastroenterologists to
perform more procedures. CRH plans to leverage the capabilities it acquired through GAA to
consolidate the highly fragmented gastroenterology anesthesia provider business. The Company’s goal
3
is to establish CRH as the premier provider of innovative products and essential services to
gastroenterologists throughout the United States.
The Company has financed its cash requirements primarily from revenues generated from the sale of
its product directly to physicians, anesthesia sales, equity financings, debt financings and a prior line
of credit. The Company’s ability to maintain the carrying value of its assets is dependent on
successfully marketing its products and services and maintaining future profitable operations, the
outcome of which cannot be predicted at this time. The Company has also stated its intention to acquire
or build additional anesthesia businesses. It may be necessary for the Company to raise additional
funds for the continuing development of its business plan, including additional acquisitions.
For further information about CRH Medical Corporation, including the Company’s Annual Information
Form, please visit the Company website at www.crhmedcorp.com or www.sedar.com, or email us at
RECENT EVENTS
Bought Deal Equity Offering – March 25, 2015
On March 25, 2015, the Company closed a bought deal equity offering and over-allotment option of
7,000,000 and 1,050,000 common shares, respectively, at a price of $2.72 (CAD$3.40) per common
share for gross proceeds of $21,865,893 (CAD$27,370,000). In connection with the offering, the
underwriters were paid a 6% commission totaling approximately $1,311,954 (CAD$1,642,200). The
Company also issued 241,500 Broker Warrants with a total value of $249,149 to the underwriters and
incurred additional share issuance costs of $269,539 (CAD$337,388) in relation to the offering.
The proceeds of the offering were used in part to reduce corporate indebtedness and the balance will
be used to fund future acquisitions, as well as for working capital and general corporate purposes.
Transactions – March 2, 2015
On March 2, 2015, the Company closed two transactions to provide anesthesia services to four
ambulatory surgery centers in Florida and North Carolina representing approximately 9,000 patient
procedures per year. The first transaction, representing the acquisition of two anesthesia providers
servicing three ambulatory surgery centers and approximately 5,000 annual procedures was effective
March 1, 2015. The Company paid $600,000 at close for the transaction; the transaction was financed
by cash on hand. The second transaction represents a new anesthesia services customer and will be
effective in May 2015.

4
NON-IFRS FINANCIAL MEASURES
In addition to results reported in accordance with IFRS, the Company uses certain non-IFRS financial
measures as supplemental indicators of its financial and operating performance. These non-IFRS
financial measures include Operating EBITDA and Operating expenses – adjusted. The Company
believes these supplementary financial measures reflect the Company’s ongoing business in a manner
that allows for meaningful period-to-period comparisons and analysis of trends in its business.
The Company defines Operating EBITDA as operating earnings before interest, taxes, depreciation,
amortization, stock based compensation and acquisition related corporate expense. Operating EBITDA
is presented on a basis consistent with the Company’s internal management reports. The Company
discloses Operating EBITDA to capture the profitability of its business before the impact of items not
considered in management’s evaluation of operating unit performance.
The Company defines Operating expenses – adjusted as operating expenses before expenses related
to acquisitions, stock based compensation, depreciation and amortization. Operating expenses –
adjusted is presented on a basis consistent with the Company’s internal management reports. The
Company discloses Operating expenses – adjusted to capture the non-recurring expenses of the
business before the impact of items not considered in management’s evaluation of operating expenses.
The Company also discloses Operating expenses – adjusted by segment.
Operating EBITDA and Operating expenses – adjusted do not have any standardized meaning
prescribed by IFRS and therefore may not be comparable to similar measures presented by other
companies. The Company cautions readers to consider these non-IFRS financial measures in addition
to, and not as an alternative for, measures calculated in accordance with IFRS.

5
SELECTED QUARTERLY INFORMATION
Q1 2015 Q1 2014
Product sales revenue $ 2,162,519 $ 1,991,224 Anesthesia services revenue 7,457,131 -
Total revenue 9,619,650 1,991,224 Operating expenses – adjusted1
Product sales 904,185 866,915
Anesthesia services 2,984,159 - Corporate 638,305 433,646
Total operating expenses - adjusted1 4,526,649 1,300,561 Operating EBITDA2 5,093,001 690,663
Operating income 3,319,658 562,324
Net income and comprehensive income $ 1,924,047 $ 368,389
Earnings per share basic $ 0.031 $ 0.008 Earnings per share diluted $ 0.030 $ 0.007
Total assets $ 89,352,156 $ 9,249,921 Total non-current liabilities 42,599,617 - Total liabilities $ 47,443,614 $ 461,371
1 Operating expenses - adjusted: This is a non-IFRS measure defined as operating expenses before acquisition related
corporate expenses, stock based compensation, depreciation and amortization. Refer to the end of this document for the reconciliation of reported financial results to non-IFRS measures.
2 Operating EBITDA: This is a non-IFRS measure defined as operating income before interest, taxes, depreciation, amortization
stock based compensation and acquisition related corporate expense. Refer to the end of this document for the reconciliation
of reported financial results to non-IFRS measures.
6
RESULTS OF OPERATIONS
Revenue
Revenues for the three months ended March 31, 2015 were $9,619,650 compared to $1,991,224 for
the three months ended March 31, 2014. The increase in revenues is mainly attributable to the
Company’s newly acquired anesthesia service providers, with total revenue contributions from these
acquisitions of $7,457,131 in combination with an increase in product sales of $171,295.
Revenues from product sales for the quarter ended March 31, 2015 were $2,162,519 compared to
$1,991,224 for the quarter ended March 31, 2014. The 9% increase in product sales is the result of the
continuing successful execution of the Company’s direct to physician program that provides physicians
the ability to purchase our hemorrhoid banding technology, treatment protocols, marketing and
operational experience. As of March 31, 2015 the Company has trained 1,983 physicians to use the
O’Regan System, representing 730 clinical practices. This compares to 1,690 physicians trained,
representing 609 clinical practices, as of March 31, 2014. Based on historical information, the first
quarter of the year represents approximately 23% of total annual product revenue.
In the future, the Company expects revenue from product sales to continue to increase as we expand
our physician network and increase physician use of our technology.
Revenues from anesthesia services for the quarter ended March 31, 2015 were $7,457,131. On March
1, 2015, the Company announced the acquisition of additional services providers. The first acquisition
was effective on March 1, 2015 and, as such, the Company’s results of operations contain one month
of activity from this acquisition and three months of activity from its initial acquisition which completed
in December 2014 (the other transaction will not be included in operations until May 2015). As a result,
there is no comparison to the first quarter of 2014. The new transaction in 2015 contributed revenue
of $163,031 during the quarter. Based on historical information, the first quarter of the year represents
approximately 21% of total annual anesthesia revenues. During the quarter, the anesthesia services
segment serviced 12,395 patient cases through 12 anesthesia service center agreements.
In the future, the Company expects anesthesia revenue to increase through organic growth and through
additional acquisitions.
Total operating expenses - adjusted
For the quarter ended March 31, 2015, total adjusted operating expenses were $4,526,649 compared
to $1,300,561 for the first quarter of 2014. The $3,226,088 increase is primarily related to adjusted
operating expenses for anesthesia services as the prior year comparable quarter does not contain any
anesthesia activity.
Product sales adjusted operating expenses for the quarter were $904,185 compared to $866,915 for
the comparable quarter in 2014. The increase in expenses compared to the first quarter of 2014 is a
reflection of increased product cost and support resulting from increased sales. Product sales
increased by 9% in the period, compared to an increase in expenses of 4%. Effective February 17,
2014, the Company began invoicing customers for the 2.3% medical device excise tax. Prior to
February 17, 2014 the Company was expensing the cost of the medical device excise tax. This has
contributed to product sales growth outpacing the growth in expenses during the quarter. Product sales
expenses primarily include employee wages, product cost and support, marketing programs, office
expenses, professional fees, and insurance. In the future, the Company expects adjusted operating
expenses to increase as the Company continues to invest in activities designed to increase demand
for training and use of the CRH O’Regan System.

7
Anesthesia services adjusted operating expenses for the quarter ended March 31, 2015 were
$2,984,159. Anesthesia services expenses primarily include labor related cost for the medical director
and certified registered nurse anesthetists, medical drugs and supplies, and billing and management
related expenses. The anesthesia segment of the Company was acquired and introduced in the last
quarter of 2014, hence the first quarter of 2014 is not comparable. Adjusted operating expense, as a
percent of revenues, was 40% in the quarter.
Corporate adjusted operating expenses for the quarter ended March 31, 2015 were $638,305
compared to $433,646 for the first quarter of 2014. This reflects a growth in expenses in 2015 of
$204,659. The growth in corporate expenses is primarily the result of an increase in employee related
costs and professional fees and, in general, is reflective of the additional activities incurred in support of
the Company’s expanded service offering.
Operating EBITDA
Operating EBITDA for the quarter was $5,093,001, an increase of $4,402,338 from the first quarter of
2014. This is primarily a reflection of the Company’s newly acquired anesthesia service providers offset
by net increases in product and corporate operating expenses.
Operating Income
Operating income for the quarter ended March 31, 2015 was $3,319,658 compared to $562,324 for the
quarter ended March 31, 2014, an increase of $2,757,334. Contributing to the improved operating
income is the increase in total Operating EBITDA of $4,402,338, less costs related to the amortization
of acquired professional service agreements of $1,402,585 and an increase in stock based
compensation expense of $232,474.
The GAA acquisition in December 2014 was financed by cash on hand along with senior and
subordinated credit facilities from Knight Therapeutics Inc. and affiliates of Crown Capital Partners Inc.,
in the amounts of $30,000,000 and CAD$22,500,000 (USD$19,863,000) respectively, as well as a loan
from The Bloom Burton Healthcare Structured Lending Fund II and a private placement of the
Company’s common shares.
As a result of the debt acquired to fund the GAA acquisition in 2014, the Company has recorded net
finance expense of $1,665,190 during the quarter. Net finance expense is comprised of both interest
and other debt related expenses, as well as foreign exchange gains and losses on the Crown debt
which is denominated in Canadian dollars. In the quarter ended March 31, 2015, the Company
recorded an exchange gain of $1,402,078 in relation to the Crown note. Excluding the impact of the
exchange gain, the finance expense for the period was $3,067,268. During the first quarter of 2015,
the Company repaid $7,968,526 in principal on the Knight facility, thereby reducing finance costs
relating to this facility in the future.
Income tax recovery
For the quarter ended March 31, 2015, the Company recorded an income tax recovery of $269,578
compared to an income tax expense of $193,935 for the quarter ended March 31, 2014. The recovery
experienced in the quarter is a reflection of the utilization of previously unrecognized brought forward
losses in the US as a result of the income generated by the Company’s anesthesia services segment.
The Company estimates that it will fully utilize its brought forward tax losses in 2015.
8
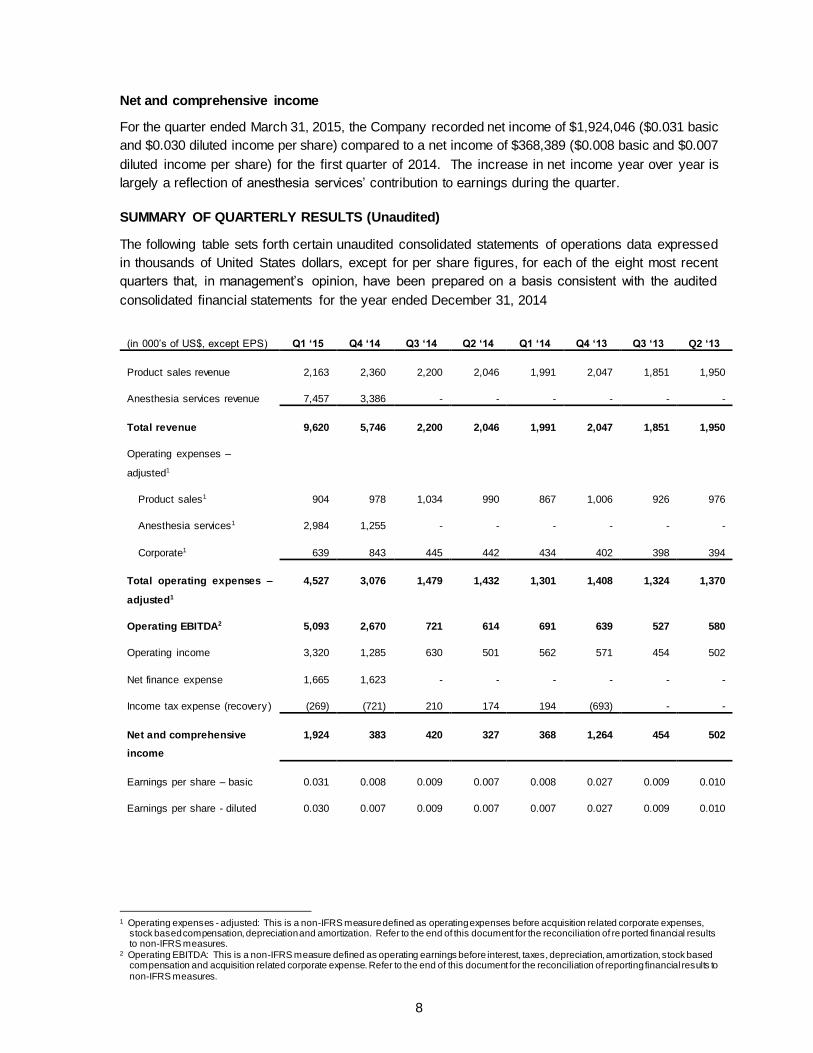
Net and comprehensive income
For the quarter ended March 31, 2015, the Company recorded net income of $1,924,046 ($0.031 basic
and $0.030 diluted income per share) compared to a net income of $368,389 ($0.008 basic and $0.007
diluted income per share) for the first quarter of 2014. The increase in net income year over year is
largely a reflection of anesthesia services’ contribution to earnings during the quarter.
SUMMARY OF QUARTERLY RESULTS (Unaudited)
The following table sets forth certain unaudited consolidated statements of operations data expressed
in thousands of United States dollars, except for per share figures, for each of the eight most recent
quarters that, in management’s opinion, have been prepared on a basis consistent with the audited
consolidated financial statements for the year ended December 31, 2014
(in 000’s of US$, except EPS) Q1 ‘15 Q4 ‘14 Q3 ‘14 Q2 ‘14 Q1 ‘14 Q4 ‘13 Q3 ‘13 Q2 ‘13
Product sales revenue 2,163 2,360 2,200 2,046 1,991 2,047 1,851 1,950
Anesthesia services revenue 7,457 3,386 - - - - - -
Total revenue 9,620 5,746 2,200 2,046 1,991 2,047 1,851 1,950
Operating expenses –
adjusted1
Product sales1 904 978 1,034 990 867 1,006 926 976
Anesthesia services1 2,984 1,255 - - - - - -
Corporate1 639 843 445 442 434 402 398 394
Total operating expenses –
adjusted1
4,527 3,076 1,479 1,432 1,301 1,408 1,324 1,370
Operating EBITDA2 5,093 2,670 721 614 691 639 527 580
Operating income 3,320 1,285 630 501 562 571 454 502
Net finance expense 1,665 1,623 - - - - - -
Income tax expense (recovery) (269) (721) 210 174 194 (693) - -
Net and comprehensive
income
1,924 383 420 327 368 1,264 454 502
Earnings per share – basic 0.031 0.008 0.009 0.007 0.008 0.027 0.009 0.010
Earnings per share - diluted 0.030 0.007 0.009 0.007 0.007 0.027 0.009 0.010
1 Operating expenses - adjusted: This is a non-IFRS measure defined as operating expenses before acquisition related corporate expenses,
stock based compensation, depreciation and amortization. Refer to the end of this document for the reconciliation of reported financial results to non-IFRS measures.
2 Operating EBITDA: This is a non-IFRS measure defined as operating earnings before interest, taxes, depreciation, amortization, stock based compensation and acquisition related corporate expense. Refer to the end of this document for the reconciliation of reporting financial results to non-IFRS measures.

9
LIQUIDITY AND CAPITAL RESOURCES
As at March 31, 2015, the Company had $16,313,885 in cash and cash equivalents compared to
$4,133,663 at the end of 2014. The increase in cash and equivalents is primarily a reflection of the
bought deal equity offering that the Company completed on March 25, 2015. Net proceeds from the
offering were $20,284,399.
Working capital was $16,505,106 compared to negative working capital of $2,577,963 at December 31,
2014. The Company expects to meet its short-term obligations, including short-term obligations in
respect of its notes payable through cash earned through operating activities and from the proceeds of
its bought deal equity offering completed on March 25, 2015.
The Company has financed its operations primarily from revenues generated from product and
anesthesia sales and through equity and debt financings. As of March 31, 2015, the Company has
raised approximately $46 million from the sale and issuance of equity securities. The Company has
also obtained debt financing of $52 million via senior and subordinated credit facilities with Crown,
Bloom Burton and Knight in 2014. There have been no changes in the Crown and Bloom Burton
facilities since December 31, 2014; however, in conjunction with the Company’s bought deal equity
offering, the Company repaid principal of $7,968,526 on its Knight facility. As at March 31, 2015, the
Company is in compliance with all debt covenants relating to these facilities.
Although the Company recorded net earnings for the year ending December 31, 2014 and in the current
quarter, the Company has incurred historical losses, and as at March 31, 2015 had an accumulated
deficit of $10,983,223. The Company expects that going forward cash from operating activities will be
positive and will be sufficient to fund the current business.
Cash provided by operating activities for the quarter ended March 31, 2015 was $2,059,756 compared
to $731,587 for the first quarter of 2014. The acquisition completed during the quarter was financed by
cash on hand.
The Company’s near-term cash requirements relate primarily to interest payments, operations, working
capital and general corporate purposes, including acquisitions. Based on the current business plan, the
Company believes cash and cash equivalents will be sufficient to fund the Company’s operating, debt
repayment and capital requirements for at least the next 12 months. The Company updates its
forecasts on a regular basis and will consider additional financing sources as appropriate.
There were no significant changes, except as previously disclosed in relation to the early repayment of
principal under the Knight facility, in the Company’s contractual commitments compared with those set
forth in the Company’s 2014 Management Discussion and Analysis, available on SEDAR at
www.sedar.com
OUTSTANDING SHARE CAPITAL
As at March 31, 2015, there were 69,060,697 common shares issued and outstanding for a total of
$46,554,104 in share capital.
As at March 31, 2015, there were 3,635,000 options outstanding at a weighted-average exercise price
of $0.54 per share, of which 2,143,149 were exercisable into common shares at a weighted-average
exercise price of $0.57 per share. As at March 31, 2015, there were 2,276,000 share units issued and
outstanding.

10
As at April 28, 2015 there were 69,060,697 common shares issued and outstanding for a total of
$46,554,104 in share capital. There are 3,635,000 options outstanding at a weighted-average exercise
price of $0.57 per share, of which 2,215,014 were exercisable into common shares at a weighted
average price of $0.60 per share.
OFF BALANCE SHEET ARRANGEMENTS
The Company has no material undisclosed off-balance sheet arrangements that have or are reasonably
likely to have, a current or future effect on our results of operations or financial condition.
PROPOSED TRANSACTIONS
As at March 31, 2015, the Board of Directors had not committed to proceed with any proposed asset
or business acquisitions or dispositions that are not disclosed herein.
TRANSACTIONS WITH RELATED PARTIES
Balances and transactions between the Company and its wholly owned subsidiaries and entities over
which the Company has control have been eliminated on consolidation. There have been no changes
to the Company’s identification of related parties, as defined under IAS 24, Related Party Disclosures.
For the period ended March 31, 2015, the Company had related party transactions with key
management personnel pertaining to the ordinary course of their employment or directorship
arrangements. In addition, the Company made product sales to companies owned or controlled by two
of the Company’s Directors.
DISCLOSURE CONTROLS AND PROCEDURES (DCP) AND INTERNAL CONTROLS OVER
FINANCIAL REPORTING (ICFR)
The Company’s disclosure controls and procedures are designed to provide reasonable assurance that
material information required to be disclosed in the prescribed filings and reports filed with the Canadian
securities regulatory authorities is recorded, processed, summarized and reported on a timely basis.
The Company’s controls are also designed to provide reasonable assurance that information required
to be disclosed is assimilated and communicated to senior management in a timely manner so that
appropriate decisions can be made regarding public disclosure.
Management has also designed internal controls over financial reporting to provide reasonable
assurance regarding the reliability of the Company’s financial reporting and the preparation of financial
statements in accordance with International Financial Reporting Standards. Management, including the
Company’s Chief Executive Officer and Chief Financial Officer, is responsible for establishing and
maintaining adequate ICFR, which has been developed based on the framework established in Internal
Control – Integrated Framework issued by the Committee of Sponsoring Organizations of the Treadway
Commission (COSO (1992)).
During the first quarter of 2015, there were no significant changes in the Company’s internal controls
over financial reporting that have materially affected or are reasonably likely to affect the Company’s
internal controls over financial reporting. The Company’s management has evaluated the effectiveness
of the design of the Company’s DCP and ICFR. Based upon the results of that evaluation, the
Company’s Chief Executive Officer and Chief Financial Officer have concluded that, as at March 31,
2015, the design of the Company’s DCP and ICFR is appropriate.

11
As permitted by National Instrument 52-109, the evaluation of the design of disclosure controls and
procedures and internal controls over financial reporting does not include controls, policies and
procedures covering GAA. Prior to its acquisition by the Company, GAA was a privately held company.
GAA had revenues of $7,294,100 and expenses of $4,549,499 million which were included in our
consolidated financial statements for the quarter ended March 31, 2015.
CRITICAL ACCOUNTING ESTIMATES
There were no significant changes to the Company’s critical accounting estimates during the quarter
ended March 31, 2015, except as noted below:
The Company granted share units during the period. The Company uses a fair value based
method of accounting for share-based compensation. As these instruments differ from the
options granted in previous years, the Company has applied a binomial pricing model to value
these instruments. Similar to the Black-Scholes model which was used to value previously
granted options, the application of the binomial pricing model requires management to estimate
several variables, including the period for which the instrument is expected to be outstanding,
price volatility of the Company’s stock over the relevant timeframe, the determination of a
relevant risk free interest rate, assumption regarding the Company’s future dividend rate policy
and estimate of the number of awards that will vest. Changes in one or more assumptions
could materially impact the value derived for these equity instruments.
Historically, the cost of the Company’s intangibles assets have been amortized over the
estimated useful life ranging from 12 to 20 years. As a result of the acquisition completed on
March 1, 2015, the timeframe over which intangibles assets are amortized has been has been
revised to a range of 0.7 to 20 years.
CRH’s critical accounting estimates are described in its MD&A for the year ended December 31, 2014,
filed under the Company’s profile on www.sedar.com.
FUTURE CHANGES IN ACCOUNTING POLICIES
All accounting standards effective for periods beginning on or after January 1, 2015 have been adopted
by the Company. New accounting pronouncements issued but not yet effective are described in note
3 to the annual consolidated financial statements for the year ended December 31, 2014. There are
no new standards issued subsequent to December 31, 2014 which are considered to have an impact
on the Company.

12
FINANCIAL INSTRUMENTS
The Company’s financial instruments consist of cash and cash equivalents, trade and other
receivables, trade and other payables, employee benefit obligations, short term advances, notes
payable, and the Company’s earn-out obligation. The fair values of these financial instruments, except
the notes payable balances and the earn-out obligation, approximate carrying value because of their
short-term nature. The Knight debt and the earn-out obligation arising from the Company’s acquisition
of GAA are classified as financial liabilities recorded at fair value through earnings. For all other debt
balances, the fair value of these financial instruments approximates carrying value as the debt was
acquired on December 1, 2014 and there have been no events or circumstances subsequent to this
date that would suggest a change in fair value.
The Company’s financial instruments are exposed to certain financial risks, including credit risk, liquidity
risk and market risk. There have been no significant changes to those risks impacting the Company
since December 31, 2014, nor has there been a significant change in the composition of its financial
instruments since December 31, 2014, except for the following.
As a result of the close of the Company’s bought deal equity offering on March 25, 2015, there
has been a significant increase in the Company’s cash and cash equivalents. At March 31,
2015, cash and cash equivalents totaled $16,313,885 (December 31, 2014 - $4,133,663). The
Company continues to limit its exposure to credit risk on its cash and cash equivalents by
placing these financial instruments with high-credit quality financial institutions and only
investing in liquid, investment grade securities.
On March 25, 2015, in conjunction with the close of the Company’s bought deal equity offering,
the Company repaid $7,968,526 of the principal balance owing, with related interest of
$251,063. The Company has used a probability weighted valuation technique in calculating
the fair value of the Knight note. Due to the timing of the principal repayment, the Company
has revised certain inputs and probabilities relating to estimated cash flows. This resulted in
an upward adjustment of $654,249 to the fair value of the Knight note with the impact of the
adjustment recorded through finance expense in the period.

13
NON-IFRS MEASUREMENTS
The following are non-IFRS measures and investors are cautioned not to place undue reliance on them
and are urged to read all IFRS accounting disclosures present in the condensed consolidated interim
financial statements and accompanying notes for the three months ended March 31, 2015 and
consolidated financial statements and accompanying notes for the year ended December 31, 2014.
The Company uses certain non-IFRS financial measures as supplemental indicators of its financial and
operating performance. These non-IFRS financial measures include Operating EBITDA and Operating
expenses - adjusted. The Company believes these supplementary financial measure reflects the
Company’s ongoing business in a manner that allows for meaningful period-to-period comparisons and
analysis of trends in its business. These non-IFRS measures do not have any standardized meaning
prescribed under IFRS and are therefore unlikely to be comparable to similar measures presented by
other companies.
The Company defines Operating EBITDA as operating earnings before interest, taxes, depreciation,
amortization, stock based compensation and acquisition related corporate expense. Operating
EBITDA is presented on a basis consistent with the Company’s internal management reports. The
Company discloses Operating EBITDA to capture the profitability of its business before the impact of
items not considered in management’s evaluation of operating unit performance.
The Company defines Operating expenses - adjusted as operating expenses before acquisition related
corporate expense, stock based compensation, depreciation, and amortization. Operating expenses -
adjusted is presented on a basis consistent with the Company’s internal management reports.
The non-IFRS measures are reconciled to reported IFRS figures in the tables below:
Operating EBITDA
For the three months ended 2015 2014 2013
(USD in thousands) Mar Dec Sep Jun Mar Dec Sep Jun Mar
Total Operating EBITDA 5,093 2,670 721 614 691 639 527 580 371
Amortization expense (1,402) (458) - - - - - - -
Depreciation expense (12) (13) (10) (12) (18) (28) (19) (18) (18)
Stock based compensation (343) (69) (82) (101) (110) (40) (54) (61) (80)
Acquisition expenses (16) (845) - - - - - - -
Operating income 3,320 1,285 629 501 563 571 454 501 273

14
Operating expenses - adjusted
For the three months ended 2015 2014 2013
(USD in thousands) Mar Dec Sep Jun Mar Dec Sep Jun Mar Product sales operating expense – adjusted 904 978 1,034 990 867 1,005 926 976 1,105
Amortization expense - - - - - - - - - Depreciation expense 1 1 - 1 7 1 9 8 8 Stock based compensation 136 22 19 21 31 20 30 33 45
Product sales expense 1,041 1,001 1,053 1,012 905 1,026 965 1,017 1,158
Anesthesia services operating expense – adjusted 2,984 1,255 - - - - - - -
Amortization expense 1,403 458 - - - - - - - Depreciation expense - - - - - - - - - Stock based compensation 2 - - - - - - - -
Anesthesia services expense 4,389 1,713 - - - - - - -
Corporate operating expenses – adjusted 638 843 445 442 434 402 398 394 360
Amortization expense - - - - - - - - - Depreciation expense 11 12 10 11 11 27 10 9 9 Stock based compensation 205 47 63 80 79 21 24 28 34 Acquisition expenses 16 845 - - - - - - -
Corporate expense 870 1,747 518 533 524 450 432 431 403
Total operating expense – adjusted 4,527 3,076 1,479 1,432 1,301 1,407 1,324 1,370 1,465 Total operating expense 6,300 4,461 1,571 1,545 1,429 1,476 1,397 1,448 1,561

Condensed Consolidated Interim Financial Statements
(Expressed in United States dollars)
CRH MEDICAL CORPORATION
(unaudited)
Three months ended March 31, 2015 and 2014

Notice of no auditor review of Interim Financial Statements
Under National Instrument 51-102, Part 4, subsection 4.3(3)(a), if an auditor has not performed a review
of the interim financial statements they must be accompanied by a notice indicating that the financial
statements have not been reviewed by an auditor.
The accompanying unaudited condensed consolidated interim financial statements of the Company
have been prepared by and are the responsibility of the Company’s management.
The Company's independent auditor has not performed a review of these financial statements in
accordance with standards established by the Canadian Institute of Chartered Accountants for a review
of interim financial statements by an entity's auditor.
1
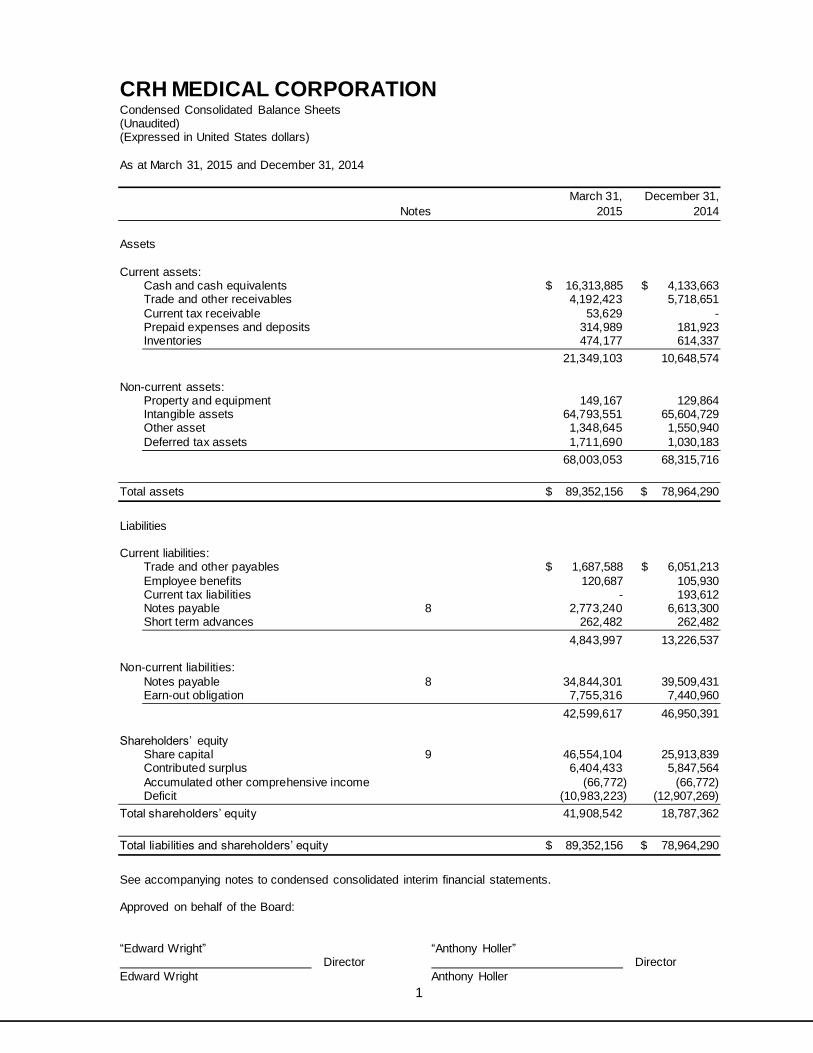
CRH MEDICAL CORPORATION Condensed Consolidated Balance Sheets (Unaudited) (Expressed in United States dollars)
As at March 31, 2015 and December 31, 2014
March 31, December 31,
Notes 2015 2014
Assets
Current assets:
Cash and cash equivalents $ 16,313,885 $ 4,133,663 Trade and other receivables 4,192,423 5,718,651
Current tax receivable 53,629 - Prepaid expenses and deposits 314,989 181,923 Inventories 474,177 614,337
21,349,103 10,648,574
Non-current assets: Property and equipment 149,167 129,864 Intangible assets 64,793,551 65,604,729 Other asset 1,348,645 1,550,940
Deferred tax assets 1,711,690 1,030,183
68,003,053 68,315,716
Total assets $ 89,352,156 $ 78,964,290
Liabilities
Current liabilities: Trade and other payables $ 1,687,588 $ 6,051,213
Employee benefits 120,687 105,930 Current tax liabilities - 193,612 Notes payable 8 2,773,240 6,613,300 Short term advances 262,482 262,482
4,843,997 13,226,537
Non-current liabilities:
Notes payable 8 34,844,301 39,509,431 Earn-out obligation 7,755,316 7,440,960
42,599,617 46,950,391 Shareholders’ equity
Share capital 9 46,554,104 25,913,839 Contributed surplus 6,404,433 5,847,564
Accumulated other comprehensive income (66,772) (66,772) Deficit (10,983,223) (12,907,269)
Total shareholders’ equity 41,908,542 18,787,362
Total liabilities and shareholders’ equity $ 89,352,156 $ 78,964,290
See accompanying notes to condensed consolidated interim financial statements. Approved on behalf of the Board:
“Edward Wright” “Anthony Holler” Director Director
Edward Wright Anthony Holler

2
CRH MEDICAL CORPORATION Condensed Consolidated Interim Statements of Operations and Comprehensive Income (Unaudited) (Expressed in United States dollars)
Three month periods ended March 31, 2015 and 2014
Three months ended
March 31, March 31,
Notes 2015 2014
Revenue:
Product sales 12 $ 2,162,519 $ 1,991,224
Anesthesia services 12 7,457,131 -
9,619,650 1,991,224
Expenses:
Product sales expense 5 1,040,336 904,903
Anesthesia services expense 6 4,389,083 - Corporate expense 7 870,573 523,997
6,299,992 1,428,900
Operating income 3,319,658 562,324
Net finance income 10 (1,402,078) -
Net finance expense 10 3,067,268 -
Income and comprehensive income before tax 1,654,468 562,324
Income tax (recovery) (269,578) 193,935
Net and comprehensive income $ 1,924,046 $ 368,389
Earnings per share - basic 9(c) $ 0.031 $ 0.008
- diluted 9(c) $ 0.030 $ 0.007
Weighted average shares outstanding: - basic 61,466,638 48,779,026 - diluted 64,456,374 49,221,007
See accompanying notes to condensed consolidated interim financial statements.

3
CRH MEDICAL CORPORATION Condensed Consolidated Interim Statements of Changes in Equity (Unaudited) (Expressed in United States dollars)
Three month periods ended March 31, 2015 and 2014
Accumulated
other
Number of Share Contributed comprehensive shares capital surplus income Deficit Total
Balance as at January 1, 2014 48,746,914 $ 17,181,474 $ 5,570,839 $ (66,772) $ (14,405,422) $ 8,280,119
Total net and comprehensive income for the period - - - - 368,389 368,389 Transactions with owners, recorded directly in equity:
Stock based compensation for stock option plan - - 110,218 - - 110,218
Common shares purchased on exercise of options 50,000 46,315 (16,490) - - 29,825
Balance as at March 31, 2014 48,796,914 17,227,789 5,664,567 (66,772) (14,037,033) 8,788,551
Balance as at January 1, 2015 60,881,947 25,913,839 5,847,564 (66,772) (12,907,269) 18,787,362
Total net and comprehensive income for the period - - - - 1,924,046 1,924,046 Transactions with owners, recorded directly in equity:
Stock based compensation for stock option and share unit plans - - 342,693 - - 342,693
Common shares purchased on exercise of options 128,750 152,846 (34,973) - - 117,873
Shares issued through share offering, net of fees (note 9) 8,050,000 20,284,399 - - - 20,284,399
Deferred tax recovery on share issuance costs (note 9) - 452,169 - - - 452,169
Broker warrants issued in connection with share offering (note 9) - (249,149) 249,149 - - -
Balance as at March 31, 2015 69,060,697 $ 46,554,104 $ 6,404,433 $ (66,772) $ (10,983,223) $ 41,908,542
See accompanying notes to condensed consolidated interim financial statements.

4
CRH MEDICAL CORPORATION Condensed Consolidated Interim Statements of Cash Flows (Unaudited) (Expressed in United States dollars)
Three month periods ended March 31, 2015 and 2014
Three months ended
March 31, March 31,
2015 2014
Cash provided by (used in):
Operating activities: Net income $ 1,924,046 $ 368,389 Adjustments for:
Depreciation of property, equipment and
intangibles 1,414,568 18,121 Stock based compensation 342,693 110,218 Unrealized foreign exchange (gain) (1,396,695) - Net finance expense 3,067,268 -
Income tax expense (recovery) (269,578) 193,935
Operating activity before changes in operating
assets and liabilities 5,082,302 690,663 Taxes paid (207,000) - Change in trade and other receivables 1,526,228 36,116 Change in prepaid expenses and deposits (133,066) (52,647)
Change in inventories 140,160 (50,661) Change in trade and other payables (4,363,625) 21,596 Change in employee benefits 14,757 86,520
Cash provided by operating activities 2,059,756 731,587
Financing activities
Net proceeds on the issuance of shares 20,284,399 - Repayment of notes payable, principal and interest (9,653,658) - Proceeds from the issuance of shares relating to
stock based compensation 117,873 29,825
Cash provided by financing activities 10,748,614 29,825
Investing activities: Acquisition of property and equipment (22,693) (1,115) Acquisition of anesthesia services provider 4 (600,000) -
Cash used in investing activities (622,693) (1,115)
Effects of foreign exchange on cash and cash equivalents (5,455) -
Increase in cash and cash equivalents 12,180,222 760,297 Cash and cash equivalents, beginning of period 4,133,663 6,602,798
Cash and cash equivalents, end of period $ 16,313,885 $ 7,363,095
See accompanying notes to condensed consolidated interim financial statements.

CRH MEDICAL CORPORATION Notes to Condensed Consolidated Interim Financial Statements
(Unaudited) (Expressed in United States dollars) For the three month periods ended March 31, 2015 and 2014
5
1. Reporting entity:
CRH Medical Corporation (“CRH” or “the Company”) was incorporated on April 21, 2001 and is
incorporated under the Business Corporations Act and specializes in the treatment of hemorrhoids
utilizing its treatment protocol and patented proprietary technology. The Company also provides
anesthesiology services to gastroenterologists in the southeastern United States through its
subsidiaries. Refer to note 4.
CRH principally operates in the United States and is headquartered from its registered offices
located at Unit 522, 999 Canada Place, Vancouver, British Columbia, Canada.
2. Basis of preparation:
(a) Statement of compliance:
These unaudited condensed consolidated interim financial statement of the Company have
been prepared in accordance with International Financial Reporting Standards (“IFRS”) as
issued by the International Accounting Standards Board (“IASB”). Accordingly, these
condensed consolidated interim financial statements have been prepared in accordance with
IFRS applicable to the preparation of interim financial statements, including International
Accounting Standard 34, Interim Financial Reporting (“IAS 34”). These condensed
consolidated interim financial statements do not include all the information and note disclosures
required by IFRS for annual financial statements and therefore should be read in conjunction
with the Company’s audited consolidated financial statements and the notes thereto for the
year ended December 31, 2014. In management’s opinion, all adjustments considered
necessary for fair presentation have been included in these financial statements. Interim
results are not necessarily indicative of the results expected for the fiscal year. Certain
comparative figures have been reclassified to conform to the current period’s presentation.
The condensed consolidated interim financial statements were authorized for issue by the
Board of Directors on April 28, 2015.
(b) Basis of measurement:
The Company’s condensed consolidated interim financial statements have been prepared on
a going concern and historical cost basis except for certain financial instruments which are
recorded at fair value.
(c) Functional and presentation currency:
These condensed consolidated interim financial statements are presented in United States
dollars, which is the Company’s functional currency.

CRH MEDICAL CORPORATION Notes to Condensed Consolidated Interim Financial Statements
(Unaudited) (Expressed in United States dollars) For the three month periods ended March 31, 2015 and 2014
6
2. Basis of preparation (continued):
(d) Use of estimates, assumptions and judgments:
The preparation of the Company’s condensed consolidated interim financial statements
requires management to make judgments, estimates and assumptions that affect the
application of accounting policies, the reported amounts of assets and liabilities, the disclosure
of contingent assets and liabilities at the date of the financial statements and the reported
amounts of revenues and expenses during the reporting period.
Significant areas requiring the use of management estimates relate to the assessment for
impairment and useful lives of intangible assets, determining the fair value of share units,
estimates of accruals, estimation of useful lives of property, plant and equipment, estimates
supporting reported revenues, the recoverability of trade receivables, the valuation of certain
long term liabilities and other assets, including liabilities relating to contingent consideration,
the valuation of acquired intangibles and the valuation of deferred tax assets
Significant judgments made by management in the process of applying accounting policies and
that have the most significant effect on the amounts recognized in the consolidated financial
statements includes the determination of functional currency and the accounting classification
of financial instruments. In conjunction with the Company’s business acquisition, these
judgments also include the Company’s determination of control for the purposes of
consolidation, the Company’s definition of a business, as well as the allocation of purchase
consideration to the fair value of assets acquired and liabilities assumed.
Reported amounts and note disclosures reflect the overall economic conditions that are most
likely to occur and anticipated measures management intends to take. Actual results could
differ from those estimates.
3. Significant accounting policies:
These condensed consolidated interim financial statements have been prepared using the
significant accounting policies and methods of computation consistent with those applied in the
Company’s December 31, 2014 annual consolidated financial statements.
The Company has not early adopted any amendment, standard or interpretation that has been
issued by the IASB but is not yet effective. Amendments, standards and interpretations that are
issued but not yet effective are described in the Company’s annual financial statements for the
period ended December 31, 2014.
The Company’s interim results are not necessarily indicative of its results for a full year.

CRH MEDICAL CORPORATION Notes to Condensed Consolidated Interim Financial Statements
(Unaudited) (Expressed in United States dollars) For the three month periods ended March 31, 2015 and 2014
7
4. Business combinations:
On March 1, 2015, a subsidiary of the Company entered into an asset purchase agreement to
purchase certain assets of two anesthesia services providers in the Southeastern United States.
The total purchase price under the asset purchase agreement was $600,000.
The following table summarizes the fair value of the consideration transferred and the preliminary
estimated fair values of the assets and liabilities acquired at the acquisition date. Certain of the
estimates of fair value, most notably the professional services agreements, may be subject to
further adjustments.
Cash $ 600,000
Purchase consideration $ 600,000
Assets and liabilities acquired:
Exclusive professional services agreements $ 600,000
Fair value of net identifiable assets acquired $ 600,000
The value of the acquired intangible assets, being exclusive professional services agreements, has
been determined on a provisional basis and relates to the acquisition of exclusive professional
services agreements to provide professional anesthesia services. As at the acquisition date, the
exclusive professional services agreements had estimated remaining contractual terms varying
from 0.7 to 2.8 years. The Company will amortize these contractual assets the length of the
remaining contractual terms. Should the amount allocated to intangible assets materially change
in the final purchase price allocation, amortization will be adjusted.
The Company incurred acquisition related costs of $16,082 relating to legal fees which have been
expensed as incurred.
In the period March 1, 2015 to March 31, 2015, this acquisition contributed revenue of $163,031
and net earnings before tax of $11,430. The following unaudited supplemental pro forma financial
information presents consolidated information as if the acquisition had been completed on January
1, 2015. The pro forma financial information presented below (unaudited) is for informational
purposes only and is not indicative of the results of operations that would have been achieved if
the acquisition had taken place at the beginning of fiscal 2015. The pro forma financial information
(unaudited) presented includes amortization charges for acquired intangible assets based on the
values assigned in the purchase price allocation. Amortization charges in the period were $28,376.
2015
Pro Forma Information (unaudited) Revenue $ 489,093
Net income before tax $ 34,290

CRH MEDICAL CORPORATION Notes to Condensed Consolidated Interim Financial Statements
(Unaudited) (Expressed in United States dollars) For the three month periods ended March 31, 2015 and 2014
8
4. Business combinations (continued):
Gastroenterology Anesthesia Associates LLC (“GAA”)
On December 1, 2014, a subsidiary of the Company entered into an acquisition agreement to
purchase the business, assets and interests of Gastroenterology Anesthesia Associates LLC (the
“LLC”) and the business interest contained in a management services agreement held by another
private entity (“GAAM”), together the combined business hereinafter referred to as “GAA”. The
total purchase price under the agreement was $58,623,000 paid at closing and up to an additional
$14,655,000 payable within 4.5 years based on the achievement of certain financial performance
targets of GAA (the “Earn-out obligation”). As at March 31, 2015, the Company has estimated that
potential payments in respect of the earn-out obligation will range from $11,981,135 to
$14,655,000. The maximum total purchase price assuming achievement of all performance
measures is $73,278,000. The earn-out obligation has been recorded at the net present value of
its fair value as at the date of the acquisition, discounted at 18%, and changes in the fair value are
recorded through earnings.
Included in these condensed consolidated interim financial statements for the three month period
ended March 31, 2015 for GAA are sales of $7,294,100 and net earnings before tax of $2,744,602.
CRH has obtained control over GAA through its contractual ability to direct its relevant activities
and its right to variable returns.
The following table summarizes the fair value of the consideration transferred and the estimated
fair values of the assets and liabilities acquired at the acquisition date. Certain of the estimates of
fair value, most notably, professional services agreements and the contingent earn-out obligation
are preliminary and may be subject to further adjustments.
Cash $ 58,623,000
Contingent consideration (“Earn-out obligation”) 7,339,032
Purchase consideration 65,962,032
Assets and liabilities acquired
Exclusive professional services agreements 65,962,032
Cash 2,011,548
Pre-close trade receivables 4,849,289
Pre-close trade payables (6,860,837)
Fair value of net identifiable assets acquired $ 65,962,032
The value of the acquired intangible assets, being the exclusive professional services agreements,
has been determined on a provisional basis and relates to the acquisition of exclusive professional
services agreements to provide professional anesthesia services. As at the acquisition date, the
exclusive professional services agreements had a remaining contractual term of 6 years and 11
months and can be renewed by agreement of both parties. The Company amortizes these
contractual assets over a term of 12 years.

CRH MEDICAL CORPORATION Notes to Condensed Consolidated Interim Financial Statements
(Unaudited) (Expressed in United States dollars) For the three month periods ended March 31, 2015 and 2014
9
5. Product sales expense:
For the three month periods ended March 31:
2015 2014
Employee related $ 331,471 $ 348,834 Product cost and support 463,046 419,831 Professional fees 38,853 47,556 Office related 50,662 38,868
Stock based compensation 135,502 30,769 Insurance 14,275 11,826 Depreciation and amortization 649 7,219 Foreign exchange 5,878 -
$ 1,040,336 $ 904,903
6. Anesthesia services expense:
For the three month periods ended March 31:
2015 2014
Employee related $ 1,707,300 $ - Amortization 1,402,585 - Bad debt expense 383,706 - Office related 730,711 - Medical supplies 162,042 -
Stock based compensation 2,339 - Professional fees 400 -
$ 4,389,083 $ -
7. Corporate expense:
For the three month periods ended March 31:
2015 2014
Employee related $ 246,009 $ 216,798
Professional expenses 162,978 75,952 Corporate 93,341 74,040 Stock based compensation 204,852 79,449 Travel and entertainment 62,244 36,441 Office related 33,902 16,916 Insurance 41,440 13,499
Acquisition expenses 16,082 - Depreciation and amortization 11,334 10,902 Foreign exchange (1,609) -
$ 870,573 $ 523,997

CRH MEDICAL CORPORATION Notes to Condensed Consolidated Interim Financial Statements
(Unaudited) (Expressed in United States dollars) For the three month periods ended March 31, 2015 and 2014
10
8. Notes payable:
March 31, 2015
Crown Note
Knight Note
Knight Annual
Fee
Bloom Burton
Facility Total
Current portion $ - 1,988,758 784,482 - $ 2,773,240
Non-current portion 15,014,552 17,819,193 - 2,010,556 34,844,301
Total loans and borrowings $ 15,014,552 19,807,951 784,482 2,010,556 $ 37,617,541
December 31, 2014
Crown Note
Knight Note
Knight Annual
Fee
Bloom Burton
Facility Total
Current portion $ 193,950 5,666,667 752,683 - $ 6,613,300
Non-current portion 16,224,216 21,338,826 - 1,946,389 39,509,431
Total loans and borrowings $ 16,418,166 27,005,493 752,683 1,946,389 $ 46,122,731
Norrep Credit Opportunities Fund II, LP (“Crown Note”)
On December 1, 2014, the Company entered into an agreement to borrow funds in the form of a
subordinated note payable from Norrep Credit Opportunities Fund II, LP. At inception, the original
amount of the note payable was CAD$22,500,000 (USD$19,863,000). The note bears interest at
12% per annum with a decrease to 10% upon repayment and performance in full of the Company’s
obligations under its senior credit agreement (see Knight Note). Interest on the note is payable on
a quarterly basis beginning March 31, 2015, with the payment of the principal scheduled for June
1, 2018. In compensation for its services, the Company paid Crown a combination of cash
CAD$1,350,000 (USD$1,191,780) and shares (2,000,000 common shares) in addition to
reimbursement of legal costs in relation to issuance of the note. The Crown note is subordinate to
the Knight note. The note is classified as an other financial liability and recorded at amortized cost.
Knight Therapeutics Inc. (“Knight Note”)
On December 1, 2014, the Company entered into an agreement to borrow funds in the form of a
secured note payable from Knight Therapeutics Inc. At inception, the original amount of the note
payable was $30,000,000. The note bears interest at a maximum of 12% per annum. Interest on
the note is payable on a quarterly basis beginning March 31, 2015. The earliest maturity date of
the loan is December 1, 2016, but may be extended to December 1, 2017 if certain conditions are
met. The agreement contains contractual clauses that may require early repayment of a portion of
the principal balance should the Company complete an equity financing. In compensation for its
services, the Company paid Knight a combination of cash ($1,200,000) and shares (3,000,000
common shares) in addition to reimbursement of legal costs in relation to issuance of the note. The
note is classified as an other financial liability and recorded at fair value through earnings.

CRH MEDICAL CORPORATION Notes to Condensed Consolidated Interim Financial Statements
(Unaudited) (Expressed in United States dollars) For the three month periods ended March 31, 2015 and 2014
11
8. Notes payable (continued):
Knight Therapeutics Inc. (“Knight Note”) - continued
On March 25, 2015, in conjunction with the close of the Company’s bought deal equity offering, the
Company repaid $7,968,526 of the principal balance owing, with related interest of $251,063. The
Company has used a probability weighted valuation technique in calculating the fair value of the
Knight note. Due to the timing of the principal repayment, the Company has revised certain inputs
and probabilities relating to estimated cash flows. This resulted in an upward adjustment of
$654,249 to the fair value of the Knight note with the impact of the adjustment recorded through
finance expense in the period. The principal repayment satisfies the Company’s contractual
requirement to repay a portion of the outstanding principal balance should the Company complete
an equity financing.
Knight Therapeutics Inc. – Annual Fee (“Knight Annual Fee”)
In accordance with the Knight note agreement, the Company is obligated to pay an annual fee
relating to a comfort letter provided by Knight in respect of the Company’s earn-out obligation (note
4). This fee has been recognized as a separate financial liability, and recorded at fair value based
on the Company’s best estimate of the amount to be paid, and subsequently measured at
amortized cost.
Bloom Burton Healthcare Structured Lending Fund II (“Bloom Burton Facility”)
On December 1, 2014, the Company entered into an unsecured facility agreement with Bloom
Burton Healthcare Structured Lending Fund II (“Bloom Burton”) with a maximum borrowing limit of
$2,000,000. The facility bears interest at 12% per annum. Accrued interest is payable on the
maturity date or the date of any voluntary prepayment of the loan. Full payment is required within
54 months after the first advance under the facility or at date mutually agreed between the Company
and Bloom Burton. As at March 31, 2015, the Company had drawn $2,000,000 under the facility.
The facility is subordinate to the Knight note. The facility is classified as an other financial liability
and recorded at amortized cost.
The consolidated minimum loan payments (principal and interest) for all loan agreements in the future are as follows:
Minimum Principal
and Interest
At March 31, 2015 Not later than one year $ 5,210,797 Between one and five years $ 49,225,556
$ 54,436,353

CRH MEDICAL CORPORATION Notes to Condensed Consolidated Interim Financial Statements
(Unaudited) (Expressed in United States dollars) For the three month periods ended March 31, 2015 and 2014
12
9. Share capital:
(a) Issued and outstanding – common shares:
On March 25, 2015, the Company closed a bought deal equity offering and over-allotment
option of 7,000,000 and 1,050,000 common shares, respectively, at a price of $2.72
(CAD$3.40) per common share for gross proceeds of $21,865,893 (CAD$27,370,000). In
connection with the offering, the underwriters were paid a 6% commission totaling
approximately $1,311,954 (CAD$1,642,200) and received 241,500 broker warrants with a fair
value of $249,149 (CAD$311,535). Additional share issuance costs of $269,539
(CAD$337,388) were incurred in relation to the offering. The Company has recorded a
deferred tax asset of $452,169 in relation to those share issuance costs incurred in relation to
the offering. The deferred tax asset has been offset against share capital.
(b) Share unit plan:
In June 2014, the shareholders of the Company approved a Share Unit Plan. Employees,
directors and eligible consultants of the Company and its designated subsidiaries are eligible
to participate in the Share Unit Plan. In accordance with the terms of the plan, the Company
will approve those employees, directors and eligible consultants who are entitled to receive
share units and the number of share units to be awarded to each participant. Each share unit
awarded conditionally entitles the participant to receive one common share of the Company
upon attainment of the share unit vesting criteria. The vesting of share units is conditional upon
the expiry of time-based vesting conditions, performance-based vesting conditions or a
combination of the two. Once the share units vest, the participant is entitled to receive the
equivalent number of underlying common shares.
The Company issued 2,276,000 share units during the period ended March 31, 2015. Of these
units, 276,000 units vest over a 4 year term, with 50% vesting on the second anniversary and
25% vesting on each of the third and fourth anniversaries. The fair value per unit was $2.97
(CAD$3.72) based on the market value of the underlying shares at the date of issuance. The
remaining 2,000,000 share units vest upon the Company meeting certain market based
performance targets. The weighted average fair value of these units at the date of grant was
$1.67 (CAD$2.09) per unit. The fair value of these share units was calculated as of the grant
date using a binomial pricing model with the following weighted average assumptions:
2015
Risk-free interest rate 0.61% Expected volatility 60.5% Pre-vest forfeiture rate 0% Weighted average share price CAD$2.45
For the three months ended March 31, 2015, the Company recognized $195,084 (2014 - $nil),
in compensation expense in relation to the granting and vesting of share units. The Company
also recognized $147,609 of compensation expense (2014 - $110,218) in relation to share
options previously granted.
CRH MEDICAL CORPORATION Notes to Condensed Consolidated Interim Financial Statements
(Unaudited) (Expressed in United States dollars) For the three month periods ended March 31, 2015 and 2014
13
9. Share capital (continued):
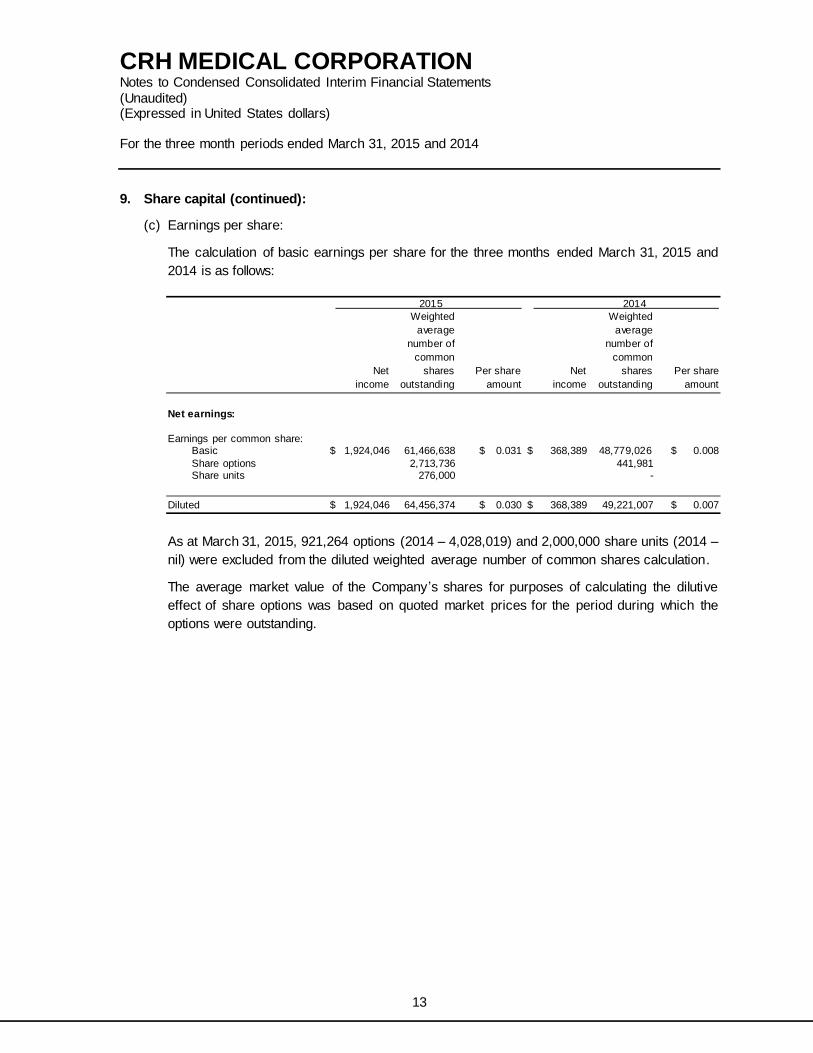
(c) Earnings per share:
The calculation of basic earnings per share for the three months ended March 31, 2015 and
2014 is as follows:
2015 2014
Weighted Weighted
average average
number of number of
common common
Net shares Per share Net shares Per share
income outstanding amount income outstanding amount
Net earnings:
Earnings per common share:
Basic $ 1,924,046 61,466,638 $ 0.031 $ 368,389 48,779,026 $ 0.008
Share options 2,713,736 441,981 Share units 276,000 -
Diluted $ 1,924,046 64,456,374 $ 0.030 $ 368,389 49,221,007 $ 0.007
As at March 31, 2015, 921,264 options (2014 – 4,028,019) and 2,000,000 share units (2014 –
nil) were excluded from the diluted weighted average number of common shares calculation.
The average market value of the Company’s shares for purposes of calculating the dilutive
effect of share options was based on quoted market prices for the period during which the
options were outstanding.

CRH MEDICAL CORPORATION Notes to Condensed Consolidated Interim Financial Statements
(Unaudited) (Expressed in United States dollars) For the three month periods ended March 31, 2015 and 2014
14
10. Net finance expense
Recognized in earnings in the three month periods ended March 31:
2015 2014
Finance income:
Foreign exchange (gain) $(1,402,078) $ -
Total finance income $(1,402,078) $ -
Finance expense:
Interest and accretion expense on borrowings $ 1,896,367 -
Accretion expense on earn-out obligation 314,356 -
Amortization of deferred financing fees 202,296 - Net change in fair value of financial liabilities at fair
value through earnings
654,249 -
Total finance expense $ 3,067,268 $ -
Net finance expense $ 1,665,190 $ -
11. Financial instruments:
The Company’s financial instruments consist of cash and cash equivalents, trade and other
receivables, trade and other payables, employee benefit obligations, short term advances, notes
payable, and the Company’s earn-out obligation. The fair values of these financial instruments,
except the notes payable balances and the earn-out obligation, approximate carrying value
because of their short-term nature. The Knight debt (note 8) and the earn-out obligation are
classified as financial liabilities recorded at fair value through earnings. For all other debt balances,
the fair value of these financial instruments approximates carrying value as the debt was acquired
on December 1, 2014 and there have been no events or circumstances subsequent to this date
that would suggest a change in fair value.
An established fair value hierarchy requires the Company to maximize the use of observable inputs
and minimize the use of unobservable inputs when measuring fair value. A financial instrument’s
categorization within the fair value hierarchy is based upon the lowest level of input that is available
and significant to the fair value measurement. There are three levels of inputs that may be used to
measure fair value:
Level 1 - quoted prices (unadjusted) in active markets for identical assets or liabilities;
Level 2 - inputs other than quoted prices included within Level 1 that are observable for the
asset or liability, either directly (i.e. as prices) or indirectly (i.e. derived from prices) ; and
Level 3 - inputs for the asset or liability that are not based on observable market data
(unobservable inputs).

CRH MEDICAL CORPORATION Notes to Condensed Consolidated Interim Financial Statements
(Unaudited) (Expressed in United States dollars) For the three month periods ended March 31, 2015 and 2014
15
11. Financial instruments (continued):
The following financial assets and liabilities are measured at fair value on a recurring basis using
quoted prices in active markets for identifiable assets (Level 1); significant other observable inputs
(Level 2); and significant unobservable inputs (Level 3):
March 31, 2015 Fair Value
Carrying Value Level 1 Level 2 Level 3
Financial liabilities
Notes payable
$19,807,951 - - $19,807,951
Earn-out obligation $ 7,755,316 - - $ 7,755,316
December 31, 2014 Fair Value
Carrying Value Level 1 Level 2 Level 3
Financial liabilities
Notes payable
$27,005,493 - - $27,005,493
Earn-out obligation $ 7,440,960 - - $ 7,440,960
The Company has used a probability weighted valuation technique in calculating the fair value of
the Knight note payable and the earn-out obligation. This valuation technique included inputs
relating to estimated cash outflows under each arrangement and the use of a discount rate
appropriate to the Company (18%). The fair value measurements are sensitive to the discount rate
used in calculating the fair values. A 1% increase in the discount rate would reduce the fair value
of the Knight note and earn-out obligation, in combination, by $512,858. During the quarter ended
March 31, 2015, the Company recorded accretion expense of $1,412,512 in relation to these
liabilities, reflecting the change in fair value of the liabilities that is attributable to credit risk.
Reconciliation of level 3 fair values:
Notes
Payable Earn-out
Obligation
Total
Balance as at January 1, 2015 $27,005,493 $7,440,960 $34,446,453 Repayment of principal and interest (8,949,947) - (8,949,947)
Recorded in finance expense: Accretion expense 1,098,156 314,356 1,412,512
Fair value adjustment 654,249 - 654,249
Balance as at March 31, 2015 $19,807,951 $7,755,316 $27,563,267

CRH MEDICAL CORPORATION Notes to Condensed Consolidated Interim Financial Statements
(Unaudited) (Expressed in United States dollars) For the three month periods ended March 31, 2015 and 2014
16
12. Segmented information:
The Company operates in two industry segments: the sale of medical products and the provision
of anesthesia services. The revenues relating to geographic segments based on customer
location, in United States dollars, for the three months ended March 31, 2015 and 2014 are as
follows:
Revenue: 2015 2014
Canada $ 41,111 $ 38,361
United States 9,578,539 1,952,863
Total $ 9,619,650 $ 1,991,224
The Company’s property and equipment, intangibles and other assets are located in the following
geographic regions as at March 31, 2015 and December 31, 2014:
2015 2014
Property and equipment:
Canada $ 147,082 $ 129,864
United States 2,085 -
Total $ 149,167 $ 129,864
Intangible assets:
Canada $ 92,174 $ 100,767
United States $ 64,701,377 65,503,962
Total $ 64,793,551 $ 65,604,729
Other assets:
Canada $ 1,348,645 $ 1,550,940
United States - -
Total $ 1,348,645 $ 1,550,940

CRH MEDICAL CORPORATION Notes to Condensed Consolidated Interim Financial Statements
(Unaudited) (Expressed in United States dollars) For the three month periods ended March 31, 2015 and 2014
17
12. Segmented information (continued):
The Company operates in two industry segments, being the sale of medical products and the
provision of anesthesia services. Substantially all of the Company's operations, assets and
employees are located in Canada and the United States. The financial measures reviewed by the
Company’s Chief Operating Decision Maker are presented below for the three month periods
ended March 31, 2015 and 2014. The Company does not allocate expenses related to corporate
activities. These expenses are presented within “Other” to allow for reconciliation to reported
measures.
2015
Product sales
Anesthesia
services Other Total
Revenue $ 2,162,519 $ 7,457,131 $ - $ 9,619,650
Operating costs 1,040,336 4,389,083 870,573 6,299,992
Operating income $ 1,122,183 $ 3,068,048 $ (870,573) $ 3,319,658
2014
Product sales
Anesthesia
services Other Total
Revenue $ 1,991,224 $ - $ - $ 1,991,224
Operating costs 904,903 - 523,997 1,428,900
Operating income $ 1,086,321 $ - $ (523,997) $ 562,324