first quarter 2016 earnings call - avanos … › download › q1+2016...first quarter 2016 earnings...
TRANSCRIPT

FIRST QUARTER 2016 EARNINGS CALLMay 4, 2016

FIRST QUARTER EARNINGS CALL AGENDA
2First Quarter 2016 Earnings Call
First Quarter Update – Robert Abernathy, Chairman
and Chief Executive Officer
First Quarter Results and 2016 Outlook – Steve Voskuil, Chief Financial Officer

CONFERENCE CALL REMINDERS
3First Quarter 2016 Earnings Call
FORWARD-LOOKING INFORMATION
Certain matters in this presentation and conference call, including our 2016 outlook, expectations and planning assumptions, and any estimates, projections, and statements relating to our business plans or objectives, constitute forward-looking statements and are based upon management’s expectations and beliefs concerning future events impacting the Company.
These statements are subject to risks and uncertainties, including currency exchange risks, cost savings and reductions, raw material, energy, and other input costs, competition, market demand, economic condition, and legislative and regulatory actions. There can be no assurance that these future events will occur as anticipated or that the Company’s results will be as estimated. Forward-looking statements speak only as of the date they were made, and we undertake no obligation to publicly update them. For a more complete listing and description of other factors that could cause the Company’s future results to differ materially from those expressed in any forward-looking statements, see the Company’s most recent Form 10-K and Quarterly Reports on Form 10-Q.
NON-GAAP FINANCIAL MEASURES
Management believes that non-GAAP financial measures enhance investors’ understanding and analysis of the company’s performance. As such, results and outlook have been adjusted to exclude certain items for relevant time periods as indicated in the non-GAAP reconciliations to the comparable GAAP financial measures included in this presentation and in today’s earnings release posted on our website (www.halyardhealth.com/investors).
FIRST QUARTER UPDATEROBERT ABERNATHY, CHAIRMAN AND CHIEF EXECUTIVE OFFICER

FIRST QUARTER UPDATE
5
• Beginning transformation into a leading Medical Device company
• Two objectives
- Fuel growth pipeline
- Deliver 2016 plan
• Solid progress on both fronts
First Quarter 2016 Earnings Call
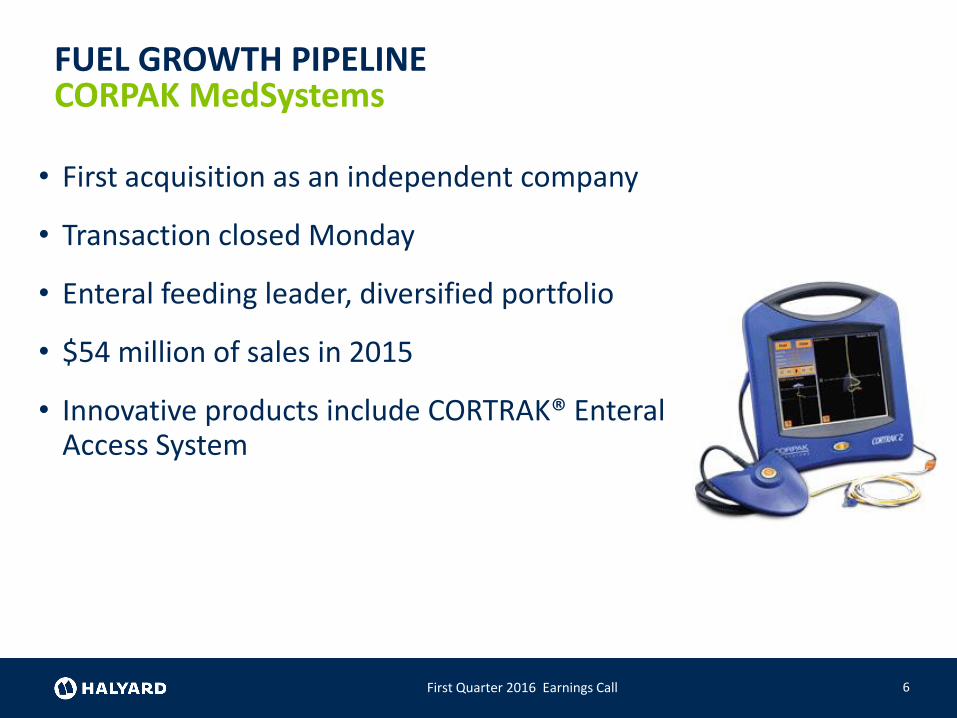
FUEL GROWTH PIPELINE
6
CORPAK MedSystems
First Quarter 2016 Earnings Call
• First acquisition as an independent company
• Transaction closed Monday
• Enteral feeding leader, diversified portfolio
• $54 million of sales in 2015
• Innovative products include CORTRAK® Enteral Access System
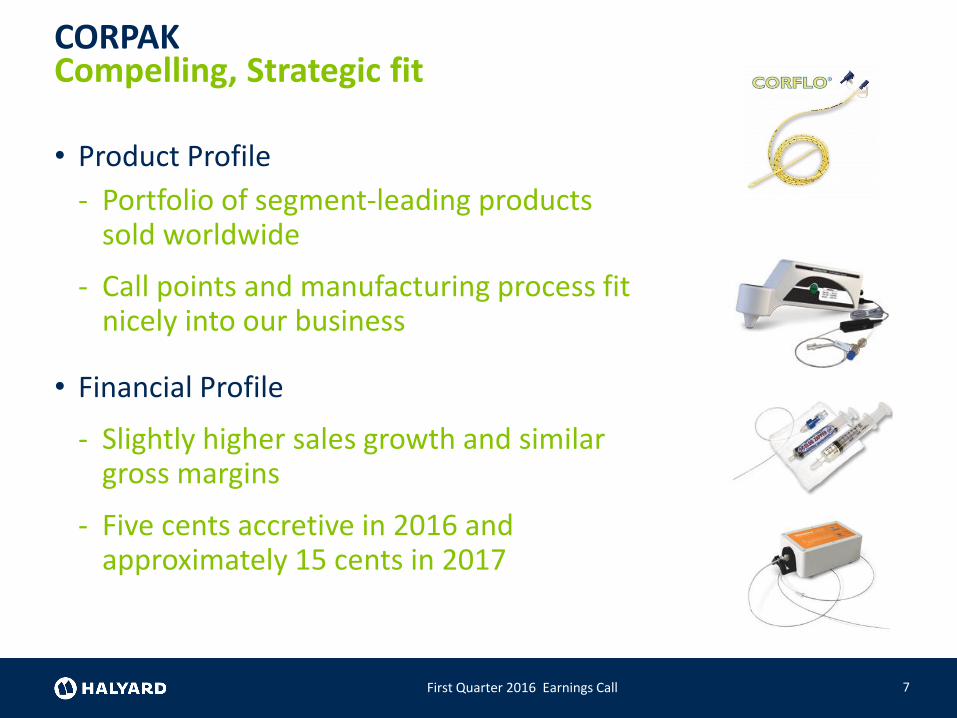
CORPAK
7First Quarter 2016 Earnings Call
• Product Profile
- Portfolio of segment-leading products sold worldwide
- Call points and manufacturing process fit nicely into our business
• Financial Profile
- Slightly higher sales growth and similar gross margins
- Five cents accretive in 2016 and approximately 15 cents in 2017
Compelling, Strategic fit
FUEL GROWTH PIPELINE
8First Quarter 2016 Earnings Call
• Increasing research and development spend
- Introduce new products
- Differentiate our portfolio
- Maintain market-leading positions
• On track to introduce 10 new products across S&IP and Medical Devices
• Increased investment in sales and marketing and clinical studies to build on momentum in Interventional Pain
Strategic Investments
FIRST QUARTER SUMMARY
9First Quarter 2016 Earnings Call
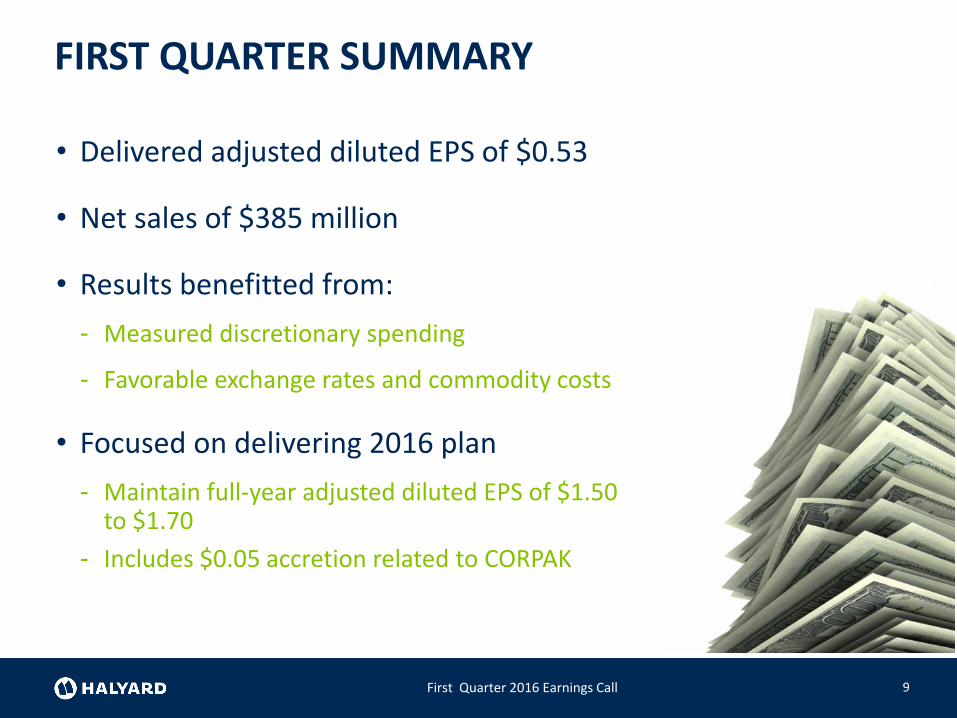
• Delivered adjusted diluted EPS of $0.53
• Net sales of $385 million
• Results benefitted from:
- Measured discretionary spending
- Favorable exchange rates and commodity costs
• Focused on delivering 2016 plan
- Maintain full-year adjusted diluted EPS of $1.50 to $1.70
- Includes $0.05 accretion related to CORPAK

EXECUTING OUR TWO OBJECTIVES
10First Quarter 2016 Earnings Call
Delivering 2016 plan
Fueling our growth pipeline
HALYARD FORCEFULLY REJECTS
11
60 Minutes Allegations
First Quarter 2016 Earnings Call
• Since 2011, we have sold more than 58 million MICROCOOL gowns
• Not one single complaint of injury due to barrier protection
• We stand firmly behind the safety and efficacy of all our products

FIRST QUARTER 2016 RESULTSSTEVE VOSKUIL, CHIEF FINANCIAL OFFICER
FIRST QUARTER CONSOLIDATED PERFORMANCE
13First Quarter 2016 Earnings Call
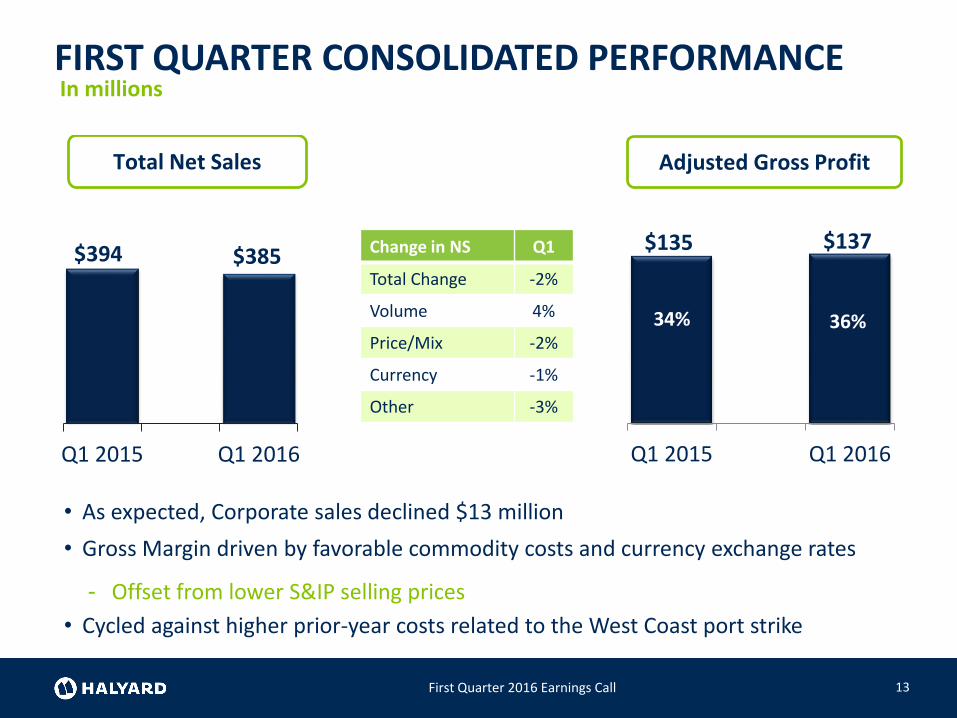
$394 $385
Q1 2015 Q1 2016
Total Net Sales
36%
15%
• As expected, Corporate sales declined $13 million
• Gross Margin driven by favorable commodity costs and currency exchange rates
- Offset from lower S&IP selling prices
• Cycled against higher prior-year costs related to the West Coast port strike
Change in NS Q1
Total Change -2%
Volume 4%
Price/Mix -2%
Currency -1%
Other -3%
In millions
$135 $137
Q1 2015 Q1 2016
Adjusted Gross Profit
34% 36%
FIRST QUARTER CONSOLIDATED PERFORMANCE
14First Quarter 2016 Earnings Call
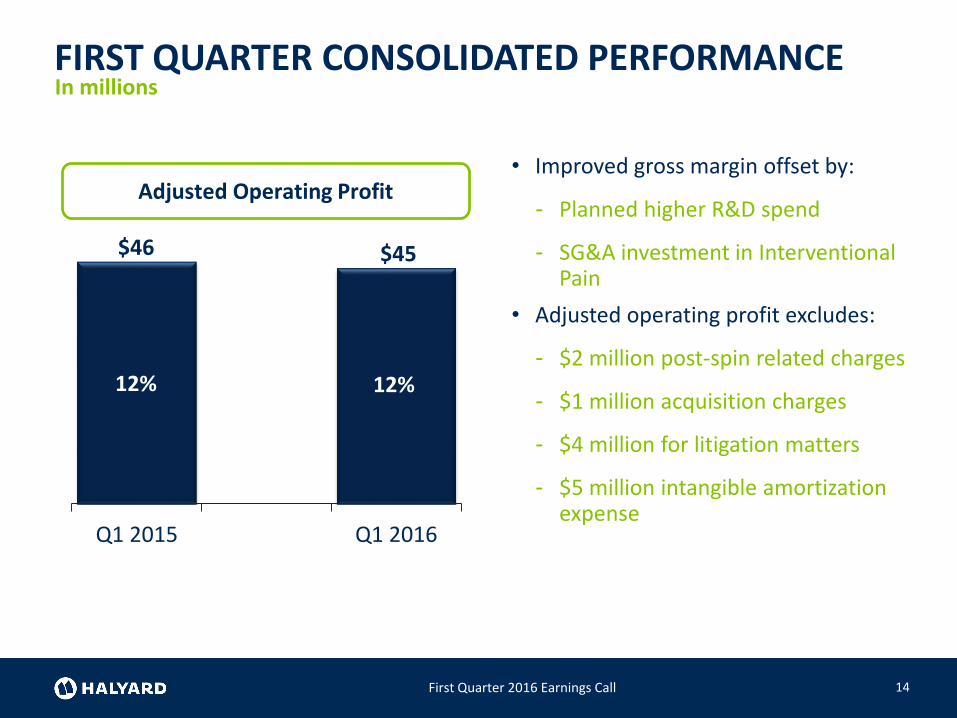
$46 $45
Q1 2015 Q1 2016
Adjusted Operating Profit
12% 12%
36%
15%
• Improved gross margin offset by:
- Planned higher R&D spend
- SG&A investment in Interventional Pain
• Adjusted operating profit excludes:
- $2 million post-spin related charges
- $1 million acquisition charges
- $4 million for litigation matters
- $5 million intangible amortization expense
In millions
15First Quarter 2016 Earnings Call
• Adjusted EBITDA of $55 million
• Reported adjusted diluted EPS of $0.53
• Performance impacted by:
• Timing of certain project expenses and incentives
• Taking longer time to fill open positions
• Favorable currency exchange rates and commodity cost deflation
FIRST QUARTER SUMMARY
FIRST QUARTER S&IP
16First Quarter 2016 Earnings Call
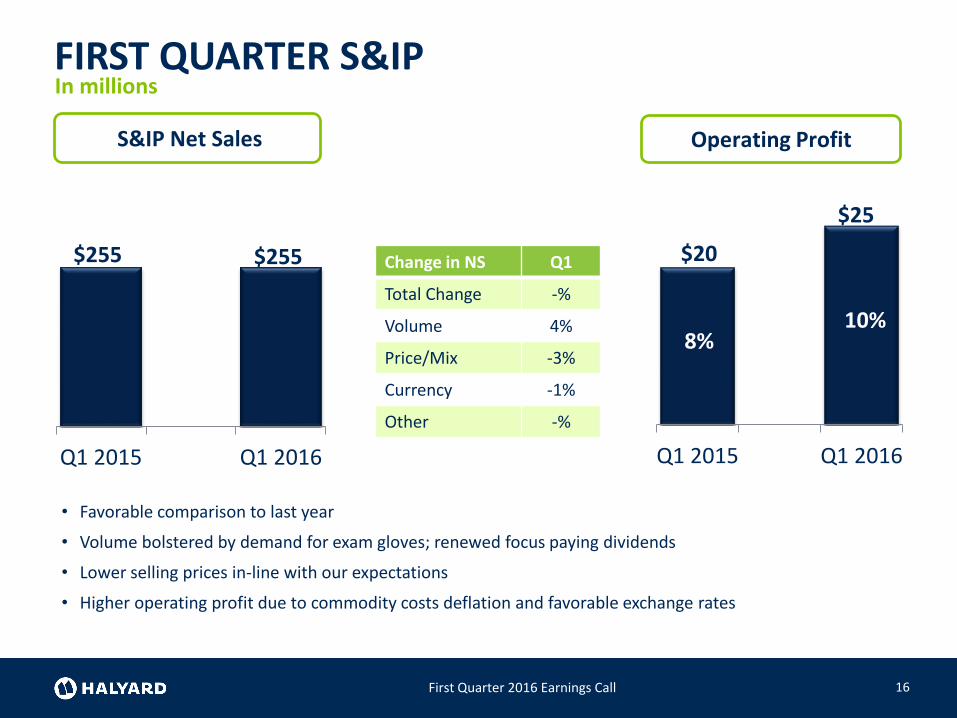
$255 $255
Q1 2015 Q1 2016
S&IP Net Sales
36%
15%
$20
$25
Q1 2015 Q1 2016
Operating Profit
10%
• Favorable comparison to last year
• Volume bolstered by demand for exam gloves; renewed focus paying dividends
• Lower selling prices in-line with our expectations
• Higher operating profit due to commodity costs deflation and favorable exchange rates
8%
Change in NS Q1
Total Change -%
Volume 4%
Price/Mix -3%
Currency -1%
Other -%
In millions
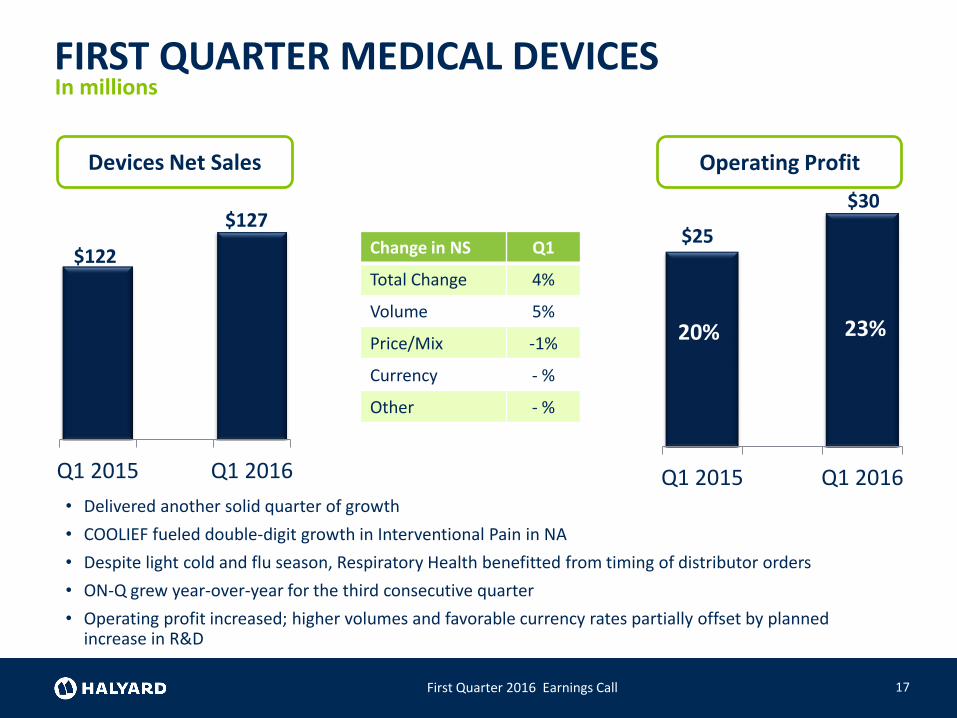
$25
$30
Q1 2015 Q1 2016
Operating Profit
23%20%
FIRST QUARTER MEDICAL DEVICES
17First Quarter 2016 Earnings Call
$122
$127
Q1 2015 Q1 2016
Devices Net Sales
36%
15%
• Delivered another solid quarter of growth
• COOLIEF fueled double-digit growth in Interventional Pain in NA
• Despite light cold and flu season, Respiratory Health benefitted from timing of distributor orders
• ON-Q grew year-over-year for the third consecutive quarter
• Operating profit increased; higher volumes and favorable currency rates partially offset by planned increase in R&D
Change in NS Q1
Total Change 4%
Volume 5%
Price/Mix -1%
Currency - %
Other - %
In millions
BALANCE SHEET AND CASH FLOW
18First Quarter 2016 Earnings Call
• Ended the quarter with $165 million of cash
• Lower one-time separation costs and capital expenditures
• Highest generation of free cash flow of $35 million
• Will deploy free cash flow to fuel growth
2016 OUTLOOK
19First Quarter 2016 Earnings Call
• Maintaining adjusted diluted EPS of $1.50 to $1.70
• Includes $0.05 accretion from CORPAK
• 2016 key planning assumptions remain unchanged

Q&A

APPENDICES
NON-GAAP RECONCILIATIONS
22First Quarter 2016 Earnings Call
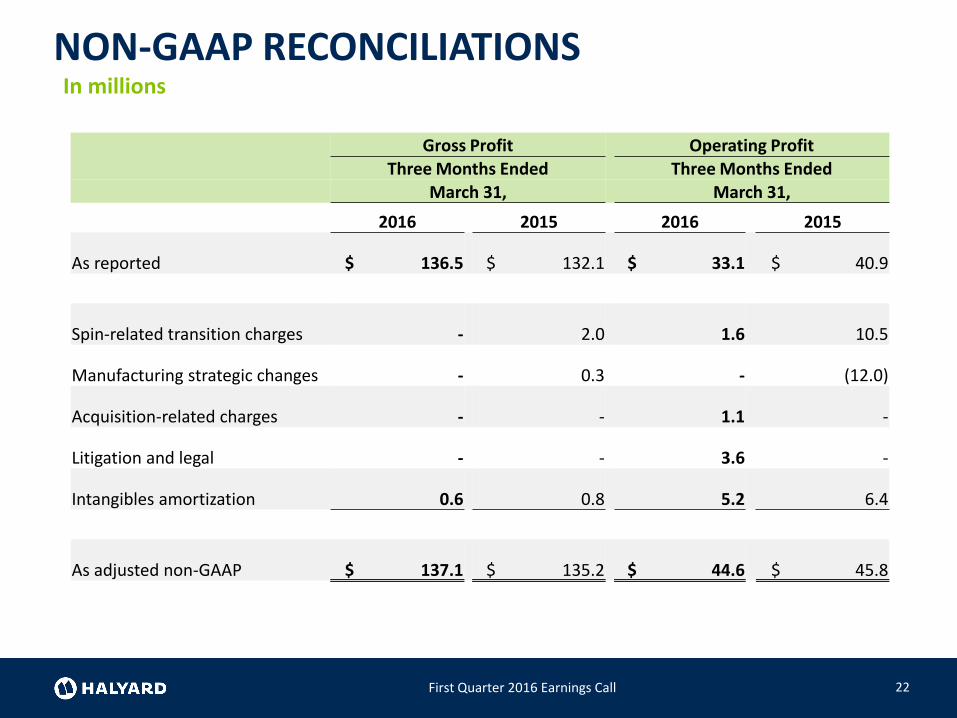
In millions
Gross Profit Operating ProfitThree Months Ended Three Months Ended
March 31, March 31,
2016 2015 2016 2015
As reported $ 136.5 $ 132.1 $ 33.1 $ 40.9
Spin-related transition charges - 2.0 1.6 10.5
Manufacturing strategic changes - 0.3 - (12.0)
Acquisition-related charges - - 1.1 -
Litigation and legal - - 3.6 -
Intangibles amortization 0.6 0.8 5.2 6.4
As adjusted non-GAAP $ 137.1 $ 135.2 $ 44.6 $ 45.8
NON-GAAP RECONCILIATIONS
23First Quarter 2016 Earnings Call
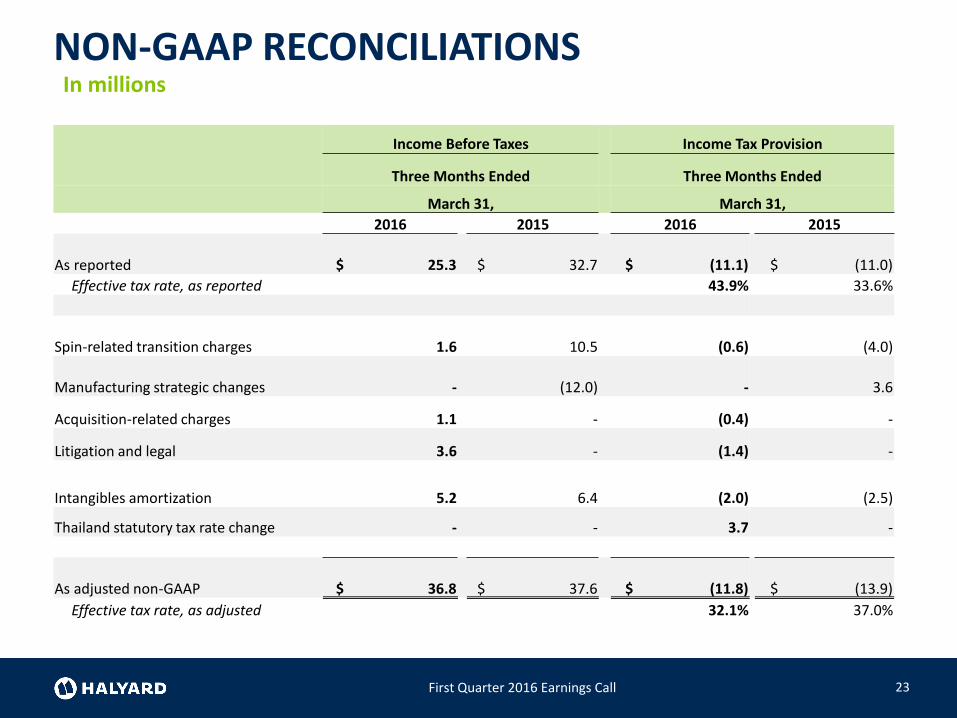
Income Before Taxes Income Tax Provision
Three Months Ended Three Months Ended
March 31, March 31,
2016 2015 2016 2015
As reported $ 25.3 $ 32.7 $ (11.1) $ (11.0)
Effective tax rate, as reported 43.9% 33.6%
Spin-related transition charges 1.6 10.5 (0.6) (4.0)
Manufacturing strategic changes - (12.0) - 3.6
Acquisition-related charges 1.1 - (0.4) -
Litigation and legal 3.6 - (1.4) -
Intangibles amortization 5.2 6.4 (2.0) (2.5)
Thailand statutory tax rate change - - 3.7 -
As adjusted non-GAAP $ 36.8 $ 37.6 $ (11.8) $ (13.9)
Effective tax rate, as adjusted 32.1% 37.0%
In millions
NON-GAAP RECONCILIATIONS
24First Quarter 2016 Earnings Call
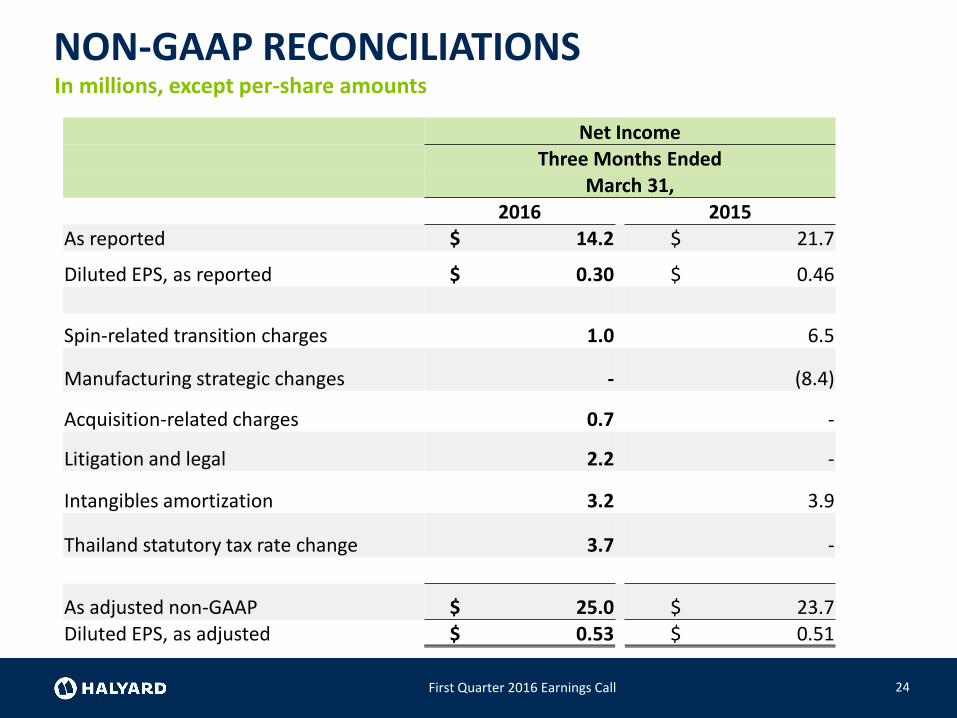
In millions, except per-share amounts
Net IncomeThree Months Ended
March 31,2016 2015
As reported $ 14.2 $ 21.7
Diluted EPS, as reported $ 0.30 $ 0.46
Spin-related transition charges 1.0 6.5
Manufacturing strategic changes - (8.4)
Acquisition-related charges 0.7 -
Litigation and legal 2.2 -
Intangibles amortization 3.2 3.9
Thailand statutory tax rate change 3.7 -
As adjusted non-GAAP $ 25.0 $ 23.7
Diluted EPS, as adjusted $ 0.53 $ 0.51
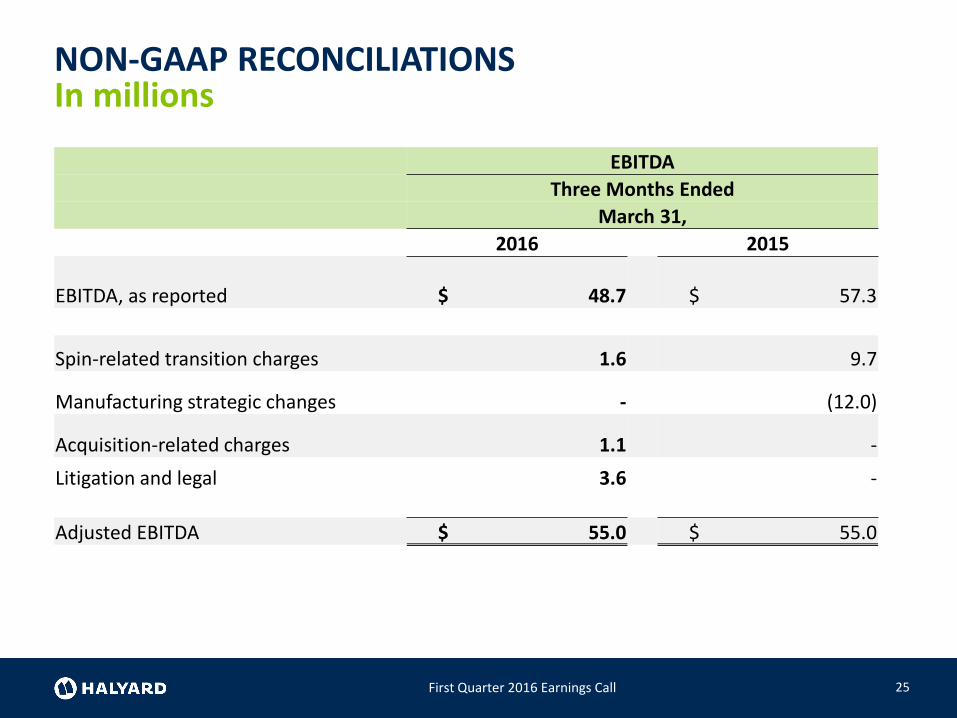
NON-GAAP RECONCILIATIONS
25
In millions
EBITDA
Three Months Ended
March 31,
2016 2015
EBITDA, as reported $ 48.7 $ 57.3
Spin-related transition charges 1.6 9.7
Manufacturing strategic changes - (12.0)
Acquisition-related charges 1.1 -
Litigation and legal 3.6 -
Adjusted EBITDA $ 55.0 $ 55.0
First Quarter 2016 Earnings Call
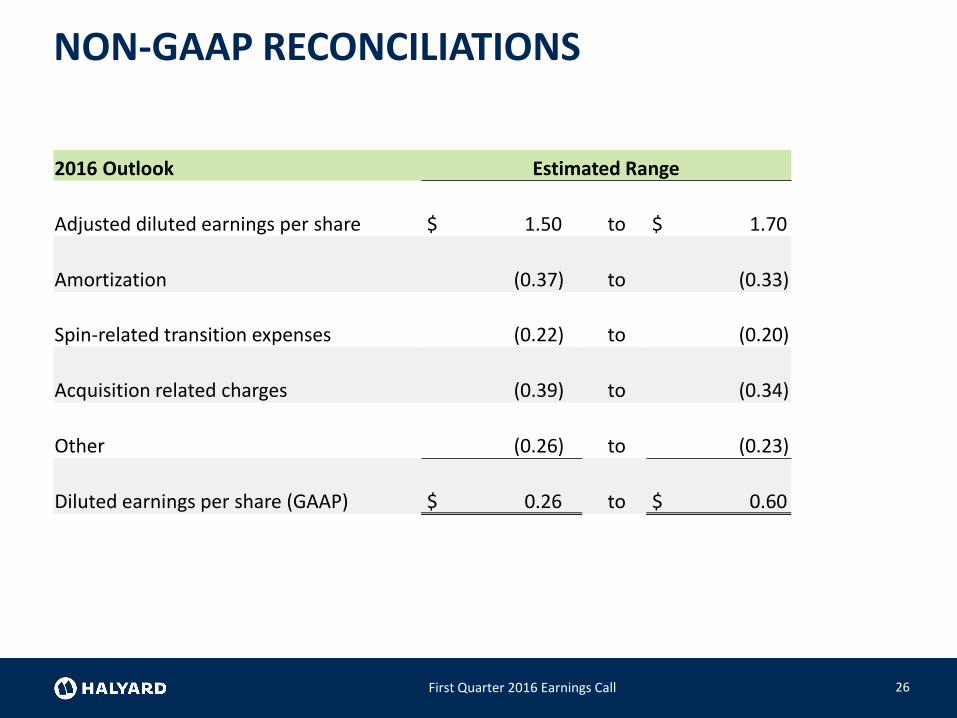
NON-GAAP RECONCILIATIONS
26First Quarter 2016 Earnings Call
2016 Outlook Estimated Range
Adjusted diluted earnings per share $ 1.50 to $ 1.70
Amortization (0.37) to (0.33)
Spin-related transition expenses (0.22) to (0.20)
Acquisition related charges (0.39) to (0.34)
Other (0.26) to (0.23)
Diluted earnings per share (GAAP) $ 0.26 to $ 0.60