first quarter 2013 conference call - goodyear corporate · first quarter 2013 conference call april...
TRANSCRIPT

First Quarter 2013 Conference Call April 26, 2013

Forward-Looking Statements
Certain information contained in this presentation constitutes forward-looking statements for purposes of the
safe harbor provisions of The Private Securities Litigation Reform Act of 1995. There are a variety of factors,
many of which are beyond our control, that affect our operations, performance, business strategy and
results and could cause our actual results and experience to differ materially from the assumptions,
expectations and objectives expressed in any forward-looking statements. These factors include, but are not
limited to: our ability to implement successfully our strategic initiatives; pension plan funding obligations;
actions and initiatives taken by both current and potential competitors; increases in the prices paid for raw
materials and energy; a labor strike, work stoppage or other similar event; deteriorating economic conditions
or an inability to access capital markets; work stoppages, financial difficulties or supply disruptions at our
suppliers or customers; the adequacy of our capital expenditures; our failure to comply with a material
covenant in our debt obligations; potential adverse consequences of litigation involving the company; as well
as the effects of more general factors such as changes in general market, economic or political conditions or
in legislation, regulation or public policy. Additional factors are discussed in our filings with the Securities and
Exchange Commission, including our annual report on Form 10-K, quarterly reports on Form 10-Q and
current reports on Form 8-K. In addition, any forward-looking statements represent our estimates only as of
today and should not be relied upon as representing our estimates as of any subsequent date. While we
may elect to update forward-looking statements at some point in the future, we specifically disclaim any
obligation to do so, even if our estimates change.
2

Q1 Highlights
3
• Segment Operating Income of $302 million
– Record North America Q1 results
– Three SBUs report year-over-year SOI growth
• North America segment operating income up 59% from prior
year, a first quarter record
• Asia Pacific and Latin America report unit volume growth and
report strong double digit operating margins
• Successfully executed prefunding of frozen U.S. pension plans
Solid Q1 Results…Full Year SOI and Cash Flow Outlook Unchanged

4
Strategy Roadmap
Where We Are
Key How To’s
Our Destination (2013+)
Key Strategies
Industry
MegaTrends
2012 – 2014
1. North America: Profitability
2. Asia: Winning in China
3. EMEA/LAT: Continued Success
NAT Adding Economic Value
Weak Volume
Pension remains a challenge
Executing Plan
Innovation Leader
Strong Earnings
Creating Sustainable Value
First with Customers
Innovation Leader
Leader in Targeted Segments
Competitively Advantaged
Profitable thru Economic Cycle
Cash Flow Positive
Investment Grade
1. Market-Back Innovation Excellence
2. Target Profitable Market Segments
3. Operational Excellence
4. Enabling Investments
5. Top Talent / Top Teams

5
Record Results in a Challenging Environment
Commitment to our strategy has resulted in record profitability in a
challenging industry environment
Creating Sustainable Economic Value
By being…
• First with our customers
• Leader in our targeted segments
• The innovation leader
• Competitively advantaged
And as a result, we will be…
• Profitable through economic cycles
• Cash flow positive
• Investment grade
$ In millions
Segment Operating Income(a)
$917
$1,368 $1,248
2010 2011 2012 2013E
$1,400 - $1,500
a) See Segment Operating Income reconciliation in Appendix on page 35.

EMEA Situation Assessment
6
• Industry volumes remain very weak
• De-stocking in channels continuing
– Manufacturer sales < sell-out to consumers
• Goodyear working to improve service levels and supply chain flexibility
• Actions needed to match weak economic environment
– Full closure of Amiens (French) factory announced
– Increase targeted market segment share
– Grow in emerging markets
– Additional productivity actions of $75-100 million over 3 years
• Current focus on summer season sales
– Leverage advantage in label & magazine test scores
Weak environment persists, executing further actions to return
margins to historical levels

Summary
7
Addressing weak environment
Pent-up demand creates future upside
Addressing operating issues in EMEA
Continue delivering in North America, Latin America & Asia
Solid Q1 Results…Full Year SOI and Cash Flow Outlook Unchanged

Financial Update

First Quarter 2013
Income Statement
a) See Segment Operating Income and Margin reconciliation in Appendix on page 35.
In millions
9
2013 2012 Change
Units 39.5 43.0 (8.1)%
Net Sales $4,853 $5,533 (12.3)%
Gross Margin 18.8% 16.7%
SAG $645 $662 (2.6)%
Segment Operating Income(a) $302 $292 3.4%
Segment Operating Margin(a) 6.2% 5.3% 0.9 pts
Goodyear Net Income (Loss) $33 ($4)
Less: Preferred Stock Dividends $7 $7
Goodyear Net Income (Loss) Available to Common
Shareholders$26 ($11)
Goodyear Net Income (Loss) Available to Common
Shareholders - Per Share of Common Stock
Basic $0.10 ($0.05)
Diluted $0.10 ($0.05)
1st Quarter

10
$292
$230
$99 ($78)
($71)
($64)
($60)
($17) ($29) $302
Q1
2012
Raw
Materials(1)
Cost
Savings
(net of NAT
profit
sharing) Inflation(2)
Volume
Unabsorbed
Fixed
Cost Price / Mix
Other(3)
Q1
2013
Currency
+$10
First Quarter 2013
Segment Operating Results
1. Raw material variance of $230 million excludes raw material cost saving measures of $57 million, which is included in Cost Savings above 2. Estimated impact of inflation (wages, utilities, energy, transportation and other) 3. Primarily other tire-related businesses of ($25) million
$ In millions

a) Working capital represents accounts receivable and inventories, less accounts payable – trade. b) See Total Debt and Net Debt reconciliation in Appendix on page 36.
First Quarter 2013
Balance Sheet
$ In millions
11
Q1 increase in net debt is largely offset by a
decrease in our unfunded pension obligation
March 31, December 31, March 31,
2013 2012 2012
Cash and cash equivalents 2,386$ 2,281$ 2,083$
Accounts receivable 3,021 2,563 3,530
Inventories 3,168 3,250 3,969
Accounts payable - trade (3,218) (3,223) (3,571)
Working capital(a)
2,971$ 2,590$ 3,928$
Total debt(b)
6,581$ 5,086$ 5,631$
Net debt(b)
4,195$ 2,805$ 3,548$
Memo:
Net Global Pension Liability 2,487$ 3,522$

Cash Flow
Creating Sustainable Value
First with Customers
Innovation Leader
Leader in Targeted Segments * See page 37 for a reconciliation of “Free Cash Flow from Operations,” a non-GAAP measure, to the most directly comparable GAAP measure.
$ In millions
12
Trailing Twelve
Months Ended
March 31, 2013 March 31, 2012 March 31, 2013
Net Income 31$ 8$ 260$
Depreciation and Amortization 177 170 694
Working Capital (335) (767) 889
Pension Expense 76 78 305
Other 46 (98) 284
Capital Expenditures (271) (276) (1,122)
Free Cash Flow from Operations (non-GAAP)* (276)$ (885)$ 1,310$
Memo:
Pension Contributions & Direct Payments (908)$ (114)$ (1,478)$
Debt Change, net 1,486$ 350$ 871$
Rationalization Payments (24)$ (31)$ (99)$
Asset Dispositions (Gain)/Loss 2$ (4)$ (19)$
Three
Months Ended

First Quarter 2013
Segment Results
In millions
13
2013 2012 Change 2013 2012 Change
Units 14.8 15.8 (6.4%) Units 15.1 18.0 (16.1%)
Net Sales $2,166 $2,497 (13.3%) Net Sales $1,607 $1,938 (17.1%)
Operating Income $127 $80 58.8% Operating Income $31 $90 (65.6%)
Margin 5.9% 3.2% Margin 1.9% 4.6%
2013 2012 Change 2013 2012 Change
Units 4.5 4.3 5.1% Units 5.1 4.9 4.6%
Net Sales $513 $521 (1.5%) Net Sales $567 $577 (1.7%)
Operating Income $60 $55 9.1% Operating Income $84 $67 25.4%
Margin 11.7% 10.6% Margin 14.8% 11.6%
North American Tire Europe, Middle East, and Africa Tire
Latin American Tire Asia Pacific Tire
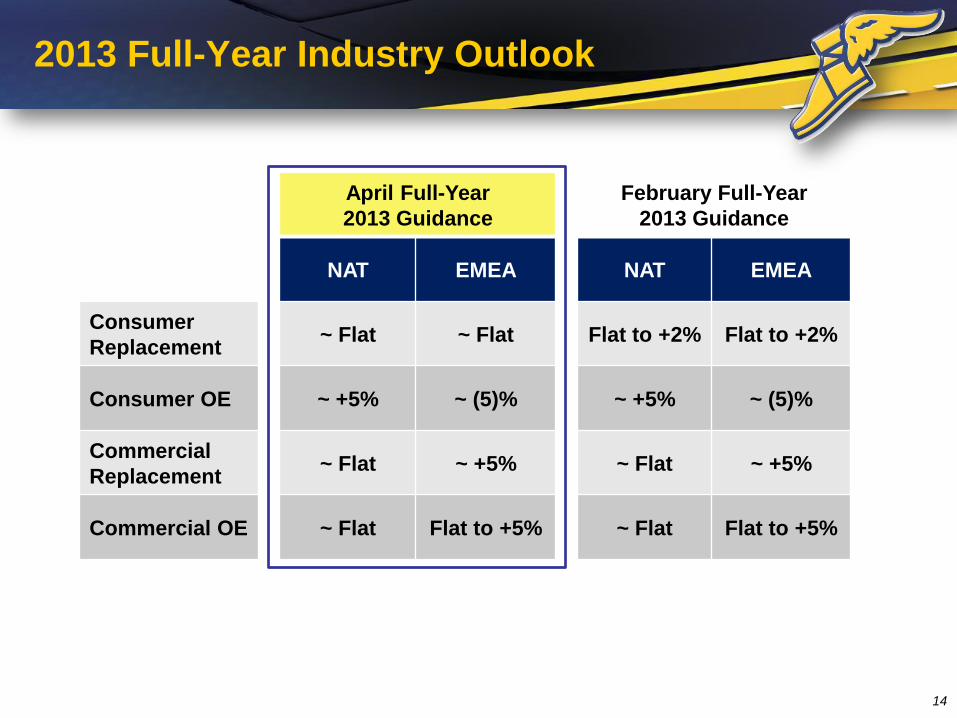
2013 Full-Year Industry Outlook
April Full-Year
2013 Guidance
February Full-Year
2013 Guidance
NAT EMEA NAT EMEA
Consumer
Replacement ~ Flat ~ Flat Flat to +2% Flat to +2%
Consumer OE ~ +5% ~ (5)% ~ +5% ~ (5)%
Commercial
Replacement ~ Flat ~ +5% ~ Flat ~ +5%
Commercial OE ~ Flat Flat to +5% ~ Flat Flat to +5%
14

2013 Key Segment Operating Income Drivers
Fourth Quarter 2011 Segment Operating Income [slightly below/similar t]o]
2010 Level Note: All referenced USD figures relate to year-over-year impact on Segment Operating Income.
Driver Q2 Full Year Comments
Global
Volume ~ Flat ~ Flat
• Slow recovery in developed
consumer replacement
business
Price/Mix vs.
Raw Materials
+$50 – $75
million Positive • Lower raw material costs
Unabsorbed
Overhead ~ ($50) million
~ ($25) – ($50)
million
• ~4 million unit production cut
in Q1
Cost Savings
vs. Inflation
Slightly
Positive Positive
• Cost actions to address soft
demand environment
Foreign
Exchange ~ ($10) million
~ ($40) – ($60)
million
• Venezuela devaluation and
other impacts of stronger
dollar
Other
Tire-Related ~$10 million $0 - $25 million
• Recover Q1 negative Chemical
variance
China Startup ~$5 million $20 - $30 million • Improved ramp-up of
Pulandian facility
15

2013 Outlook Financial Assumptions
Assumption Comments
Interest Expense $405 - $430 million
Income Tax 25% - 30% of International
Segment Operating Income
Global Pension
$275 - $325 million expense
~$1.10 - $1.15 billion in total
contributions
Working Capital Use of ~$0 - $100 million
Capital Expenditures $1.0 - $1.2 billion
Depreciation &
Amortization ~$700 million
16

Appendix

2013 2012 % Change
Consumer
Units 36.0 39.1 (7.9%)
Sales $2,680 $2,999 (10.6%)
Commercial
Units 3.0 3.3 (10.4%)
Sales $978 $1,090 (10.3%)
Unit/Sales Mix
First Quarter 2013
Tire Unit & Sales Summary
2013 Q1 Sales = $4,853
In millions
18
Consumer 55%
Commercial 20%
Other 12%
Retail 7%
Chemical 6%

Full Year 2012
Tire Unit & Sales Summary
2012 Sales = $20,992
In millions
19
2012 2011 % Change
Consumer
Units 149.2 163.6 (8.8%)
Sales $11,429 $12,065 (5.3%)
Commercial
Units 12.8 14.8 (13.6%)
Sales $4,202 $4,588 (8.4%)
Unit/Sales Mix
Consumer 54% Commercial
20%
Other 13%
Retail 7%
Chemical 6%

$942
$207
$689
$2,356
$1,017
($71)
$712
($115)
$549
$1,822
$327
($287)
2008 2009 2010 2011 2012 2013 Through 3/31/13
Price/Mix Raw Materials
Price/Mix Improvements
(a) Reflects impact on Segment Operating Income. Raw Materials include the impact of raw material cost savings measures. (b) Raw material variance of $327 million includes raw material cost savings measures of $249 million. (c) Raw material variance of ($287) million includes raw material cost savings measures of $57 million
Price/Mix vs. Raw Materials(a)
$ in millions
(c)
20
(b)

First Quarter 2013
Liquidity Profile
(a) Total liquidity comprised of $2,386 million cash and cash equivalents, $2,289 million of unused availability under various credit agreements, and the additional $244 million committed under the Pan-European securitization program.
(b) Committed Pan-European securitization program of $577 million (€450 million) subject to available receivables. At March 31, 2013, the amounts available and utilized under this program totaled $333 million (€260 million) and $186 million (€145 million), respectively.
(c) Includes $25 million of financing related to relocation and expansion of manufacturing facility in China. (d) Includes $289 million of cash in Venezuela denominated bolivares fuertes at the official exchange rate of 6.3 bolivares fuertes per U.S. dollar at March 31,
2013. 21
$4.9(a)
Cash &
Equivalents(d)
$1 billion
required for
operations
Available
Credit Lines (c)
Liquidity Profile
Pan European
Securitization(b)
$ In billions
$2.4
$2.3
$0.2
March 31, 2013

Note: Based on March 31, 2013 balance sheet values and excludes notes payable, capital leases and other domestic and foreign debt. Details on all other actual
outstanding debt as of March 31, 2013 in Appendix on page 38.
(a) At March 31, 2013, the amounts available and utilized under the committed Pan-European securitization program of $577 million (€450 million) totaled $333 million
(€260 million) and $186 million (€145 million), respectively.
(b) At March 31, 2013, $256 million was outstanding under the European revolving credit facility. Letters of credit issued as of this date totaled $10 million (€7 million).
(c) At March 31, 2013, our borrowing base, and therefore our availability, under the U.S. revolving credit facility was $480 mill ion below the facility’s stated amount of
$2.0 billion. Also, $394 million of letters of credit were issued under this facility.
First Quarter 2013
Maturity Schedule
$ In millions
22
$186 $256
$1,515
$1,261
$900 $849
2013 2014 2015 2016 2017 2018 2019 2020 2021 ≥ 2022
Undrawn Credit Lines
Funded Debt
$577 (a)
$513 (b)
$2,000 (c)

Discount Rate:
Liability: ~ $200 million per 25 bps
Expense: $7 million per 25 bps
Return:
No effect on liability
14.2% actual 2012 return results in approximately
$30 million decrease to 2013 U.S. pension expense
U.S. Sensitivity(1)
Pension Update
23
1. Reflects discretionary contributions and February 28, 2013 remeasurement of frozen U.S. pension plans. U.S. sensitivity excludes short-term hedging as described in our 10Q.
2. Includes cash funding for direct benefit payments for 2008 - 2012 only.
3. Excludes one-time charges.
$ In millions
U.S. D.R. 6.50% 5.75% 5.20% 4.52% 3.71% 3.78% 3.78%
$364 $430 $405
$294
$684
$350-$400
$-
$200
$400
$600
$800
$1,000
$1,200
2008 2009 2010 2011 2012 2013E 2014E
Total Global Cash Flow Impact (1) (2)
Domestic International
$1,100-$1,150
$2,748 $2,715 $2,549
$3,097 $3,522
$2,275 $1,875
$-
$500
$1,000
$1,500
$2,000
$2,500
$3,000
$3,500
$4,000
2008 2009 2010 2011 2012 2013E 2014E
Global Unfunded Obligations(1)
Domestic International
$181
$387
$300 $266
$307
$225-$275
$-
$100
$200
$300
$400
2008 2009 2010 2011 2012 2013E 2014E
Global Pension Expense (1) (3)
Domestic International
$275-$325

U.S. Pension Liability Sensitivity Analysis (2013)
(1) Assumes parallel shifts in interest rates 24
$ In millions
We have entered into derivative agreements that cap upside and limit downside on a portion of
plan assets (equity position) during 2013 (i.e., zero-cost collars). These agreements initially cover
75% of equity position declining to 50% during the year.
Interest Rate Movement (1)
Interest Rate Interest Rate
Increase Decrease
Favorable / (Unfavorable) + 100 bps + 50 bps (50) bps (100) bps
Liability 794 397 (397) (794)
Funded Frozen Plans (266) (133) 133 266
Hedged Hourly Plans (124) (25) 142 284
Net Liability Impact 404 239 (122) (244)

First Quarter Significant Items (after taxes and minority interest)
25
2013
• Net foreign currency remeasurement loss resulting from the devaluation of the Venezuelan bolivar fuerte, $92 million (37 cents per share)
• Rationalizations, asset write-offs and accelerated depreciation charges, $9 million (4 cents per share)
• Net loss on asset sales, $2 million (1 cent per share)
• Net gain resulting from tax law changes, $12 million (5 cents per share)
• Net insurance recoveries resulting from the impact of the 2011 Thailand flood, $6 million (2 cents per share)
2012
• Charges resulting from the early redemption of senior notes, $86 million (35 cents per share)
• Rationalizations, asset write-offs and accelerated depreciation charges, $14 million (6 cents per share)
• Discrete tax charges, $3 million (1 cent per share)
• Net insurance recoveries resulting from the impact of the 2011 Thailand flood, $5 million (2 cents per share)
• Net gains on asset sales, $3 million (1 cent per share)

First Quarter Significant Items (after taxes and minority interest)
$ In millions, except EPS
26
Reported
Net Sales 4,853$
Cost of Goods Sold 3,940 (5) - 9 -
Gross Margin 913 - 5 - (9) -
SAG 645 - - - - -
Interest Expense 85 - - - - -
Rationalizations 7 - (7) - - -
Other Expense 126 (115) - (2) - -
Pre-tax Income 50 115 12 2 (9) -
Taxes 19 23 1 - (2) 12
Minority Interest (2) - 2 - (1) -
Reported Net Income 33$ 92 9 2 (6) (12)
Preferred Dividends (7) - - - - -
Net Income Available to
Common Shareholders 26$ 92 9 2 (6) (12)
EPS 0.10$ 0.37$ 0.04$ 0.01$ (0.02)$ (0.05)$
First Quarter 2013
Significant Items
Restructuring &
Accelerated
Depreciation
Loss on Asset
Sales
Tax
Items (Gain)
Venezuela
Devaluation
Insurance
Recoveries from
Thailand Flood

Company Overview
.
Goodyear tires are sold
in two distinct tire markets...
(% of 2012 Units of 164 million)
...and stretch around the
world
(% of 2012 Revenue of $21 billion)
…available in a diverse
selection of products...
(% of 2012 Revenue of $21 billion)
North
America
46%
Europe, Middle
East & Africa
33%
Latin
America
10%
Asia Pacific
11%
Replacement Market 70%
OE Market
30%
OE ~20% of 2012 Revenue
27
Consumer
54%
20%
Retail
7%
Other
13%
Chemical
6%
Commercial
Goodyear Is a Global Tire Industry Leader with Powerful Brands and
Broad Product Reach
Includes:
OTR, Farm,
Race, &
Aviation

“Green” (fuel efficiency) will
be a growing and permanent
global theme
28
Industry MegaTrends
Significant GDP growth in emerging markets will provide impressive tire market growth
Internet and information
technology will alter end-
user buying behaviors
Developed markets’ size, mix
and drive for innovation
provide profitable market
segments
High Value Added technology
will continue to migrate into
mid-tier cars/tires
Tire performance labeling will
become an industry standard
Unlikely to experience game-
changers…. evolutionary, not
revolutionary
Industry
MegaTrends
7

2007 2008 2009 2010 2011 2012 2013 2014 2015
992 977 944
1,0661,103 1,082
1,1091,165
1,213
MegaTrend #1:
Significant GDP growth in emerging markets will provide impressive tire market growth
Consumer Industry
Emerging
Mature CAGR 0%/yr (‘11 vs ‘07)
+5%
-6%
-2%
Total
29 Source: Goodyear estimates based upon internal and external sources
(In millions)
1,104

MegaTrend #2:
Developed markets’ size, mix and drive for innovation provide profitable market segments
30
North American Consumer Replacement Industry Segmentation
Commuter
Touring
Perfor-
mance
All-
Terrain &
Winter
Premium
Mid-Tier
Economy
5-year growth rate
projection:
~2x mid-tier & economy
Source: Goodyear internal analysis
Premium growth expected to significantly exceed other market segments

31
MegaTrend #3:
High Value Added technology will continue to migrate into mid-tier cars/tires
Industry continues to evolve towards HVA tires
Sample of Latin America OE Fitments requiring
low rolling resistance (complex mixing) = HVA Tires
ONIX
VehicleProduction Start
and Rim SizeVehicle
Production Start
and Rim SizeVehicle
Production Start
and Rim Size
Oct 2012
14” - 15”
GOL NF
Jan 2012
13” - 14”
CLIO LAC
July 2012
13”
HB
Oct 2012
14” - 15”
NEW LOGAN
Jan 2013
15”
NEW FIESTA
Jan 2013
15”
UP
Jan 2014
13” - 14”
NEW KA
Jan 2014
14”
B73
May 2013
16”
Jan 2014
15”
NEW SANDERO
NEW PUNTO
Jan 2014
14” - 15”
NEW C4
Jun 2014
14” - 15”

MegaTrend #4:
“Green” (fuel efficiency) will be a growing and permanent global theme
32
• Oil prices
• Sustainability
- Recycle/Reuse
- Climate Change
Global trends • CAFE Standards
• Advanced powertrains
• Total Cost of Ownership
• Increased electronic
content (weight
constrained )
Vehicle OEMs
• Fuel Economy
Mandates
• Safety Standards
Governments Fuel Efficiency Enablers
• Advanced tread compound
– High silica content
– Functional polymers
0.0
2.0
4.0
6.0
8.0
10.0
12.0
14.0
16.0
2009 2010 2011 2012 2013E
Goodyear Consumer Fuel
Efficient Tires Sales
(FuelMax and EfficientGrip) (Units in millions)

33
40% 60%
EU Summer Replacement Market(a)
Summer HP Market Rest of Summer Replacement Market
(a) Passenger market based on Europool 2012 Total Europe (excl. Turkey and Ukraine). All grades based upon publically available information on tires
available for sale as at April 1st . HP segment covers H and V speed indexes.
(b) B grade in Rolling Resistance Index / A grade in Wet Grip Index.
(c) Competitors include premium brands and best available reported grades by size.
0% 20% 40% 60% 80%
Competitor 4
Competitor 3
Competitor 2
Competitor 1
Dunlop
Goodyear
% of Summer High Performance Market Potential Rated B/A(b) or Better
Analysis of latest announcements by competition confirm the label
competitiveness of our new HP line
(c)
MegaTrend #5:
Tire performance labeling will become an industry standard

34
Annual capex spend at approximately $1.1 billion
• Sustain the business Approximately
$600 to $700 million per year:
– Plant maintenance/upkeep
– Product line extensions molds
– New products molds
– Information technology
• Profitable Growth $400 to $500
million per year (high return projects)
– Equipment modernization (impact earnings
incrementally over project life)
– Plant expansions (begin to impact earnings
in 2-3 years)
– Greenfield plants (begin to impact earnings
in 3-4 years)
• Maintain greatest level of flexibility
throughout the economic cycle
Enabling Investments
2008 2009 2010 2011 2012 2013E
Sustain the Business ~ $600 to $700 million
CapEx
$0.9
$1.0
$0.7
$1.1
($ in billions)
$1.0 $1.0 - $1.2

Reconciliation for Segment Operating Income / Margin
$ In millions
35
2013 2012 2012 2011 2010
Total Segment Operating Income 302$ 292$ 1,248$ 1,368$ 917$
Rationalizations (7) (15) (175) (103) (240)
Interest expense (85) (101) (357) (330) (316)
Other expense (126) (92) (139) (73) (186)
Asset write-offs & accelerated depreciation (5) (2) (20) (50) (15)
Corporate incentive compensation plans (10) (7) (69) (70) (71)
Corporate pension curtailments/settlements - - (1) (15) -
Intercompany profit elimination (3) (10) 1 (5) (14)
Retained expenses of divested operations (4) (4) (14) (29) (20)
Other (12) (5) (34) (75) (47)
Income (Loss) before Income Taxes 50$ 56$ 440$ 618$ 8$
United States and Foreign Taxes 19 48 203 201 172
Less: Minority Shareholders Net Income (Loss) (2) 12 25 74 52
Goodyear Net Income (Loss) 33$ (4)$ 212$ 343$ (216)$
Sales $4,853 $5,533 $20,992 $22,767 $18,832
Return on Sales 0.7% (0.1)% 1.0% 1.5% (1.1)%
Total Segment Operating Margin 6.2% 5.3% 5.9% 6.0% 4.9%
Three Months Ended
March 31,
Twelve Months Ended
December 31,
This presentation also presents total segment operating income on a forward-looking basis. The company is unable to reconcile
forward-looking total segment operating income without unreasonable efforts because management cannot predict, with sufficient
certainty, the various elements necessary to provide such a reconciliation.

Reconciliation for Total Debt and Net Debt
$ In millions
36
March 31, December 31, March 31,
2013 2012 2012
Long term debt and capital leases 6,307$ 4,888$ 5,186$
Notes payable and overdrafts 107 102 291
Long term debt and capital leases due within one year 167 96 154
Total debt 6,581$ 5,086$ 5,631$
Less: Cash and cash equivalents 2,386 2,281 2,083
Net debt 4,195$ 2,805$ 3,548$

Reconciliation for Free Cash Flow from Operations
(1) Working capital represents total changes in accounts receivable, inventories and accounts payable – trade.
(2) Other includes amortization and write-off of debt issuance costs, net rationalization charges, net (gains) losses on asset sales, Venezuela currency
devaluation, customer prepayments and government grants, insurance proceeds, compensation and benefits less the total defined benefit pension
cost (before curtailments, settlements, and termination benefits) reported in the pension-related note in the Notes to Consolidated Financial
Statements, other current liabilities, and other assets and liabilities. 37
Trailing Twelve
Months Ended
($ in millions)
March 31,
2013
Dec. 31,
2012
Sept. 30,
2012
June 30,
2012
March 31,
2012
March 31,
2013
Net Income 31$ (7)$ 133$ 103$ 8$ 260$
Depreciation and Amortization 177 174 176 167 170 694
Working Capital (1)
(335) 1,361 (136) (1) (767) 889
Pension Expense 76 78 77 74 78 305
Other (2)
46 (5) 153 90 (98) 284
Capital Expenditures (271) (339) (298) (214) (276) (1,122)
Free Cash Flow from Operations (non-GAAP) (276)$ 1,262$ 105$ 219$ (885)$ 1,310$
Capital Expenditures 271 339 298 214 276 1,122
Pension Contributions & Direct Payments (908) (194) (263) (113) (114) (1,478)
Rationalization Payments (24) (40) (18) (17) (31) (99)
Cash Flow from Operating Activities (GAAP) (937)$ 1,367$ 122$ 303$ (754)$ 855$
The amounts below are calculated from the Consolidated Statements of Cash Flows except for pension expense, which is the total defined benefit
pension cost (before curtailments, settlements, and termination benefits) as reported in the pension-related note in the Notes to Consolidated
Financial Statements.
Three Months Ended
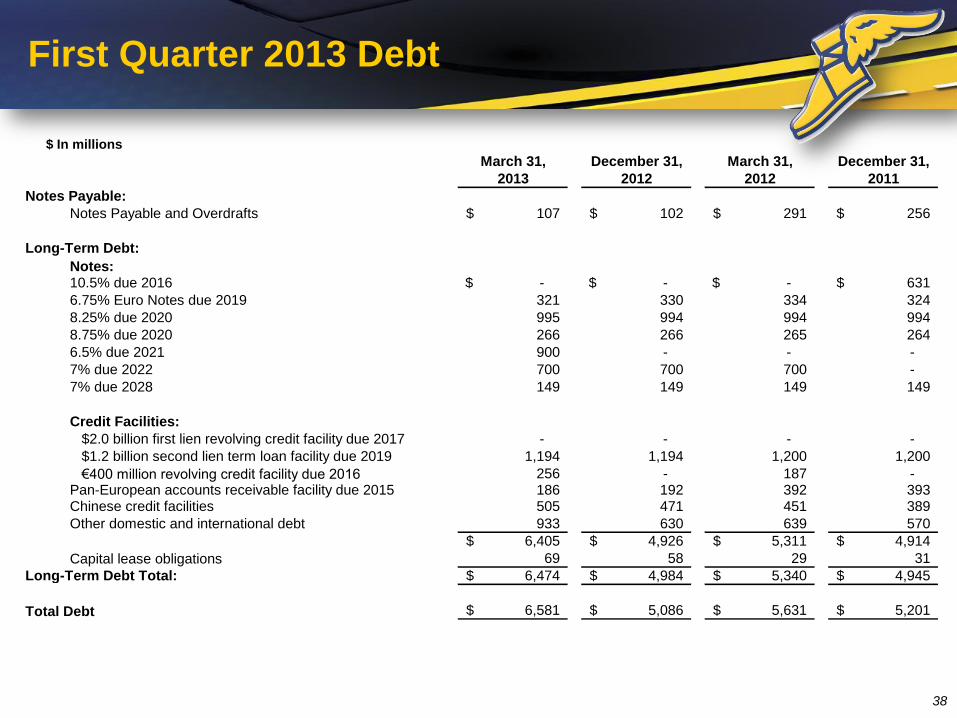
First Quarter 2013 Debt
$ In millions
38
March 31, December 31, March 31, December 31,
2013 2012 2012 2011
Notes Payable:
Notes Payable and Overdrafts 107$ 102$ 291$ 256$
Long-Term Debt:
Notes:10.5% due 2016 -$ -$ -$ 631$
6.75% Euro Notes due 2019 321 330 334 324
8.25% due 2020 995 994 994 994
8.75% due 2020 266 266 265 264
6.5% due 2021 900 - - -
7% due 2022 700 700 700 -
7% due 2028 149 149 149 149
Credit Facilities:
$2.0 billion first lien revolving credit facility due 2017 - - - -
$1.2 billion second lien term loan facility due 2019 1,194 1,194 1,200 1,200
€400 million revolving credit facility due 2016 256 - 187 - Pan-European accounts receivable facility due 2015 186 192 392 393 Chinese credit facilities 505 471 451 389
Other domestic and international debt 933 630 639 570
6,405$ 4,926$ 5,311$ 4,914$
Capital lease obligations 69 58 29 31
Long-Term Debt Total: 6,474$ 4,984$ 5,340$ 4,945$
Total Debt 6,581$ 5,086$ 5,631$ 5,201$
