first-principles study on the catalytic role of cerium
TRANSCRIPT
Louisiana State UniversityLSU Digital Commons
LSU Doctoral Dissertations Graduate School
10-23-2018
First-Principles Study on the Catalytic Role ofCerium Dioxide in the Conversion of OrganicCompoundsChuanlin ZhaoLouisiana State University and Agricultural and Mechanical College, [email protected]
Follow this and additional works at: https://digitalcommons.lsu.edu/gradschool_dissertations
Part of the Catalysis and Reaction Engineering Commons
This Dissertation is brought to you for free and open access by the Graduate School at LSU Digital Commons. It has been accepted for inclusion inLSU Doctoral Dissertations by an authorized graduate school editor of LSU Digital Commons. For more information, please [email protected].
Recommended CitationZhao, Chuanlin, "First-Principles Study on the Catalytic Role of Cerium Dioxide in the Conversion of Organic Compounds" (2018).LSU Doctoral Dissertations. 4753.https://digitalcommons.lsu.edu/gradschool_dissertations/4753
FIRST-PRINCIPLES STUDY ON THE CATALYTIC ROLE OF
CERIUM DIOXIDE IN THE CONVERSION OF ORGANIC
COMPOUNDS
A Dissertation
Submitted to the Graduate Faculty of the
Louisiana State University and
Agricultural and Mechanical College
in partial fulfillment of the
requirements for the degree of
Doctor of Philosophy
in
Cain Department of Chemical Engineering
by
Chuanlin Zhao
B.E., Tianjin University, 2012
M.S., Louisiana State University, 2013
December 2018

ii
© [2018/copyright]
[Computational Catalysis & Surface Chemistry Group, LSU]

iii
To Yuhuan & Min
Lijun & Huidou
Zhuojun & Xiyuan

iv
Where is everybody?
--Enrico Fermi
v
ACKNOWLEDGEMENTS
This dissertation could not be accomplished without the generous sponsorship from National
Science Foundation and Louisiana Board of Regents. From the scientific perspective, I would
like to thank the following dedicated experimental collaborators involved in the research project:
Dr. Steven Overbury, Dr. David Mullins, Dr. Florencia Calaza, and Dr. Aditya Savara from Oak
Ridge National Lab, Dr. Vladimír Matolín from Charles University, Czech Republic, Dr. Kenya
Shimada from Hiroshima University, Japan, Dr. Chao Wang from John Hopkins University.
Most importantly, it is my dear professor, Dr. Ye Xu, who provides me with the cheerful
opportunity to work with the above mentioned world-class scientists and engineers. Without his
tireless guidance and stringent scientific requirements, such fruitful research achievements
throughout my Ph.D. years would never become a reality. I would also like to thank my Ph.D.
committee members for small but meaningful discussions: Drs. William Shelton, Kerry Dooley,
Kenneth Lopata, and Patrick DiMario. Computation hardware are provided by Louisiana State
University High Performance Computing, Louisiana Optical Network Infrastructure, and
National Energy Research Scientific Computing Center. From the humanistic perspective, I was,
am, and will always be grateful about the love and support from my parents and grandparents.
At last, I will always remember and appreciate the hospitality of the people I met in the United
States.
vi
TABLE OF CONTENTS
ACKNOWLEDGEMENTS ……………………………………….....................................v
NOMENCLATURE, SYMBOLS, ACRONYMS ………………………………………..vii
ABSTRACT ……………………………………………………………………………...viii
INTRODUCTION ……………………………………………………………………........1
TECHNICAL APPROACH …………………………………………………………........20
RESULTS AND DISCUSSION …….…………………………….....................................27
SUMMARY ………………………………………………...…………………………......81
REFERENCES ………………………………………………………………………….....84
APPENDIX. COPYRIGHT INFORMATION…...…...…………………………………..101
VITA ………………………………………………………………………………….......107
vii
NOMENCLATURE, SYMBOLS, ACRONYMS
AA: acetic acid, CH3COOH
AcH: acetaldehyde, CH3CHO
Ace: acetone, CH3COCH3
Actl: acetonyl, CH2COCH3
Ata: acetate, CH3COO
CrA: crotonaldehyde, CH3CHCHCHO
DFT: density functional theory
DOS: density of states
D: C-O dimer from two acetaldehyde
Ea: activation energy barrier
Egas: DFT total energy of the atom or molecule in the gas phase in a neutral state
Eslab: DFT total energy of the clean surface
Etotal: DFT total energy of the slab with the adsorbed atom or molecule
Enl: enolate of acetaldehyde, CH2CHO
FS: final state of the minimum energy path
IS: initial state of the minimum energy path
hTST: harmonic transition state theory approximation
Ket: ketene of acetic acid, CH2CO-O
MkM: microkinetic modeling
MP: methyl phosphate monoester
pDOS: projected density of states
p-NPP: para-nitrophenyl phosphate monoester
RPES: resonant photoelectron spectroscopy
TB: breaking temperature set in 1st temperature ramping
Tp: peak temperature of desorption
TPD: temperature programmed desorption
TS: transition state of the minimum energy path
Vo: single oxygen vacancy
VVo: oxygen vacancy dimer
XPS: X-ray photo-emission spectroscopy
ZPE: zero-point energy
∆Eads: adsorption energy
∆Erxn: reaction energy
β-KA: β-keto acid, CH3COCH2COOH
θ: surface coverage
*: surface free adsorption site

viii
ABSTRACT
Ceria is an earth-abundant material that has been widely used in heterogeneous catalysis,
environmental catalysis, and energy applications thanks for its ability to readily convert between
different oxidation states. The objective of this study is to theoretically elucidate the reaction
mechanisms for the conversion of model organic compounds on ceria, in order to gain insights
for the design of cost-effective and selective ceria-based catalysts. Acetaldehyde, acetic acid,
and para-nitrophenyl phosphate monoester were selected as the model compounds to probe ceria
surfaces. Density functional theory calculations can provide accurate predictions of adsorption
and reaction energetics, which can be used to calculate the necessary kinetic parameters in the
microkinetic model that can validate hypothesized reaction mechanisms. This methodology is
also able to generate additional insights regarding the dominant surface species, the existence of
transient surface species, and the role of active sites such as defects. Based on the spectroscopic
evidence from surface science experiments, we were able to validate the proposed reaction
mechanism for temperature programmed desorption of acetaldehyde and acetic acid on ceria
surfaces. Particularly, the catalytic role of surface oxygen vacancy during the formation of
ethylene, acetylene and crotonaldehyde in the AcH-TPD was examined. The desorption of
crotonaldehyde is found to be the rate-limiting step. However, pre-existing oxygen vacancy is
not required in the AA-TPD due to facile surface reduction induced by deprotonation of acetic
acid. We found the ketene pathway was energetically more favorable than the acetone pathway
under UHV condition. Our results showed that ceria can be effective in the dephosphorylation of
selected monoesters including p-NPP, due to facile P-O ester bond scission. However, the
subsequent step-wise hydration is found to be rate-limiting.
1
INTRODUCTION
1.1 Catalysis Related Properties of Ceria
Ceria is a well-known material in heterogeneous catalysis, environmental catalysis, and energy
applications [1, 2]. Ceria is shown to enhance the redox activity of metal catalysts in a number
of technological reactions, including the automotive three-way catalysis [3, 4], water-gas shift
(WGS) [5], hydrocarbon reforming [6], CO2 reduction [7], and combustion of soot and volatile
organic compounds [8]. Ceria has also been used as key components of solid electrolytes and
even electrodes in solid oxide fuel cells [9], and energy carriers in solar thermochemical reactors
[10]. Many of its useful properties can be traced to the ability of the Ce cation to readily convert
between the +3 and +4 oxidation states chemically and structurally. Meanwhile, cerium is the
most abundant of the lanthanides in Earth’s crust, with its abundance being comparable to
common metals such as chromium, nickel, and copper, and higher than tin and lead. The unique
chemical properties of ceria coupled with availability makes it a highly attractive material for
current and future catalytic and energy applications.
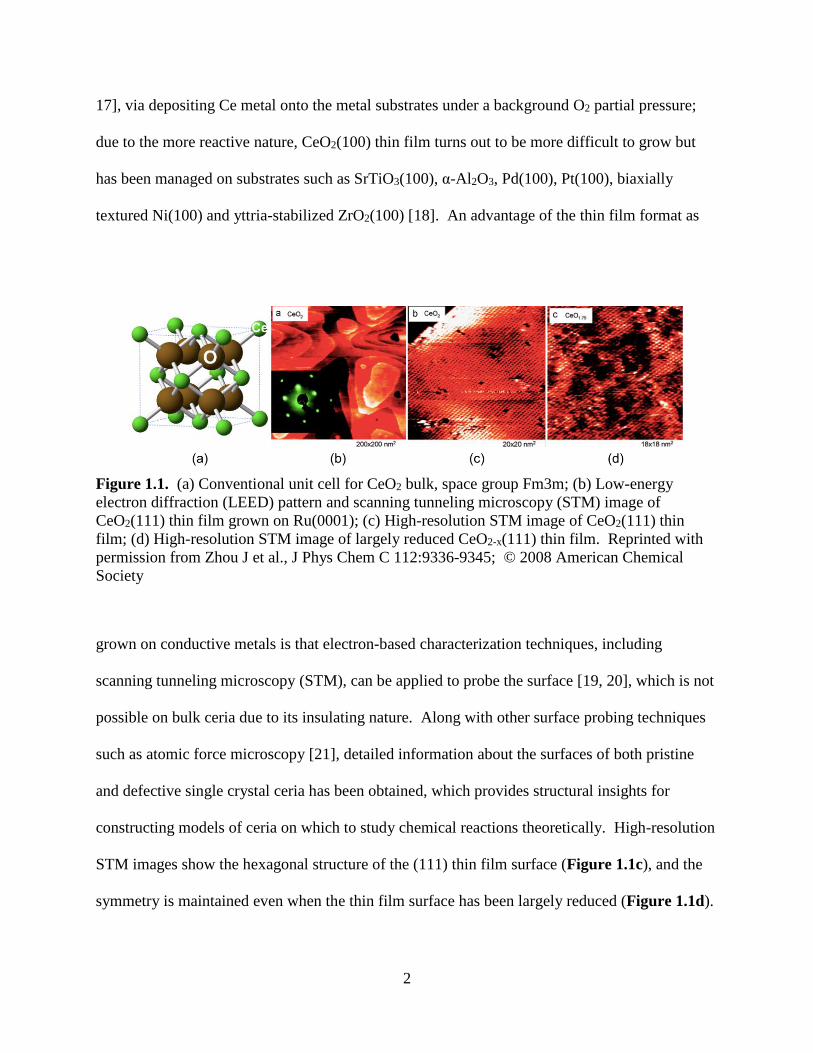
Different from other rare-earth elements, cerium dioxide (CeO2) is a more stable phase
than the sesquioxide phase (Ce2O3) under ambient conditions. Identified as the fluorite structure
(space group Fm3m), CeO2 has its 4 Ce atoms locate in the face-center and corner sites of the
unit cell, while 8 O atoms locate inside the unit cell with each O atom adopting a tetrahedron
coordination configuration, as shown in Figure 1.1a. Among the low-index facets of CeO2,
CeO2(111) turns out to be thermodynamically the most stable one, followed by (110) and (100)
surfaces [11]. CeO2(111) thin film can be grown on several metal substrates, such as Ru(0001)
[12], Cu(111) [13], Pt(111) [14], Rh(111) [15] and other fcc single crystal metal surfaces [12, 16,
2
17], via depositing Ce metal onto the metal substrates under a background O2 partial pressure;
due to the more reactive nature, CeO2(100) thin film turns out to be more difficult to grow but
has been managed on substrates such as SrTiO3(100), α-Al2O3, Pd(100), Pt(100), biaxially
textured Ni(100) and yttria-stabilized ZrO2(100) [18]. An advantage of the thin film format as
Figure 1.1. (a) Conventional unit cell for CeO2 bulk, space group Fm3m; (b) Low-energy
electron diffraction (LEED) pattern and scanning tunneling microscopy (STM) image of
CeO2(111) thin film grown on Ru(0001); (c) High-resolution STM image of CeO2(111) thin
film; (d) High-resolution STM image of largely reduced CeO2-x(111) thin film. Reprinted with
permission from Zhou J et al., J Phys Chem C 112:9336-9345; © 2008 American Chemical
Society
grown on conductive metals is that electron-based characterization techniques, including
scanning tunneling microscopy (STM), can be applied to probe the surface [19, 20], which is not
possible on bulk ceria due to its insulating nature. Along with other surface probing techniques
such as atomic force microscopy [21], detailed information about the surfaces of both pristine
and defective single crystal ceria has been obtained, which provides structural insights for
constructing models of ceria on which to study chemical reactions theoretically. High-resolution
STM images show the hexagonal structure of the (111) thin film surface (Figure 1.1c), and the
symmetry is maintained even when the thin film surface has been largely reduced (Figure 1.1d).
3
Regarding its unique catalytic performance, the redox and acid-base properties of ceria
deserve the compliments, and both properties are common features of reducible oxides [22-26].
By definition, the redox reaction consists of a reduction reaction and a complementary oxidation
reaction, both of which involve an equal number of electron transfer. In terms of electron
transfer, the reduction step leaves two extra electrons to ceria and each electron is backed to one
Ce4+. The localization of the extra electron on the Ce 4f orbital results in Ce3+, which induces
the volume expansion effects [27]. The acid-base property (sometimes mentioned as amphoteric
property), comes from the catalyst that contains both accessible Lewis acid and base sites. For
instance, on ceria surfaces, exposed Ce and O are the so-called acid and base sites, respectively.
With respect to chemical reactions involving organic oxygenates e.g. CxHyOz, the advantage of
such catalyst is that the acid site can anchor and activate the functional group such as carbonyl,
while the base site can activate C-H bond if ⍺-H is available. Particularly, the ratio of available
acid and base sites and their spatial distribution on the catalyst surface can fundamentally affect
the activity of catalyst as well as the selectivity of corresponding surface reaction [26].
Therefore, redox and acid-base properties are closely correlated via the common oxygen
component involved in the surface chemical reactions. For instance, CO oxidation (or surface
reduction) not only decreases the number of surface base site, but also increases the number of
accessible surface acid site via Vo formation.
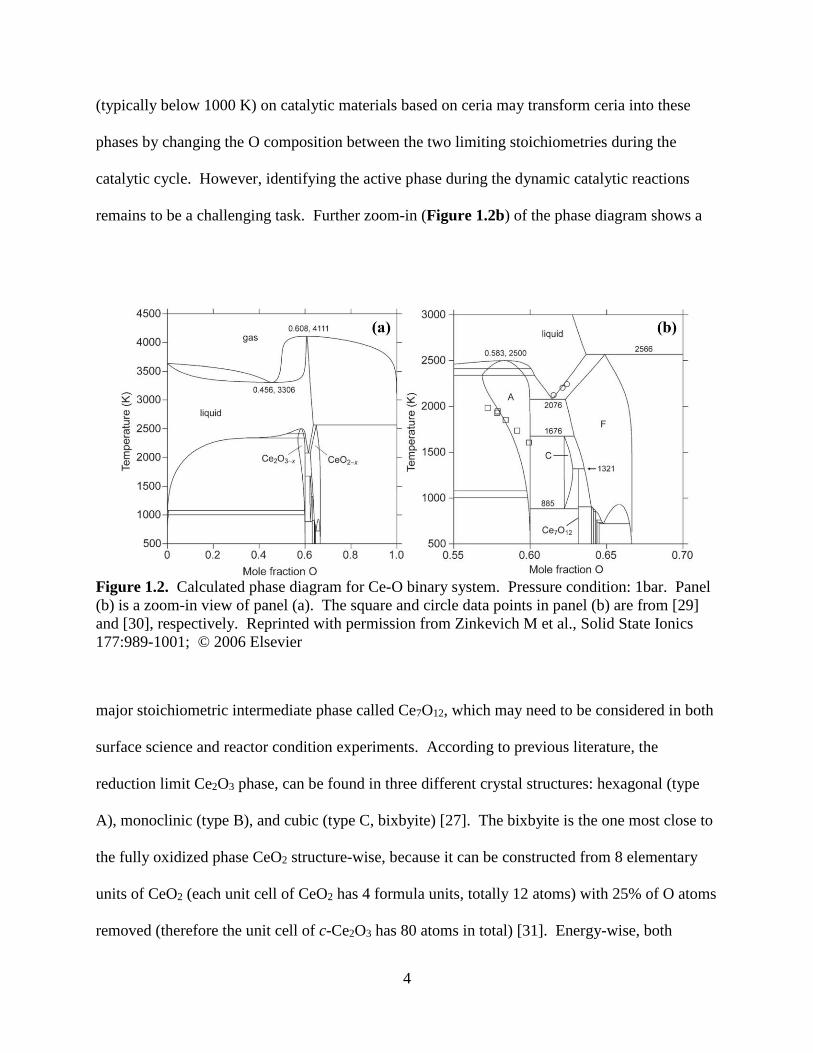
From the thermodynamic perspective, the Ce-O binary system can be quite complicated
in terms of possible phases it may evolve into as a function of temperature and composition [28],
as shown in Figure 1.2. According to the phase diagram (Figure 1.2a), most solid phases are
concentrated on the compositions with O mole fraction ranging from 3/5 to 2/3, which
corresponds to a chemical formula of Ce2O3 and CeO2, respectively. Indeed, redox reactions
4
(typically below 1000 K) on catalytic materials based on ceria may transform ceria into these
phases by changing the O composition between the two limiting stoichiometries during the
catalytic cycle. However, identifying the active phase during the dynamic catalytic reactions
remains to be a challenging task. Further zoom-in (Figure 1.2b) of the phase diagram shows a
Figure 1.2. Calculated phase diagram for Ce-O binary system. Pressure condition: 1bar. Panel
(b) is a zoom-in view of panel (a). The square and circle data points in panel (b) are from [29]
and [30], respectively. Reprinted with permission from Zinkevich M et al., Solid State Ionics
177:989-1001; © 2006 Elsevier
major stoichiometric intermediate phase called Ce7O12, which may need to be considered in both
surface science and reactor condition experiments. According to previous literature, the
reduction limit Ce2O3 phase, can be found in three different crystal structures: hexagonal (type
A), monoclinic (type B), and cubic (type C, bixbyite) [27]. The bixbyite is the one most close to
the fully oxidized phase CeO2 structure-wise, because it can be constructed from 8 elementary
units of CeO2 (each unit cell of CeO2 has 4 formula units, totally 12 atoms) with 25% of O atoms
removed (therefore the unit cell of c-Ce2O3 has 80 atoms in total) [31]. Energy-wise, both
5
hexagonal and cubic structures are more stable than monoclinic, but only the cubic structure is
able to explain the volume expansion effects caused by the reduction of CeO2 [27].
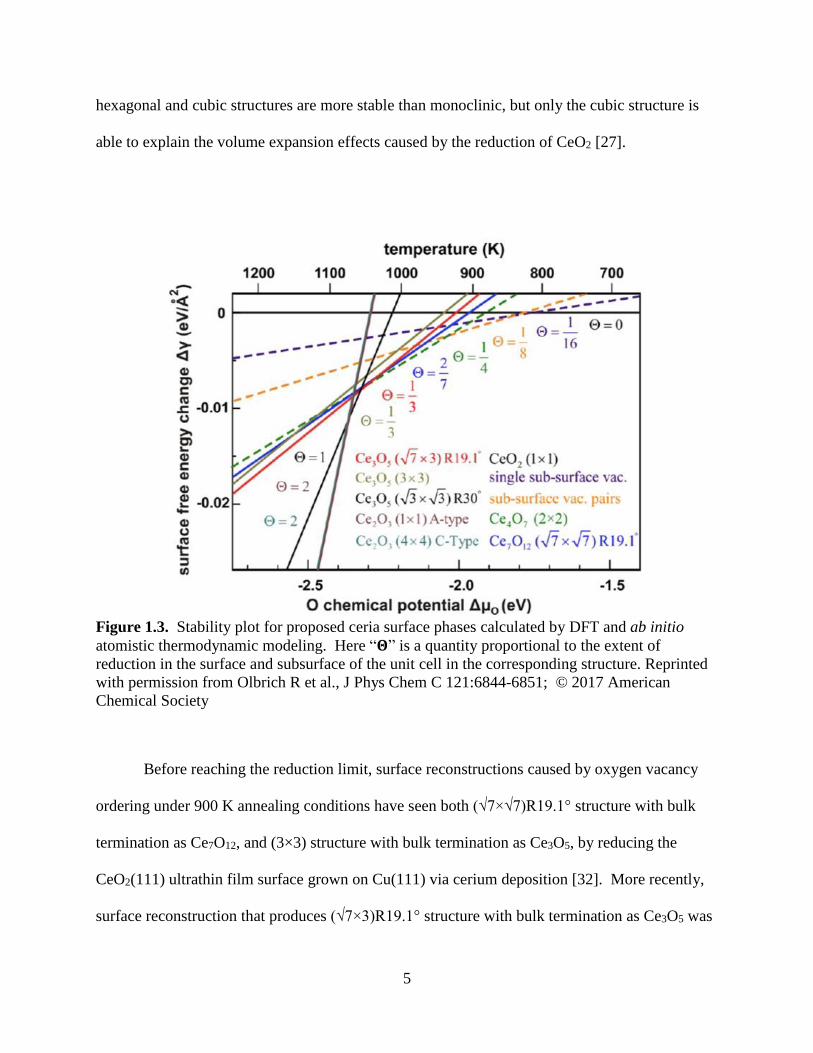
Figure 1.3. Stability plot for proposed ceria surface phases calculated by DFT and ab initio
atomistic thermodynamic modeling. Here “𝚯” is a quantity proportional to the extent of
reduction in the surface and subsurface of the unit cell in the corresponding structure. Reprinted
with permission from Olbrich R et al., J Phys Chem C 121:6844-6851; © 2017 American
Chemical Society
Before reaching the reduction limit, surface reconstructions caused by oxygen vacancy
ordering under 900 K annealing conditions have seen both (√7×√7)R19.1° structure with bulk
termination as Ce7O12, and (3×3) structure with bulk termination as Ce3O5, by reducing the
CeO2(111) ultrathin film surface grown on Cu(111) via cerium deposition [32]. More recently,
surface reconstruction that produces (√7×3)R19.1° structure with bulk termination as Ce3O5 was
6
unveiled under higher annealing temperature by reducing the CeO2(111) thick film surface
grown on Si(111) via thermal reduction method [33]. According to the calculated relative
surface energy derived from ab initio atomistic thermodynamic modeling parameterized by
DFT-calculated energetics, as shown in Figure 1.3, this (√7×3)R19.1° Ce3O5 structure is more
stable than the (√7×√7)R19.1° Ce7O12 structure above 1040 K.
The relevance of the above findings to ceria catalysis is: during the surface catalytic
reactions where dynamic O exchange between adsorbates and surface operating in a rapid rate,
surface reduction/re-oxidation may cause the catalyst surface to span a relatively wide phase
space under high temperature conditions. In order to better understand the structure-reactivity
relationship, fundamental understanding of each primary phase and its corresponding vacancy
ordering structure [34] is quite necessary. Since the surface science experiments devised by our
experimental collaborators usually operates under 800 K, we would focus on point and pair
defects that are much more stable than these reconstructed phases in terms of surface free energy,
according to Figure 1.3.
1.2 Current Applications of Ceria in Heterogeneous Catalysis
Due to its electronic and structural promotion effects on catalysts, over the last two decades,
ceria has been studied extensively by the catalysis communities. The conventional wisdom [35-
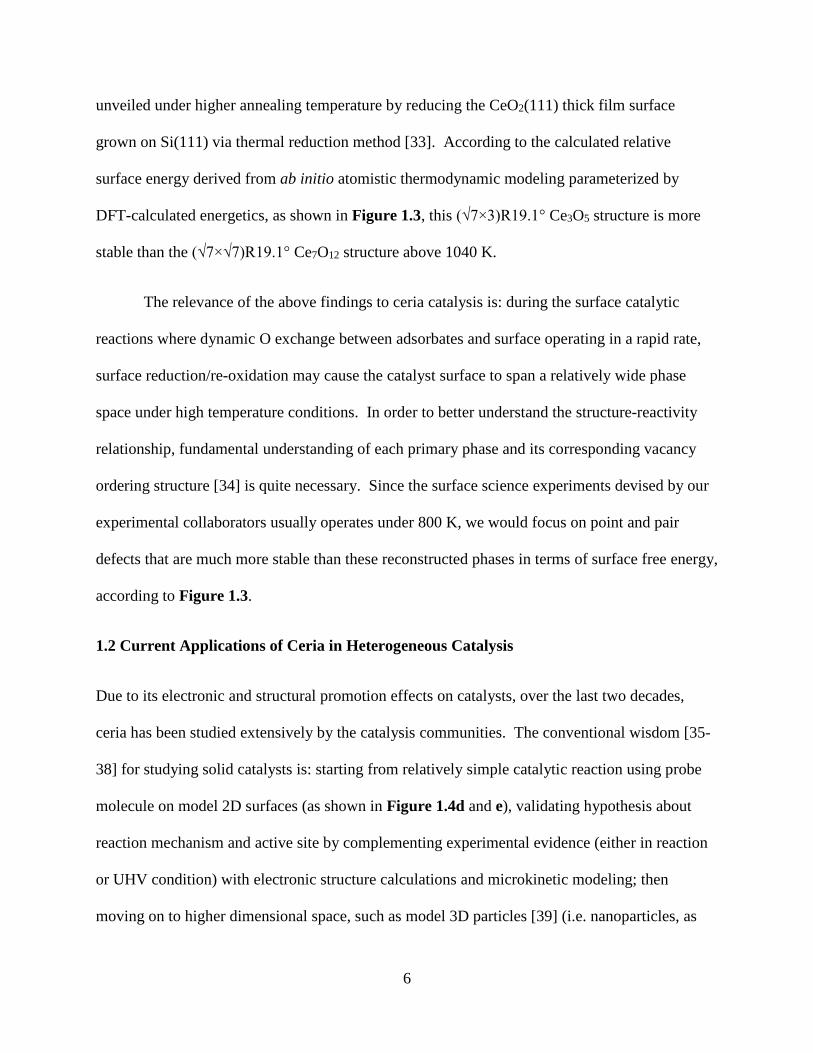
38] for studying solid catalysts is: starting from relatively simple catalytic reaction using probe
molecule on model 2D surfaces (as shown in Figure 1.4d and e), validating hypothesis about
reaction mechanism and active site by complementing experimental evidence (either in reaction
or UHV condition) with electronic structure calculations and microkinetic modeling; then
moving on to higher dimensional space, such as model 3D particles [39] (i.e. nanoparticles, as

7
shown in Figure 1.4a-c) that typically consist of multiple 2D surfaces that could potentially
render synergistic effects (for instance in the interface) on the current catalytic system. Catalytic
research on ceria-based materials is no exception with model catalysts ranging from low-index
surfaces (generally under UHV condition) to nanoparticles [1, 2, 18, 40-42], incorporated with
advanced quantum chemical techniques such as density functional theory (DFT) [43], and ab
initio molecular dynamics (AIMD) [44, 45], as well as larger scale molecular dynamics [39, 46],
in order to better understand the fundamental structures and their potential relevance to reaction
mechanisms.
The most successful commercial application of ceria is probably the modern three-way
converters for automotive emission control [4], where the exhaust gases of the internal
combustion engine mainly consist of CO, HC (hydrocarbon), and NOx. Due to its excellent
oxygen storage capacity [47], ceria-based materials (i.e. ceria-zirconia solid solution) are used as
the so-called oxygen storage material (OSM) in the modern three-way converters and mainly
play the role of structural promoter for the catalytically active components [48, 49], i.e. the
platinum group metals: Rh (catalyze NOx reduction), Pt (catalyze CO and HC oxidation), and Pd
(catalyze CO and HC oxidation). Due to its redox and acid-base properties, ceria can also offer
catalytic activity in its own right, for instance activating C-H bond of HC. With more stringent
environmental regulations on the automotive emission control standards, more efficient three-
way catalysts are in high demand commercially, thus push forward the current knowledge on
ceria-based materials in order to achieve such advanced technological resolution.
8
Figure 1.4. (a)-(c) Structural evolution of simulated 3D ceria nanoparticle starting from
different initial structures by molecular dynamics. Reprinted with permission from Sayle TXT et
al., Chem Commun 0:2438-2439; © 2004 Royal Society of Chemistry (d) and (e) refer to the
side and top view of our 2D surface model CeO2(111) with point defect Vo, respectively, with
green, light and dark brown spheres represent lattice Ce, surface lattice O, subsurface lattice O,
respectively. Molecular images in this figure and those below are created using VESTA [50].
One exciting potential new catalytic application for ceria is related to biomass
conversion. The production of fuels and chemicals from biomass has captured significant
research and commercial interest in recent decades [51-53]. Biomass is potentially a renewable,
carbon-neutral source of carbon that can be supplied domestically. Biomass conversion is an
indirect and more technologically achievable method to harness energy from the Sun through
converting the carbon-containing compounds accumulated by photosynthesis into fuels and
9
value-added chemicals. Biomass utilization for fuel and chemical production is a high priority
research area for the U.S. Department of Energy [54, 55]. Thermal, chemical, and biological
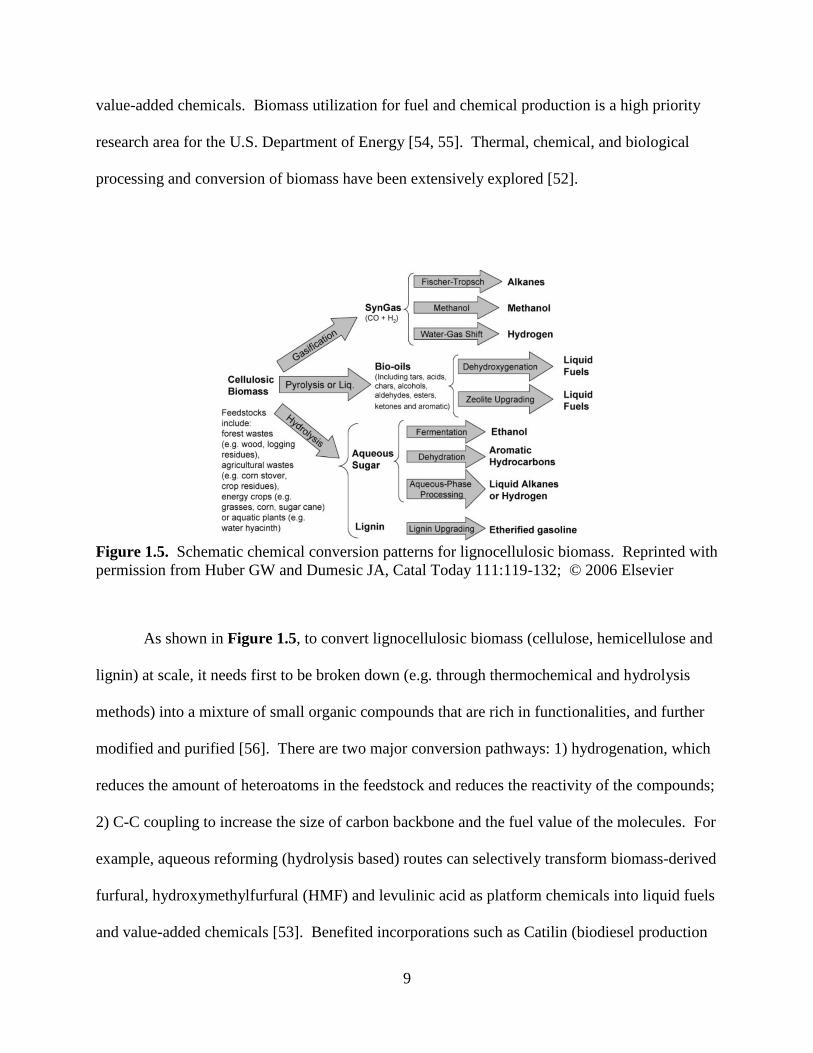
processing and conversion of biomass have been extensively explored [52].
Figure 1.5. Schematic chemical conversion patterns for lignocellulosic biomass. Reprinted with
permission from Huber GW and Dumesic JA, Catal Today 111:119-132; © 2006 Elsevier
As shown in Figure 1.5, to convert lignocellulosic biomass (cellulose, hemicellulose and
lignin) at scale, it needs first to be broken down (e.g. through thermochemical and hydrolysis
methods) into a mixture of small organic compounds that are rich in functionalities, and further
modified and purified [56]. There are two major conversion pathways: 1) hydrogenation, which
reduces the amount of heteroatoms in the feedstock and reduces the reactivity of the compounds;
2) C-C coupling to increase the size of carbon backbone and the fuel value of the molecules. For
example, aqueous reforming (hydrolysis based) routes can selectively transform biomass-derived
furfural, hydroxymethylfurfural (HMF) and levulinic acid as platform chemicals into liquid fuels
and value-added chemicals [53]. Benefited incorporations such as Catilin (biodiesel production
10
using mixed oxide catalyst), Velocys (microchannel reactor designed to produce fuels), ADM
(production of propylene glycol), Virent (production of aromatic chemical) and GlucanBio
(production of furan derivatives) have brought the technological products into market and proved
the economic feasibility of biomass conversion technology.
Thanks to its acid-base and redox properties, ceria is capable of reducing as well as
coupling biomass-derived organic oxygenates. C-C coupling reactions include aldol
addition/condensation of aldehydes and ketones and ketonization of carboxylic acids and esters,
which take advantage of functional groups such as formyl and carboxyl groups. For the aldol
addition/condensation reaction, Barteau and coworkers [57] studied the reaction of acetaldehyde
adsorbed on polycrystalline ceria and detected C4 species, such as crotonaldehyde, crotyl
alcohol, and reductive coupling products such as butene and butadiene. Dooley and coworkers
investigated the condensation of aldehydes on ceria-based catalysts and suggested the key role of
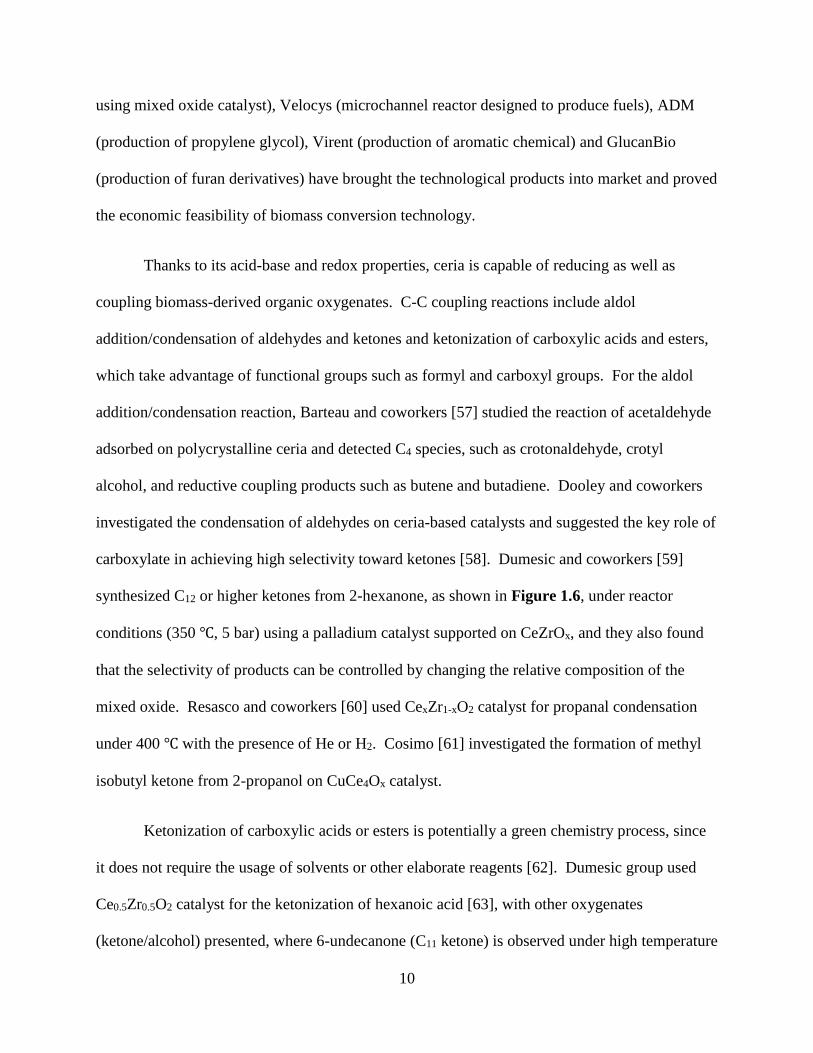
carboxylate in achieving high selectivity toward ketones [58]. Dumesic and coworkers [59]
synthesized C12 or higher ketones from 2-hexanone, as shown in Figure 1.6, under reactor
conditions (350 ℃, 5 bar) using a palladium catalyst supported on CeZrOx, and they also found
that the selectivity of products can be controlled by changing the relative composition of the
mixed oxide. Resasco and coworkers [60] used CexZr1-xO2 catalyst for propanal condensation
under 400 ℃ with the presence of He or H2. Cosimo [61] investigated the formation of methyl
isobutyl ketone from 2-propanol on CuCe4Ox catalyst.
Ketonization of carboxylic acids or esters is potentially a green chemistry process, since
it does not require the usage of solvents or other elaborate reagents [62]. Dumesic group used
Ce0.5Zr0.5O2 catalyst for the ketonization of hexanoic acid [63], with other oxygenates
(ketone/alcohol) presented, where 6-undecanone (C11 ketone) is observed under high temperature
11
Figure 1.6. Conversion of 2-hexanone on CeZrOx supported Pd catalyst. Reprinted with
permission from Gurbuz EI et al., Appl Catal B-Environ 94:134-141; © 2010 Elsevier
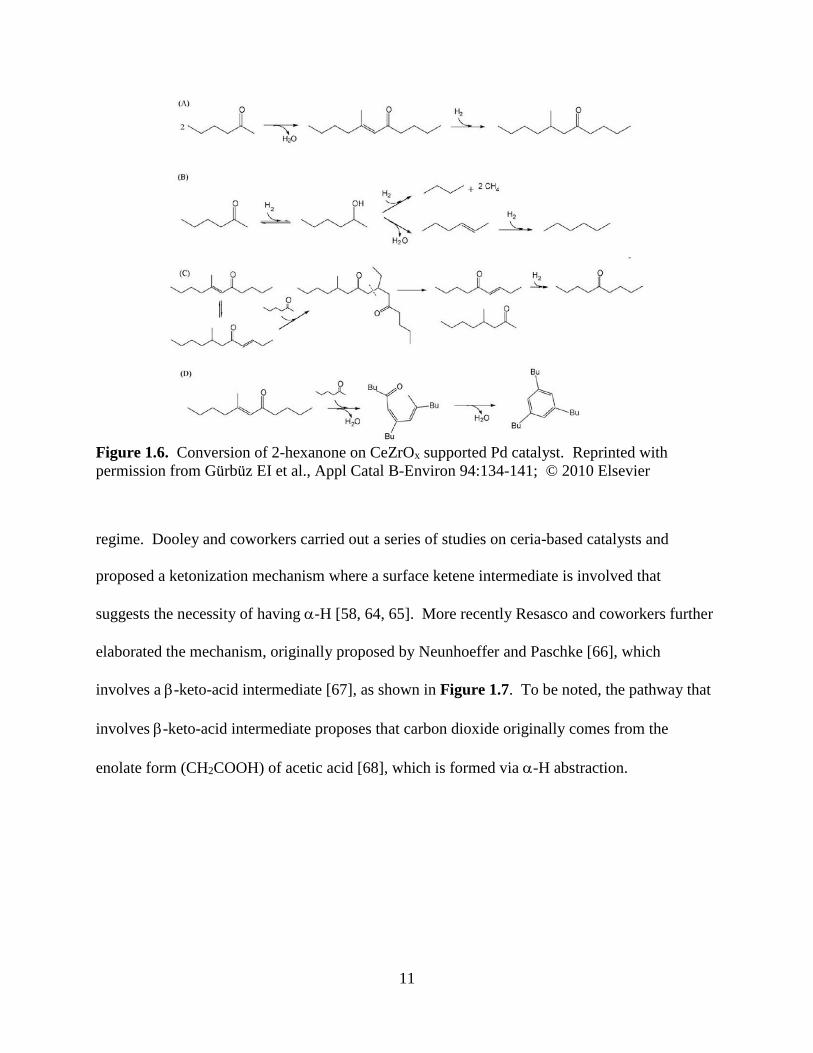
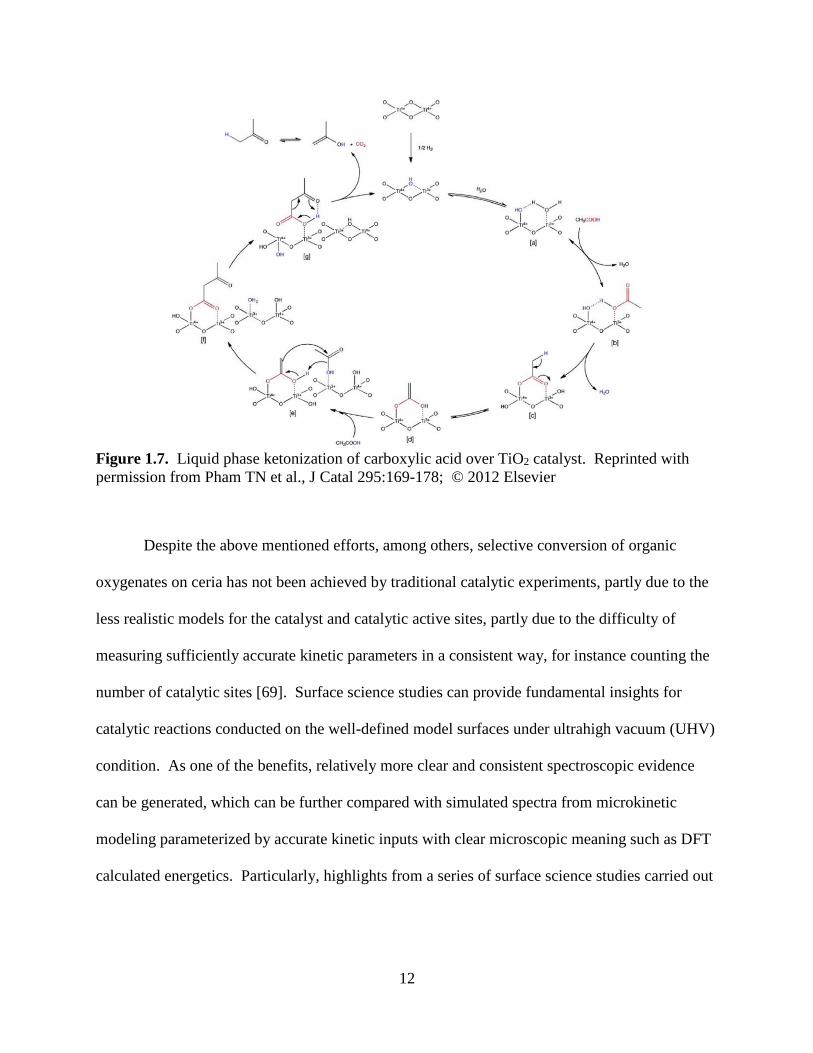
regime. Dooley and coworkers carried out a series of studies on ceria-based catalysts and
proposed a ketonization mechanism where a surface ketene intermediate is involved that
suggests the necessity of having -H [58, 64, 65]. More recently Resasco and coworkers further
elaborated the mechanism, originally proposed by Neunhoeffer and Paschke [66], which
involves a -keto-acid intermediate [67], as shown in Figure 1.7. To be noted, the pathway that
involves -keto-acid intermediate proposes that carbon dioxide originally comes from the
enolate form (CH2COOH) of acetic acid [68], which is formed via -H abstraction.
12
Figure 1.7. Liquid phase ketonization of carboxylic acid over TiO2 catalyst. Reprinted with
permission from Pham TN et al., J Catal 295:169-178; © 2012 Elsevier
Despite the above mentioned efforts, among others, selective conversion of organic
oxygenates on ceria has not been achieved by traditional catalytic experiments, partly due to the
less realistic models for the catalyst and catalytic active sites, partly due to the difficulty of
measuring sufficiently accurate kinetic parameters in a consistent way, for instance counting the
number of catalytic sites [69]. Surface science studies can provide fundamental insights for
catalytic reactions conducted on the well-defined model surfaces under ultrahigh vacuum (UHV)
condition. As one of the benefits, relatively more clear and consistent spectroscopic evidence
can be generated, which can be further compared with simulated spectra from microkinetic
modeling parameterized by accurate kinetic inputs with clear microscopic meaning such as DFT
calculated energetics. Particularly, highlights from a series of surface science studies carried out
13
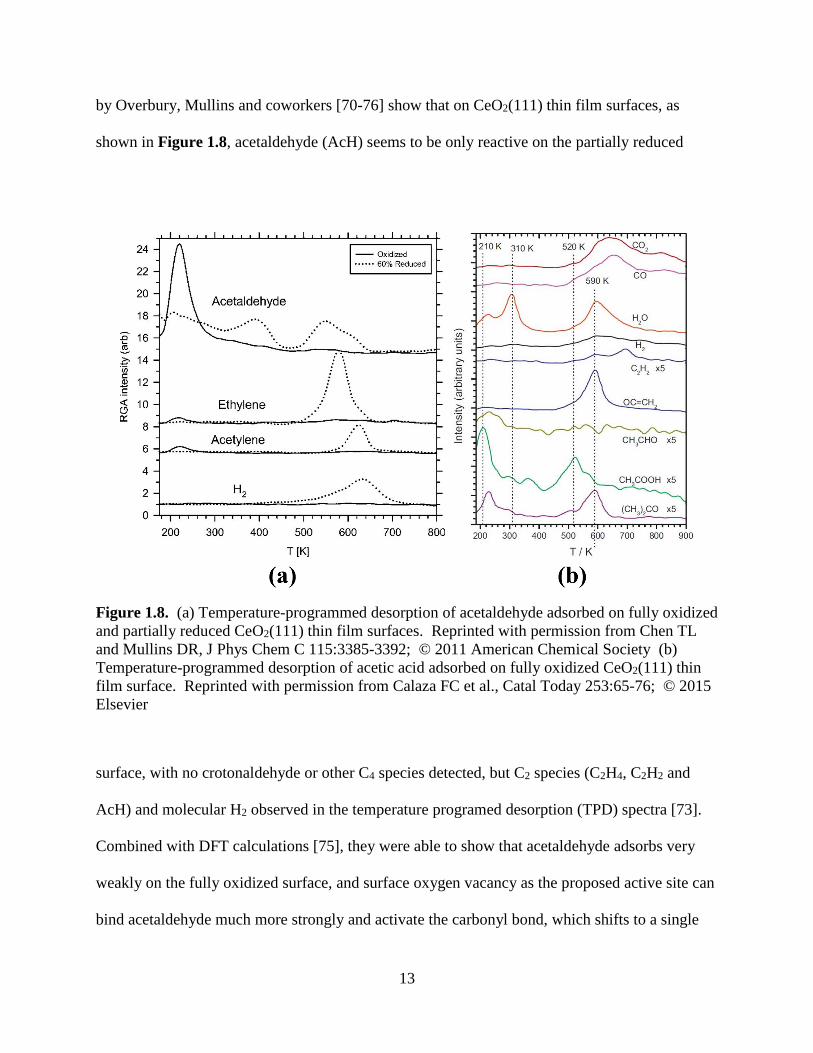
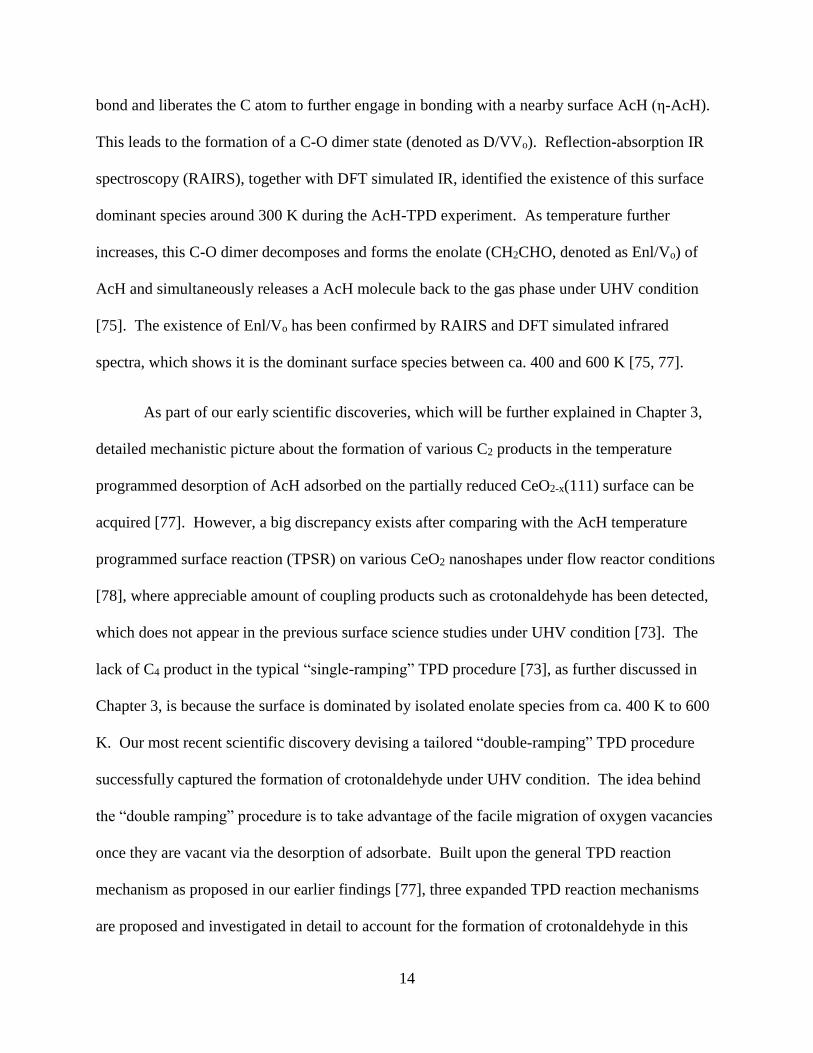
by Overbury, Mullins and coworkers [70-76] show that on CeO2(111) thin film surfaces, as
shown in Figure 1.8, acetaldehyde (AcH) seems to be only reactive on the partially reduced
Figure 1.8. (a) Temperature-programmed desorption of acetaldehyde adsorbed on fully oxidized
and partially reduced CeO2(111) thin film surfaces. Reprinted with permission from Chen TL
and Mullins DR, J Phys Chem C 115:3385-3392; © 2011 American Chemical Society (b)
Temperature-programmed desorption of acetic acid adsorbed on fully oxidized CeO2(111) thin
film surface. Reprinted with permission from Calaza FC et al., Catal Today 253:65-76; © 2015
Elsevier
surface, with no crotonaldehyde or other C4 species detected, but C2 species (C2H4, C2H2 and
AcH) and molecular H2 observed in the temperature programed desorption (TPD) spectra [73].
Combined with DFT calculations [75], they were able to show that acetaldehyde adsorbs very
weakly on the fully oxidized surface, and surface oxygen vacancy as the proposed active site can
bind acetaldehyde much more strongly and activate the carbonyl bond, which shifts to a single
14
bond and liberates the C atom to further engage in bonding with a nearby surface AcH (η-AcH).
This leads to the formation of a C-O dimer state (denoted as D/VVo). Reflection-absorption IR
spectroscopy (RAIRS), together with DFT simulated IR, identified the existence of this surface
dominant species around 300 K during the AcH-TPD experiment. As temperature further
increases, this C-O dimer decomposes and forms the enolate (CH2CHO, denoted as Enl/Vo) of
AcH and simultaneously releases a AcH molecule back to the gas phase under UHV condition
[75]. The existence of Enl/Vo has been confirmed by RAIRS and DFT simulated infrared
spectra, which shows it is the dominant surface species between ca. 400 and 600 K [75, 77].
As part of our early scientific discoveries, which will be further explained in Chapter 3,
detailed mechanistic picture about the formation of various C2 products in the temperature
programmed desorption of AcH adsorbed on the partially reduced CeO2-x(111) surface can be
acquired [77]. However, a big discrepancy exists after comparing with the AcH temperature
programmed surface reaction (TPSR) on various CeO2 nanoshapes under flow reactor conditions
[78], where appreciable amount of coupling products such as crotonaldehyde has been detected,
which does not appear in the previous surface science studies under UHV condition [73]. The
lack of C4 product in the typical “single-ramping” TPD procedure [73], as further discussed in
Chapter 3, is because the surface is dominated by isolated enolate species from ca. 400 K to 600
K. Our most recent scientific discovery devising a tailored “double-ramping” TPD procedure
successfully captured the formation of crotonaldehyde under UHV condition. The idea behind
the “double ramping” procedure is to take advantage of the facile migration of oxygen vacancies
once they are vacant via the desorption of adsorbate. Built upon the general TPD reaction
mechanism as proposed in our earlier findings [77], three expanded TPD reaction mechanisms
are proposed and investigated in detail to account for the formation of crotonaldehyde in this

15
“double-ramping” TPD procedure. Density functional theory (DFT) calculated energetics are
fed into corresponding mean-field microkinetic model that is able to generate simulated TPD
spectra, which can be directly compared with the experimental TPD spectra. Once again, this
DFT+MkM methodology is found to be very helpful for validating our mechanistic hypothesis.
Figure 1.9. Comparison of experimental and DFT-calculated IR spectra for acetates with
different local environments on fully oxidized CeO2(111) thin film surface. Reprinted with
permission from Calaza FC et al., Catal Today 253:65-76; © 2015 Elsevier
Oxygenates with different functional groups can introduce dramatic differences in terms
of surface chemistry on ceria. For instance, acetic acid (AA) can be quite reactive even on the
fully oxidized CeO2(111) thin film surface, with major products including ketene, water, CO and
CO2 , while acetone is only a minor product, as shown in the TPD spectra in Figure 1.8b [76].
On the other hand, as discussed earlier, AcH is not able to do so given the same surface. Earlier
findings show that one big difference at the initial stage of TPD is acetic acid can reduce the
16
fully oxidized surface around 300 K [76]. This surface reduction step forms a vacancy stabilized
acetate species (denoted as Ata/Vo) that can stay on the surface until above 500 K, providing
enough carbon supply for the subsequent C-C coupling step. As shown in Figure 1.9, this
argument is validated by the fact that DFT-calculated IR spectra of acetates with different local
environments overlap with the experimental RAIRS spectra under 527 K. To be noted, DFT-
calculated IR modes are usually red-shifted compared with the corresponding experimental IR
modes, and their dependence on the magnitude of U is negligible [71]. Dwelled upon earlier
proposed mechanisms for ketonization of carboxylic acids on reducible oxides, our proposed
ketonization pathway on the fully oxidized CeO2(111) surface involving both surface bent ketene
and oxygen vacancy stabilized β-keto acid will be explored in detail in Chapter 3.
As one of the minor components in biomass, phosphorous (P) is quite often used as
agricultural fertilizer and is critical for food production [79]. However, phosphorite (phosphate
rock) is a nonrenewable resource and is distributed quite unevenly from a geographic
perspective, which undoubtedly limit the production of P-containing fertilizer, therefore
imposing serious threats to human society [80]. On the other hand, quite a few phosphate-
containing anthropogenic wastes do not receive enough notice in terms of recycling, such as
agricultural runoff, industrial wastewater, and human sewage. As a result, eutrophication
problems have been created and threaten aquaculture industries as well as potable water
resources [81]. For instance, organophosphates (OPs), which are found in many consumer,
industrial, and agricultural chemical products, can be found in the above mentioned wastes and
often possess toxicity to animals and even humans. Removal of P from such wastes as well as
extraction of P from biomass feedstock constitutes important steps in sustainable P use [82].
Environmental necessity and economic and technological feasibility of such methods suggest

17
that the further development of and support for sustainable P use need to be on the agenda of
policymakers today [83].
The degradation of OPs in the environment can take months and even years [84, 85]. The
hydrolysis of the P-O ester bond by microbes is the primary pathway for OP degradation in
nature [86]. Earlier studies have demonstrated promising catalytic activities of cerium oxide
nanoparticles toward aqueous-phase dephosphorylation, i.e. hydrolysis, of organic and biological
compounds including phosphopeptides, para-nitrophenyl phosphate (p-NPP), ATP, and
phospho-tyrosine [87, 88] that parallel the function of phosphatases. Recently, Janos et al.
suggested that ceria-based reactive sorbents can promote the dephosphorylation of several OP
pesticides and chemical warfare agents, which opens up a new frontier for ceria in environmental
catalysis and may be relevant to large-scale environmental application of P recovery
technologies [89, 90]. Manto et al. very recently studied the catalytic dephosphorylation of p-
NPP using different ceria nano-shapes in deionized water, among which nano-spheres (ca. 4 nm;
no preferential exposed facet) showed the highest catalytic activity, followed by nano-octahedra
(ca. 18 nm), which primarily expose (111) facets [91]. Although extensive experimental and
theoretical studies have been reported in the literature that examine the hydrolysis mechanism of
phosphate esters in aqueous solutions or by enzymatic complexes [92-99], the understanding of
the dephosphorylation process on solid surfaces remains incomplete [100-104].
Hydrolysis of phosphate esters in water has been extensively studied theoretically [93-
99]. In general, as suggested by Warshel and coworkers [94-98], based on potential energy
surfaces parameterized by two characteristic P-O bond distances (i.e., d(P-ONU) and d(P-OLG),
where ONU refers to the O atom of the nucleophile (i.e. water), and OLG refers to the O atom of
the leaving group), the hydrolysis mechanisms of phosphate monoesters in water fall into three

18
major categories: 1) the associative type, where the nucleophilic attack occurs first forming an
intermediate complex with a pentavalent P center, followed by a second transition state
corresponding to the P-OLG bond scission; 2) the dissociative type, where the leaving group
departs before the nucleophilic attack and formation of the P-ONU bond; 3) the concerted type,
where the reaction proceeds via a single transition state with both P-ONU and P-OLG bonding
characters [95, 99]. The mechanistic preference appears to be influenced by the pKa of the
leaving group in water, with poor leaving groups (high pKa) favoring associative mechanisms
and good leaving groups (lower pKa) favoring dissociative mechanisms [95, 99]. Among others,
Florián et al. used Hartree-Fock (HF) and second-order Møller-Plesset perturbation theory (MP2)
together with the Langevin dipoles (LD) model as well as the polarized-continuum model (PCM)
to study the hydrolysis of neutral, mono-anionic, and di-anionic MP [94]. A more recent
example is the work of Duarte et al., who used the M06-2X and ωB97X-D density functionals
and a mixture of implicit/explicit solvent models to investigate the hydrolysis of the di-anions of
several aryl phosphate monoesters as well as MP in water [99]. The hydrolysis of the neutral MP
is found to preferentially proceed via an associative mechanism, while the associative and
dissociative mechanisms are competitive for the mono-anionic and the di-anionic MP [94]. The
highest activation free energies for the hydrolysis of neutral, mono-anionic, and di-anionic MP
were reported by Florián et al. to be 1.52, 1.73, and 1.65 eV in MP2+LD, and by Duarte et al. to
be 1.54 eV in M06-2X and 1.74 eV in ωB97X-D for di-anionic MP. On the other hand, Duarte
et al. found di-anionic p-NPP to prefer a concerted mechanism with a single barrier calculated to
be 1.18 eV in M06-2X and 1.08 eV in ωB97X-D [99], and they reported a threshold pKa value of
ca. 12, below which the hydrolysis of a phosphate monoester di-anion prefers a concerted
mechanism, and above which an associative mechanism would prevail [99].
19
The dephosphorylation and following hydration of model phosphate monoesters,
including p-NPP and methyl phosphate (MP), on fully oxidized CeO2(111) in vacuo is studied
here systematically, in order to shed light on the factors controlling the kinetics of this reaction
and to help establish the range of OPs the dephosphorylation of which ceria may effectively
catalyze under mild or ambient conditions. The OPs are modeled in their neutral forms
(PO(OH)2OR) in this work, e.g. p-NPP-H2 and MP-H2, which are the predominant forms in
acidic to neutral conditions [93, 105]. The deprotonated forms (i.e., the mono-anionic p-NPP-
H1/MP-H1 and di-anionic p-NPP-H0/MP-H0) that prevail in neutral to basic solutions [106] will
be considered in a future study. The dephosphorylation of p-NPP is of interest because it is
accompanied by visible color change of the solution, which allows the reaction kinetics to be
readily analyzed using ultraviolet-visible (UV-Vis) absorption spectroscopy [91]. By
comparison, MP is the simplest organic phosphate monoester and is used here to explore how the
leaving group affects the activation of the P-O ester bond. Moreover, a linear transition state
scaling relation is proposed after considering several additional organic phosphate monoesters,
including para-chlorophenyl phosphate (p-ClPP), phenyl phosphate (p-HPP), 2-pyridyl
phosphate (2-py-P), and chloro-methyl phosphate (Cl-MP). The formation and desorption of the
resulting alcohol species (i.e. para-nitrophenol (p-NP) or 4-nitrophenol from p-NPP, and
methanol from MP) are facile and therefore kinetically insignificant.
20
TECHNICAL APPROACH
2.1 Density Functional Theory Calculations
Periodic, spin-polarized DFT calculations were performed using the Vienna Ab initio Simulation
Package (VASP) [107] in the generalized gradient approximation (GGA) using the Perdew-
Wang (PW91) exchange-correlation functional [108]. The optB86b van der Waals (vdW)
functional was used to estimate the vdW contribution in the adsorption of AcH and CrA [109,
110]. The projector-augmented wave method (PAW) was used to describe the core electrons
[111], and the Kohn–Sham valence states [Ce(5s5p4f5d6s), Cl(3s3p), P(3s3p), O(2s2p), N(2s2p),
C(2s2p), H(1s)] were expanded in a plane wave basis set with a kinetic energy cutoff of 400 eV.
The adsorption energy of an atom or molecule was calculated as ∆Eads = Etotal – Eslab –
Egas, where Etotal, Eslab, Egas refer to the energy of the slab with the adsorbed atom or molecule,
the energy of the clean surface, and the energy of the atom or molecule in the gas phase in a
neutral state, respectively. Thus, the more negative the value of ∆Eads is, the stronger the
adsorption is. The minimum energy reaction path for each proposed elementary step and the
associated transition state (TS) were determined using the climbing-image nudged elastic band
method [112, 113] and dimer method [114, 115]. The activation energy was calculated as Ea =
ETS – EIS, where ETS and EIS refer to the energy of the transition state and corresponding initial
state, respectively. The corresponding reaction energy of an elementary step is Erxn = EFS – EIS,
where EIS and EFS refer to the energy of the initial and final state of the elementary step,
respectively. Both geometry optimization and transition state search were converged to the
extent that the maximum residual force was 0.01 eV/Å or less in all relaxed degrees of freedom.
The singlet-triplet/doublet-quadruplet splitting was checked, and the lower adsorption energy for
21
an adsorbate and the lower activation energy for an elementary reaction step (at constant spin)
are reported below. Transition states were verified to possess only one vibrational mode with a
negative curvature in the direction of the bond breaking or forming process. Vibrational modes
and frequencies were calculated using a finite difference approximation approach of the
dynamical matrix with a displacement of 0.01 Å. If not specified, the ∆Eads, Ea, and Erxn values
were calculated on p(2×2) surface unit cells. The values reported in the main text are based on
DFT total energies only, while zero-point energy (ZPE) and free energy corrections were applied
in the microkinetic models.
The DFT+U formalism of Dudarev et al. [116] was used to partially offset the 4f electron
delocalization error in DFT at the GGA level [117]. A U value of 2 eV was used based on our
previous studies of similar reaction systems on CeO2(111) [71, 75], which found that larger U
values in combination with DFT-GGA gave less accurate predictions of reaction kinetics based
on Redhead analysis [118] when compared to the peak desorption temperatures observed in
TPD. Small U values (≲ 2 eV) have also been recommended by other authors [119, 120] based
on comparison with experimental reaction energetics, although large U values (≳ 4eV) are
generally recommended based on theoretical electronic structure arguments [121, 122]. The
equilibrium lattice constant of the CeO2 bulk was calculated to be 5.476 Å on a (151515)
Monkhorst-Pack k-point grid at U=2 eV, in close agreement with previous experimental and
computational values [43].
As shown in Figure 2.1, the CeO2(111) surface was modeled primarily with a slab
consisting of three O-Ce-O tri-layers, with the top tri-layer of the slab and adsorbate fully
relaxed, and the remaining two tri-layers fixed at the bulk positions. Size of surface unit cell was
chosen to be sufficient to accommodate model compounds. The slab was separated from its
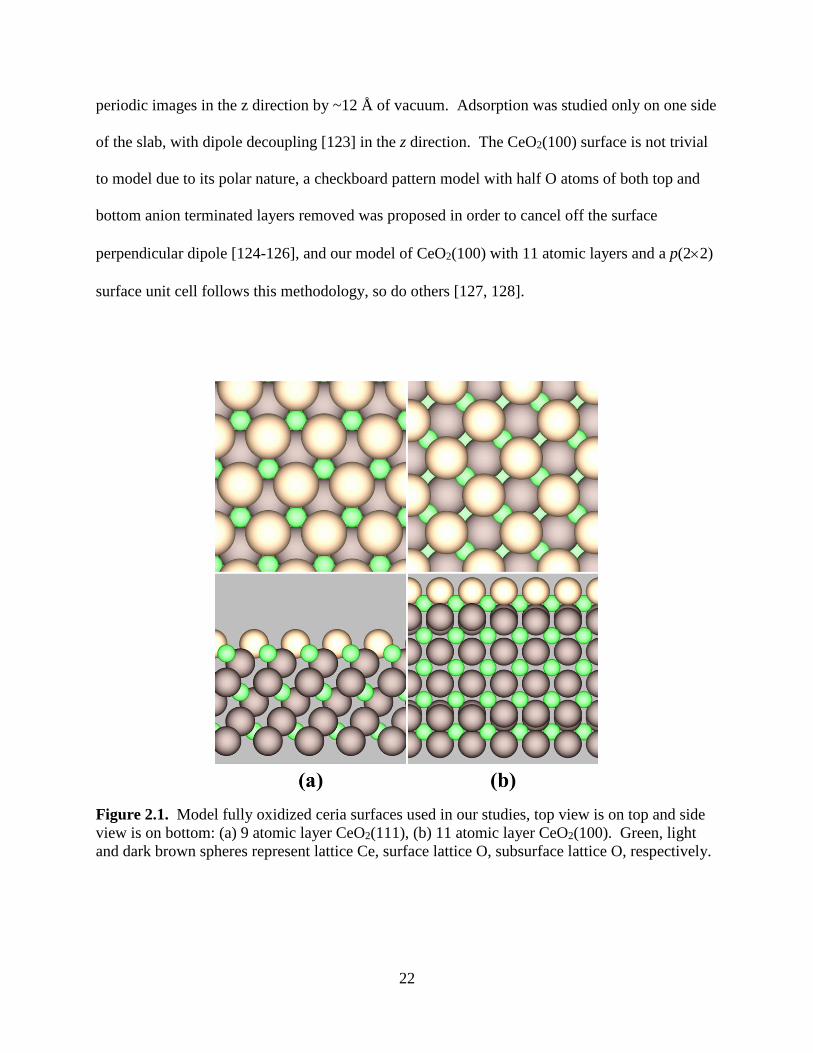
22
periodic images in the z direction by ~12 Å of vacuum. Adsorption was studied only on one side
of the slab, with dipole decoupling [123] in the z direction. The CeO2(100) surface is not trivial
to model due to its polar nature, a checkboard pattern model with half O atoms of both top and
bottom anion terminated layers removed was proposed in order to cancel off the surface
perpendicular dipole [124-126], and our model of CeO2(100) with 11 atomic layers and a p(22)
surface unit cell follows this methodology, so do others [127, 128].
Figure 2.1. Model fully oxidized ceria surfaces used in our studies, top view is on top and side
view is on bottom: (a) 9 atomic layer CeO2(111), (b) 11 atomic layer CeO2(100). Green, light
and dark brown spheres represent lattice Ce, surface lattice O, subsurface lattice O, respectively.
23
The exact structure of the CeO2-x(111) thin films used in the TPD experiment (i.e.
CeO1.70) [73] was not investigated by Chen et al. STM images of CeO1.75(111) thin films
reported in a separate study by Zhou et al. [20] showed an ordered hexagonal CeO2 lattice with
both isolated and patches of dark depressions, presumably oxygen vacancies. If the outermost
O-Ce-O tri-layer had a composition of CeO1.70, it would correspond to 60% of the Ce atoms
being in the 3+ oxidation state, or 30% of the O atoms being missing. At the upper limit, if all of
the oxygen vacancies are located in the surface O layer, it would correspond to a coverage of
0.30 ML for oxygen vacancies. It should be noted that the clustering of oxygen vacancies
reported [129] in CeO2(111) surfaces cut from natural CeO2 crystals has been called into
question recently, due to possible mistaken identity for naturally occurring fluorine
contamination [130].
For the AcH-TPD and AA-TPD modeling part, we used point oxygen vacancy (Vo) as the
main vacancy model, which corresponds to one oxygen vacancy per (22) surface unit cell (i.e.
0.25 ML vacancy coverage) where a Γ-centered 221 Monkhorst-Pack k-point grid was used to
sample the surface Brillouin zone [131]. The energetics of different Vo ensembles were
determined on p(4×4) surface unit cells where the k-point grip was sampled at the Γ-point only.
For the dephosphorylation of p-NPP modeling part, we used a p(3×3) surface unit cell
consistently where a Γ-centered 221 Monkhorst-Pack k-point grid was used.
The projected density of states (pDOS, 333 Monkhorst-Pack k-point grid) calculations
for bulk CeO2 and c-Ce2O3 (bixbyite) were based on the Heyd-Scuseria-Ernzerhof (HSE06)
hybrid functional [132], and the corresponding optimized lattice constants were calculated to be
5.40 Å (111111 Monkhorst-Pack k-point grid) and 11.20 Å (Γ-point only Monkhorst-Pack k-

24
point grid, antiferromagnetic state), respectively. The band gap between O 2p and Ce 4f was
calculated to be 3.5 eV for bulk CeO2, and the Ce 4f - 5d band gap was calculated to be 2.6 eV
for c-Ce2O3. Therefore, the key results of our electronic structure calculations are in good
accordance with previous literature: CeO2, 5.41 Å lattice constant (experiment [133], calculation
[134]), O 2p - Ce 4f band gap (experiment: 3 eV [135], calculation: 3.3 eV [134]); c-Ce2O3,
11.16 Å lattice constant (experiment [136]), Ce 4f - 5d band gap (experiment: 2.4 eV [137]). In
order to simulate the resonant-on mode of the angle-resovled RPES experiment, core-level (4d)
electron excitation was done using the method of Köhler and Kresse [138].
2.2 Microkinetic Modeling
To simulate the TPD process, a reaction mechanism was proposed that consisted of a series of
surface reaction steps and desorption steps. In accordance with the TPD experiment of Chen et
al. [73], adsorption was assumed to occur before the temperature ramp and therefore not modeled
directly. The TPD process was mathematically modeled using a set of differential equations that
expressed the rate of change for the coverage of each surface species, i, as:
𝑑 (𝜃𝑖
𝜃°⁄ )
𝑑𝑡= ∑ 𝛼𝑗(𝑟𝑓,𝑗 − 𝑟𝑟,𝑗)
𝑗
where j is the stoichiometric coefficient of species i in step j, being positive if i is a product and
negative if i is a reactant in step j; rj is the forward reaction rate of step j, being equal to 𝑟𝑓,𝑗 =
𝑘𝑓,𝑗 ∏ (𝜃𝑘
𝜃°⁄ )|𝛼𝑘|
𝑘 where the product includes all the reactants of step j (the reverse rate is
similarly defined); and º is the standard coverage at which the activation barriers and reaction
energies are calculated (1/4 ML in this study). This set of differential equations was solved
together with ∑ 𝜃𝑖 = 1𝑖 , which includes the coverage of empty sites (*).
25
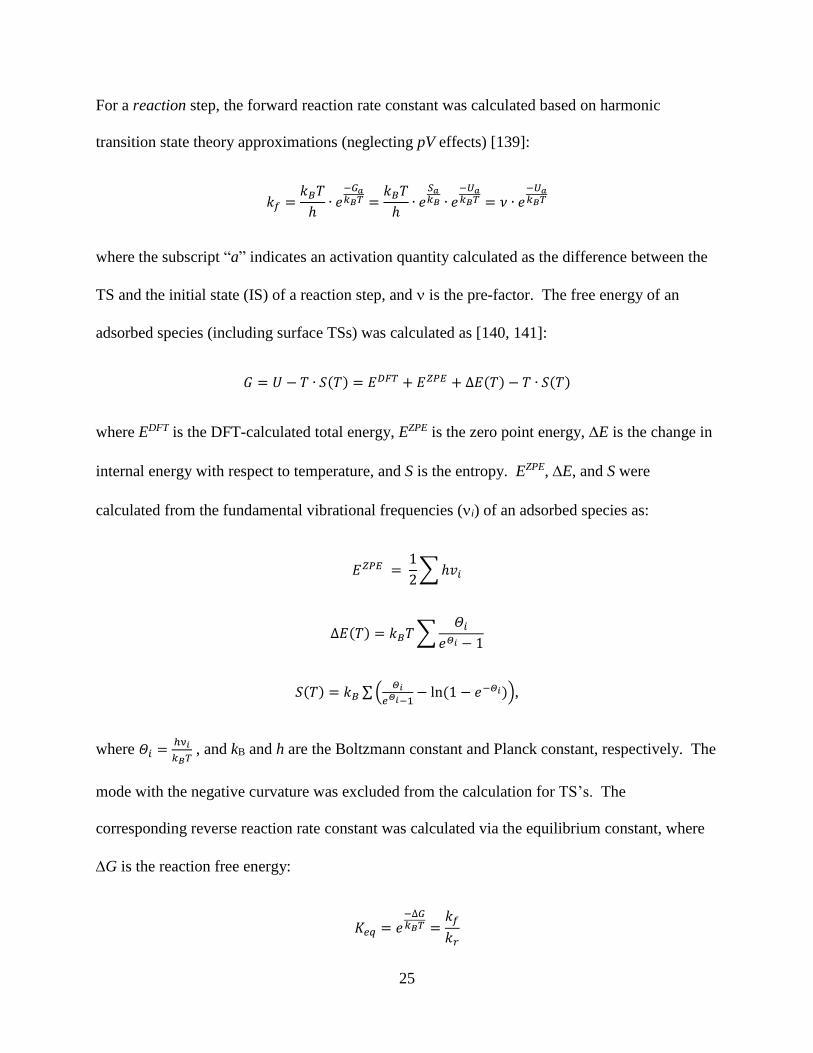
For a reaction step, the forward reaction rate constant was calculated based on harmonic
transition state theory approximations (neglecting pV effects) [139]:
𝑘𝑓 =𝑘𝐵𝑇
ℎ∙ 𝑒
−𝐺𝑎𝑘𝐵𝑇 =
𝑘𝐵𝑇
ℎ∙ 𝑒
𝑆𝑎𝑘𝐵 ∙ 𝑒
−𝑈𝑎𝑘𝐵𝑇 = 𝜈 ∙ 𝑒
−𝑈𝑎𝑘𝐵𝑇
where the subscript “a” indicates an activation quantity calculated as the difference between the
TS and the initial state (IS) of a reaction step, and is the pre-factor. The free energy of an
adsorbed species (including surface TSs) was calculated as [140, 141]:
𝐺 = 𝑈 − 𝑇 ∙ 𝑆(𝑇) = 𝐸𝐷𝐹𝑇 + 𝐸𝑍𝑃𝐸 + Δ𝐸(𝑇) − 𝑇 ∙ 𝑆(𝑇)
where EDFT is the DFT-calculated total energy, EZPE is the zero point energy, E is the change in
internal energy with respect to temperature, and S is the entropy. EZPE, E, and S were
calculated from the fundamental vibrational frequencies (i) of an adsorbed species as:
𝐸𝑍𝑃𝐸 = 1
2∑ ℎ𝑣𝑖
Δ𝐸(𝑇) = 𝑘𝐵𝑇 ∑𝛩𝑖
𝑒𝛩𝑖 − 1
𝑆(𝑇) = 𝑘𝐵 ∑ (𝛩𝑖
𝑒𝛩𝑖−1− ln(1 − 𝑒−𝛩𝑖)),
where 𝛩𝑖 =ℎν𝑖
𝑘𝐵𝑇 , and kB and h are the Boltzmann constant and Planck constant, respectively. The
mode with the negative curvature was excluded from the calculation for TS’s. The
corresponding reverse reaction rate constant was calculated via the equilibrium constant, where
G is the reaction free energy:
𝐾𝑒𝑞 = 𝑒−∆𝐺𝑘𝐵𝑇 =
𝑘𝑓
𝑘𝑟

26
The desorption steps were all taken to be irreversible (forward direction only) under UHV
condition. For the molecular desorption of AcH and CrA, the activation barrier was taken to be
the negative of its Eads (i.e. no activation barrier for the corresponding adsorption process). A
typical value of 1013 was used as the pre-factor. A reactive desorption step (i.e. C-O bond
scission releasing C2Hx to gas phase), was treated as a reaction step, not a desorption step.

27
RESULTS AND DISCUSSION
Previous experiments have shown that ceria can be beneficial towards C-C coupling of
aldehydes/carboxylic acids, however the reaction mechanism and active sites remain unclear,
which impedes finding better or novel catalysts for upgrading biomass-derived oxygenates.
Ceria as a catalyst for recovering phosphorus from phosphates is possible but also poorly
explored or understood, which is of high importance partly because phosphorus is a
nonrenewable resource and because organophosphates are the main ingredients of many
agricultural chemicals. Both areas require fundamental insights to enable practical applications
based on ceria. In the following sections1, we used relevant model compounds, AcH, AA and p-
NPP, to discover the catalytic mechanisms for adol addition, ketonization, and
dephosphorylation reactions, respectively, primarily on model CeO2(111) surfaces that are
thermodynamically the most stable low-index facet and prevail on ceria nano-octahedra [142].
3.1 Transformations of Acetaldehyde and Acetic Acid on CeO2(111)
Previously, Overbury and coworkers proposed and validated a preferred C-O dimerization
pathway leading to enolate formation after AcH adsorption on partially reduced CeO2-x(111)
1This chapter contains four previously published articles: 1) C. Zhao et al., “Simulated
Temperature Programmed Desorption of Acetaldehyde on CeO2(111): Evidence for the Role of
Oxygen Vacancy and Hydrogen Transfer,” Top Catal 60 (2017): 446-458. Copyright 2017
Springer Nature; 2) C. Zhao et al., “Coupling of Acetaldehyde to Crotonaldehyde on CeO2-
x(111): Bifunctional Mechanism and Role of Oxygen Vacancies” J Phys Chem C XXX (2018):
XXX-XXX. Copyright 2018 American Chemical Society; 3) C. Zhao et al., “Theoretical
Investigation of Dephosphorylation of Phosphate Monoesters on CeO2(111)” Catal Today 312
(2018): 141-148. Copyright 2018 Elsevier; 4) Duchoň T. et al., “Covalent versus Localized
Nature of 4f Electrons in Ceria: Resonant Angle-Resolved Photoemission Spectroscopy and
Density Functional Theory” Phys Rev B 95 (2017): 165124. Copyright 2017 American Physical
Society, are reprinted (adapted) here by permission of Springer Nature, American Chemical
Society, Elsevier, and American Physical Society, respectively.
28
[75]. The structures of several reaction intermediates, such as surface adsorbed AcH (AcH*),
vacancy stabilized AcH (AcH/Vo), vacancy dimer stabilized C-O dimer state (D/VVo), and
vacancy stabilized enolate (CH2CHO, Enl/Vo) have been proposed, as shown in Figure 3.1.
AcH* preferentially adsorbs in the η1 configuration with the carbonyl O located above a
threefold hollow site above a second layer Ce cation, and the carbonyl H pointing toward a
surface lattice O (Figure 3.1a). It has a C-C bond length (dC-C) of 1.492 Å and a dC-O of 1.228
Å, nearly identical to those of AcH in the gas phase (1.484 and 1.219 Å, respectively), and a
ΔEads of -0.25 eV (relative to gas-phase AcH). The adsorption energies and the C-C and C-O
bond lengths of the various C2HxO species investigated in this study are summarized in Table 1.
AcH adsorbs more strongly in an oxygen vacancy (AcH/Vo; Figure 3.1b), with ΔEads = -1.11 eV.
The dC-C is slightly shorter (1.486 Å), whereas the dC-O is longer (1.305 Å) than AcH*, indicating
interaction with the oxygen vacancy and partial rehybridization of the C=O bond. Polymeric
AcH has been explored in our previous study [75] due to earlier reports of AcH forming C-O
linked polymers on metal and oxide surfaces at low temperatures [143, 144]. A representative
structure that most closely matches the observed RAIR spectrum at 300 K involves the coupling
of the carbonyl C of AcH/Vo to the carbonyl O of AcH*, followed by the bonding of the
carbonyl C of the AcH* to a surface lattice oxygen, creating a O-C-O-C-O linkage (Figure 3.1c).
This dimer state is more stable than both AcH* and AcH/Vo, with a ΔEads of -1.37 eV per AcH
unit. The carbon-surface oxygen bonds are at ~1.40 Å, and the C-O bonds in the middle of the
linkage are at ~1.47 Å. Longer polymeric states formed in a similar way may be present but
have not been studied. The enolate of AcH (Enl/Vo; Figure 3.1d) has been found to match the
observed IR spectrum at 400 K, and is consistent with sXPS and EXAFS evidence that the ⍺-C
becomes more negatively charged when temperature was ramped up from300 K to 400 K [73].

29
Figure 3.1. (Top) top view and (bottom) side view (from the bottom side of the top view) of
DFT-calculated minimum-energy structures of (a) AcH*, (b) AcH/Vo (c) D/VVo, (d) Enl/Vo, (e)
Etx/Vo, (f) CHCHO/Vo, and (g) CH2CH2O/Vo on CeO2-x(111). Green, light brown, dark brown,
red, black, and white spheres represent lattice Ce, surface lattice O, subsurface lattice O, O in
molecules, C, and H atoms, respectively. Surface lattice O atoms bonded to C atoms in the
molecules are considered part of the molecules. Periodic images of the adsorbates have been
removed for clarity.
The carbonyl C-O bond is lengthened to 1.352 Å, whereas the C-C bond is noticeably shortened
to 1.346 Å, consistent with being a C=C double bond which confirms the enolate species [75].
Compared to gas-phase CH2CHO the ΔEads of Enl/Vo is -3.26 eV. As mentioned below, the
energy of Enl/Vo plus an atomic H adsorbed on an oxygen site at infinite separation is -2.01 eV

30
relative to gas-phase AcH. Therefore Enl/Vo is the most stable of these four surface states for
AcH, which is consistent with enolate appearing at higher temperatures than AcH and polymeric
AcH in RAIRS [75].
Furthermore, in order to shed light on the high temperature decomposition mechanism
that produces various C2 species, three additional surface intermediates are proposed in this study
to account for the formation of C2H4 and C2H2. They are various hydrogenated and
dehydrogenated forms of AcH/Vo. The hydrogenation of AcH/Vo at the carbonyl C position
produces a vacancy-stabilized ethoxy species (Figure 3.1e). The dC-O of Etx/Vo is 1.433 Å, and
the dC-C is 1.524 Å, both of which are significantly longer than the corresponding bonds in
AcH/Vo. Thus the C=O double bond character is completely lost upon the hydrogenation of
AcH/Vo. The ΔEads of Etx/Vo is -3.95 eV relative to the gas-phase ethoxy radical. The
dissociation of a methylene H from Enl/Vo produces CHCHO/Vo (Figure 3.1f). The dC-O and dC-
C are 1.398 and 1.337 Å, respectively. These values are comparable to the C=C and C-O bonds
in vinyl alcohol (1.332 and 1.374 Å) [75]. Relative to gas-phase C2H2O and C2H2, the ΔEads of
this species is -3.75 eV and -0.24 eV, respectively. It also possesses no vibrational mode with a
negative curvature. Carrasco et al. have previously reported a CHCHO/Vo state for C2H2
adsorption on CeO2(111), with a ΔEads of -0.12 eV [145]. The dissociation of a methyl H from
Etx/Vo, or equivalently the hydrogenation of the original carbonyl C position in Enl/Vo, produces
CH2CH2O/Vo (Figure 3.1g). The dC-O is 1.495 Å, much longer than a C=O double bond and
even longer than a typical C-O single bond. The dC-C of this state is 1.487 Å, which falls
between the lengths of a C-C single bond and a C=C double bond [75]. Its adsorption energy
relative to gas-phase CH2CH2O is ΔEads=-3.98 eV and relative to gas-phase C2H4 is ΔEads=+0.70

31
Table 1 Calculated minimum adsorption energies (ΔEads, in eV), magnetic
moment (in μB), and C-O and C-C bond lengths (dC-O and dC-C, in Å), of the
surface reaction intermediates on CeO2(111) and CeO2-x(111)
Species ΔEads a Magnetic
moment
dC-O dC-C
AcH* -0.25 b
-0.43 b, c
0 1.228 1.492
AcH/Vo -1.11 b 0 d 1.305 1.486
D/VVo -1.37 b, e 2 d 1.396
1.398
1.472 f
1.482 f
1.519
1.520
CHCHO/Vo -3.75
g
-0.24 h
0 1.398 1.337
Enl/Vo -3.26 g 1 d 1.352 1.346
CH2CH2O/Vo -3.98 g
+0.70 h
0 1.495 1.487
Etx/Vo -3.95 g 1 1.433 1.524
H* -3.00
-0.73 i
1 - -
a ΔEads is based on DFT total energy without ZPE corrections, at ¼ ML
coverage; no co-adsorbed atomic hydrogen is included b With respect to gas-phase AcH c Calculated using optB86b van der Waals functional d Singlet-triple/doublet-quadruplet splitting is 0.05 eV or less e Averaged over 2 AcH f Part of the polymeric C-O-C linkage g With respect to gas-phase C2HxO h With respect to gas-phase C2Hx i With respect to gas-phase H2
eV. The latter indicates that the C2H4 moiety would be more stable without the C-O bond,
although vibrational analysis finds no mode with a negative curvature, indicating that
CH2CH2O/Vo is a local minimum on the potential energy surface. By comparison, CHCHO/Vo
is more stable than CH2CH2O/Vo when viewed as the adsorbed states of the respective gas-phase
C2Hx molecules, which is consistent with C2H2 being a more reactive species than C2H4.
32
Incidentally, Enl/Vo (i.e. CH2CHO/Vo), CHCHO/Vo, and CH2CH2O/Vo, which all have
an unsaturated C end, can all form an alternate hemicyclic structure in which the unsaturated C
atom forms a bond to an adjacent surface O atom. The hemicyclic forms of CHCHO/Vo (i.e.,
CHOCHO/VVo) and CH2CH2O/Vo (i.e., CH2OCH2O/VVo) are 1.28 and 0.79 eV, respectively,
more stable than the non-cyclic, monoxy states, although the formation of the second C-O bond
have significant activation energies and is therefore not kinetically relevant in the microkinetic
model presented below. On the other hand, the hemicyclic form of the enolate (i.e.,
CH2OCHO/VVo), as was initially suggested by Chen et al. [73], is 1.56 eV less stable than
Enl/Vo. Finally, the adsorption energy of atomic hydrogen is calculated to be the lowest on top
of a surface lattice O, at -3.00 eV with respect to atomic H and -0.73 eV with respect to H2. The
ΔEads of H would be lowered to -3.48 eV, or -1.20 eV with respect to gas-phase H2, when a U
value of 5 eV is used [71]. Previously Vicario et al. [146] reported the H adsorption energy to be
-3.57 eV on the fully oxidized CeO2(111) surface with respect to gas-phase atomic H (U= 4 eV).
Popa et al. [147] reported -1.21 eV with respect to gas-phase H2 (U= 4.5 eV). Similar values
have also been reported by other authors [145, 148]. Therefore our results are in line with
previously reported values for the ΔEads of H on CeO2(111).
The elementary reaction steps that comprise the proposed TPD mechanism, along with
the activation barrier, representative pre-factor, and reaction energy for each of the steps, are
summarized in Table 2. These include the molecular desorption of AcH from a stoichiometric
site (Step 1) and from an oxygen vacancy (Step 2); the coupling of AcH to form the dimer state
33
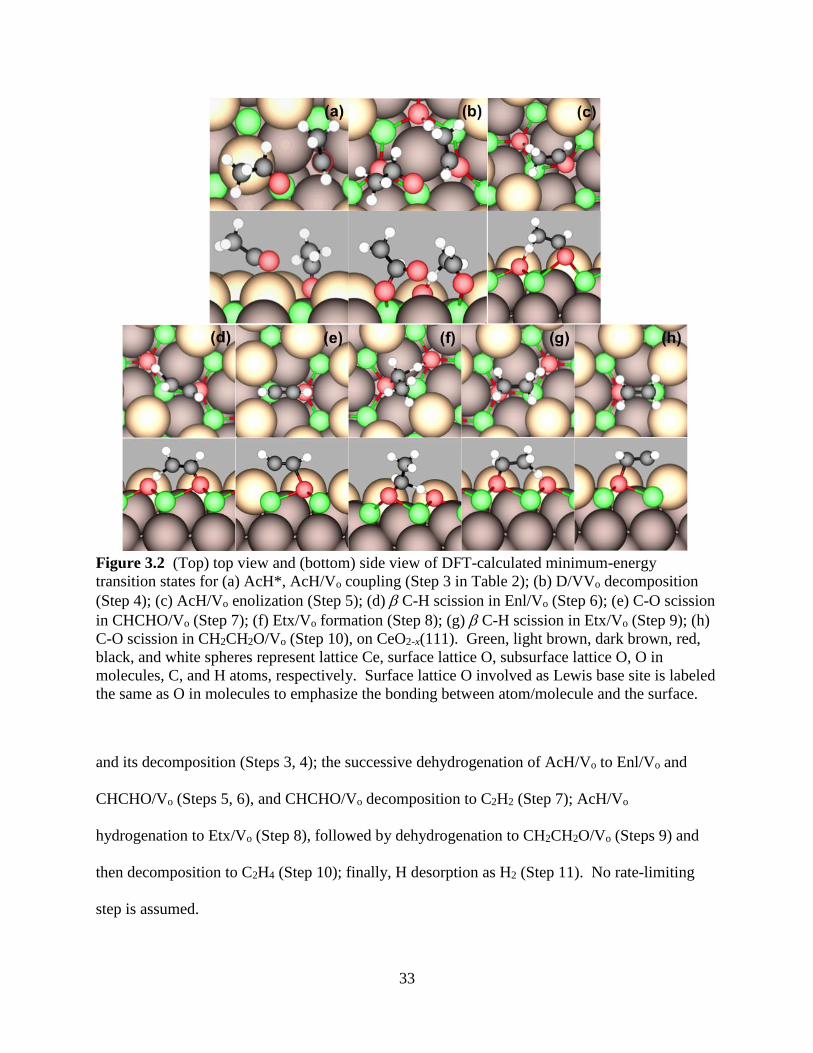
Figure 3.2 (Top) top view and (bottom) side view of DFT-calculated minimum-energy
transition states for (a) AcH*, AcH/Vo coupling (Step 3 in Table 2); (b) D/VVo decomposition
(Step 4); (c) AcH/Vo enolization (Step 5); (d) C-H scission in Enl/Vo (Step 6); (e) C-O scission
in CHCHO/Vo (Step 7); (f) Etx/Vo formation (Step 8); (g) C-H scission in Etx/Vo (Step 9); (h)
C-O scission in CH2CH2O/Vo (Step 10), on CeO2-x(111). Green, light brown, dark brown, red,
black, and white spheres represent lattice Ce, surface lattice O, subsurface lattice O, O in
molecules, C, and H atoms, respectively. Surface lattice O involved as Lewis base site is labeled
the same as O in molecules to emphasize the bonding between atom/molecule and the surface.
and its decomposition (Steps 3, 4); the successive dehydrogenation of AcH/Vo to Enl/Vo and
CHCHO/Vo (Steps 5, 6), and CHCHO/Vo decomposition to C2H2 (Step 7); AcH/Vo
hydrogenation to Etx/Vo (Step 8), followed by dehydrogenation to CH2CH2O/Vo (Steps 9) and
then decomposition to C2H4 (Step 10); finally, H desorption as H2 (Step 11). No rate-limiting
step is assumed.
34
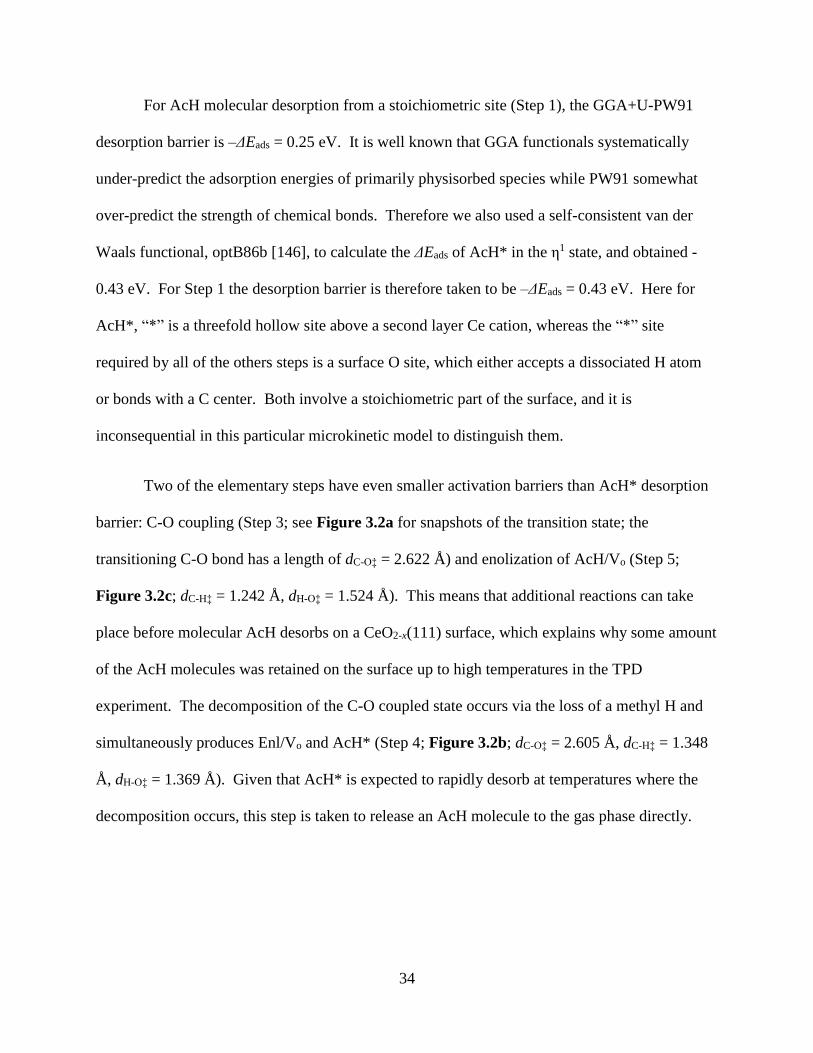
For AcH molecular desorption from a stoichiometric site (Step 1), the GGA+U-PW91
desorption barrier is –ΔEads = 0.25 eV. It is well known that GGA functionals systematically
under-predict the adsorption energies of primarily physisorbed species while PW91 somewhat
over-predict the strength of chemical bonds. Therefore we also used a self-consistent van der
Waals functional, optB86b [146], to calculate the ΔEads of AcH* in the η1 state, and obtained -
0.43 eV. For Step 1 the desorption barrier is therefore taken to be –ΔEads = 0.43 eV. Here for
AcH*, “*” is a threefold hollow site above a second layer Ce cation, whereas the “*” site
required by all of the others steps is a surface O site, which either accepts a dissociated H atom
or bonds with a C center. Both involve a stoichiometric part of the surface, and it is
inconsequential in this particular microkinetic model to distinguish them.
Two of the elementary steps have even smaller activation barriers than AcH* desorption
barrier: C-O coupling (Step 3; see Figure 3.2a for snapshots of the transition state; the
transitioning C-O bond has a length of dC-O‡ = 2.622 Å) and enolization of AcH/Vo (Step 5;
Figure 3.2c; dC-H‡ = 1.242 Å, dH-O‡ = 1.524 Å). This means that additional reactions can take
place before molecular AcH desorbs on a CeO2-x(111) surface, which explains why some amount
of the AcH molecules was retained on the surface up to high temperatures in the TPD
experiment. The decomposition of the C-O coupled state occurs via the loss of a methyl H and
simultaneously produces Enl/Vo and AcH* (Step 4; Figure 3.2b; dC-O‡ = 2.605 Å, dC-H‡ = 1.348
Å, dH-O‡ = 1.369 Å). Given that AcH* is expected to rapidly desorb at temperatures where the
decomposition occurs, this step is taken to release an AcH molecule to the gas phase directly.
35
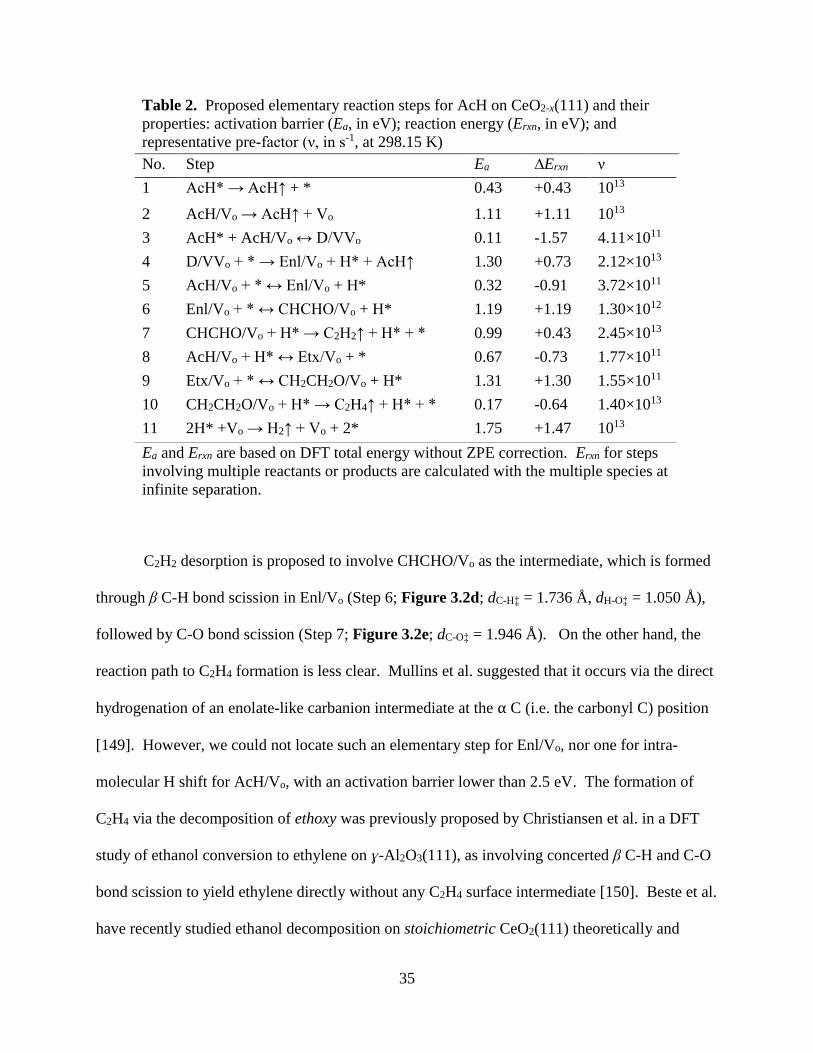
Table 2. Proposed elementary reaction steps for AcH on CeO2-x(111) and their
properties: activation barrier (Ea, in eV); reaction energy (Erxn, in eV); and
representative pre-factor (ν, in s-1, at 298.15 K)
No. Step Ea ∆Erxn ν
1 AcH* → AcH↑ + * 0.43 +0.43 1013
2 AcH/Vo → AcH↑ + Vo 1.11 +1.11 1013
3 AcH* + AcH/Vo ↔ D/VVo 0.11 -1.57 4.11×10¹¹
4 D/VVo + * → Enl/Vo + H* + AcH↑ 1.30 +0.73 2.12×10¹³
5 AcH/Vo + * ↔ Enl/Vo + H* 0.32 -0.91 3.72×10¹¹
6 Enl/Vo + * ↔ CHCHO/Vo + H* 1.19 +1.19 1.30×10¹²
7 CHCHO/Vo + H* → C2H2↑ + H* + * 0.99 +0.43 2.45×10¹³
8 AcH/Vo + H* ↔ Etx/Vo + * 0.67 -0.73 1.77×10¹¹
9 Etx/Vo + * ↔ CH2CH2O/Vo + H* 1.31 +1.30 1.55×10¹¹
10 CH2CH2O/Vo + H* → C2H4↑ + H* + * 0.17 -0.64 1.40×10¹³
11 2H* +Vo → H2↑ + Vo + 2* 1.75 +1.47 1013
Ea and Erxn are based on DFT total energy without ZPE correction. Erxn for steps
involving multiple reactants or products are calculated with the multiple species at
infinite separation.
C2H2 desorption is proposed to involve CHCHO/Vo as the intermediate, which is formed
through β C-H bond scission in Enl/Vo (Step 6; Figure 3.2d; dC-H‡ = 1.736 Å, dH-O‡ = 1.050 Å),
followed by C-O bond scission (Step 7; Figure 3.2e; dC-O‡ = 1.946 Å). On the other hand, the
reaction path to C2H4 formation is less clear. Mullins et al. suggested that it occurs via the direct
hydrogenation of an enolate-like carbanion intermediate at the ⍺ C (i.e. the carbonyl C) position
[149]. However, we could not locate such an elementary step for Enl/Vo, nor one for intra-
molecular H shift for AcH/Vo, with an activation barrier lower than 2.5 eV. The formation of
C2H4 via the decomposition of ethoxy was previously proposed by Christiansen et al. in a DFT
study of ethanol conversion to ethylene on ɣ-Al2O3(111), as involving concerted β C-H and C-O
bond scission to yield ethylene directly without any C2H4 surface intermediate [150]. Beste et al.
have recently studied ethanol decomposition on stoichiometric CeO2(111) theoretically and

36
reported that the activation barriers for ethoxy decomposition to C2H4 exceed 2 eV for both the
concerted and sequential mechanisms [151]. We find that interaction with an oxygen vacancy
significantly facilitates the sequential decomposition of ethoxy to C2H4 on CeO2-x(111). The
minimum energy reaction pathway to C2H4 desorption begins with the hydrogenation of AcH/Vo
to Etx/Vo, (Step 8; Figure 3.2f; dC-H‡ = 1.562 Å, dH-O‡ = 1.234 Å), followed by β C-H bond
scission to form CH2CH2O/Vo (Step 9; Figure 3.2g; dC-H‡ = 1.627 Å, dH-O‡ = 1.111 Å). C-O
bond scission then releases C2H4 (Step 10; Figure 3.2h; dC-O‡ = 1.761 Å). The reaction energy
profile for the formation of C2H2 and C2H4 with respect to Enl/Vo, which is experimentally found
to be the dominant surface species at high temperatures, is plotted in Figure 3.4. All of the C-H
bond scission steps in this mechanism involve a surface lattice oxygen (a Lewis base) as the H
acceptor. Incidentally, Etx/Vo and H* are calculated to be -2.3 eV with respect to gas-phase
ethanol, which makes the recombinative desorption of ethoxy and atomic H as ethanol from
CeO2-x(111) highly uncompetitive in vacuum. Indeed, no ethanol was detected in the TPD
experiment [73].
Several previous surface science studies have reported molecular H2 desorption on CeO2-
x(111) surfaces near 600 K, whereas this desorption channel is not operative on the
stoichiometric CeO2(111) surface [72, 75, 152]. Evidently some type of reduced ceria site is
active for catalyzing the recombination of atomic H, but the nature of this active site remains
elusive. Fernández-Torre et al. have reported in a DFT+U study that H2 can in fact dissociate on
stoichiometric CeO2(111) with a moderate activation barrier (Ea = 1.0 eV at U=4.5 eV), but their
results indicate that the reverse barrier for atomic H recombination is in excess of 3 eV [153].
Similarly high barriers for atomic H recombination were reported by other groups [148, 154].
Wu et al. have recently studied H interaction with CeO2-x(111) surfaces and reported that the
37
activation barrier for H recombination decreases with an increasing degree of surface reduction,
but it remains more than 2 eV even on a large cluster of subsurface O vacancies (U=5 eV) [148],
which would be inconsistent with H2 desorption around 630 K. Moreover, the broad H2 TPD
peak shown in Figure 1.8a suggests that there may be a distribution of sites that catalyze H2
formation and desorption. To ascertain the exact nature of the H2 formation site is outside the
scope of this study. Herein we postulate that the rate-limiting step in H recombinative desorption
is the diffusion of atomic H across surface oxygen sites that is necessary for reaching the yet-to-
be-determined active site for the H-H bond formation. The minimum diffusion barrier of atomic
H on CeO2(111) is reported by Fernández-Torre et al. to be 1.8 eV (U=4.5 eV). The diffusion
mechanism involves the H atom hopping alternatingly between surface and subsurface O sites.
We find the corresponding value for the H hopping barrier to be 1.75 eV at U=2 eV. This value,
together with a typical diffusion prefactor of 1013, is used for H2 recombinative desorption (Step
11).
These DFT-calculated energetics with clear microscopic meaning were fed into our
mean-field microkinetic model, which was able to generate a simulated TPD spectra and a
corresponding surface coverage evolution of key surface species as a function of temperature, as
shown in Figure 3.3. Above 200 K, two major AcH desorption waves are predicted: One spans
from ~330 K to 420 K, with Tp = 391 K, and the other is broader from ~520 K to 670 K with Tp
= 602 K, which matches the 620 K shoulder in the experimental TPD (Figure 1.8a). The 391 K
wave originates from the decomposition of D/VVo (Step 4), whereas the 602 K wave originates
from the recombination of Enl/Vo and H* to form AcH/Vo (reverse of Step 5), followed by AcH
desorption from Vo (Step 2). C2H4 desorbs from ~490 K to 670 K, with Tp = 592 K, whereas
38
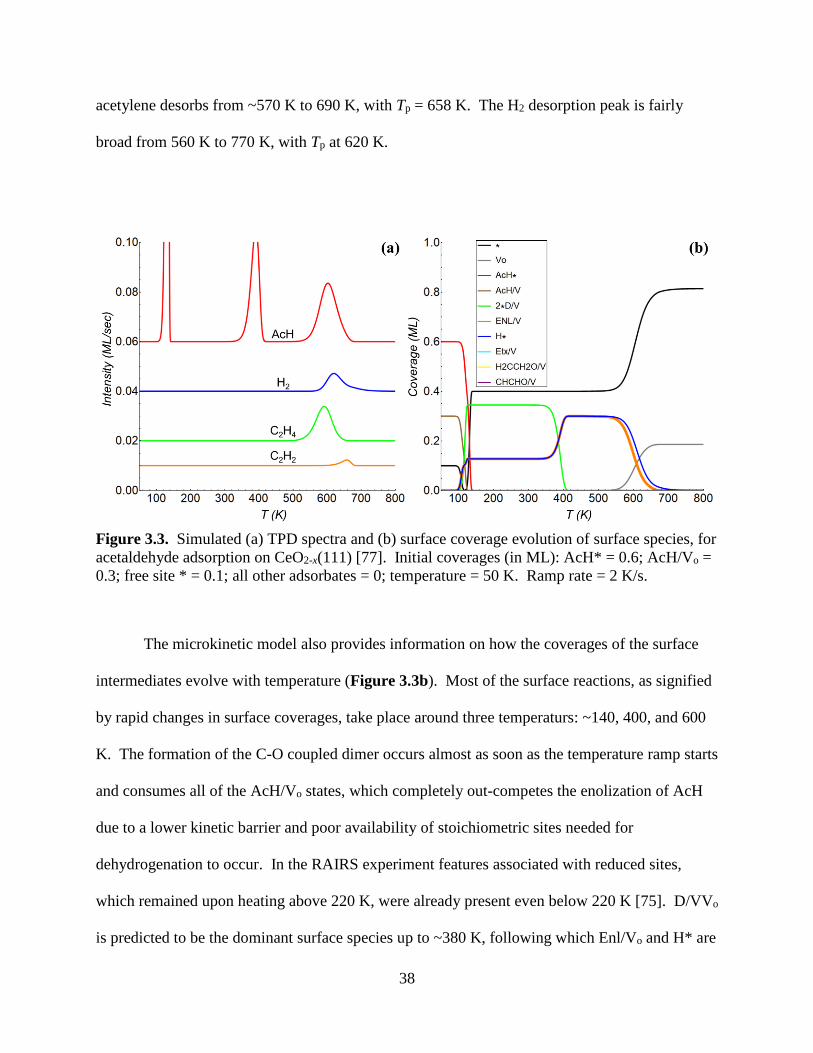
acetylene desorbs from ~570 K to 690 K, with Tp = 658 K. The H2 desorption peak is fairly
broad from 560 K to 770 K, with Tp at 620 K.
Figure 3.3. Simulated (a) TPD spectra and (b) surface coverage evolution of surface species, for
acetaldehyde adsorption on CeO2-x(111) [77]. Initial coverages (in ML): AcH* = 0.6; AcH/Vo =
0.3; free site * = 0.1; all other adsorbates = 0; temperature = 50 K. Ramp rate = 2 K/s.
The microkinetic model also provides information on how the coverages of the surface
intermediates evolve with temperature (Figure 3.3b). Most of the surface reactions, as signified
by rapid changes in surface coverages, take place around three temperaturs: ~140, 400, and 600
K. The formation of the C-O coupled dimer occurs almost as soon as the temperature ramp starts
and consumes all of the AcH/Vo states, which completely out-competes the enolization of AcH
due to a lower kinetic barrier and poor availability of stoichiometric sites needed for
dehydrogenation to occur. In the RAIRS experiment features associated with reduced sites,
which remained upon heating above 220 K, were already present even below 220 K [75]. D/VVo
is predicted to be the dominant surface species up to ~380 K, following which Enl/Vo and H* are
39
the dominant surface species all the way up to ~650 K, both of which are also consistent with the
RAIRS study of Calaza et al. [75]. There is ~0.4 ML or more of empty site above ~120 K, so
when H gains mobility (~520 K and above) there is space for different adsorbates to aggregate or
separate according to their thermodynamic preference.
Neither Etx/Vo, CH2CH2O/Vo, nor CHCHO/Vo is predicted to have any appreciable
coverage in the range of temperature simulated, and indeed none of these species is identified on
the CeO2-x(111) surface in the previous RAIRS study [75]. Yet significantly, the product
differentiation (C2H4 vs. C2H2) entirely depends on the formation of these minority species.
Finally, the coverage of oxygen vacancies (Vo) increases from zero when Enl/Vo begins to
desorb as AcH and releases oxygen vacancies at ~560 K. However, θVo does not recover its
initial value of 0.3 ML because the reductive desorption as C2H4 and C2H2 annihilates some
amount of the vacancies. The final values of θ* and θVo are 0.81 and 0.19 ML, respectively. In
conclusion, the key spectroscopic outcomes of our microkinetic model are in close agreement
with the observed desorption activities for surface species, which supports the validity of the
proposed mechanism on the well-defined ceria surface.
Clearly, oxygen vacancies (Vo) play a critical role in the reaction mechanism. They
facilitate the enolization of AcH, and C-H bond scission/formation and C-O scission in AcH and
its derivatives. Fundamentally, all these functions can be traced back to the fact that the acidic
cations (Ce4+) are buried beneath oxygen anions on the stoichiometric CeO2(111) surface. Vo
open up access to Ce4+ and reveal the amphoteric nature of this surface, and allow the basic O
atom in the carbonyl group of AcH to be stabilized. The C atom in the carbonyl group (the α C)
would thereby be freed to form a bond with another atom, such as the β C, an external H atom, or
a nucleophilic species such as the carbonyl O of another AcH molecule or the CH2 group of an
40
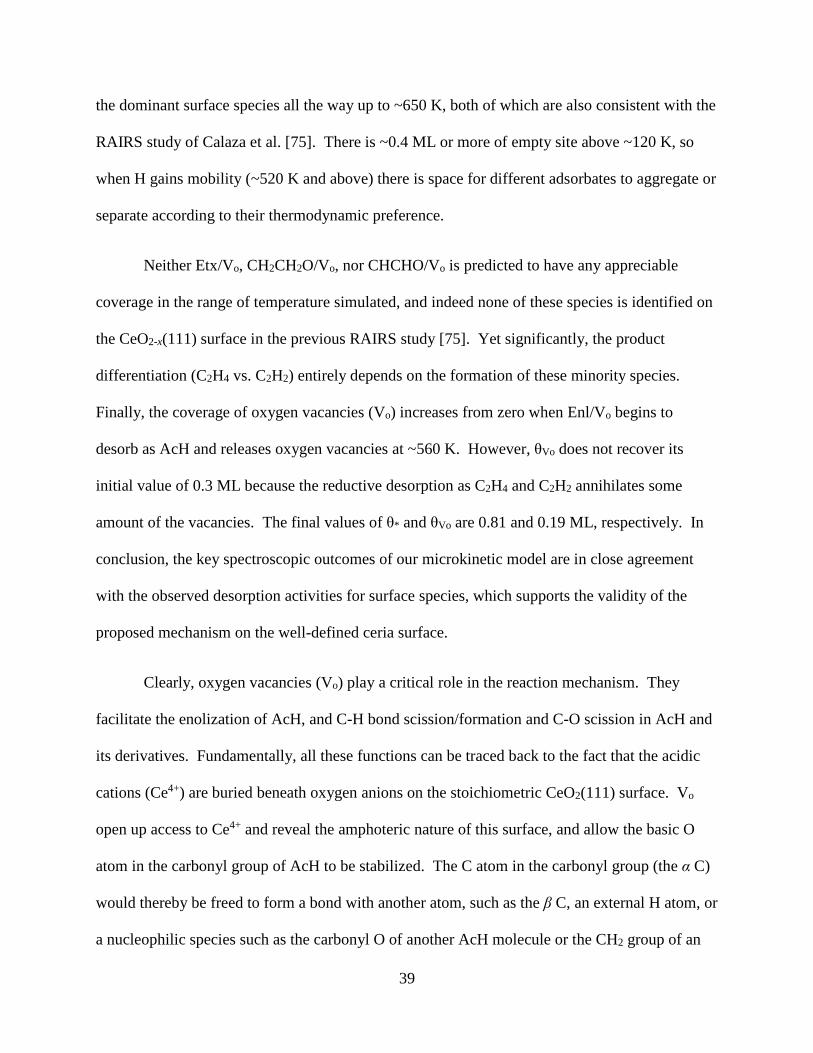
enolate because the α C is electrophilic, leading to C-O or C-C coupling. The activation of the α
C and the availability of lattice oxygen as a Lewis base and H acceptor facilitate the enolization
of AcH/Vo, and also β C-H scission in Etx/Vo and Enl/Vo. Finally, the conversion of the
carbonyl bond from a double bond to a single bond facilitates the eventual deoxygenation of the
molecule, ending in the re-oxidation of the vacancy.
Figure 3.4. Schematic plot for hydrogen transfer processes and corresponding reaction energy
profile in the high temperature regime for acetaldehyde adsorption on CeO2-x(111).
The occurrence of Etx/Vo indicates that intermolecular H transfer occurs between AcH
and/or its derivatives on CeO2-x(111), as shown in Figure 3.4. Based on the proposed
mechanism, the TPD of AcH adsorbed on CeO2-x(111) suggests that a window of temperature
exists for transfer hydrogenation to occur on CeO2-x, which is bound on the upper end by H2
recombinative desorption (Tp = 620 K). Note that in AcH, β C-H scission occurs at a primary C.
β C-H scission in a carbonyl compound where the β position is a secondary or tertiary C should

41
require lower temperature for activation, thereby widening the temperature window for transfer
hydrogenation, a potential route to biomass upgrading without needing molecular hydrogen
[155], on this particular surface.
Till now, we were able to explain the formation of various C2 species in the typical TPD
experiment [73]. However, in contrast to the flow reactor experiments on ceria nano-shapes
[78], C4 species were not detected under UHV condition, even though enolate species (Enl/Vo) is
identified to be the dominant surface species from ca. 400 K to 600 K, and its calculated
vibrational signatures closely match RAIRS evidence in the same temperature range [75].
Enolates are well known to be the key intermediates in aldol condensation reactions, so we have
devised additional experiments to attempt to realize the formation of CrA in UHV experiments.
In order to take advantages of the wide temperature window of enolate on the surface, a custom
“double-ramp” procedure was used. The idea behind it was to stop the experiment with the
enolate on the surface and then cool down to add more AcH to allow them to react. The
procedure involved a program of cooling-dosing-ramping, breaking and stopping the ramp, then
cooling-dosing-ramping again. The steps performed are as follows: 1) The surface was cooled
below the monolayer adsorption temperature of AcH (160-175K) and dosed with AcH; 2) the
surface temperature was ramped at 2 K/s (first ramp); 3) at a set break temperature, TB, the
heating ramp was stopped (there was no intentional dwell time at TB, and the direction of change
of the temperature reversed toward cooling on the order of seconds once the heating was
stopped); 4) the surface was once again cooled below the monolayer adsorption temperature for
AcH and dosed with AcH; and finally 5) the surface temperature was ramped at 2 K/s up to 900
K (second ramp).

42
In this section four experimental TPD profiles will be presented (Figure 3.5). In all
cases, the vertical axis indicates molecular gas phase concentration detected by mass
spectrometry during TPD. Figure 3.5a presents the TPD profile for AcH from oxidized
CeO2(111) surface, which has a low concentration of vacancies. Consistent with previous results
[73, 75], mostly only molecular desorption of un-reacted AcH is observed at slightly above 200
K. Figure 3.5b shows the TPD profile for AcH on a partially reduced surface (~60% Ce3+).
Figure 3.5. Gas phase concentrations of molecules detected during typical TPD of AcH adsorbed
on (a) oxidized CeO2(111) with few vacancies; (b) partially reduced CeO2-x(111) with ~60% Ce3+.
TPD of AcH on CeO2-x(111) with ~60% Ce3+ for the second temperature ramp during the double-
ramp procedure described in the text where the first temperature ramp was stopped at either (c)
410 K or (d) 530 K.
Here we again see results consistent with prior studies that there are now three AcH desorption
waves [73, 75, 77]. Signals associated with ethylene and acetylene were observed as minor
products at temperatures similar to those reported in our previous study [73]. Figure 3.5c and
3.5d show the TPD results from the second ramp with the TB = 410 K and TB = 530 K,
respectively. TB = 530 K produced a clearly distinguishable CrA peak (on the order of 5% of the
carbon balance), while TB = 410 K did not. In all experiments, there was little to no crotyl
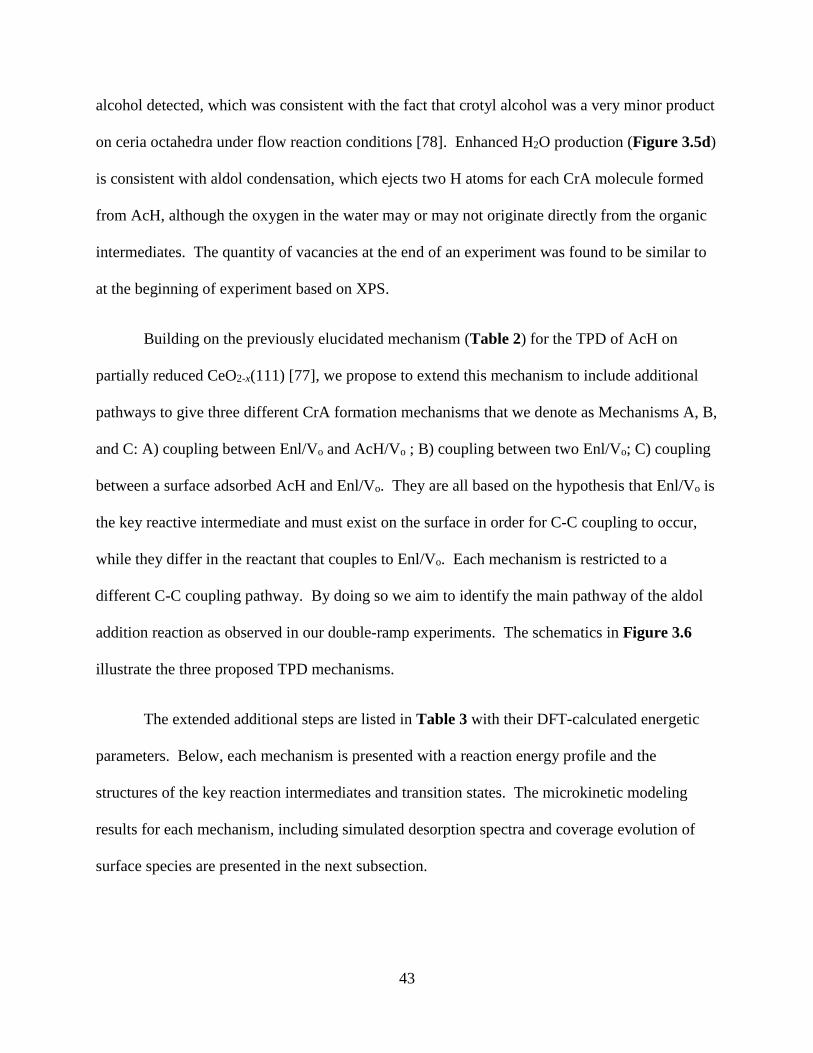
43
alcohol detected, which was consistent with the fact that crotyl alcohol was a very minor product
on ceria octahedra under flow reaction conditions [78]. Enhanced H2O production (Figure 3.5d)
is consistent with aldol condensation, which ejects two H atoms for each CrA molecule formed
from AcH, although the oxygen in the water may or may not originate directly from the organic
intermediates. The quantity of vacancies at the end of an experiment was found to be similar to
at the beginning of experiment based on XPS.
Building on the previously elucidated mechanism (Table 2) for the TPD of AcH on
partially reduced CeO2-x(111) [77], we propose to extend this mechanism to include additional
pathways to give three different CrA formation mechanisms that we denote as Mechanisms A, B,
and C: A) coupling between Enl/Vo and AcH/Vo ; B) coupling between two Enl/Vo; C) coupling
between a surface adsorbed AcH and Enl/Vo. They are all based on the hypothesis that Enl/Vo is
the key reactive intermediate and must exist on the surface in order for C-C coupling to occur,
while they differ in the reactant that couples to Enl/Vo. Each mechanism is restricted to a
different C-C coupling pathway. By doing so we aim to identify the main pathway of the aldol
addition reaction as observed in our double-ramp experiments. The schematics in Figure 3.6
illustrate the three proposed TPD mechanisms.
The extended additional steps are listed in Table 3 with their DFT-calculated energetic
parameters. Below, each mechanism is presented with a reaction energy profile and the
structures of the key reaction intermediates and transition states. The microkinetic modeling
results for each mechanism, including simulated desorption spectra and coverage evolution of
surface species are presented in the next subsection.
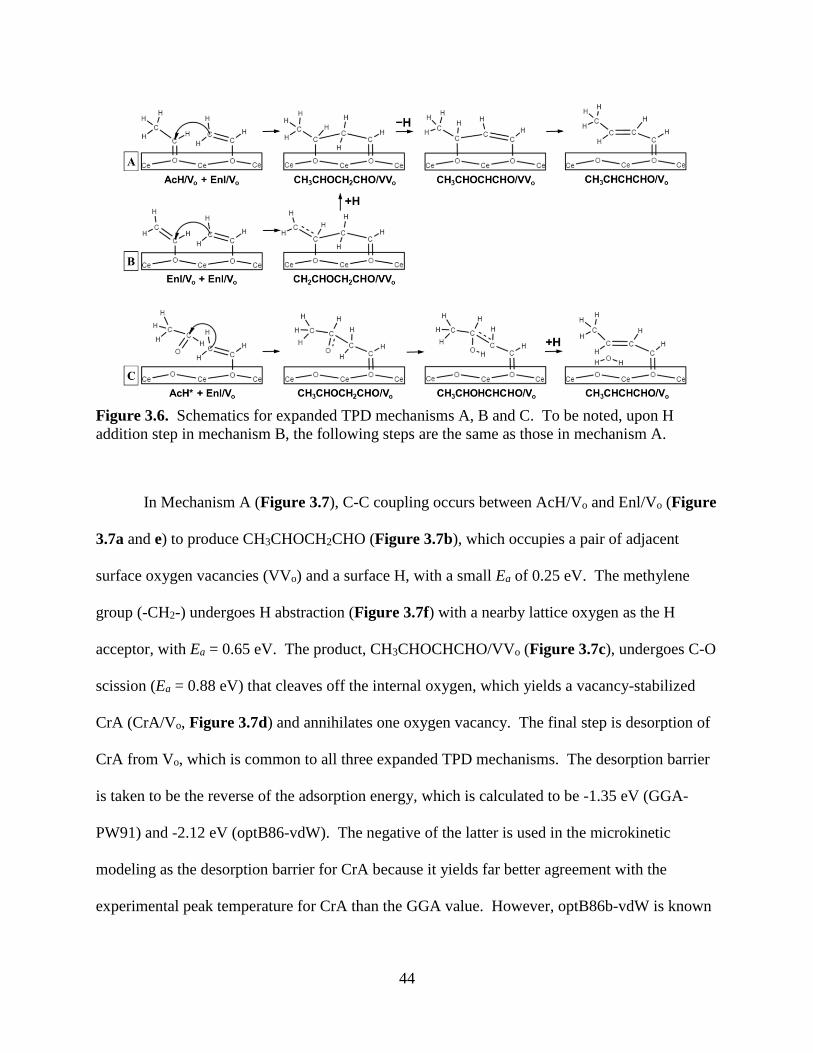
44
Figure 3.6. Schematics for expanded TPD mechanisms A, B and C. To be noted, upon H
addition step in mechanism B, the following steps are the same as those in mechanism A.
In Mechanism A (Figure 3.7), C-C coupling occurs between AcH/Vo and Enl/Vo (Figure
3.7a and e) to produce CH3CHOCH2CHO (Figure 3.7b), which occupies a pair of adjacent
surface oxygen vacancies (VVo) and a surface H, with a small Ea of 0.25 eV. The methylene
group (-CH2-) undergoes H abstraction (Figure 3.7f) with a nearby lattice oxygen as the H
acceptor, with Ea = 0.65 eV. The product, CH3CHOCHCHO/VVo (Figure 3.7c), undergoes C-O
scission (Ea = 0.88 eV) that cleaves off the internal oxygen, which yields a vacancy-stabilized
CrA (CrA/Vo, Figure 3.7d) and annihilates one oxygen vacancy. The final step is desorption of
CrA from Vo, which is common to all three expanded TPD mechanisms. The desorption barrier
is taken to be the reverse of the adsorption energy, which is calculated to be -1.35 eV (GGA-
PW91) and -2.12 eV (optB86-vdW). The negative of the latter is used in the microkinetic
modeling as the desorption barrier for CrA because it yields far better agreement with the
experimental peak temperature for CrA than the GGA value. However, optB86b-vdW is known

45
to over-bind molecules somewhat in many cases and there is so far no database of
experimentally measured heats of chemisorption on oxides to gauge how accurate this functional
is for adsorption on ceria. The strong interaction of the carbonyl intermediates with Vo on
CeO2(111) is a reason why alcohol species such as crotyl alcohol and ethanol do not appear as
major products in the current and prior experiments [78], since the hydrogenation of the
vacancy-stabilized C=O group is likely a difficult step.
Table 3. Extended steps in mechanisms A, B, and C for AcH TPD on CeO2-x(111) with DFT-
calculated activation energy (Ea, in eV), reaction Energy (∆Erxn, in eV), and representative pre-factor
(ν, in s-1, at 298.15 K)# for each proposed elementary step
Mec
h.
No. Step Ea ∆Erxn ν
A 12 Enl/Vo+AcH/Vo ↔ CH3CHOCH2CHO/VVo
/VVo
0.25 -0.53 1.47×10¹¹
13 CH3CHOCH2CHO/VVo+*↔CH3CHOCHCHO/VVo
+ H*
0.65 -0.75 3.58×10¹²
14 CH3CHOCHCHO/VVo ↔ CrA/Vo+* 0.88 +0.38 2.69×10¹³
B 12 Enl/Vo+Enl/Vo ↔ CH2CHOCH2CHO/VVo 1.87 +1.80 2.92×10¹¹
13 CH2CHOCH2CHO/VVo+H*↔CH3CHOCH2CHO/V
Vo+*
0.00 -1.41 6.21×10¹²
14-15 same as A13-A14
C 12 Enl/Vo+AcH* ↔ CH3CHOCH2CHO/Vo 0.22 +0.13 8.07×10⁹
13 CH3CHOCH2CHO/Vo ↔ CH3CHOHCHCHO/Vo 1.03 -0.56 7.08×10¹¹
14 CH3CHOHCHCHO/Vo ↔ CrA/Vo+OH* 1.20 +1.10 1.33×10¹⁴
15 CrA/Vo+OH*+H* ↔ CrA/Vo+H2O* 0.10 -0.07 1.05×10¹²
16 H2O* → H2O↑ 0.52 +0.52 1013
Des. CrA/Vo → CrA↑+Vo 2.12 +2.12 1013
Ea and ∆Erxn reported are based on DFT total energies without ZPE corrections. CrA desorption is
common to all three mechanisms as the final step. # Calculated in the harmonic approximation, except for desorption steps where a value of 1013 is
used.

46
In Mechanism B (Figure 3.8), a pair of adjacent vacancy-stabilized enolate molecules
(Enl/Vo) undergo self-coupling by overcoming a substantial Ea of 1.87 eV, forming
CH2CHOCH2CHO/VVo (Figure 3.8b). Afterwards a surface H atom is transferred with
practically zero barrier from a lattice O site to the terminal methylene group of
CH2CHOCH2CHO/VVo, forming CH3CHOCH2CHO/VVo (Figure 3.8c). The subsequent steps
are identical to Mechanism A following the formation of CH3CHOCH2CHO/VVo, although the
prior steps in Mechanism A, i.e. C-C coupling between Enl/Vo and AcH/Vo, are not included
here.
In Mechanism C (Figure 3.9), the C-C coupling step occurs between surface-adsorbed
AcH* and vacancy-stabilized Enl/Vo. Thus this mechanism requires only one surface oxygen
vacancy rather than a vacancy dimer as in Mechanisms A and B. As shown in Table 3, the C-C
coupling step only needs to overcome an activation energy of 0.22 eV, with a corresponding
∆Erxn of +0.13 eV. The product of the C-C coupling step, CH3CHOCH2CHO/Vo (Figure 3.9b),
is less stable than the C-O coupled dimer and prone to decomposition. The most facile pathway
to CrA formation involves intra-molecular H transfer (from the methylene group to the internal
carbonyl O) with Ea = 1.03 eV to yield a vinyl alcohol species, CH3CHOHCHCHO/Vo (Figure
3.9c), and the OH group then dissociating with Ea = 1.20 eV. OH can scavenge a nearby surface
H to form water, which readily desorbs from the surface (∆Eads = -0.52 eV).
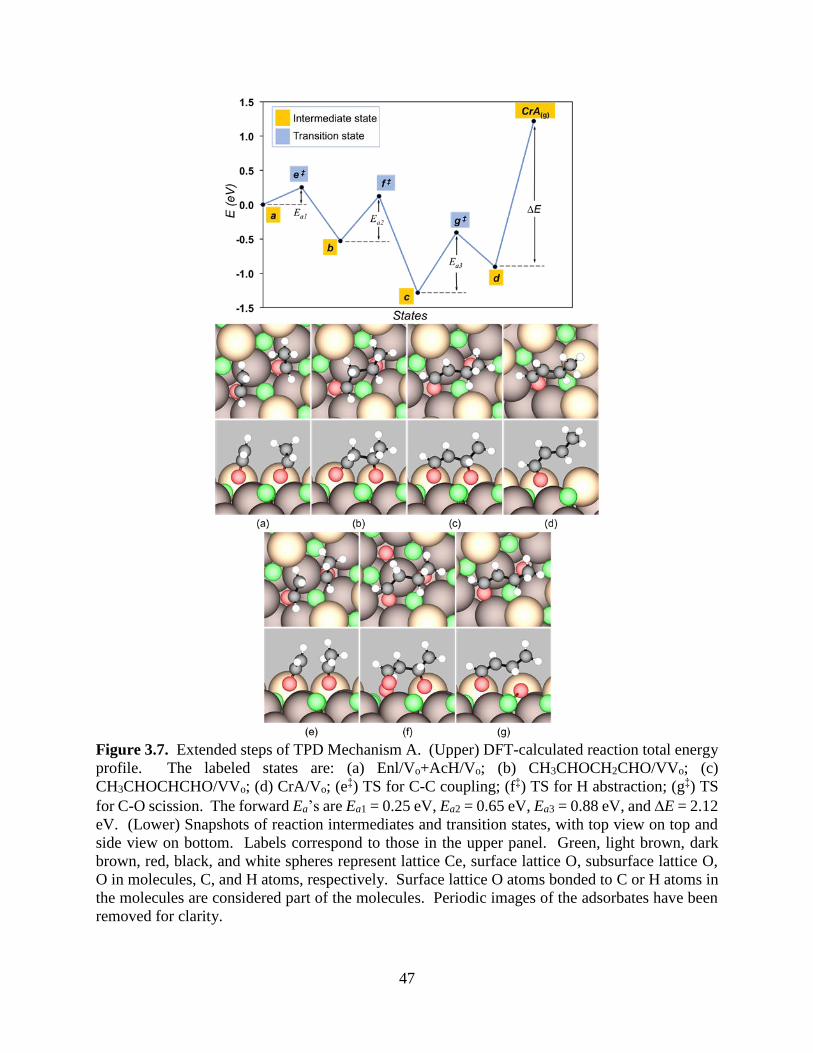
47
Figure 3.7. Extended steps of TPD Mechanism A. (Upper) DFT-calculated reaction total energy
profile. The labeled states are: (a) Enl/Vo+AcH/Vo; (b) CH3CHOCH2CHO/VVo; (c)
CH3CHOCHCHO/VVo; (d) CrA/Vo; (e‡) TS for C-C coupling; (f‡) TS for H abstraction; (g‡) TS
for C-O scission. The forward Ea’s are Ea1 = 0.25 eV, Ea2 = 0.65 eV, Ea3 = 0.88 eV, and E = 2.12
eV. (Lower) Snapshots of reaction intermediates and transition states, with top view on top and
side view on bottom. Labels correspond to those in the upper panel. Green, light brown, dark
brown, red, black, and white spheres represent lattice Ce, surface lattice O, subsurface lattice O,
O in molecules, C, and H atoms, respectively. Surface lattice O atoms bonded to C or H atoms in
the molecules are considered part of the molecules. Periodic images of the adsorbates have been
removed for clarity.
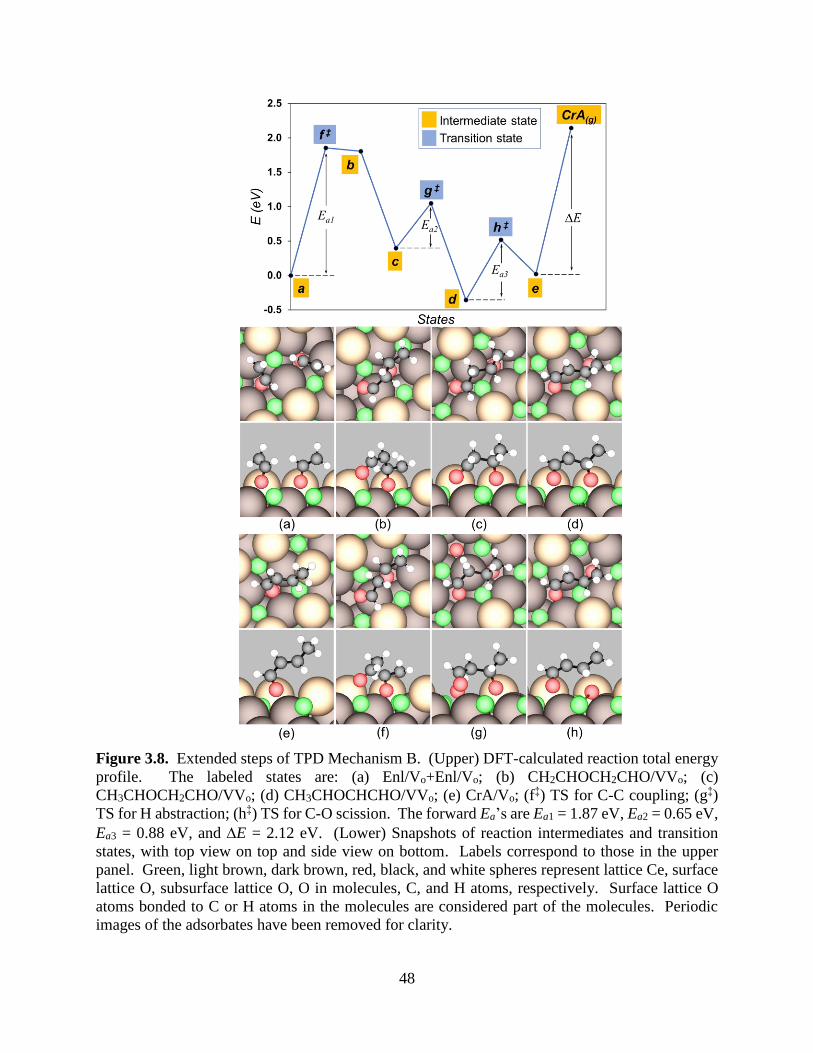
48
Figure 3.8. Extended steps of TPD Mechanism B. (Upper) DFT-calculated reaction total energy
profile. The labeled states are: (a) Enl/Vo+Enl/Vo; (b) CH2CHOCH2CHO/VVo; (c)
CH3CHOCH2CHO/VVo; (d) CH3CHOCHCHO/VVo; (e) CrA/Vo; (f‡) TS for C-C coupling; (g‡)
TS for H abstraction; (h‡) TS for C-O scission. The forward Ea’s are Ea1 = 1.87 eV, Ea2 = 0.65 eV,
Ea3 = 0.88 eV, and E = 2.12 eV. (Lower) Snapshots of reaction intermediates and transition
states, with top view on top and side view on bottom. Labels correspond to those in the upper
panel. Green, light brown, dark brown, red, black, and white spheres represent lattice Ce, surface
lattice O, subsurface lattice O, O in molecules, C, and H atoms, respectively. Surface lattice O
atoms bonded to C or H atoms in the molecules are considered part of the molecules. Periodic
images of the adsorbates have been removed for clarity.

49
Figure 3.9. Extended steps of TPD Mechanism C. (Upper) DFT-calculated reaction total energy
profile. The labeled states are: (a) Enl/Vo+AcH*; (b) CH3CHOCH2CHO/Vo; (c)
CH3CHOHCHCHO/Vo; (d) CrA/Vo+OH*; (e) CrA/Vo, H2O*; (f) CrA/Vo, H2Ogas; (g‡) TS for C-
C coupling; (h‡) TS for intra-molecular H transfer; (i‡) TS for OH detaching; (j‡) TS for water
formation. The forward Ea’s are Ea1 = 0.22 eV, Ea2 = 1.03 eV, Ea3 = 1.20 eV, and E = 2.12 eV.
(Lower) Snapshots of reaction intermediates and transition states, with top view on top and side
view on bottom. Labels correspond to those in the upper panel. Green, light brown, dark brown,
red, black, and white spheres represent lattice Ce, surface lattice O, subsurface lattice O, O in
molecules, C, and H atoms, respectively. Surface lattice O atoms bonded to C or H atoms in the
molecules are considered part of the molecules. Periodic images of the adsorbates have been
removed for clarity.
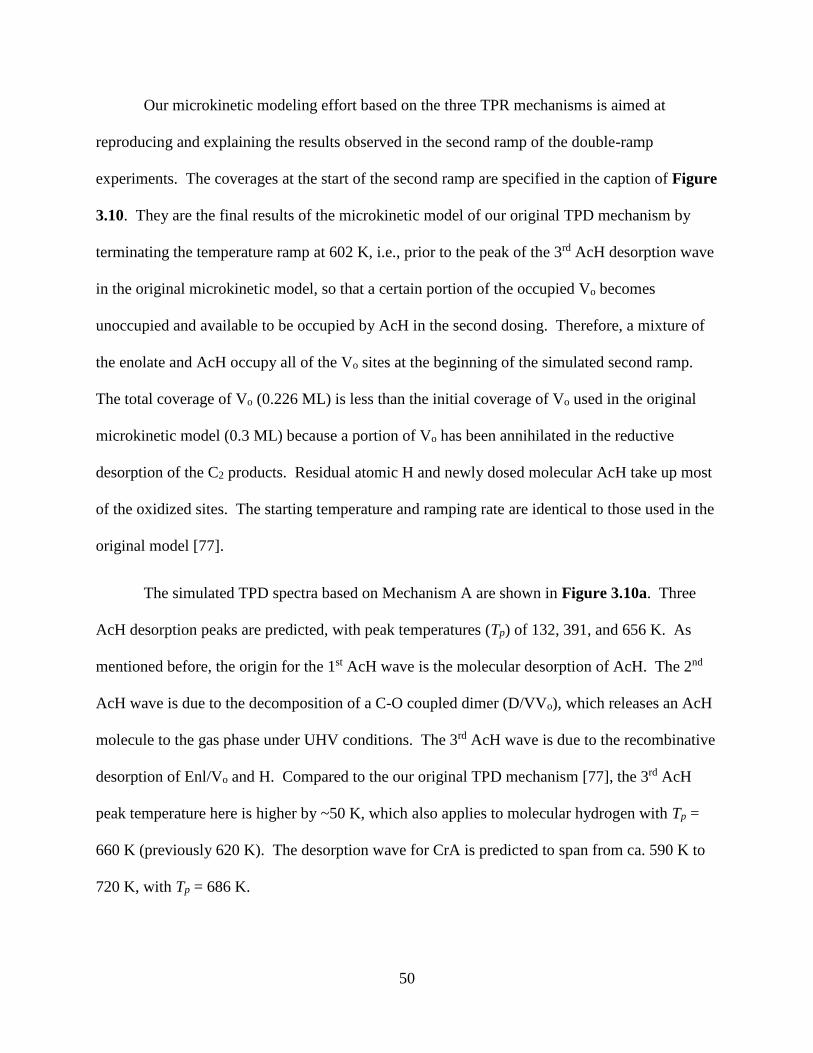
50
Our microkinetic modeling effort based on the three TPR mechanisms is aimed at
reproducing and explaining the results observed in the second ramp of the double-ramp
experiments. The coverages at the start of the second ramp are specified in the caption of Figure
3.10. They are the final results of the microkinetic model of our original TPD mechanism by
terminating the temperature ramp at 602 K, i.e., prior to the peak of the 3rd AcH desorption wave
in the original microkinetic model, so that a certain portion of the occupied Vo becomes
unoccupied and available to be occupied by AcH in the second dosing. Therefore, a mixture of
the enolate and AcH occupy all of the Vo sites at the beginning of the simulated second ramp.
The total coverage of Vo (0.226 ML) is less than the initial coverage of Vo used in the original
microkinetic model (0.3 ML) because a portion of Vo has been annihilated in the reductive
desorption of the C2 products. Residual atomic H and newly dosed molecular AcH take up most
of the oxidized sites. The starting temperature and ramping rate are identical to those used in the
original model [77].
The simulated TPD spectra based on Mechanism A are shown in Figure 3.10a. Three
AcH desorption peaks are predicted, with peak temperatures (Tp) of 132, 391, and 656 K. As
mentioned before, the origin for the 1st AcH wave is the molecular desorption of AcH. The 2nd
AcH wave is due to the decomposition of a C-O coupled dimer (D/VVo), which releases an AcH
molecule to the gas phase under UHV conditions. The 3rd AcH wave is due to the recombinative
desorption of Enl/Vo and H. Compared to the our original TPD mechanism [77], the 3rd AcH
peak temperature here is higher by ~50 K, which also applies to molecular hydrogen with Tp =
660 K (previously 620 K). The desorption wave for CrA is predicted to span from ca. 590 K to
720 K, with Tp = 686 K.
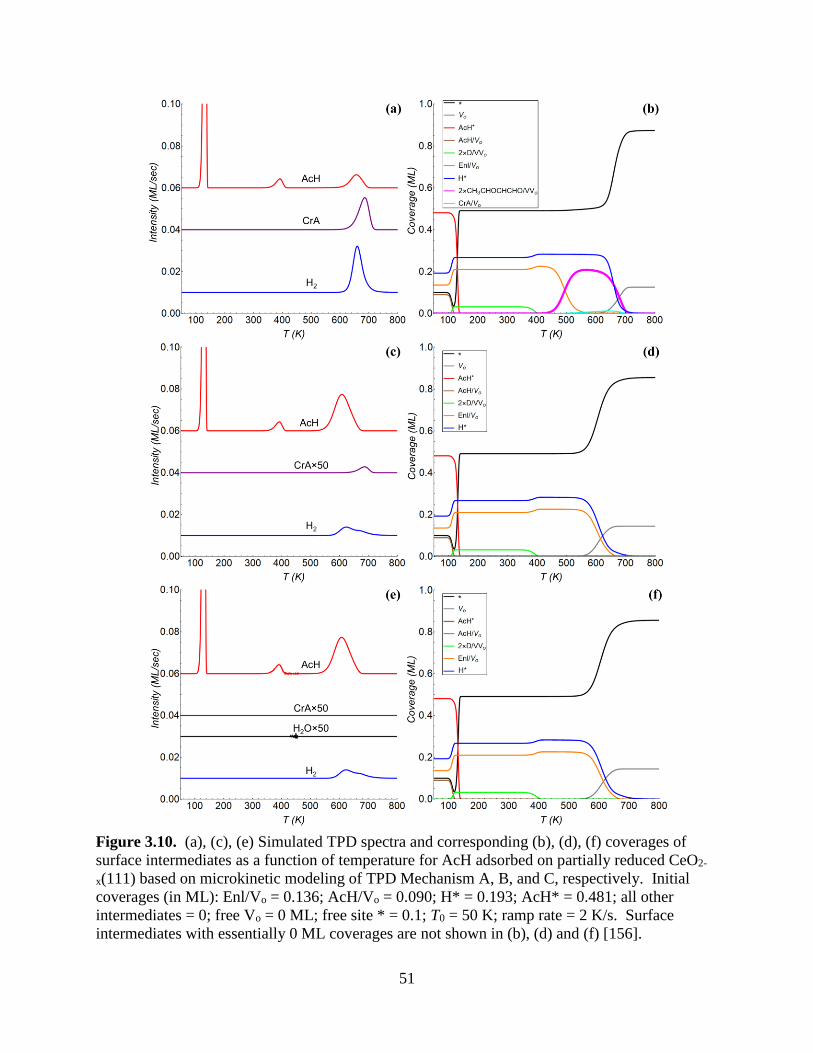
51
Figure 3.10. (a), (c), (e) Simulated TPD spectra and corresponding (b), (d), (f) coverages of
surface intermediates as a function of temperature for AcH adsorbed on partially reduced CeO2-
x(111) based on microkinetic modeling of TPD Mechanism A, B, and C, respectively. Initial
coverages (in ML): Enl/Vo = 0.136; AcH/Vo = 0.090; H* = 0.193; AcH* = 0.481; all other
intermediates = 0; free Vo = 0 ML; free site * = 0.1; T0 = 50 K; ramp rate = 2 K/s. Surface
intermediates with essentially 0 ML coverages are not shown in (b), (d) and (f) [156].
52
Microkinetic modeling also predicts how the coverages of surface species evolve as a
function of temperature. For Mechanism A (Figure 3.10b), it can be seen that all the additional
AcH added for the second temperature ramp has disappeared by ca. 130 K, due to either
molecular desorption or enolization (with a concomitant increase in the coverage of Enl/Vo).
Between ca. 130 K and 500 K the enolate is the dominant C-containing surface species. Above
ca. 450 K, the C-C coupling pathway is actuated to generate CH3CHOCHCHO/VVo, which
becomes a dominant surface species between ca. 500 K and 700 K. This happens because the
enolate begins to recombine with H to form AcH/Vo, which then rapidly undergoes C-C coupling
with other Enl/Vo but does not build up any appreciable coverage. A small coverage of CrA/Vo
also builds up between ca. 550 K and 700 K. All other organic intermediates are predicted to
have negligible coverages. At the end of the temperature ramp ca. 0.1 ML of oxygen vacancy
(out of the initial 0.226 ML) is annihilated on account mainly of CrA formation.
The results of microkinetic modeling for Mechanism B are markedly different from those
of Mechanism A. As shown in Figure 3.10c, the 3rd AcH wave has a Tp = 608 K and a greater
peak area than the 2nd AcH peak. CrA desorption occurs with a nearly identical Tp to Mechanism
A, but it is significantly diminished in intensity. These results are similar to the microkinetic
modeling results of our original AcH TPD mechanism [77] because the C-C coupling pathway is
essentially not operative in Mechanism B due to the high activation energy for the enolate self-
coupling step. This is confirmed by the evolution of the coverages of surface species, which
indicates that none of the C4 intermediates have any appreciable coverage over the entire
temperature range in Mechanism B (and therefore not shown in Figure 3.10d). Combining
Mechanisms A and B yields results essentially identical to Mechanism A alone.
53
No CrA desorption is predicted in the simulated TPD based on Mechanism C (Figure
3.10e). The reason why Mechanism C fails to produce CrA is that the C-C coupling product,
CH3CHOCH2CHO/Vo, readily breaks down and back into Enl/Vo and AcH. The other
desorption features are mostly identical to those based on Mechanism B.
Overall, therefore, Mechanism A yields the best agreement with the double-ramp
experiments on CeO2-x(111) with TB = 530 K. The essential features of this mechanism are: 1)
The C-C coupling step occurs in a pair of surface oxygen vacancies. The site requirement is
further discussed below. 2) CrA desorption, and not C-C coupling, is rate-limiting. We have
estimated that, if CrA desorption were not rate-limiting, the Tp of CrA desorption would be 493
K.
Note that ethylene and acetylene channels remain part of the expanded mechanisms,
although their production, together with high-temperature AcH formation, is reduced compared
to the original TPD model [77]. This is consistent with the outcome of the double-ramp
experiments, which found ethylene and acetylene to be minor products (especially the latter).
We attribute the difference to the existence of the CrA channel, which removes a portion of the
enolates from the uni-molecular pathways that produce AcH, ethylene, and acetylene. Of these,
only the desorption of the organics as C2H2 permits H to desorb as H2, so the diminishment of
acetylene formation means less contribution to H2 evolution from the uni-molecular pathways.
On the other hand, the formation of each CrA molecule from two AcH molecules discharges a
net total of two H atoms, so an H2 peak similar in size to the CrA peak should be expected and is
indeed predicted by our microkinetic model for Mechanism A. Since no H2O channel is
provided for in Mechanism A whereas on the actual ceria surface some of the atomic H is almost
certainly diverted from desorption as H2 to reduction of the surface (e.g. at loosely bound lattice
54
O sites), the predicted H2 desorption wave would be more intense in relation to CrA desorption
than observed in the experiment.
We attribute the face that no CrA was detected in the single-ramp experiments [75] to the
fact that, as alluded to before, the positioning of oxygen vacancies is crucial to the bimolecular
coupling step. A key requirement implicit in Mechanisms A and B (but not C) is that Enl/Vo and
AcH/Vo or another Enl/Vo must be adjacent to each other in order for aldol addition and CrA
formation to occur effectively. If Enl/Vo is instead surrounded by oxygen sites, C-C coupling
can still occur (e.g. via Mechanism C), but it would not lead to CrA formation under UHV
conditions due to the decomposition of intermediates.
The nature of oxygen vacancies on CeO2(111) has long been debated in the literature.
Early work based on scanning tunneling microscopy (STM) and atomic force microscopy (AFM)
for high-temperature annealed CeO2(111) single crystal surfaces reported a predominance of
surface and subsurface oxygen vacancy clusters, while point surface vacancies appeared to be a
minority species [129, 157]. More recently it was demonstrated theoretically that previous STM
studies were not capable of distinguishing oxygen vacancies from fluorine impurities, which are
typically present at appreciable concentrations in naturally occurring CeO2, and that the vacancy
clusters seen in STM may be clusters of fluorine atoms [130]. DFT studies based on GGA [158,
159], GGA+U (U=4.5~5 eV) [160-162], and HSE06 hybrid functional [160] all reported that an
isolated oxygen vacancy to be a few tenths of an eV more stable in subsurface than in surface.
GGA+U also predicted point vacancies to be more stable than vacancy clusters, whether on
surface or in subsurface [161, 163]. Forming a surface vacancy dimer from two surface point
vacancies is calculated to be endothermic by ~0.3 eV [161, 163].

55
Based on the latest findings, we surmise that the as-synthesized CeO2-x(111) films used in
our experiments initially (Figure 3.5b) contained primarily isolated vacancies and few vacancy
clusters since they are disfavored by thermodynamics. When AcH was dosed onto such a
surface, all point vacancies should be occupied by AcH and later the enolate molecules, which
immobilized the vacancies. Mechanisms A and B would be largely inoperative on such a CeO2-
x(111) surface. For clusters of oxygen vacancies to appear, the following conditions must be
met: 1) some AcH molecules desorb to vacate some vacancies; 2) vacancies are able to diffuse at
an appreciable rate; 3) the energetics is altered to favor the aggregation of vacancies.
What the double-ramping experiments with TB = 530 K (602 K in our microkinetic
modeling) accomplish (Figure 3.5d), thus, is to free some vacancies while retaining some
enolate molecules in vacancies since the 3rd AcH desorption wave is well under way by 530 K.
When unoccupied vacancies appear at 530 K, their mobility is expected to be high because the
diffusion barrier for oxygen vacancies via a surface-subsurface exchange mechanism has been
calculated theoretically to be modest (Ea = 0.5 or 0.6 eV with GGA+U with U=3 [164] or 5 [165]
respectively). Further, our calculations show that the occupation of a surface Vo by an enolate
can make the formation of a vacancy dimer exothermic, in contrast to the dimerization of two
unoccupied surface point vacancies [161, 163]. As summarized in Table 4, when an enolate
occupies a surface Vo, the energetics of a second, unoccupied Vo varies depending on its
location, with the site in the surface that is nearest neighbor to Enl/Vo being the most favorable.
In other words, neighbor-neighbor interaction between Enl/Vo and an unoccupied Vo (similar to
adsorbate-adsorbate effects if Vo were considered an adsorbate) alters which state is
thermodynamically favored relative to the energetics in the absence of the enolate. Conversely,
if most of the enolates desorb, the thermodynamics would revert and cause most such vacancy
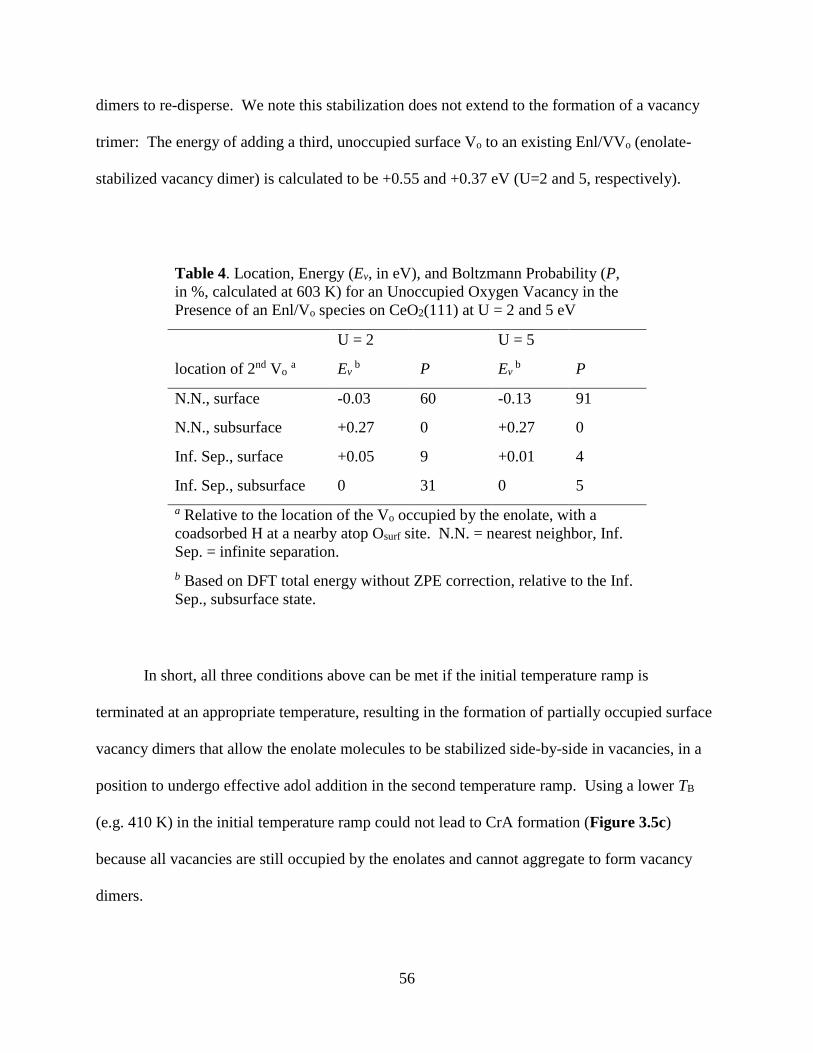
56
dimers to re-disperse. We note this stabilization does not extend to the formation of a vacancy
trimer: The energy of adding a third, unoccupied surface Vo to an existing Enl/VVo (enolate-
stabilized vacancy dimer) is calculated to be +0.55 and +0.37 eV (U=2 and 5, respectively).
Table 4. Location, Energy (Ev, in eV), and Boltzmann Probability (P,
in %, calculated at 603 K) for an Unoccupied Oxygen Vacancy in the
Presence of an Enl/Vo species on CeO2(111) at U = 2 and 5 eV
U = 2 U = 5
location of 2nd Vo a Ev
b P Ev b P
N.N., surface -0.03 60 -0.13 91
N.N., subsurface +0.27 0 +0.27 0
Inf. Sep., surface +0.05 9 +0.01 4
Inf. Sep., subsurface 0 31 0 5
a Relative to the location of the Vo occupied by the enolate, with a
coadsorbed H at a nearby atop Osurf site. N.N. = nearest neighbor, Inf.
Sep. = infinite separation.
b Based on DFT total energy without ZPE correction, relative to the Inf.
Sep., subsurface state.
In short, all three conditions above can be met if the initial temperature ramp is
terminated at an appropriate temperature, resulting in the formation of partially occupied surface
vacancy dimers that allow the enolate molecules to be stabilized side-by-side in vacancies, in a
position to undergo effective adol addition in the second temperature ramp. Using a lower TB
(e.g. 410 K) in the initial temperature ramp could not lead to CrA formation (Figure 3.5c)
because all vacancies are still occupied by the enolates and cannot aggregate to form vacancy
dimers.
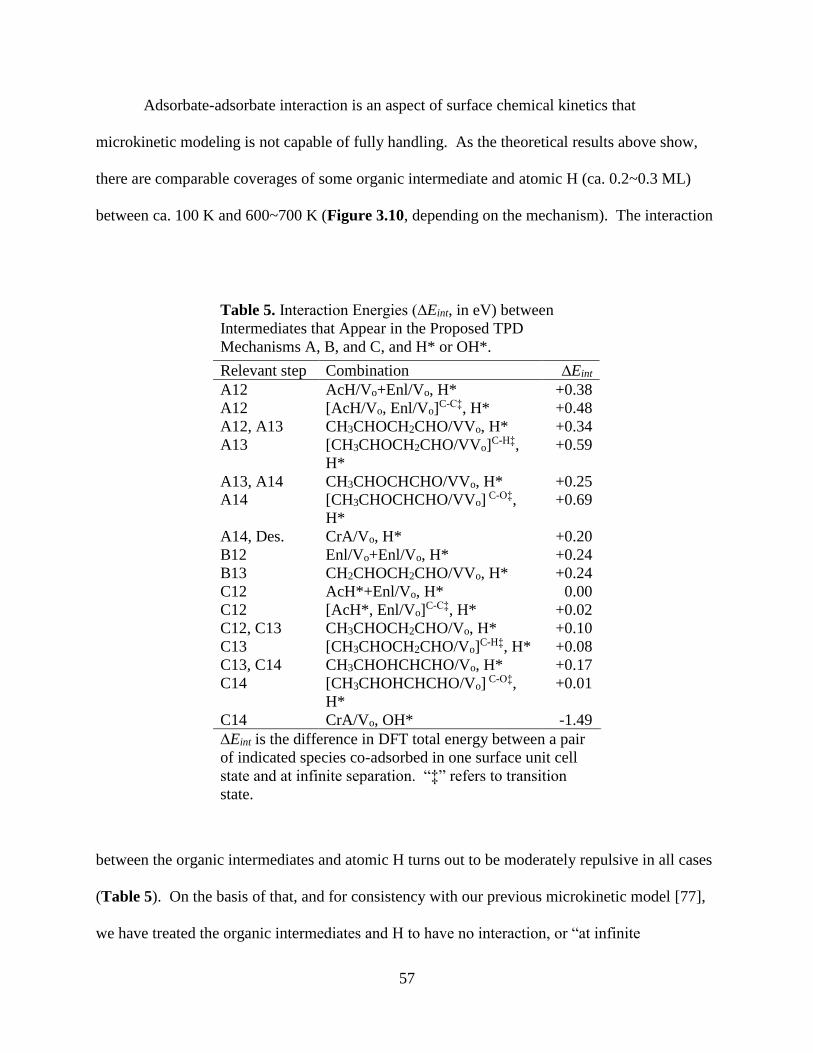
57
Adsorbate-adsorbate interaction is an aspect of surface chemical kinetics that
microkinetic modeling is not capable of fully handling. As the theoretical results above show,
there are comparable coverages of some organic intermediate and atomic H (ca. 0.2~0.3 ML)
between ca. 100 K and 600~700 K (Figure 3.10, depending on the mechanism). The interaction
Table 5. Interaction Energies (∆Eint, in eV) between
Intermediates that Appear in the Proposed TPD
Mechanisms A, B, and C, and H* or OH*.
Relevant step Combination ∆Eint
A12 AcH/Vo+Enl/Vo, H* +0.38
A12 [AcH/Vo, Enl/Vo]C-C‡, H* +0.48
A12, A13 CH3CHOCH2CHO/VVo, H* +0.34
A13 [CH3CHOCH2CHO/VVo]C-H‡,
H*
+0.59
A13, A14 CH3CHOCHCHO/VVo, H* +0.25
A14 [CH3CHOCHCHO/VVo] C-O‡,
H*
+0.69
A14, Des. CrA/Vo, H* +0.20
B12 Enl/Vo+Enl/Vo, H* +0.24
B13 CH2CHOCH2CHO/VVo, H* +0.24
C12 AcH*+Enl/Vo, H* 0.00
C12 [AcH*, Enl/Vo]C-C‡, H* +0.02
C12, C13 CH3CHOCH2CHO/Vo, H* +0.10
C13 [CH3CHOCH2CHO/Vo]C-H‡, H* +0.08
C13, C14 CH3CHOHCHCHO/Vo, H* +0.17
C14 [CH3CHOHCHCHO/Vo] C-O‡,
H*
+0.01
C14 CrA/Vo, OH* -1.49
∆Eint is the difference in DFT total energy between a pair
of indicated species co-adsorbed in one surface unit cell
state and at infinite separation. “‡” refers to transition
state.
between the organic intermediates and atomic H turns out to be moderately repulsive in all cases
(Table 5). On the basis of that, and for consistency with our previous microkinetic model [77],
we have treated the organic intermediates and H to have no interaction, or “at infinite
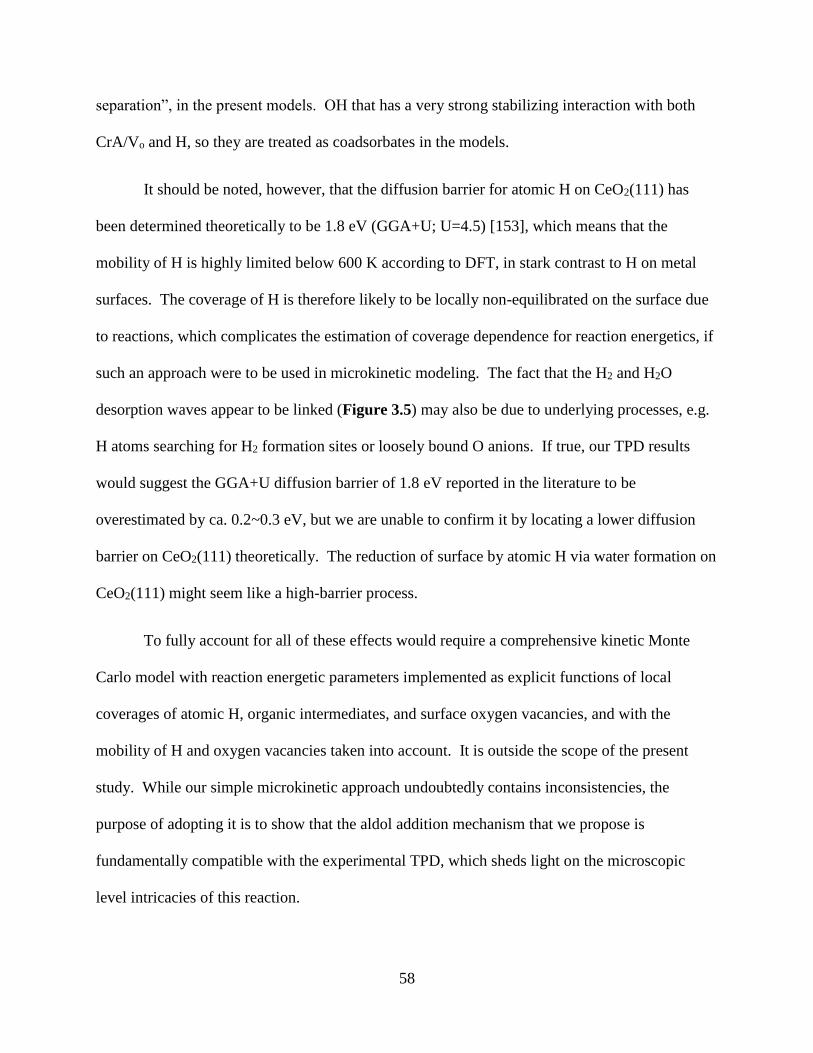
58
separation”, in the present models. OH that has a very strong stabilizing interaction with both
CrA/Vo and H, so they are treated as coadsorbates in the models.
It should be noted, however, that the diffusion barrier for atomic H on CeO2(111) has
been determined theoretically to be 1.8 eV (GGA+U; U=4.5) [153], which means that the
mobility of H is highly limited below 600 K according to DFT, in stark contrast to H on metal
surfaces. The coverage of H is therefore likely to be locally non-equilibrated on the surface due
to reactions, which complicates the estimation of coverage dependence for reaction energetics, if
such an approach were to be used in microkinetic modeling. The fact that the H2 and H2O
desorption waves appear to be linked (Figure 3.5) may also be due to underlying processes, e.g.
H atoms searching for H2 formation sites or loosely bound O anions. If true, our TPD results
would suggest the GGA+U diffusion barrier of 1.8 eV reported in the literature to be
overestimated by ca. 0.2~0.3 eV, but we are unable to confirm it by locating a lower diffusion
barrier on CeO2(111) theoretically. The reduction of surface by atomic H via water formation on
CeO2(111) might seem like a high-barrier process.
To fully account for all of these effects would require a comprehensive kinetic Monte
Carlo model with reaction energetic parameters implemented as explicit functions of local
coverages of atomic H, organic intermediates, and surface oxygen vacancies, and with the
mobility of H and oxygen vacancies taken into account. It is outside the scope of the present
study. While our simple microkinetic approach undoubtedly contains inconsistencies, the
purpose of adopting it is to show that the aldol addition mechanism that we propose is
fundamentally compatible with the experimental TPD, which sheds light on the microscopic
level intricacies of this reaction.
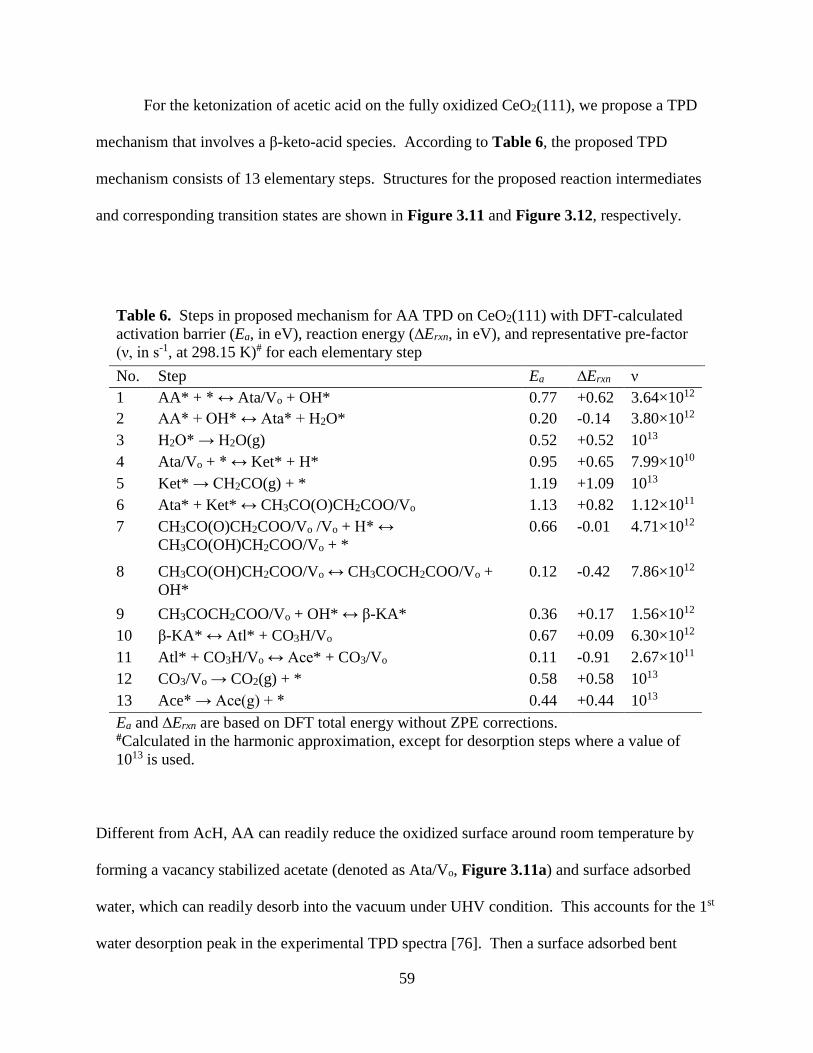
59
For the ketonization of acetic acid on the fully oxidized CeO2(111), we propose a TPD
mechanism that involves a β-keto-acid species. According to Table 6, the proposed TPD
mechanism consists of 13 elementary steps. Structures for the proposed reaction intermediates
and corresponding transition states are shown in Figure 3.11 and Figure 3.12, respectively.
Table 6. Steps in proposed mechanism for AA TPD on CeO2(111) with DFT-calculated
activation barrier (Ea, in eV), reaction energy (∆Erxn, in eV), and representative pre-factor
(ν, in s-1, at 298.15 K)# for each elementary step
No. Step Ea ∆Erxn ν
1 AA* + * ↔ Ata/Vo + OH* 0.77 +0.62 3.64×10¹²
2 AA* + OH* ↔ Ata* + H2O* 0.20 -0.14 3.80×10¹²
3 H2O* → H2O(g) 0.52 +0.52 1013
4 Ata/Vo + * ↔ Ket* + H* 0.95 +0.65 7.99×10¹⁰
5 Ket* → CH2CO(g) + * 1.19 +1.09 1013
6 Ata* + Ket* ↔ CH3CO(O)CH2COO/Vo 1.13 +0.82 1.12×10¹¹
7 CH3CO(O)CH2COO/Vo /Vo + H* ↔
CH3CO(OH)CH2COO/Vo + *
0.66 -0.01 4.71×10¹²
8 CH3CO(OH)CH2COO/Vo ↔ CH3COCH2COO/Vo +
OH*
0.12 -0.42 7.86×10¹²
9 CH3COCH2COO/Vo + OH* ↔ β-KA* 0.36 +0.17 1.56×10¹²
10 β-KA* ↔ Atl* + CO3H/Vo 0.67 +0.09 6.30×10¹²
11 Atl* + CO3H/Vo ↔ Ace* + CO3/Vo 0.11 -0.91 2.67×10¹¹
12 CO3/Vo → CO2(g) + * 0.58 +0.58 1013
13 Ace* → Ace(g) + * 0.44 +0.44 1013
Ea and ∆Erxn are based on DFT total energy without ZPE corrections. #Calculated in the harmonic approximation, except for desorption steps where a value of
1013 is used.
Different from AcH, AA can readily reduce the oxidized surface around room temperature by
forming a vacancy stabilized acetate (denoted as Ata/Vo, Figure 3.11a) and surface adsorbed
water, which can readily desorb into the vacuum under UHV condition. This accounts for the 1st
water desorption peak in the experimental TPD spectra [76]. Then a surface adsorbed bent

60
Figure 3.11. TPD mechanism for ketoniztion of acetic acid on the fully oxidized CeO2(111).
(Upper) DFT-caluclated reaction total energy profile for ketene pathway (blue) and acetone
pathway (grey). The labeled states are: (a) Ata* + Ata/Vo, (b) Ata* + Ket*, (c)
CH3CO(O)CH2COO/Vo, (d) CH3CO(OH)CH2COO/Vo, (e) CH3COCH2COO/Vo + OH*, (f)
CH3COCH2COO/Vo + OH*, (g) β-KA* , (h) Atl* + CO3H/Vo, (i) Ace* + CO3/Vo.
61
Figure 3.12. Corresponding transition states appeared in the proposed TPD mechanism for
ketoniztion of acetic acid on the fully oxidized CeO2(111). The labeled states are: (j) TS for
enolization, (k) TS for C-C coupling, (l) TS for H addition, (m) TS for OH detaching, (n) TS for
OH attacking, or β-KA* formation, (o) TS for C-C breaking and (p) TS for H transfer.
ketene (denoted as Ket*, i.e. CH2COO/Vo, Figure 3.11b) is formed via ⍺-H abstraction of
Ata/Vo with an activation energy barrier of 0.95 eV, which in contrast is much higher than the ⍺-
H abstraction of AcH/Vo. After this H abstraction step, C-C coupling step between the surface
adsorbed ketene and nearby surface adsorbed Ata (denoted as Ata*) turns out to be a kinetically
significant step with an activation energy barrier of 1.13 eV (TS is shown in Figure 3.12k). This

62
finding is in accordance with earlier conclusions that the rate-limiting step is C-C bond formation
on monoclinic zirconia surface [166, 167].
The product of C-C coupling, CH3CO(O)CH2COO/Vo (Figure 3.11c), accepts a H from
the surface lattice O and forms CH3CO(OH)CH2COO/Vo (Figure 3.11d). This H addition
facilitates the subsequent facile OH detaching step that cleaves off the internal O. This surface
adsorbed OH can rearrange itself firstly, then it attacks the carboxylate group that has been
stabilized by the surface oxygen vacancy and forms the surface adsorbed β-keto-acid (denoted as
β-KA*, Figure 3.11g). The β-keto-acid then decomposes relatively easily via a C-C breaking
step with an activation energy barrier of 0.67 eV, and forms surface adsorbed acetonyl species
(denoted as Atl*) and a vacancy stabilized bicarbonate species (denoted as HCO3/Vo). Next step
is H transfer from bicarbonate to acetonyl, which forms the final surface adsorbed acetone
(denoted as Ace*). This step gives a relatively big energy gain about 0.91 eV.
Our DFT calculated energy profile basically accords with the observed desorption
activities in surface science study that acetone is only a minor product, whereas ketene is the
major desorption product. Our findings show that the product of C-C coupling binds weakly on
the surface. As a result, instead of favoring the bimolecular acetone formation pathway, the C-C
coupling product undergoes facile decomposition and contributes to ketene desorption pathway.
A similar microkinetic modeling methodology will also be deployed here to validate our
mechanistic hypothesis. We expect that it is possible to improve the catalytic performance of
ceria towards acetone if the surface can impose a larger stabilization effect on the C-C coupling
product than on the other reaction intermediate states. On the other hand, if the stabilization
effect is too strong, the catalyst surface would get poisoned by CH3CO(O)CH2COO/Vo.

63
3.2 Dephosphorylation Mechanism of Phosphate Monoesters on CeO2(111)
Now gear will be switched to phosphorus chemistry from carbon chemistry, but the main topic is
coherent since the catalyst being studied here is still ceria. Firstly, we present and discuss the
surface-assisted hydrolysis mechanism for the dephosphorylation of model phosphate monoester,
p-NPP. The main surface intermediates involved in this mechanism will be presented first, and
then the mechanism and its energy profile, which starts with the adsorption of p-NPP, followed
by the P-O ester bond scission, the formation and desorption of p-NP, the hydration of the
remaining phosphate group, and finally the desorption of phosphoric acid (H3PO4). Then a
similar pathway is proposed and investigated for MP. Finally, a linear transition state scaling
plot is presented for the activation of the P-O ester bond on CeO2(111) for several additional
organic monophosphates together with p-NPP and MP.
3.2.1 Molecular adsorption of p-NPP
Several geometries for molecular adsorption of neutral p-NPP are considered, and the minimum-
energy configuration (Figure 3.13a) involves the formation of a P-O bond between the P atom
and a lattice O atom (Olatt) in the surface with a bond length of 1.687 Å (Table 7), while the P-O
ester bond is lengthened from 1.619 Å in the gas phase to 1.706 Å (Table 8). The two acidic H
atoms are attached to the axial O atom and one of the equatorial O atoms of the phosphate group,
respectively. The three equatorial O atoms of the phosphate group are each located on a
threefold hollow site above a Ce atom in the 2nd layer (designated as a 3fc site, cf. Figure 3.13b).
The minimum-energy configuration therefore involves a pentavalent P center with a weakened
P-O ester bond and its formation is determined to be barrier-less. The adsorption energy of this
adsorption state is -1.04 eV. It is 0.77 eV less stable for both of the acidic H atoms to be
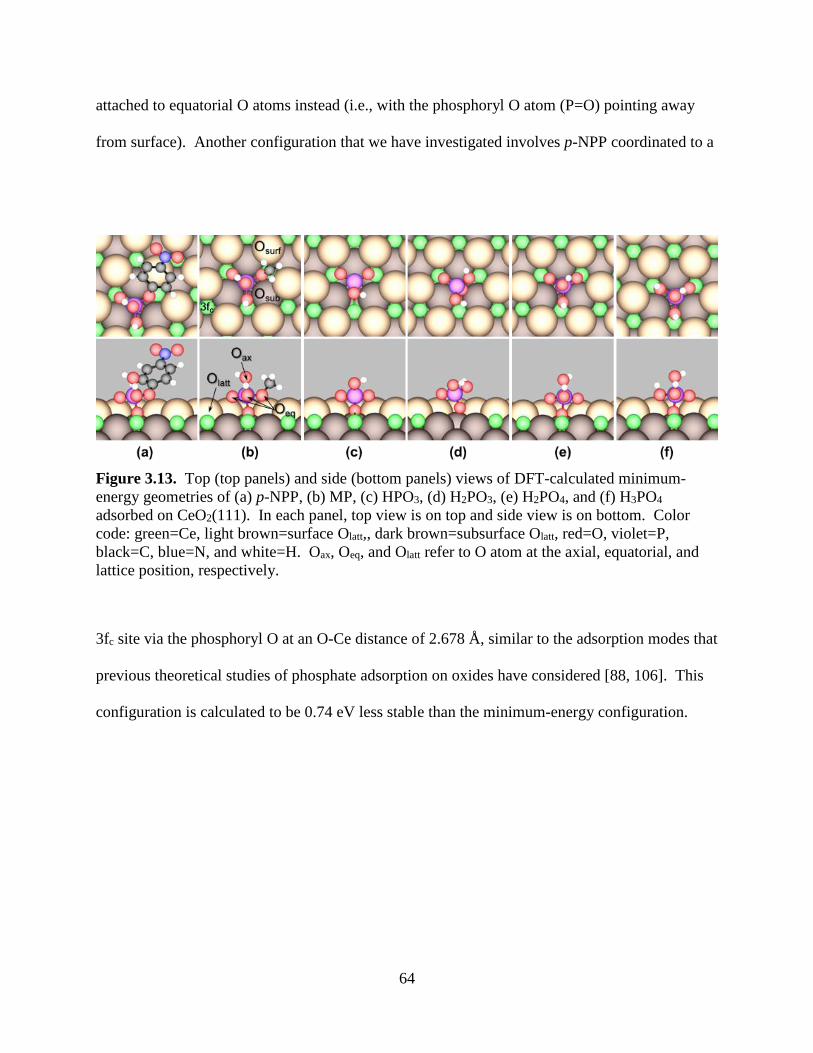
64
attached to equatorial O atoms instead (i.e., with the phosphoryl O atom (P=O) pointing away
from surface). Another configuration that we have investigated involves p-NPP coordinated to a
Figure 3.13. Top (top panels) and side (bottom panels) views of DFT-calculated minimum-
energy geometries of (a) p-NPP, (b) MP, (c) HPO3, (d) H2PO3, (e) H2PO4, and (f) H3PO4
adsorbed on CeO2(111). In each panel, top view is on top and side view is on bottom. Color
code: green=Ce, light brown=surface Olatt,, dark brown=subsurface Olatt, red=O, violet=P,
black=C, blue=N, and white=H. Oax, Oeq, and Olatt refer to O atom at the axial, equatorial, and
lattice position, respectively.
3fc site via the phosphoryl O at an O-Ce distance of 2.678 Å, similar to the adsorption modes that
previous theoretical studies of phosphate adsorption on oxides have considered [88, 106]. This
configuration is calculated to be 0.74 eV less stable than the minimum-energy configuration.
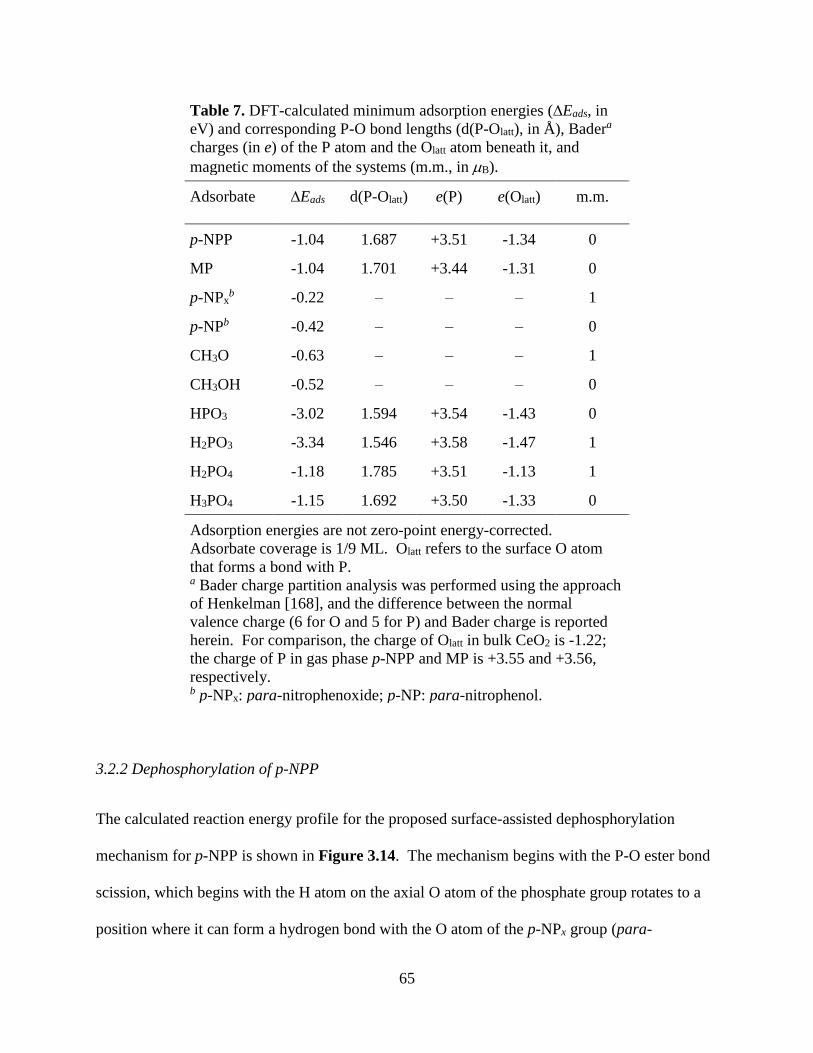
65
Table 7. DFT-calculated minimum adsorption energies (∆Eads, in
eV) and corresponding P-O bond lengths (d(P-Olatt), in Å), Badera
charges (in e) of the P atom and the Olatt atom beneath it, and
magnetic moments of the systems (m.m., in B).
Adsorbate ∆Eads d(P-Olatt) e(P) e(Olatt) m.m.
p-NPP -1.04 1.687 +3.51 -1.34 0
MP -1.04 1.701 +3.44 -1.31 0
p-NPxb -0.22 – – – 1
p-NPb -0.42 – – – 0
CH3O -0.63 – – – 1
CH3OH -0.52 – – – 0
HPO3 -3.02 1.594 +3.54 -1.43 0
H2PO3 -3.34 1.546 +3.58 -1.47 1
H2PO4 -1.18 1.785 +3.51 -1.13 1
H3PO4 -1.15 1.692 +3.50 -1.33 0
Adsorption energies are not zero-point energy-corrected.
Adsorbate coverage is 1/9 ML. Olatt refers to the surface O atom
that forms a bond with P. a Bader charge partition analysis was performed using the approach
of Henkelman [168], and the difference between the normal
valence charge (6 for O and 5 for P) and Bader charge is reported
herein. For comparison, the charge of Olatt in bulk CeO2 is -1.22;
the charge of P in gas phase p-NPP and MP is +3.55 and +3.56,
respectively. b p-NPx: para-nitrophenoxide; p-NP: para-nitrophenol.
3.2.2 Dephosphorylation of p-NPP
The calculated reaction energy profile for the proposed surface-assisted dephosphorylation
mechanism for p-NPP is shown in Figure 3.14. The mechanism begins with the P-O ester bond
scission, which begins with the H atom on the axial O atom of the phosphate group rotates to a
position where it can form a hydrogen bond with the O atom of the p-NPx group (para-

66
nitrophenoxide or 4-nitrophenoxide) and stabilize the p-NPx group once it is dissociated from the
molecule. The P-O bond is further lengthened to 1.858 Å in the transition state (TS, shown in
Figure 3.14iii). The activation barrier relative to the adsorbed p-NPP is a mere 0.13 eV (0.12 eV
ZPE-corrected). Once the P-O ester bond is cleaved, the axial H atom on the dissociated H2PO3
group is transferred to p-NPx to form p-NP (Figure 3.14iv). The p-NP presumably desorbs first
due to weaker adsorption (∆Eads = -0.42 eV by itself, or -0.40 eV while co-adsorbed with the
HPO3 group). The remaining HPO3 group then re-arranges itself to adopt the minimum-energy
configuration that occupies two 3fc sites (Figure 3.14v). Both the hydrogen transfer step and the
HPO3 re-arrangement step are found to be barrier-less.
To close the catalytic cycle, the HPO3 group needs to be hydrated and desorb as H3PO4.
We explored the direct addition of a water molecule to HPO3 and found it to be very
endothermic with a reaction energy in excess of 2 eV. Instead, hydration preferentially takes
place in a step-wise mechanism (Figure 3.14). The minimum-energy pathway begins with a
water molecule transferring a H atom to the axial O of phosphate, which has lost a H atom in the
previous alcohol formation step. This hydrogen transfer step has an activation barrier of 1.05 eV
(1.04 eV ZPE-corrected). The remaining hydroxyl group is now located at a distance of 1.831 Å
between the P and O atoms in the intermediate state (Figure 3.14viii). The next step, OH attack
forming H3PO4, is very facile with an activation energy of only 0.09 eV (0.06 eV ZPE-
corrected). The desorption of H3PO4 is endothermic by 1.15 eV (1.07 eV ZPE-corrected). Thus,
our calculations show that the hydration of HPO3 and the desorption of H3PO4 are both rate-
limiting steps in the overall dephosphorylation process in vacuo, with activation energies of ca.
1.1 eV.

67
Figure 3.14. DFT-calculated minimum-energy reaction energy profile (not ZPE-corrected;
entire path at zero magnetic moment) for the proposed dephosphorylation mechanism for p-NPP
(including hydration of HPO3) on CeO2(111). Transition states are labeled by “‡”.
(Fig. 3.14 caption cont.)
68
Surface adsorbed species are labeled by “*”. p-NPP, H2O, p-NP, and H3PO4 are treated as gas-
phase molecules in States (i), (i)-(v), (v)-(xi) and (xi), respectively. Labeled activation or
desorption processes are: A: P-O ester bond scission, Ea = 0.13 eV; B: p-NP desorption to gas
phase, ∆Edes = 0.41 eV; C: H transfer, Ea = 1.05 eV; D: OH attack, Ea = 0.09 eV; E: H3PO4
desorption to gas phase, ∆Edes = 1.15 eV; E’: H3PO4 desorption to aqueous phase, ∆Edes = 0.28
eV. Structures for states in the energy profile are shown in top and side views below the profile.
View is rotated by 40° counterclockwise from panel (iv) to (v), and by 60° clockwise from (v) to
(vi). Color code: green=Ce, light brown=surface Olatt, dark brown=subsurface Olatt, red=O,
violet=P, black=C, blue=N, and white=H.
Alternatively, we have investigated a stepwise hydration mechanism that begins with
water dissociation on the surface, followed by OH attack before H transfer. The corresponding
reaction energy profile is shown in Figure 3.15. The small barrier to water dissociation (0.32
eV, or 0.21 eV ZPE-corrected) is consistent with prior experimental [74] and theoretical [45,
169, 170] work that reported water dissociation to be very facile and reversible on CeO2(111).
The diffusion of a surface OH group, which positions it following water splitting for attack of the
P center, is very facile with a diffusion barrier of ca. 0.1 eV, and so it is kinetically insignificant
and therefore neglected from Figure 3.15. The OH attack step itself has an activation energy of
0.90 eV (0.92 eV ZPE-corrected), which results in a H2PO4 group. The remaining H atom is
transferred from the surface to the H2PO4 group with an activation energy of 0.61 eV (0.50 eV
ZPE-corrected). Thus the total energetic barrier that HPO3 hydration needs to overcome (i.e.
between States vi and ix in Figures 3.14 and 3.15) is practically identical for both mechanisms
(1.08 vs. 1.15 eV, or 1.08 vs. 1.14 eV ZPE-corrected). We conclude that within the accuracy of
DFT it is kinetically equivalent whether OH attack occurs before or after H transfer, at least in
vacuo.
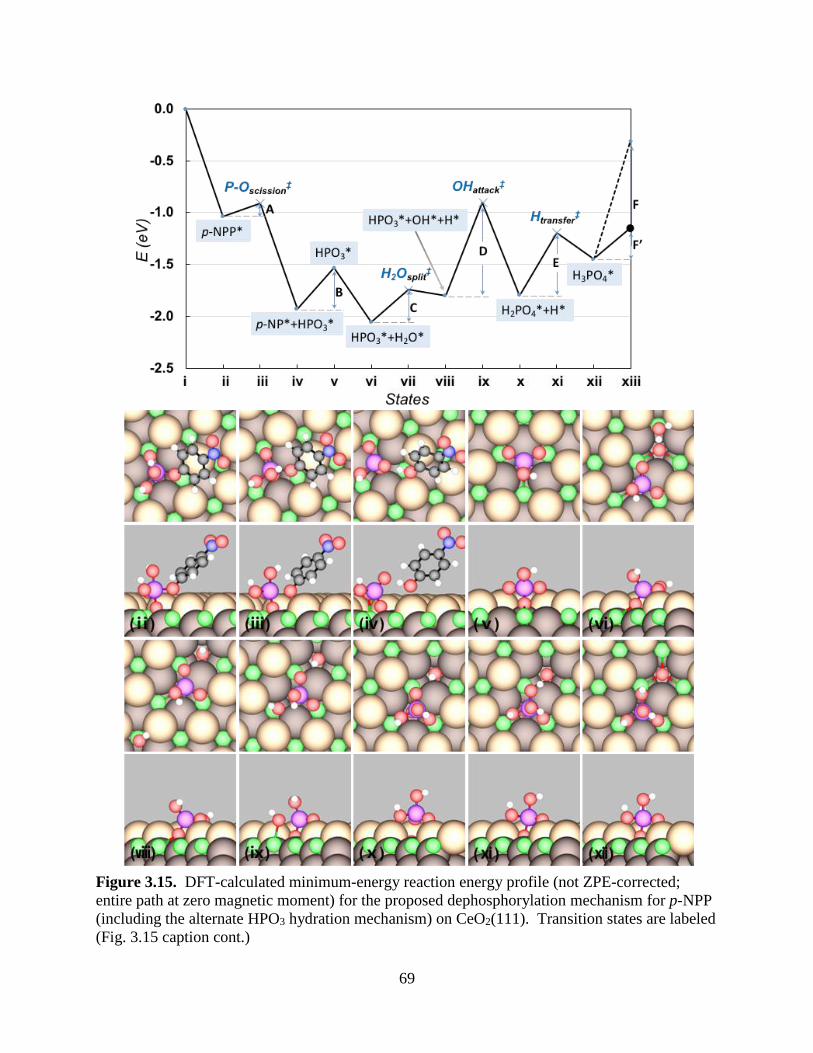
69
Figure 3.15. DFT-calculated minimum-energy reaction energy profile (not ZPE-corrected;
entire path at zero magnetic moment) for the proposed dephosphorylation mechanism for p-NPP
(including the alternate HPO3 hydration mechanism) on CeO2(111). Transition states are labeled
(Fig. 3.15 caption cont.)

70
by “‡”. Surface adsorbed species are labeled by “*”. p-NPP, H2O, p-NP and H3PO4 are treated
as gas phase molecules in States (i), (i)-(v), (v)-(xiii), and (xiii), respectively. Labeled activation
or desorption processes are: A: P-O ester bond scission, Ea = 0.13 eV; B: p-NP desorption to gas
phase, ∆Edes = 0.41 eV; C: water splitting, Ea = 0.32 eV; D: OH attack, Ea = 0.90 eV; E: H
transfer, Ea = 0.61 eV; F: H3PO4 desorption to gas phase, ∆Edes = 1.15 eV; F’: H3PO4 desorption
to aqueous phase, ∆Edes = 0.28 eV. Structures for states in the energy profile are shown in top
and side views below the profile. View is rotated by 40° counterclockwise from panel (iv) to (v),
by 60° clockwise from (v) to (vi). Color code: green=Ce, light brown=surface Olatt, dark
brown=subsurface Olatt, red=O, violet=P, black=C, blue=N, and white=H.
Experimentally, Manto et al. have reported the apparent activation energies to be
36.6±1.2, 76.5±1.9, 82.0±3.6, and 105.4±2.9 kJ/mol (100 kJ/mol ≈ 1 eV) for the nanospheres,
nano-octahedra (which primarily expose (111) facets), nanorods, and nanocubes, respectively, in
comparison to 57.4±2.7 kJ/mol for commercial CeO2 powder [91]. While our DFT-calculated
activation energies based on the rate-limiting steps are ca. 0.3 eV higher than the apparent
activation energy corresponding to CeO2(111), such a direct comparison is not meaningful due to
potential concentration effects (e.g. reactant/product concentrations in solution were changing
during experiment), coverage effects (surface site competition and lateral interaction are not
considered here), as well as solvation effects. Solvation is expected to make the desorption of
both the alcohol and phosphoric acid (or their deprotonated forms) much easier because they are
well solvated by water [171, 172], so phosphate desorption may no longer be rate-limiting in
aqueous phase. This can be seen in Figures 3.14 and 3.15, where we have indicated the
solvation energy for molecular p-NPP in water calculated using an implicit solvent model [173].
We expect the species adsorbed on the ceria surface to also be partially solvated so that the
promotional effect of solvation on desorption would be somewhat smaller than depicted.
Presently the solvent model cannot be applied to the surface species on ceria due to problems in
71
its implementation. Nonetheless, it is clear that the binding strengths, and thus the corresponding
desorption barriers, of these species would be reduced at a water-ceria interface. In addition,
there is theoretical evidence in the literature that solvation by water can stabilize the transition
states of the formation of polarized bonds by a few tenths of an eV [174, 175], which suggests
that the hydration of the phosphate group should occur at more appreciable rates at ambient
conditions than the as-calculated activation barrier of ca. 1.1 eV would suggest. Furthermore,
Manto et al. have shown that the apparent activation energy of p-NPP dephosphorylation can be
correlated to the surface density of oxygen vacancies [91], which suggests that the reaction
mechanism may be different when p-NPP interacts with an oxygen vacancy, a surface element
that is not considered in this study. Detailed microkinetic modeling accounting for
adsorption/desorption, coverage and solvation effects, and varying extent of reduction in ceria
will be attempted in the future to better validate our mechanistic model.
3.2.3 Adsorption and dephosphorylation of MP
The minimum-energy molecular adsorption state of neutral methyl phosphate (MP) has a similar
configuration (Figure 3.16b) to that of p-NPP. Its formation is likewise found to be non-
activated, just like for p-NPP. As can be seen in Table 7, the strength of the P-Olatt bond is
nearly identical for p-NPP, MP, and H3PO4, suggesting that the P-Olatt bond is little affected by
substitution of the acidic hydrogen by an organic group.
The P-O ester bond scission in MP occurs in a similar manner (see Figure 3.16) and
produces HPO3 and methanol in one step, and it has a noticeably higher activation energy of 0.50
eV (0.43 eV ZPE-corrected) than in p-NPP. After the formation and desorption of methanol, the
hydration of the remaining HPO3 group is identical to that described above. Overall, even

72
Figure 3.16. DFT-calculated minimum-energy reaction energy profiles (not ZPE-corrected;
entire path at zero magnetic moment) for the proposed dephosphorylation mechanism for MP
(dash line) and p-NPP (solid line) on CeO2(111). Structures unique to the dephosphorylation of
MP are shown in top and side views below the profile. View is rotated by 40° counterclockwise
from panel (iv) to (v). Color code: green=Ce, light brown=surface Olatt, dark brown=subsurface
Olatt, red=O, violet=P, black=C, and white=H. Solvation energy of H3PO4 in water has been
applied to the desorption energy in the final state (xi).
though the methoxy group affects the activation energy of the P-O ester bond, the hydration of
the phosphate group remains rate-limiting. We note that P-OCH3 bond scission in a similar
compound, dimethyl methylphosphonate (DMMP), has been reported to occur between 200 and
400 K on CeO2(111), with which the small activation energy for P-OCH3 bond scission in MP is
73
in line [101]. It is worth mentioning that DMMP has been frequently studied as a proxy for
certain chemical warfare agents, and what its reactivity has in common on a variety of solids
under gas phase [100, 102-104] is P-OCH3 bond scission under mild conditions but hindered
removal of the remaining methylphosphonic acid group due to strong adsorption. This pattern is
similar to the dephosphorylation of p-NPP and MP that we are reporting herein, i.e. facile P-O
ester bond scission but hindered removal of the phosphate group, in the absence of solvation
effects.
3.2.4 Role of ceria surface in catalyzing hydrolysis of phosphate monoesters
A CeO2(111) surface presents a large number of exposed Olatt atoms that can act as nucleophiles
to coordinate to the P atoms in the phosphates, as well as Lewis bases to accept protons from the
phosphates or from water. As mentioned above, an optimal pentavalent structure for model
phosphate monoesters is formed on CeO2(111) without any activation energy. Here the P center
is activated prior to P-O bond scission by a nucleophilic attack, although it is done by ceria and
not water. Then the P-O bond preferentially dissociates, followed by the hydration of the
remaining phosphate group and its desorption as H3PO4, each of which has an activation energy
of ca. 1.1 eV. Thus the surface-assisted dephosphorylation process on CeO2(111) possesses
features of both associative and dissociative mechanisms in aqueous solution but does not strictly
conform to either.
Although P-O ester bond scission is not rate-limiting in the dephosphorylation of p-NPP
and MP on CeO2(111), it could be significant in other phosphate monoesters. Thus we explored
ester bond scission in four additional neutral organic phosphate monoesters on CeO2(111),
including para-chlorophenyl phosphate (p-ClPP), phenyl phosphate (PP), 2-pyridyl phosphate
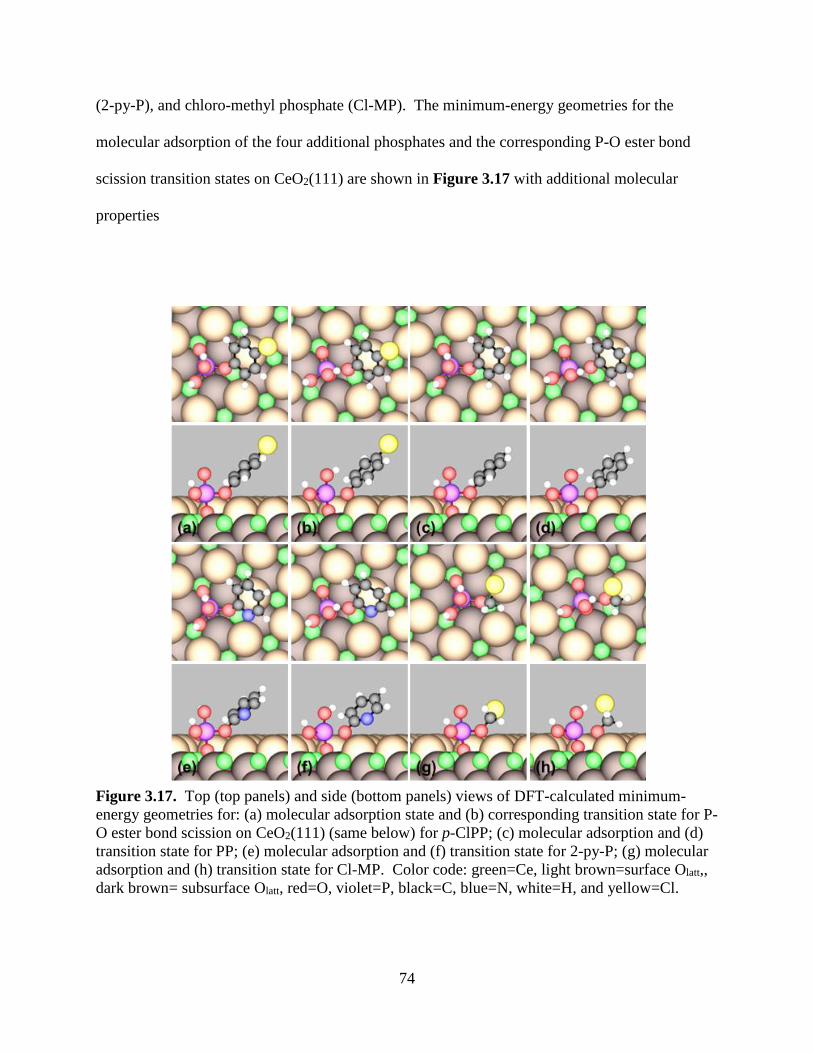
74
(2-py-P), and chloro-methyl phosphate (Cl-MP). The minimum-energy geometries for the
molecular adsorption of the four additional phosphates and the corresponding P-O ester bond
scission transition states on CeO2(111) are shown in Figure 3.17 with additional molecular
properties
Figure 3.17. Top (top panels) and side (bottom panels) views of DFT-calculated minimum-
energy geometries for: (a) molecular adsorption state and (b) corresponding transition state for P-
O ester bond scission on CeO2(111) (same below) for p-ClPP; (c) molecular adsorption and (d)
transition state for PP; (e) molecular adsorption and (f) transition state for 2-py-P; (g) molecular
adsorption and (h) transition state for Cl-MP. Color code: green=Ce, light brown=surface Olatt,,
dark brown= subsurface Olatt, red=O, violet=P, black=C, blue=N, white=H, and yellow=Cl.

75
listed in Table 8. As shown in Figure 3.18, a linear relation with a slope of 0.66 results, which
relates the energy of the transition state of P-O ester bond scission to the energies of the
dissociated moieties (alkoxide and H2PO3) on CeO2(111). The correlation is not particularly
strong possibly because the P-O bonds in most of these phosphate monoesters are significantly
weakened on CeO2(111), causing the activation energies of the P-O ester bond scission fall
Table 8. DFT-calculated minimum adsorption energies (∆Eads, in eV) and corresponding
P-O bond lengths (d(P-Olatt), in Å; ester bond d(P-O), in Å; gas-phase ester bond (d(P-
O)gas, in Å) included for comparison), and magnetic moments (m.m., in B).
Adsorbate ∆Eads pKa† d(P-
Olatt)
d(P-O) d(P-O)gas e(P) e(Olatt) m.m.
p-NPP -1.04 – 1.687 1.706 1.619 +3.51 -1.34 0
MP -1.04 – 1.701 1.670 1.599 +3.44 -1.31 0
p-ClPP -0.99 – 1.692 1.703 1.606 +3.47 -1.32 0
PP -0.98 – 1.694 1.697 1.602 +3.47 -1.32 0
2-py-P -0.65 – 1.690 1.694 1.666 +3.46 -1.33 0
Cl-MP -1.03 – 1.691 1.707 1.640 +3.45 -1.32 0
p-NPx -0.22 7.1 – – – – – 1
CH3O -0.63 15.5 – – – – – 1
p-ClPx -0.09 9.4 – – – – – 1
phenoxy -0.23 10.0 – – – – – 1
2-
oxopyridine
-0.30 n/a – – – – – 1
ClCH2O -0.58 n/a – – – – – 1
Adsorption energies are not ZPE-corrected. Adsorbate coverage is 1/9 ML. Olatt refers to
the surface O atom that forms a bond with P. † pKa values of p-NPx, CH3O, p-ClPx, and phenoxy are obtained from Ref. [95].

76
within DFT margins of error and thus making the accurate capture of the transition states
challenging. Nonetheless, the energies of the dissociated moieties may still be used to provide
quick estimates for the energies of the transition states of P-O ester bond scission and therefore
Figure 3.18. Transition state scaling relation between the adsorption energies of the transition
states for P-O ester bond scission of model phosphate monoesters and the adsorption energies of
the dissociated fragments (alkoxide and H2PO3, at infinite separation) on CeO2(111). The
energies are referenced to the corresponding neutral gas-phase phosphate monoesters [176].
the corresponding P-O ester bond scission barriers for other phosphate monoesters. As
summarized in Table 9, the activation energies for activating the P-O ester bonds in these
phosphate monoesters on CeO2(111) are also closely related to the corresponding P-O ester bond
energies in gas phase, and they are all significantly lower than the activation energies for
phosphate hydration and desorption in vacuo.
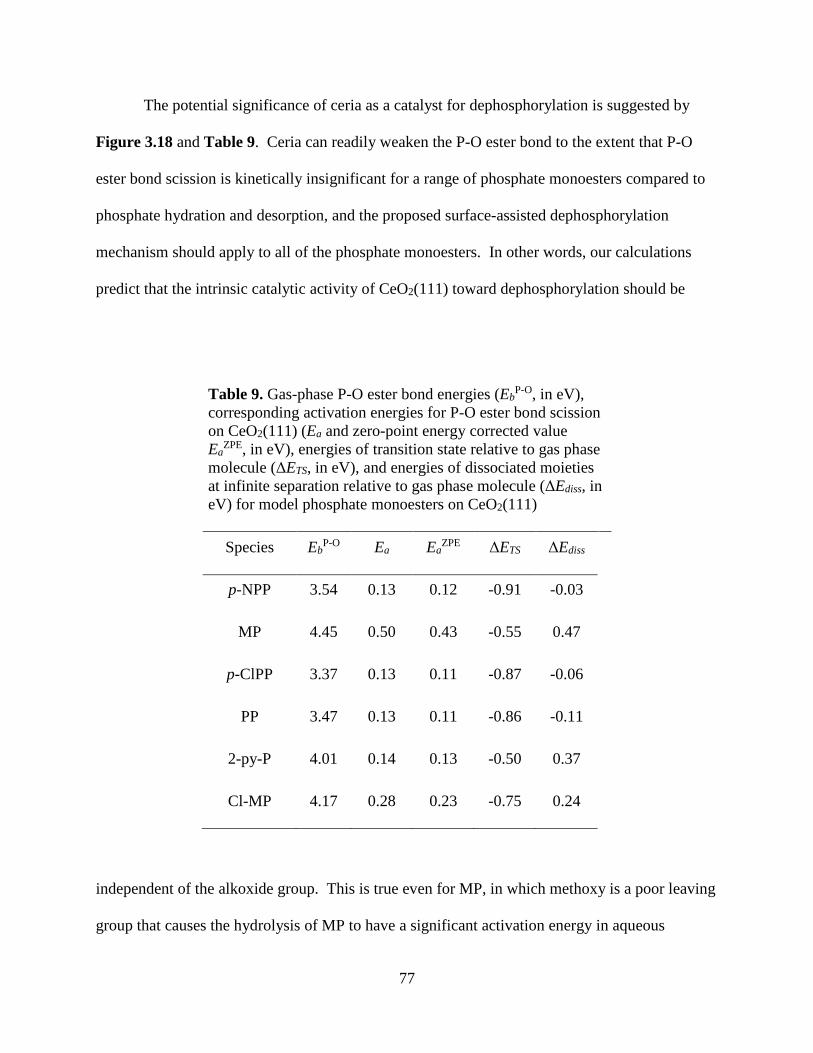
77
The potential significance of ceria as a catalyst for dephosphorylation is suggested by
Figure 3.18 and Table 9. Ceria can readily weaken the P-O ester bond to the extent that P-O
ester bond scission is kinetically insignificant for a range of phosphate monoesters compared to
phosphate hydration and desorption, and the proposed surface-assisted dephosphorylation
mechanism should apply to all of the phosphate monoesters. In other words, our calculations
predict that the intrinsic catalytic activity of CeO2(111) toward dephosphorylation should be
Table 9. Gas-phase P-O ester bond energies (EbP-O, in eV),
corresponding activation energies for P-O ester bond scission
on CeO2(111) (Ea and zero-point energy corrected value
EaZPE, in eV), energies of transition state relative to gas phase
molecule (ΔETS, in eV), and energies of dissociated moieties
at infinite separation relative to gas phase molecule (ΔEdiss, in
eV) for model phosphate monoesters on CeO2(111)
Species EbP-O Ea Ea
ZPE ΔETS ΔEdiss
p-NPP 3.54 0.13 0.12 -0.91 -0.03
MP 4.45 0.50 0.43 -0.55 0.47
p-ClPP 3.37 0.13 0.11 -0.87 -0.06
PP 3.47 0.13 0.11 -0.86 -0.11
2-py-P 4.01 0.14 0.13 -0.50 0.37
Cl-MP 4.17 0.28 0.23 -0.75 0.24
independent of the alkoxide group. This is true even for MP, in which methoxy is a poor leaving
group that causes the hydrolysis of MP to have a significant activation energy in aqueous
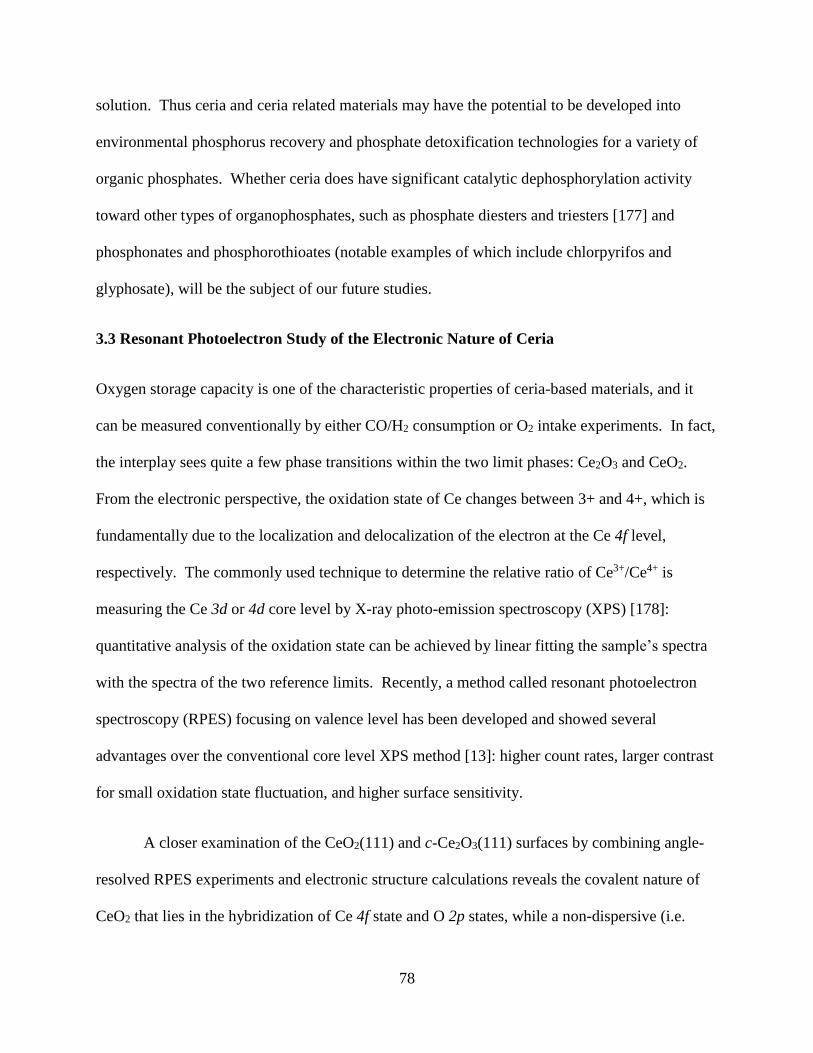
78
solution. Thus ceria and ceria related materials may have the potential to be developed into
environmental phosphorus recovery and phosphate detoxification technologies for a variety of
organic phosphates. Whether ceria does have significant catalytic dephosphorylation activity
toward other types of organophosphates, such as phosphate diesters and triesters [177] and
phosphonates and phosphorothioates (notable examples of which include chlorpyrifos and
glyphosate), will be the subject of our future studies.
3.3 Resonant Photoelectron Study of the Electronic Nature of Ceria
Oxygen storage capacity is one of the characteristic properties of ceria-based materials, and it
can be measured conventionally by either CO/H2 consumption or O2 intake experiments. In fact,
the interplay sees quite a few phase transitions within the two limit phases: Ce2O3 and CeO2.
From the electronic perspective, the oxidation state of Ce changes between 3+ and 4+, which is
fundamentally due to the localization and delocalization of the electron at the Ce 4f level,
respectively. The commonly used technique to determine the relative ratio of Ce3+/Ce4+ is
measuring the Ce 3d or 4d core level by X-ray photo-emission spectroscopy (XPS) [178]:
quantitative analysis of the oxidation state can be achieved by linear fitting the sample’s spectra
with the spectra of the two reference limits. Recently, a method called resonant photoelectron
spectroscopy (RPES) focusing on valence level has been developed and showed several
advantages over the conventional core level XPS method [13]: higher count rates, larger contrast
for small oxidation state fluctuation, and higher surface sensitivity.
A closer examination of the CeO2(111) and c-Ce2O3(111) surfaces by combining angle-
resolved RPES experiments and electronic structure calculations reveals the covalent nature of
CeO2 that lies in the hybridization of Ce 4f state and O 2p states, while a non-dispersive (i.e.
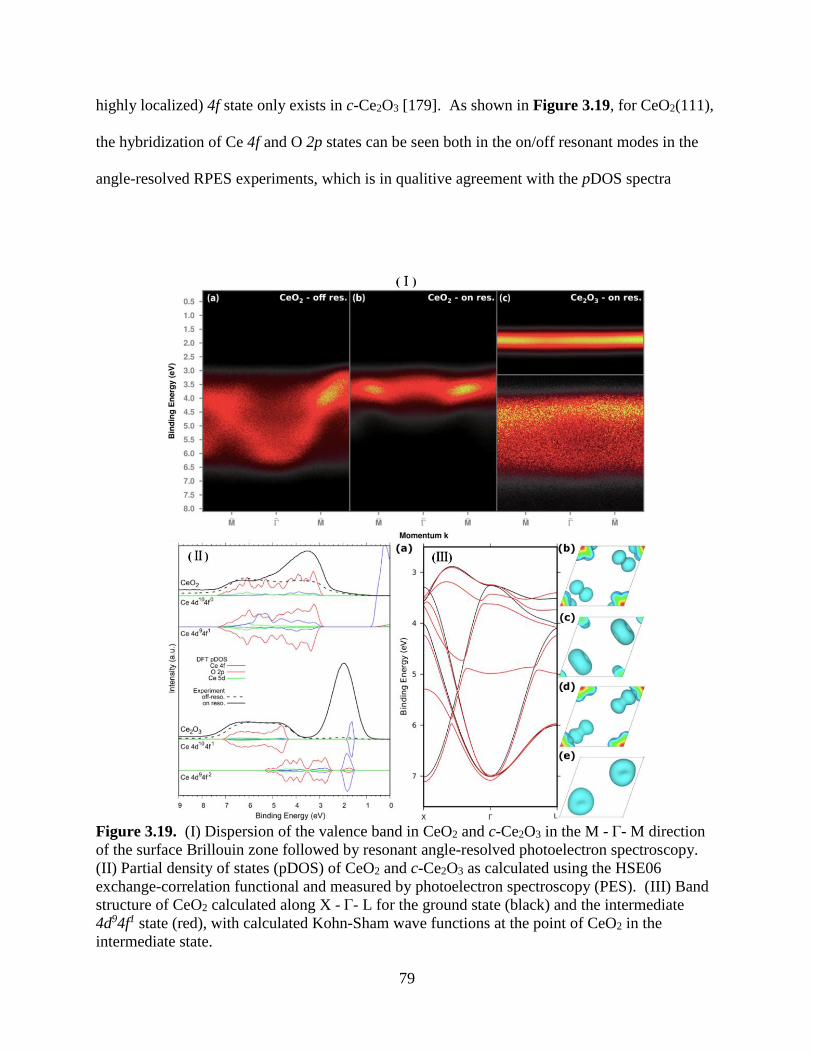
79
highly localized) 4f state only exists in c-Ce2O3 [179]. As shown in Figure 3.19, for CeO2(111),
the hybridization of Ce 4f and O 2p states can be seen both in the on/off resonant modes in the
angle-resolved RPES experiments, which is in qualitive agreement with the pDOS spectra
Figure 3.19. (I) Dispersion of the valence band in CeO2 and c-Ce2O3 in the M - Γ- M direction
of the surface Brillouin zone followed by resonant angle-resolved photoelectron spectroscopy.
(II) Partial density of states (pDOS) of CeO2 and c-Ce2O3 as calculated using the HSE06
exchange-correlation functional and measured by photoelectron spectroscopy (PES). (III) Band
structure of CeO2 calculated along X - Γ- L for the ground state (black) and the intermediate
4d94f1 state (red), with calculated Kohn-Sham wave functions at the point of CeO2 in the
intermediate state.

80
calculated by DFT. On the other hand, for c-Ce2O3(111), no admixture of Ce 4f and O 2p exists
due to the highly localized nature of the 4f electrons. Therefore, our study confirmed the
covalent nature of CeO2 that is caused by cation-anion hybridization with electrons tied up in the
ligand states.
81
SUMMARY
The potential applications of ceria as catalyst in upgrading biomass-derived oxygenates and
recovering phosphorus from organic pollutants have been studied throughout the research
project, using self-consistent, periodic density functional theory calculations primarily at the
GGA+U-PW91 level. Mean-field microkinetic modeling using DFT-calculated energetics as
inputs can simulate spectroscopic outcomes that can be directly compared with the spectroscopic
evidence from surface science experiments, thus it (DFT+MkM) turns out to be a useful tool to
validate mechanistic hypothesis.
The temperature programmed desorption of model oxygenates, i.e. AcH and AA, on
CeO2(111) surfaces under UHV condition have been studied in detail. For the AcH-TPD system,
a general TPD mechanism has been proposed to account for the formation of various C2 species.
The outcomes of MkM are in close agreement with the observed desorption activities and
infrared evidence. Therefore, our results suggested that oxygen vacancies play the critical role of
activating the carbonyl bond by stabilizing the carbonyl O with exposed Lewis acid site, which
transforms the carbonyl bond to a C-O single bond, and allows this C atom to engage in bonding
with another AcH. Afterwards, decomposition of the dimer state forms the enolate (CH2CHO)
and its derivatives, which in turn account for the formation of ethylene and acetylene via
intermolecular hydrogen transfer and deoxygenation.
Further attempts have been made to explain the discrepancy between the AcH-TPD
experiment (UHV condition) and AcH-TPSR experiment (flow reactor condition). Taking
advantages of the surface dominant enolate species that spans a wide temperature window of ca.
200 K, our most recent AcH-TPD experiment using a tailored double-ramping procedure
82
managed to capture appreciable amount of CrA formation under UHV condition. Three
expanded TPD mechanisms were then proposed to account for CrA formation, one of which was
validated using the DFT+MkM methodology. Therefore, our results suggested the catalytic
active site is a vacancy dimer that is created in-situ via facile vacancy migration.
For the AA-TPD system, our calculations showed AA could readily reduce the fully
oxidized CeO2(111) around room temperature under UHV condition, which agrees with the
observed early water desorption activity in the TPD experiments. However, the kinetic
difficulties of the acetone pathway lie in two aspects: one is the ⍺-H abstraction of the vacancy
stabilized acetate, another is the C-C coupling step. The weak binding of the C-C coupling
product on the surface makes its decomposition facile, which would eventually contribute to
ketene desorption. This finding agrees with the experimental evidence that ketene is a major
product other than acetone under UHV condition.
The dephosphorylation of two model phosphate monoesters, neutral p-NPP and MP, on
CeO2(111) has been investigated theoretically in vacuo. A surface-assisted hydrolysis
mechanism is proposed, which involves the barrier-less activation of the phosphates by
adsorption on CeO2(111) and formation of a P-Olatt bond, facile dissociation of the P-O ester
bond, hydration of the remaining HPO3 group, and desorption of H3PO4. The last two steps are
found to be rate-limiting in vacuo with activation energies of ca. 1.1 eV, both of which are
expected to be reduced by solvation effects. P-O ester bond scission in several other phosphate
monoesters has been investigated and is found consistently to have low activation energies, in
contrast to the large bond energy of the P-O ester bond in the isolated molecules. The overall
catalytic performance of CeO2(111) in dephosphorylation process is therefore predicted to be
independent of the nature of the alkoxide group.
83
Other than its successful application in the automotive emission control industry, our
findings provide insights for the potential engineering of ceria into viable catalysts for upgrading
small organic oxygenates derived from biomass feedstock. Besides, our findings suggest that
ceria can be catalytically active toward the dephosphorylation of organic phosphates in general
under ambient conditions and may potentially serve as the core of technologies for the recycling
of phosphorus from, and detoxification of, organic phosphates in the environment.
84
REFERENCES
[1] A. Trovarelli, P. Fornasiero, Catalysis by Ceria and Related Materials, Imperial College
Press, London, 2002.
[2] T. Montini, M. Melchionna, M. Monai, P. Fornasiero, Fundamentals and Catalytic
Applications of CeO2-Based Materials, Chem. Rev., 116 (2016) 5987-6041.
[3] J. Kašpar, P. Fornasiero, M. Graziani, Use of CeO2-Based Oxides in the Three-Way
Catalysis, Catal. Today, 50 (1999) 285-298.
[4] R.M. Heck, R.J. Farrauto, S.T. Gulati, Catalytic Air Pollution Control: Commercial
Technology, 3rd ed., John Wiley & Sons, Hoboken, 2009.
[5] J.A. Rodriguez, S. Ma, P. Liu, J. Hrbek, J. Evans, M. Pérez, Activity of CeOx and TiOx
Nanoparticles Grown on Au(111) in the Water-Gas Shift Reaction, Science, 318 (2007) 1757-
1760.
[6] G.A. Deluga, J.R. Salge, L.D. Schmidt, X.E. Verykios, Renewable Hydrogen from Ethanol
by Autothermal Reforming, Science, 303 (2004) 993-997.
[7] J. Graciani, K. Mudiyanselage, F. Xu, A.E. Baber, J. Evans, S.D. Senanayake, D.J.
Stacchiola, P. Liu, J. Hrbek, J.F. Sanz, J.A. Rodriguez, Highly Active Copper-Ceria and Copper-
Ceria-Titania Catalysts for Methanol Synthesis from CO2, Science, 345 (2014) 546-550.
[8] E. Aneggi, C. de Leitenburg, G. Dolcetti, A. Trovarelli, Promotional Effect of Rare Earths
and Transition Metals in the Combustion of Diesel Soot over CeO2 and CeO2-ZrO2, Catal.
Today, 114 (2006) 40-47.
[9] B.C.H. Steele, Materials for IT-SOFC Stacks: 35 years R&D: The Inevitability of
Gradualness?, Solid State Ionics, 134 (2000) 3-20.
[10] G.P. Smestad, A. Steinfeld, Review: Photochemical and Thermochemical Production of
Solar Fuels from H2O and CO2 Using Metal Oxide Catalysts, Ind. Eng. Chem. Res., 51 (2012)
11828-11840.
[11] M. Nolan, S.C. Parker, G.W. Watson, The Electronic Structure of Oxygen Vacancy Defects
at the Low Index Surfaces of Ceria, Surf. Sci., 595 (2005) 223-232.

85
[12] D.R. Mullins, P.V. Radulovic, S.H. Overbury, Ordered Cerium Oxide Thin Films Grown on
Ru(0001) and Ni(111), Surf. Sci., 429 (1999) 186-198.
[13] V. Matolín, J. Libra, M. Škoda, N. Tsud, K.C. Prince, T. Skála, Methanol Adsorption on a
CeO2(111)/Cu(111) Thin Film Model Catalyst, Surf. Sci., 603 (2009) 1087-1092.
[14] P. Luches, F. Pagliuca, S. Valeri, Morphology, Stoichiometry, and Interface Structure of
CeO2 Ultrathin Films on Pt(111), J. Phys. Chem. C, 115 (2011) 10718-10726.
[15] S. Eck, C. Castellarin-Cudia, S. Surnev, M.G. Ramsey, F.P. Netzer, Growth and Thermal
Properties of Ultrathin Cerium Oxide Layers on Rh(111), Surf. Sci., 520 (2002) 173-185.
[16] M. Alexandrou, R.M. Nix, The Growth, Structure and Stability of Ceria Overlayers on
Pd(111), Surf. Sci., 321 (1994) 47-57.
[17] S. Ma, J.A. Rodriguez, J. Hrbek, STM Study of the Growth of Cerium Oxide Nanoparticles
on Au(111), Surf. Sci., 602 (2008) 3272-3278.
[18] D.R. Mullins, The Surface Chemistry of Cerium Oxide, Surf. Sci. Rep., 70 (2015) 42-85.
[19] J.L. Lu, H.J. Gao, S. Shaikhutdinov, H.J. Freund, Morphology and Defect Structure of the
CeO2(111) Films Grown on Ru(0001) as Studied by Scanning Tunneling Microscopy, Surf. Sci.,
600 (2006) 5004-5010.
[20] J. Zhou, A.P. Baddorf, D.R. Mullins, S.H. Overbury, Growth and Characterization of Rh
and Pd Nanoparticles on Oxidized and Reduced CeOx(111) Thin Films by Scanning Tunneling
Microscopy, J. Phys. Chem. C, 112 (2008) 9336-9345.
[21] S. Gritschneder, M. Reichling, Structural Elements of CeO2(111) Surfaces,
Nanotechnology, 18 (2007) 044024.
[22] M.A. Barteau, Organic Reactions at Well-Defined Oxide Surfaces, Chem. Rev., 96 (1996)
1413-1430.
[23] M.I. Zaki, M.A. Hasan, L. Pasupulety, Surface Reactions of Acetone on Al2O3, TiO2, ZrO2,
and CeO2: IR Spectroscopic Assessment of Impacts of the Surface Acid−Base Properties,
Langmuir, 17 (2001) 768-774.

86
[24] M.J. Climent, A. Corma, S. Iborra, A. Velty, Designing the Adequate Base Solid Catalyst
with Lewis or Brønsted Basic Sites or with Acid–Base Pairs, J. Mol. Catal. A: Chem., 182-183
(2002) 327-342.
[25] R.W. Snell, E. Combs, B.H. Shanks, Aldol Condensations Using Bio-Oil Model
Compounds: The Role of Acid–Base Bi-Functionality, Top. Catal., 53 (2010) 1248-1253.
[26] S. Wang, K. Goulas, E. Iglesia, Condensation and Esterification Reactions of Alkanals,
Alkanones, and Alkanols on TiO2: Elementary Steps, Site Requirements, and Synergistic Effects
of Bifunctional Strategies, J. Catal., 340 (2016) 302-320.
[27] J.L.F. Da Silva, Stability of the Ce2O3 Phases: A DFT + U Investigation, Phys. Rev. B, 76
(2007) 193108.
[28] M. Zinkevich, D. Djurovic, F. Aldinger, Thermodynamic Modelling of the Cerium–Oxygen
System, Solid State Ionics, 177 (2006) 989-1001.
[29] R.J. Ackermann, E.G. Rauh, A High-Temperature Study of the Stoichiometry, Phase
Behavior, Vaporization Characteristics, and Thermodynamic Properties of the Cerium + Oxygen
System, J. Chem. Thermodyn., 3 (1971) 609-624.
[30] M.D. Watson, Phase Equilibrium for Solid and Molten CeO2−x Above 1500 °C, Ph.D.
Thesis, Georgia Institute of Technology (1977).
[31] N.V. Skorodumova, S.I. Simak, B.I. Lundqvist, I.A. Abrikosov, B. Johansson, Quantum
Origin of the Oxygen Storage Capability of Ceria, Phys. Rev. Lett., 89 (2002) 166601.
[32] T. Duchoň, F. Dvořák, M. Aulická, V. Stetsovych, M. Vorokhta, D. Mazur, K. Veltruská, T.
Skála, J. Mysliveček, I. Matolínová, V. Matolín, Ordered Phases of Reduced Ceria As Epitaxial
Films on Cu(111), J. Phys. Chem. C, 118 (2014) 357-365.
[33] R. Olbrich, G.E. Murgida, V. Ferrari, C. Barth, A.M. Llois, M. Reichling, M.V. Ganduglia-
Pirovano, Surface Stabilizes Ceria in Unexpected Stoichiometry, J. Phys. Chem. C, 121 (2017)
6844-6851.
[34] F. Dvořák, L. Szabová, V. Johánek, M. Farnesi Camellone, V. Stetsovych, M. Vorokhta, A.
Tovt, T. Skála, I. Matolínová, Y. Tateyama, J. Mysliveček, S. Fabris, V. Matolín, Bulk
Hydroxylation and Effective Water Splitting by Highly Reduced Cerium Oxide: The Role of O
Vacancy Coordination, ACS Catal., 8 (2018) 4354-4363.
87
[35] I. Chorkendorff, J.W. Niemantsverdriet, Concepts of Modern Catalysis and Kinetics, Wiley-
VCH, Weinheim, 2003.
[36] R.A. van Santen, M. Neurock, Molecular Heterogeneous Catalysis, Wiley-VCH, Weinheim,
2006.
[37] G. Ertl, Reactions at Solid Surfaces, John Wiley & Sons, Hoboken, 2009.
[38] J.K. Nørskov, F. Studt, F. Abild‐Pedersen, T. Bligaard, Fundamental Concepts in
Heterogeneous Catalysis, John Wiley & Sons, Hoboken, 2014.
[39] T.X.T. Sayle, S.C. Parker, D.C. Sayle, Shape of CeO2 Nanoparticles Using Simulated
Amorphisation and Recrystallisation, Chem. Commun., 0 (2004) 2438-2439.
[40] A. Trovarelli, P. Fornasiero, Catalysis by Ceria and Related Materials, 2nd ed., Imperial
College Press, London, 2013.
[41] A. Trovarelli, C. de Leitenburg, M. Boaro, G. Dolcetti, The Utilization of Ceria in Industrial
Catalysis, Catal. Today, 50 (1999) 353-367.
[42] J.A. Rodriguez, D.C. Grinter, Z. Liu, R.M. Palomino, S.D. Senanayake, Ceria-Based Model
Catalysts: Fundamental Studies on the Importance of the Metal-Ceria Interface in CO Oxidation,
the Water-Gas Shift, CO2 Hydrogenation, and Methane and Alcohol Reforming, Chem. Soc.
Rev., 46 (2017) 1824-1841.
[43] J. Paier, C. Penschke, J. Sauer, Oxygen Defects and Surface Chemistry of Ceria: Quantum
Chemical Studies Compared to Experiment, Chem. Rev., 113 (2013) 3949-3985.
[44] Y.-G. Wang, D. Mei, V.-A. Glezakou, J. Li, R. Rousseau, Dynamic Formation of Single-
Atom Catalytic Active Sites on Ceria-Supported Gold Nanoparticles, Nat. Commun., 6 (2015)
6511.
[45] M.F. Camellone, F.R. Negreiros, L. Szabová, Y. Tateyama, S. Fabris, Catalytic Proton
Dynamics at the Water/Solid Interface of Ceria-Supported Pt Clusters, J. Am. Chem. Soc., 138
(2016) 11560-11567.
88
[46] D.C. Sayle, X. Feng, Y. Ding, Z.L. Wang, T.X.T. Sayle, “Simulating Synthesis”: Ceria
Nanosphere Self-Assembly into Nanorods and Framework Architectures, J. Am. Chem. Soc.,
129 (2007) 7924-7935.
[47] A. Trovarelli, Catalytic Properties of Ceria and CeO2-Containing Materials, Catal. Rev., 38
(1996) 439-520.
[48] P. Granger, L. Delannoy, J.J. Lecomte, C. Dathy, H. Praliaud, L. Leclercq, G. Leclercq,
Kinetics of the CO+NO Reaction over Bimetallic Platinum–Rhodium on Alumina: Effect of
Ceria Incorporation into Noble Metals, J. Catal., 207 (2002) 202-212.
[49] P. Bera, K.C. Patil, V. Jayaram, G.N. Subbanna, M.S. Hegde, Ionic Dispersion of Pt and Pd
on CeO2 by Combustion Method: Effect of Metal–Ceria Interaction on Catalytic Activities for
NO Reduction and CO and Hydrocarbon Oxidation, J. Catal., 196 (2000) 293-301.
[50] K. Momma, F. Izumi, VESTA: A Three-Dimensional Visualization System for Electronic
and Structural Analysis, J. Appl. Crystallogr., 41 (2008) 653-658.
[51] D. Mohan, C.U. Pittman, P.H. Steele, Pyrolysis of Wood/Biomass for Bio-Oil: A Critical
Review, Energ. Fuel, 20 (2006) 848-889.
[52] G.W. Huber, S. Iborra, A. Corma, Synthesis of Transportation Fuels from Biomass:
Chemistry, Catalysts, and Engineering, Chem. Rev., 106 (2006) 4044-4098.
[53] D.M. Alonso, J.Q. Bond, J.A. Dumesic, Catalytic Conversion of Biomass to Biofuels, Green
Chem., 12 (2010) 1493-1513.
[54] M. Pruski, A.D. Sadow, I.I. Slowing, C.L. Marshall, P. Stair, J.A. Rodriguez, A. Harris,
G.A. Somorjai, J. Biener, C. Matranga, C. Wang, J.A. Schaidle, G.T. Beckham, D.A. Ruddy, T.
Deutsch, S.M. Alia, C. Narula, S.H. Overbury, T. Toops, R.M. Bullock, C.H.F. Peden, Y. Wang,
M.D. Allendorf, J. Nørskov, T. Bligaard, Virtual Special Issue on Catalysis at the U.S.
Department of Energy’s National Laboratories, ACS Catal., 6 (2016) 3227-3235.
[55] M. Langholtz, B. Stokes, L. Eaton, 2016 Billion-Ton Report: Advancing Domestic
Resources for a Thriving Bioeconomy, 1 (2016) 1-411.
[56] G.W. Huber, J.A. Dumesic, An Overview of Aqueous-Phase Catalytic Processes for
Production of Hydrogen and Alkanes in a Biorefinery, Catal. Today, 111 (2006) 119-132.
89
[57] H. Idriss, C. Diagne, J.P. Hindermann, A. Kiennemann, M.A. Barteau, Reactions of
Acetaldehyde on CeO2 and CeO2-Supported Catalysts, J. Catal., 155 (1995) 219-237.
[58] T.S. Hendren, K.M. Dooley, Kinetics of Catalyzed Acid/Acid and Acid/Aldehyde
Condensation Reactions to Non-Symmetric Ketones, Catal. Today, 85 (2003) 333-351.
[59] E.I. Gürbüz, E.L. Kunkes, J.A. Dumesic, Integration of C-C Coupling Reactions of
Biomass-Derived Oxygenates to Fuel-Grade Compounds, Appl. Catal., B, 94 (2010) 134-141.
[60] A. Gangadharan, M. Shen, T. Sooknoi, D.E. Resasco, R.G. Mallinson, Condensation
Reactions of Propanal over CexZr1−xO2 Mixed Oxide Catalysts, Appl. Catal., A, 385 (2010) 80-
91.
[61] J.I. Di Cosimo, G. Torres, C.R. Apesteguıa, One-Step MIBK Synthesis: A New Process
from 2-Propanol, J. Catal., 208 (2002) 114-123.
[62] L. Vivier, D. Duprez, Ceria-Based Solid Catalysts for Organic Chemistry, ChemSusChem, 3
(2010) 654-678.
[63] C.A. Gaertner, J.C. Serrano-Ruiz, D.J. Braden, J.A. Dumesic, Catalytic Coupling of
Carboxylic Acids by Ketonization as a Processing Step in Biomass Conversion, J. Catal., 266
(2009) 71-78.
[64] S.D. Randery, J.S. Warren, K.M. Dooley, Cerium Oxide-Based Catalysts for Production of
Ketones by Acid Condensation, Appl. Catal., A, 226 (2002) 265-280.
[65] K.M. Dooley, A.K. Bhat, C.P. Plaisance, A.D. Roy, Ketones from Acid Condensation Using
Supported CeO2 Catalysts: Effect of Additives, Appl. Catal., A, 320 (2007) 122-133.
[66] O. Neunhoeffer, P. Paschke, About the mechanism of ketone formation from carboxylic
acids, Chem. Ber., 72 (1939) 919-929.
[67] T.N. Pham, D. Shi, T. Sooknoi, D.E. Resasco, Aqueous-Phase Ketonization of Acetic Acid
Over Ru/TiO2/Carbon Catalysts, J. Catal., 295 (2012) 169-178.
[68] T.N. Pham, T. Sooknoi, S.P. Crossley, D.E. Resasco, Ketonization of Carboxylic Acids:
Mechanisms, Catalysts, and Implications for Biomass Conversion, ACS Catal., 3 (2013) 2456-
2473.
90
[69] M. Boudart, Turnover Rates in Heterogeneous Catalysis, Chem. Rev., 95 (1995) 661-666.
[70] S.D. Senanayake, D.R. Mullins, Redox Pathways for HCOOH Decomposition over CeO2
Surfaces, J. Phys. Chem. C, 112 (2008) 9744-9752.
[71] W.O. Gordon, Y. Xu, D.R. Mullins, S.H. Overbury, Temperature Evolution of Structure and
Bonding of Formic Acid and Formate on Fully Oxidized and Highly Reduced CeO2(111), Phys.
Chem. Chem. Phys., 11 (2009) 11171-11183.
[72] D.R. Mullins, S.D. Senanayake, T.L. Chen, Adsorption and Reaction of C1-C3 Alcohols
Over CeOx(111) Thin Films, J. Phys. Chem. C, 114 (2010) 17112-17119.
[73] T.L. Chen, D.R. Mullins, Adsorption and Reaction of Acetaldehyde Over CeOx(111) Thin
Films, J. Phys. Chem. C, 115 (2011) 3385-3392.
[74] D.R. Mullins, P.M. Albrecht, T.L. Chen, F.C. Calaza, M.D. Biegalski, H.M. Christen, S.H.
Overbury, Water Dissociation on CeO2(100) and CeO2(111) Thin Films, J. Phys. Chem. C, 116
(2012) 19419-19428.
[75] F.C. Calaza, Y. Xu, D.R. Mullins, S.H. Overbury, Oxygen Vacancy-Assisted Coupling and
Enolization of Acetaldehyde on CeO2(111), J. Am. Chem. Soc., 134 (2012) 18034-18045.
[76] F.C. Calaza, T.L. Chen, D.R. Mullins, Y. Xu, S.H. Overbury, Reactivity and Reaction
Intermediates for Acetic Acid Adsorbed on CeO2(111), Catal. Today, 253 (2015) 65-76.
[77] C. Zhao, Y. Xu, Simulated Temperature Programmed Desorption of Acetaldehyde on
CeO2(111): Evidence for the Role of Oxygen Vacancy and Hydrogen Transfer, Top. Catal., 60
(2017) 446-458.
[78] A.K.P. Mann, Z. Wu, F.C. Calaza, S.H. Overbury, Adsorption and Reaction of
Acetaldehyde on Shape-Controlled CeO2 Nanocrystals: Elucidation of Structure–Function
Relationships, ACS Catal., 4 (2014) 2437-2448.
[79] D. Cordell, J.O. Drangert, S. White, The Story of Phosphorus: Global Food Security and
Food for Thought, Global Environ. Chang., 19 (2009) 292-305.
[80] L. Reijnders, Phosphorus Resources, Their Depletion and Conservation, a Review, Resour.
Conserv. Recy., 93 (2014) 32-49.
91
[81] S.R. Carpenter, Phosphorus Control Is Critical to Mitigating Eutrophication, Proc. Natl.
Acad. Sci. U. S. A., 105 (2008) 11039-11040.
[82] S.A. Parsons, J.A. Smith, Phosphorus Removal and Recovery from Municipal Wastewaters,
Elements, 4 (2008) 109-112.
[83] B.K. Mayer, L.A. Baker, T.H. Boyer, P. Drechsel, M. Gifford, M.A. Hanjra, P.
Parameswaran, J. Stoltzfus, P. Westerhoff, B.E. Rittmann, Total Value of Phosphorus Recovery,
Environ. Sci. Technol., 50 (2016) 6606-6620.
[84] V.H. Freed, C.T. Chiou, D.W. Schmedding, Degradation of Selected Organophosphate
Pesticides in Water and Soil, J. Agr. Food Chem., 27 (1979) 706-708.
[85] C. Lad, N.H. Williams, R. Wolfenden, The Rate of Hydrolysis of Phosphomonoester
Dianions and the Exceptional Catalytic Proficiencies of Protein and Inositol Phosphatases, Proc.
Natl. Acad. Sci. U. S. A., 100 (2003) 5607-5610.
[86] B.K. Singh, A. Walker, Microbial Degradation of Organophosphorus Compounds, Fems.
Microbiol. Rev., 30 (2006) 428-471.
[87] F. Tan, Y. Zhang, J. Wang, J. Wei, Y. Cai, X. Qian, An Efficient Method for
Dephosphorylation of Phosphopeptides by Cerium Oxide, J. Mass Spectrom., 43 (2008) 628-
632.
[88] M.H. Kuchma, C.B. Komanski, J. Colon, A. Teblum, A.E. Masunov, B. Alvarado, S. Babu,
S. Seal, J. Summy, C.H. Baker, Phosphate Ester Hydrolysis of Biologically Relevant Molecules
by Cerium Oxide Nanoparticles, Nanomed-Nanotechnol., 6 (2010) 738-744.
[89] P. Janos, P. Kuran, M. Kormunda, V. Stengl, T.M. Grygar, M. Dosek, M. Stastny, J. Ederer,
V. Pilarova, L. Vrtoch, Cerium Dioxide as a New Reactive Sorbent for Fast Degradation of
Parathion Methyl and Some Other Organophosphates, J. Rare Earth, 32 (2014) 360-370.
[90] P. Janos, P. Kuran, V. Pilarova, J. Trogl, M. Stastny, O. Pelant, J. Henych, S. Bakardjieva,
O. Zivotsky, M. Kormunda, K. Mazanec, M. Skoumal, Magnetically Separable Reactive Sorbent
Based on the CeO2/γ-Fe2O3 Composite and Its Utilization for Rapid Degradation of the
Organophosphate Pesticide parathion Methyl and Certain Nerve Agents, Chem. Eng. J., 262
(2015) 747-755.
92
[91] M.J. Manto, P.F. Xie, C. Wang, Catalytic Dephosphorylation Using Ceria Nanocrystals,
ACS Catal., 7 (2017) 1931-1938.
[92] J.K. Lassila, J.G. Zalatan, D. Herschlag, Biological Phosphoryl-Transfer Reactions:
Understanding Mechanism and Catalysis, Annul. Rev. Biochem., 80 (2011) 669-702.
[93] J. Florian, A. Warshel, A Fundamental Assumption About OH- Attack in Phosphate Ester
Hydrolysis Is Not Fully Justified, J. Am. Chem. Soc., 119 (1997) 5473-5474.
[94] J. Florian, A. Warshel, Phosphate Ester Hydrolysis in Aqueous Solution: Associative versus
Dissociative Mechanisms, J. Phys. Chem. B, 102 (1998) 719-734.
[95] M. Klähn, E. Rosta, A. Warshel, On the Mechanism of Hydrolysis of Phosphate Monoesters
Dianions in Solutions and Proteins, J. Am. Chem. Soc., 128 (2006) 15310-15323.
[96] S.C.L. Kamerlin, N.H. Williams, A. Warshel, Dineopentyl Phosphate Hydrolysis: Evidence
for Stepwise Water Attack, J. Org. Chem., 73 (2008) 6960-6969.
[97] B.R. Prasad, N.V. Plotnikov, A. Warshel, Addressing Open Questions About Phosphate
Hydrolysis Pathways by Careful Free Energy Mapping, J. Phys. Chem. B, 117 (2013) 153-163.
[98] S.C.L. Kamerlin, P.K. Sharma, R.B. Prasad, A. Warshel, Why Nature Really Chose
Phosphate, Q. Rev. Biophys., 46 (2013) 1-132.
[99] F. Duarte, A. Barrozo, J. Aqvist, N.H. Williams, S.C.L. Kamerlin, The Competing
Mechanisms of Phosphate Monoester Dianion Hydrolysis, J. Am. Chem. Soc., 138 (2016)
10664-10673.
[100] C.N. Rusu, J.T. Yates, Adsorption and Decomposition of Dimethyl Methylphosphonate on
TiO2, J. Phys. Chem. B, 104 (2000) 12292-12298.
[101] D.A. Chen, J.S. Ratliff, X. Hu, W.O. Gordon, S.D. Senanayake, D.R. Mullins, Dimethyl
Methylphosphonate Decomposition on Fully Oxidized and Partially Reduced Ceria Thin Films,
Surf. Sci., 604 (2010) 574-587.
[102] G. Wang, C. Sharp, A.M. Plonka, Q. Wang, A.I. Frenkel, W. Guo, C. Hill, C. Smith, J.
Kollar, D. Troya, J.R. Morris, Mechanism and Kinetics for Reaction of the Chemical Warfare

93
Agent Simulant, DMMP(g), with Zirconium(IV) MOFs: An Ultrahigh-Vacuum and DFT Study,
J. Phys. Chem. C, 121 (2017) 11261-11272.
[103] Q. Wang, R.C. Chapleski, A.M. Plonka, W.O. Gordon, W. Guo, T.-D. Nguyen-Phan, C.H.
Sharp, N.S. Marinkovic, S.D. Senanayake, J.R. Morris, C.L. Hill, D. Troya, A.I. Frenkel,
Atomic-Level Structural Dynamics of Polyoxoniobates During DMMP Decomposition, Sci. Rep.
-U. K., 7 (2017) 773.
[104] L. Trotochaud, R. Tsyshevsky, S. Holdren, K. Fears, A.R. Head, Y. Yu, O. Karslıoğlu, S.
Pletincx, B. Eichhorn, J. Owrutsky, J. Long, M. Zachariah, M.M. Kuklja, H. Bluhm,
Spectroscopic and Computational Investigation of Room-Temperature Decomposition of a
Chemical Warfare Agent Simulant on Polycrystalline Cupric Oxide, Chem. Mater., 29 (2017)
7483-7496.
[105] C.A. Bunton, D.R. Llewellyn, K.G. Oldham, C.A. Vernon, The Reactions of Organic
Phosphates: 1. The Hydrolysis of Methyl Dihydrogen Phosphate, J. Chem. Soc., 0 (1958) 3574-
3587.
[106] K.D. Kwon, J.D. Kubicki, Molecular Orbital Theory Study on Surface Complex Structures
of Phosphates to Iron Hydroxides: Calculation of Vibrational Frequencies and Adsorption
Energies, Langmuir, 20 (2004) 9249-9254.
[107] G. Kresse, J. Furthmuller, Efficient Iterative Schemes for Ab Initio Total-Energy
Calculations Using a Plane-Wave Basis Set, Phys. Rev. B, 54 (1996) 11169-11186.
[108] J.P. Perdew, J. Chevary, S. Vosko, K.A. Jackson, M.R. Pederson, D. Singh, C. Fiolhais,
Atoms, Molecules, Solids, and Surfaces: Applications of the Generalized Gradient
Approximation for Exchange and Correlation, Phys. Rev. B, 46 (1992) 6671.
[109] J. Klimeš, D.R. Bowler, A. Michaelides, Chemical Accuracy for the van der Waals
Density Functional, J. Phys. -Condens. Mat., 22 (2010) 022201.
[110] J. Klimeš, D.R. Bowler, A. Michaelides, Van der Waals Density Functionals Applied to
Solids, Phys. Rev. B, 83 (2011) 195131.
[111] G. Kresse, D. Joubert, From Ultrasoft Pseudopotentials to the Projector Augmented-Wave
Method, Phys. Rev. B, 59 (1999) 1758-1775.

94
[112] G. Henkelman, B.P. Uberuaga, H. Jónsson, A Climbing Image Nudged Elastic Band
Method for Finding Saddle Points and Minimum Energy Paths, J. Chem. Phys., 113 (2000)
9901-9904.
[113] S. Smidstrup, A. Pedersen, K. Stokbro, H. Jonsson, Improved Initial Guess for Minimum
Energy Path Calculations, J. Chem. Phys., 140 (2014).
[114] G. Henkelman, H. Jónsson, A Dimer Method for Finding Saddle Points on High
Dimensional Potential Surfaces Using Only First Derivatives, J. Chem. Phys., 111 (1999) 7010-
7022.
[115] A. Heyden, A.T. Bell, F.J. Keil, Efficient Methods for Finding Transition States in
Chemical Reactions: Comparison of Improved Dimer Method and Partitioned Rational Function
Optimization Method, J. Chem. Phys., 123 (2005) 224101.
[116] S.L. Dudarev, G.A. Botton, S.Y. Savrasov, C.J. Humphreys, A.P. Sutton, Electron-Energy-
Loss Spectra and the Structural Stability of Nickel Oxide: An LSDA+U Study, Phys. Rev. B, 57
(1998) 1505-1509.
[117] G. Kresse, P. Blaha, J.L.F. Da Silva, M.V. Ganduglia-Pirovano, Comment on “Taming
Multiple Valency with Density Functionals: A Case Study of Defective Ceria”, Phys. Rev. B, 72
(2005) 237101.
[118] P. Redhead, Thermal Desorption of Gases, Vacuum, 12 (1962) 203-211.
[119] C. Loschen, J. Carrasco, K.M. Neyman, F. Illas, First-Principles LDA+U and GGA+U
Study of Cerium Oxides: Dependence on the Effective U Parameter, Phys. Rev. B, 75 (2007)
035115.
[120] S. Lutfalla, V. Shapovalov, A.T. Bell, Calibration of the DFT/GGA+U Method for
Determination of Reduction Energies for Transition and Rare Earth Metal Oxides of Ti, V, Mo,
and Ce, J. Chem. Theory Comput., 7 (2011) 2218-2223.
[121] S. Fabris, G. Vicario, G. Balducci, S. de Gironcoli, S. Baroni, Electronic and Atomistic
Structures of Clean and Reduced Ceria Surfaces, J. Phys. Chem. B, 109 (2005) 22860-22867.
[122] D.Y. Lu, P. Liu, Rationalization of the Hubbard U Parameter in CeOx from First
Principles: Unveiling the Role of Local Structure in Screening, J. Chem. Phys., 140 (2014)
084101.

95
[123] J. Neugebauer, M. Scheffler, Adsorbate-Substrate and Adsorbate-Adsorbate Interactions of
Na and K Adlayers on Al (111), Phys. Rev. B, 46 (1992) 16067.
[124] J. Conesa, Computer Modeling of Surfaces and Defects on Cerium Dioxide, Surf. Sci., 339
(1995) 337-352.
[125] N.V. Skorodumova, M. Baudin, K. Hermansson, Surface Properties of CeO2 from First
Principles, Phys. Rev. B, 69 (2004) 075401.
[126] M. Nolan, S. Grigoleit, D.C. Sayle, S.C. Parker, G.W. Watson, Density Functional Theory
Studies of the Structure and Electronic Structure of Pure and Defective Low Index Surfaces of
Ceria, Surf. Sci., 576 (2005) 217-229.
[127] A.D. Mayernick, M.J. Janik, Methane Activation and Oxygen Vacancy Formation over
CeO2 and Zr, Pd Substituted CeO2 Surfaces, J. Phys. Chem. C, 112 (2008) 14955-14964.
[128] T. Kropp, J. Paier, J. Sauer, Interactions of Water with the (111) and (100) Surfaces of
Ceria, J. Phys. Chem. C, 121 (2017) 21571-21578.
[129] F. Esch, S. Fabris, L. Zhou, T. Montini, C. Africh, P. Fornasiero, G. Comelli, R. Rosei,
Electron Localization Determines Defect Formation on Ceria Substrates, Science, 309 (2005)
752-755.
[130] J. Kullgren, M.J. Wolf, C.W.M. Castleton, P. Mitev, W.J. Briels, K. Hermansson, Oxygen
Vacancies versus Fluorine at CeO2(111): A Case of Mistaken Identity?, Phys. Rev. Lett., 112
(2014) 156102.
[131] H.J. Monkhorst, J.D. Pack, Special Points for Brillouin-Zone Integrations, Phys. Rev. B,
13 (1976) 5188-5192.
[132] J. Heyd, G.E. Scuseria, M. Ernzerhof, Erratum: “Hybrid Functionals Based on a Screened
Coulomb Potential” [J. Chem. Phys. 118, 8207 (2003)], J. Chem. Phys., 124 (2006) 219906.
[133] L. Gerward, J. Staun Olsen, L. Petit, G. Vaitheeswaran, V. Kanchana, A. Svane, Bulk
Modulus of CeO2 and PrO2—An Experimental and Theoretical Study, J. Alloys Compd., 400
(2005) 56-61.
96
[134] P.J. Hay, R.L. Martin, J. Uddin, G.E. Scuseria, Theoretical Study of CeO2 and Ce2O3
Using a Screened Hybrid Density Functional, J. Chem. Phys., 125 (2006) 034712.
[135] E. Wuilloud, B. Delley, W.D. Schneider, Y. Baer, Spectroscopic Evidence for Localized
and Extended f-Symmetry States in CeO2, Phys. Rev. Lett., 53 (1984) 202-205.
[136] G.-y. Adachi, N. Imanaka, The Binary Rare Earth Oxides, Chem. Rev., 98 (1998) 1479-
1514.
[137] A.V. Prokofiev, A.I. Shelykh, B.T. Melekh, Periodicity in the Band Gap Variation of
Ln2X3 (X = O, S, Se) in the Lanthanide Series, J. Alloys Compd., 242 (1996) 41-44.
[138] L. Köhler, G. Kresse, Density Functional Study of CO on Rh(111), Phys. Rev. B, 70
(2004) 165405.
[139] J.I. Steinfeld, J.S. Francisco, W.L. Hase, Chemical Kinetics and Dynamics, Prentice
Hall1999.
[140] M.P. Andersson, E. Abild-Pedersen, I.N. Remediakis, T. Bligaard, G. Jones, J. Engbæk, O.
Lytken, S. Horch, J.H. Nielsen, J. Sehested, J.R. Rostrup-Nielsen, J.K. Nørskov, I. Chorkendorff,
Structure Sensitivity of the Methanation Reaction: H2-Induced CO Dissociation on Nickel
Surfaces, J. Catal., 255 (2008) 6-19.
[141] H. Olcay, Y. Xu, G.W. Huber, Effects of Hydrogen and Water on the Activity and
Selectivity of Acetic Acid Hydrogenation on Ruthenium, Green Chem., 16 (2014) 911-924.
[142] Z. Wu, M. Li, J. Howe, H.M. Meyer, S.H. Overbury, Probing Defect Sites on CeO2
Nanocrystals with Well-Defined Surface Planes by Raman Spectroscopy and O2 Adsorption,
Langmuir, 26 (2010) 16595-16606.
[143] T. Mizukami, Physico-Chemical Studies on Acetaldehyde Polymerization at High Pressure
and Low Temperature: 2. Kinetics of Polymerization of Acetaldehyde, Rev. Phys. Chem. Jpn.,
35 (1965) 60.
[144] J.L. Davis, M.A. Barteau, Polymerization and Decarbonylation Reactions of Aldehydes on
the Pd(111) Surface, J. Am. Chem. Soc., 111 (1989) 1782-1792.
97
[145] J. Carrasco, G. Vilé, D. Fernandez-Torre, R. Pérez, J. Pérez-Ramírez, M.V. Ganduglia-
Pirovano, Molecular-Level Understanding of CeO2 as a Catalyst for Partial Alkyne
Hydrogenation, J. Phys. Chem. C, 118 (2014) 5352-5360.
[146] G. Vicario, G. Balducci, S. Fabris, S. de Gironcoli, S. Baroni, Interaction of Hydrogen
with Cerium Oxide Surfaces: A Quantum Mechanical Computational Study, J. Phys. Chem. B,
110 (2006) 19380-19385.
[147] C. Popa, M.V. Ganduglia-Pirovano, J. Sauer, Periodic Density Functional Theory Study of
VOn Species Supported on the CeO2(111) Surface, J. Phys. Chem. C, 115 (2011) 7399-7410.
[148] X.P. Wu, X.Q. Gong, G.Z. Lu, Role of Oxygen Vacancies in the Surface Evolution of H at
CeO2(111): A Charge Modification Effect, Phys. Chem. Chem. Phys., 17 (2015) 3544-3549.
[149] D.R. Mullins, P.M. Albrecht, F.C. Calaza, Variations in Reactivity on Different
Crystallographic Orientations of Cerium Oxide, Top. Catal., 56 (2013) 1345-1362.
[150] M.A. Christiansen, G. Mpourmpakis, D.G. Vlachos, DFT-Driven Multi-Site Microkinetic
Modeling of Ethanol Conversion to Ethylene and Diethyl Ether on γ-Al2O3(111), J. Catal., 323
(2015) 121-131.
[151] A. Beste, S.H. Overbury, Pathways for Ethanol Dehydrogenation and Dehydration
Catalyzed by Ceria (111) and (100) Surfaces, J. Phys. Chem. C, 119 (2015) 2447-2455.
[152] B.H. Chen, Y.S. Ma, L.B. Ding, L.S. Xu, Z.F. Wu, Q. Yuan, W.X. Huang, Reactivity of
Hydroxyls and Water on a CeO2(111) Thin Film Surface: the Role of Oxygen Vacancy, J. Phys.
Chem. C, 117 (2013) 5800-5810.
[153] D. Fernández-Torre, J. Carrasco, M.V. Ganduglia-Pirovano, R. Pérez, Hydrogen
Activation, Diffusion, and Clustering on CeO2(111): A DFT+U Study, J. Chem. Phys., 141
(2014) 014703.
[154] M. García-Melchor, N. López, Homolytic Products from Heterolytic Paths in H2
Dissociation on Metal Oxides: the Example of CeO2, J. Phys. Chem. C, 118 (2014) 10921-
10926.
[155] M.J. Gilkey, B.J. Xu, Heterogeneous Catalytic Transfer Hydrogenation as an Effective
Pathway in Biomass Upgrading, ACS Catal., 6 (2016) 1420-1436.
98
[156] C. Zhao, C. Watt, P.R. Kent, S.H. Overbury, D.R. Mullins, F.C. Calaza, A. Savara, Y. Xu,
Coupling of Acetaldehyde to Crotonaldehyde on CeO2-x(111): Bifunctional Mechanism and Role
of Oxygen Vacancies, J. Phys. Chem. C, XXX (2018) XXX-XXX.
[157] S. Torbrügge, M. Reichling, A. Ishiyama, S. Morita, Ó. Custance, Evidence of Subsurface
Oxygen Vacancy Ordering on Reduced CeO2(111), Phys. Rev. Lett., 99 (2007) 056101.
[158] Z. Yang, T.K. Woo, M. Baudin, K. Hermansson, Atomic and Electronic Structure of
Unreduced and Reduced CeO2 Surfaces: A First-Principles Study, J. Chem. Phys., 120 (2004)
7741-7749.
[159] M. Fronzi, A. Soon, B. Delley, E. Traversa, C. Stampfl, Stability and Morphology of
Cerium Oxide Surfaces in an Oxidizing Environment: A First-Principles Investigation, J. Chem.
Phys., 131 (2009) 104701.
[160] M.V. Ganduglia-Pirovano, J.L.F. Da Silva, J. Sauer, Density-Functional Calculations of
the Structure of Near-Surface Oxygen Vacancies and Electron Localization on CeO2(111), Phys.
Rev. Lett., 102 (2009) 026101.
[161] G.E. Murgida, M.V. Ganduglia-Pirovano, Evidence for Subsurface Ordering of Oxygen
Vacancies on the Reduced CeO2(111) Surface Using Density-Functional and Statistical
Calculations, Phys. Rev. Lett., 110 (2013) 246101.
[162] J.E. Sutton, A. Beste, S.H. Overbury, Origins and Implications of the Ordering of Oxygen
Vacancies and Localized Electrons on Partially Reduced CeO2(111), Phys. Rev. B, 92 (2015)
144105.
[163] J.C. Conesa, Surface Anion Vacancies on Ceria: Quantum Modelling of Mutual
Interactions and Oxygen Adsorption, Catal. Today, 143 (2009) 315-325.
[164] H.A. Hansen, C. Wolverton, Kinetics and Thermodynamics of H2O Dissociation on
Reduced CeO2(111), J. Phys. Chem. C, 118 (2014) 27402-27414.
[165] H.Y. Li, H.F. Wang, Y.L. Guo, G.Z. Lu, P. Hu, Exchange between Sub-Surface and
Surface Oxygen Vacancies on CeO2(111): A New Surface Diffusion Mechanism, Chem.
Commun., 47 (2011) 6105-6107.
99
[166] S. Wang, E. Iglesia, Experimental and Theoretical Evidence for the Reactivity of Bound
Intermediates in Ketonization of Carboxylic Acids and Consequences of Acid–Base Properties
of Oxide Catalysts, J. Phys. Chem. C, 121 (2017) 18030-18046.
[167] A.V. Ignatchenko, J.P. McSally, M.D. Bishop, J. Zweigle, Ab Initio Study of the
Mechanism of Carboxylic Acids Cross-Ketonization on Monoclinic Zirconia via Condensation
to beta-Keto Acids Followed by Decarboxylation, Mol. Catal., 441 (2017) 35-62.
[168] W. Tang, E. Sanville, G. Henkelman, A Grid-Based Bader Analysis Algorithm without
Lattice Bias, J. Phys. -Condens. Mat., 21 (2009).
[169] D. Marrocchelli, B. Yildiz, First-Principles Assessment of H2S and H2O Reaction
Mechanisms and the Subsequent Hydrogen Absorption on the CeO2(111) Surface, J. Phys.
Chem. C, 116 (2012) 2411-2424.
[170] D. Fernández-Torre, K. Kośmider, J. Carrasco, M.V. Ganduglia-Pirovano, R. Pérez,
Insight into the Adsorption of Water on the Clean CeO2(111) Surface with van der Waals and
Hybrid Density Functionals, J. Phys. Chem. C, 116 (2012) 13584-13593.
[171] Y. Marcus, Ion Properties, Marcel Dekker, New York, 1997.
[172] M. Śmiechowski, Theoretical Calculation of pKas of Phosphoric(V) Acid in the Polarisable
Continuum and Cluster-Continuum Models, J. Mol. Struct., 924 (2009) 170-174.
[173] K. Mathew, R. Sundararaman, K. Letchworth-Weaver, T.A. Arias, R.G. Hennig, Implicit
Solvation Model for Density-Functional Study of Nanocrystal Surfaces and Reaction Pathways,
J. Chem. Phys., 140 (2014) 8.
[174] B.N. Zope, D.D. Hibbitts, M. Neurock, R.J. Davis, Reactivity of the Gold/Water Interface
during Selective Oxidation Catalysis, Science, 330 (2010) 74-78.
[175] X. Nie, M.R. Esopi, M.J. Janik, A. Asthagiri, Selectivity of CO2 Reduction on Copper
Electrodes: The Role of the Kinetics of Elementary Steps, Angew. Chem. Int. Edit., 52 (2013)
2459-2462.
[176] C. Zhao, Y. Xu, Theoretical Investigation of Dephosphorylation of Phosphate Monoesters
on CeO2(111), Catal. Today, 312 (2018) 141-148.
100
[177] A.J. Kirby, F. Nome, Fundamentals of Phosphate Transfer, Accounts Chem. Res., 48
(2015) 1806-1814.
[178] D.R. Mullins, S.H. Overbury, D.R. Huntley, Electron Spectroscopy of Single Crystal and
Polycrystalline Cerium Oxide Surfaces, Surf. Sci., 409 (1998) 307-319.
[179] T. Duchoň, M. Aulická, E.F. Schwier, H. Iwasawa, C. Zhao, Y. Xu, K. Veltruská, K.
Shimada, V. Matolín, Covalent versus Localized Nature of 4f Electrons in Ceria: Resonant
Angle-Resolved Photoemission Spectroscopy and Density Functional Theory, Phys. Rev. B, 95
(2017) 165124.
101
APPENDIX. COPYRIGHT INFORMATION
Springer Nature:
Springer Nature Customer Service Centre GmbH (the Licensor) hereby grants you a non-
exclusive, world-wide licence to reproduce the material and for the purpose and requirements
specified in the attached copy of your order form, and for no other use, subject to the conditions
below:
1. The Licensor warrants that it has, to the best of its knowledge, the rights to license reuse of
this material. However, you should ensure that the material you are requesting is original to
the Licensor and does not carry the copyright of another entity (as credited in the published
version). If the credit line on any part of the material you have requested indicates that it was
reprinted or adapted with permission from another source, then you should also seek
permission from that source to reuse the material.
2. Where print only permission has been granted for a fee, separate permission must be
obtained for any additional electronic re-use.
3. Permission granted free of charge for material in print is also usually granted for any
electronic version of that work, provided that the material is incidental to your work as a
whole and that the electronic version is essentially equivalent to, or substitutes for, the print
version.
4. A licence for 'post on a website' is valid for 12 months from the licence date. This licence
does not cover use of full text articles on websites.
102
5. Where 'reuse in a dissertation/thesis' has been selected the following terms apply: Print rights
of the final author's accepted manuscript (for clarity, NOT the published version) for up to
100 copies, electronic rights for use only on a personal website or institutional repository as
defined by the Sherpa guideline (www.sherpa.ac.uk/romeo/).
6. Permission granted for books and journals is granted for the lifetime of the first edition and
does not apply to second and subsequent editions (except where the first edition permission
was granted free of charge or for signatories to the STM Permissions Guidelines
http://www.stm-assoc.org/copyright-legal-affairs/permissions/permissions-guidelines/), and
does not apply for editions in other languages unless additional translation rights have been
granted separately in the licence.
7. Rights for additional components such as custom editions and derivatives require additional
permission and may be subject to an additional fee. Please apply to
[email protected]/[email protected] for these
rights.
8. The Licensor's permission must be acknowledged next to the licensed material in print. In
electronic form, this acknowledgement must be visible at the same time as the
figures/tables/illustrations or abstract, and must be hyperlinked to the journal/book's
homepage. Our required acknowledgement format is in the Appendix below.
9. Use of the material for incidental promotional use, minor editing privileges (this does not
include cropping, adapting, omitting material or any other changes that affect the meaning,
intention or moral rights of the author) and copies for the disabled are permitted under this
licence.
103
10. Minor adaptations of single figures (changes of format, colour and style) do not require the
Licensor's approval. However, the adaptation should be credited as shown in Appendix
below.
American Chemical Society:
PERMISSION/LICENSE IS GRANTED FOR YOUR ORDER AT NO CHARGE
This type of permission/license, instead of the standard Terms & Conditions, is sent to you
because no fee is being charged for your order. Please note the following:
▪ Permission is granted for your request in both print and electronic formats, and translations.
▪ If figures and/or tables were requested, they may be adapted or used in part.
▪ Please print this page for your records and send a copy of it to your publisher/graduate
school.
▪ Appropriate credit for the requested material should be given as follows: "Reprinted
(adapted) with permission from (COMPLETE REFERENCE CITATION). Copyright
(YEAR) American Chemical Society." Insert appropriate information in place of the
capitalized words.
▪ One-time permission is granted only for the use specified in your request. No additional uses
are granted (such as derivative works or other editions). For any other uses, please submit a
new request.
104
Elsevier:
Please note that, as the author of this Elsevier article, you retain the right to include it in a thesis
or dissertation, provided it is not published commercially. Permission is not required, but please
ensure that you reference the journal as the original source. For more information on this and on
your other retained rights, please visit: https://www.elsevier.com/about/our-
business/policies/copyright#Author-rights.
American Physical Society:
The American Physical Society (APS) is pleased to grant the Requestor of this license a non-
exclusive, non-transferable permission, limited to Electronic format, provided all criteria
outlined below are followed.
1. You must also obtain permission from at least one of the lead authors for each separate work,
if you haven’t done so already. The author's name and affiliation can be found on the first page
of the published Article.
2. For electronic format permissions, Requestor agrees to provide a hyperlink from the reprinted
APS material using the source material’s DOI on the web page where the work appears. The
hyperlink should use the standard DOI resolution URL, http://dx.doi.org/{DOI}. The hyperlink
may be embedded in the copyright credit line.
3. For print format permissions, Requestor agrees to print the required copyright credit line on
the first page where the material appears: "Reprinted (abstract/excerpt/figure) with permission
from [(FULL REFERENCE CITAT ION) as follows:
Author's Names, APS Journal Title, Volume Number, Page Number and Year of Publication.]
Copyright (YEAR) by the American Physical Society."
105
4. Permission granted in this license is for a one-time use and does not include permission for
any future editions, updates, databases, formats or other matters. Permission must be sought for
any additional use.
5. Use of the material does not and must not imply any endorsement by APS.
6. APS does not imply, purport or intend to grant permission to reuse materials to which it does
not hold copyright. It is the requestor ’s sole responsibility to ensure the licensed material is
original to APS and does not contain the copyright of another entity, and that the copyright
notice of the figure, photograph, cover or table does not indicate it was reprinted by APS with
permission from another source.
7. The permission granted herein is personal to the Requestor for the use specified and is not
transferable or assignable without express written permission of APS. This license may not be
amended except in writing by APS.
8. You may not alter, edit or modify the material in any manner.
9. You may translate the materials only when translation rights have been granted.
10. APS is not responsible for any errors or omissions due to translation.
11. You may not use the material for promotional, sales, advertising or marketing purposes.
12. The foregoing license shall not take effect unless and until APS or its agent, Aptara, receives
payment in full in accordance with Aptara Billing and Payment Terms and Conditions, which are
incorporated herein by reference.
13. Should the terms of this license be violated at any time, APS or Aptara may revoke the
license with no refund to you and seek relief to the fullest extent of the laws of the USA. Official
written notice will be made using the contact information provided with the permission request.
Failure to receive such notice will not nullify revocation of the permission.

106
14. APS reserves all rights not specifically granted herein.
15. This document, including the Aptara Billing and Payment Terms and Conditions, shall be the
entire agreement between the parties relating to the subject matter hereof.
107
VITA
Chuanlin Zhao, was born and raised in the City of Jiamusi, Province of Heilongjiang, at the
northeastern region of China, though his family was originally from the City of Chengdu,
Province of Sichuan, at the southwestern region of China. He received a Bachelor of
Engineering from the Department of Chemical Engineering with a direction in Polymer
Engineering at Tianjin University, China. Then he directly went to the United States of America
for advanced intellectual training by means of participating in the Doctor of Philosophy program
in the Cain Department of Chemical Engineering at Louisiana State University. Upon
completion of his Ph.D. degree, he plans to continue to work in the field of catalysis research at
the fundamental level.