first nine months 2015 - danske bank€¦ · net income from insurance business 1,445 1,418 102 335...
TRANSCRIPT

29 October 2015
Thomas F. Borgen Chief Executive Officer
Financial results – first nine months 2015
Henrik Ramlau-Hansen Chief Financial Officer

2
Financial results for Q1 2013 Financial results – first nine months 2015
Agenda
Selected topics 7
Appendix 15
Executive summary and financial results 3
Q&A 14
Outlook for full-year 2015 12
Business unit update 5
3
Financial results for Q1 2013 Financial results – first nine months 2015
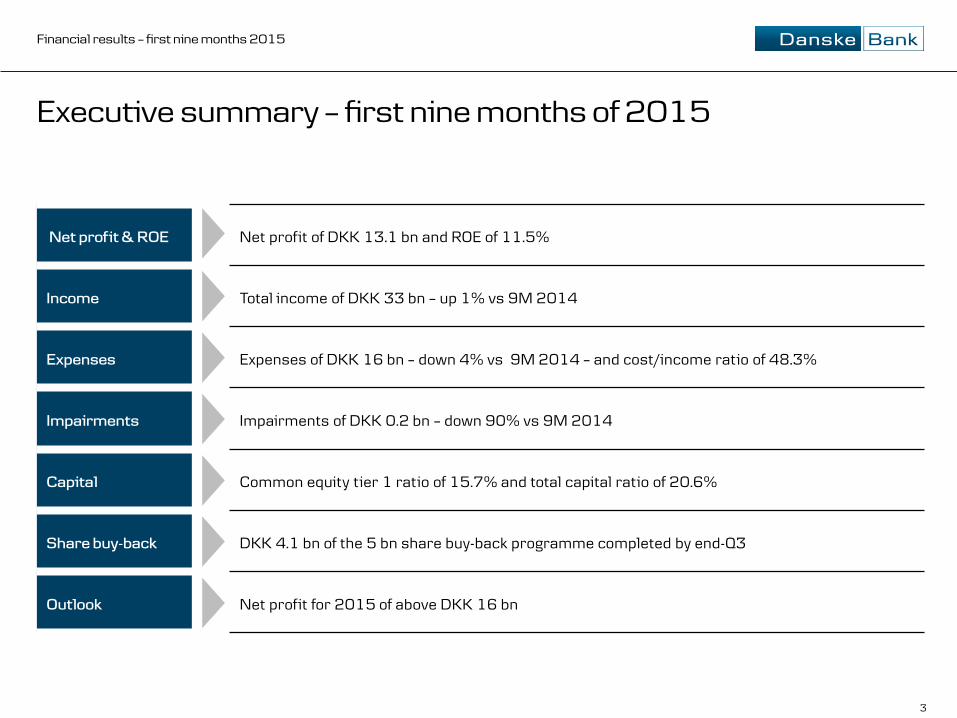
Executive summary – first nine months of 2015
Net profit & ROE Net profit of DKK 13.1 bn and ROE of 11.5%
Income Total income of DKK 33 bn – up 1% vs 9M 2014
Expenses Expenses of DKK 16 bn – down 4% vs 9M 2014 – and cost/income ratio of 48.3%
Impairments Impairments of DKK 0.2 bn – down 90% vs 9M 2014
Capital Common equity tier 1 ratio of 15.7% and total capital ratio of 20.6%
Share buy-back DKK 4.1 bn of the 5 bn share buy-back programme completed by end-Q3
Outlook Net profit for 2015 of above DKK 16 bn
4
Financial results for Q1 2013 Financial results – first nine months 2015
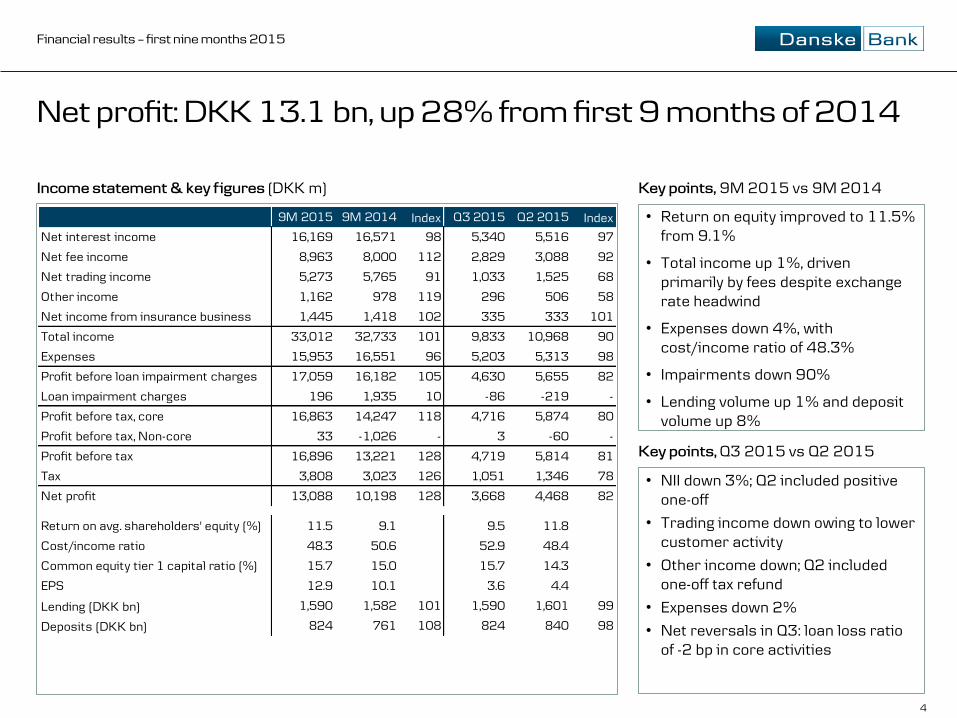
Net profit: DKK 13.1 bn, up 28% from first 9 months of 2014
Income statement & key figures (DKK m) Key points, 9M 2015 vs 9M 2014
Key points, Q3 2015 vs Q2 2015
• Return on equity improved to 11.5% from 9.1%
• Total income up 1%, driven primarily by fees despite exchange rate headwind
• Expenses down 4%, with cost/income ratio of 48.3%
• Impairments down 90%
• Lending volume up 1% and deposit volume up 8%
• NII down 3%; Q2 included positive one-off
• Trading income down owing to lower customer activity
• Other income down; Q2 included one-off tax refund
• Expenses down 2%
• Net reversals in Q3: loan loss ratio of -2 bp in core activities
9M 2015 9M 2014 Index Q3 2015 Q2 2015 Index
Net interest income 16,169 16,571 98 5,340 5,516 97
Net fee income 8,963 8,000 112 2,829 3,088 92
Net trading income 5,273 5,765 91 1,033 1,525 68
Other income 1,162 978 119 296 506 58
Net income from insurance business 1,445 1,418 102 335 333 101
Total income 33,012 32,733 101 9,833 10,968 90
Expenses 15,953 16,551 96 5,203 5,313 98
Profit before loan impairment charges 17,059 16,182 105 4,630 5,655 82
Loan impairment charges 196 1,935 10 -86 -219 -
Profit before tax, core 16,863 14,247 118 4,716 5,874 80
Profit before tax, Non-core 33 -1,026 - 3 -60 -
Profit before tax 16,896 13,221 128 4,719 5,814 81
Tax 3,808 3,023 126 1,051 1,346 78
Net profit 13,088 10,198 128 3,668 4,468 82
Return on avg. shareholders' equity (%) 11.5 9.1 9.5 11.8
Cost/income ratio 48.3 50.6 52.9 48.4
Common equity tier 1 capital ratio (%) 15.7 15.0 15.7 14.3
EPS 12.9 10.1 3.6 4.4
Lending (DKK bn) 1,590 1,582 101 1,590 1,601 99
Deposits (DKK bn) 824 761 108 824 840 98

5
Financial results for Q1 2013 Financial results – first nine months 2015
Banking units: Strong performance vs 9M 2014 at all units
Pre-tax return on allocated capital ex goodwill charge (%) Financial highlights, 9M 2015 vs 9M 2014
Income statement (DKK m)
Personal Banking
• Lower NII due to pressure on deposit margins • Higher fee income reflecting strong remortgaging and
customer activity • Impairments down 57% as household finances improved
Business Banking
• Higher total income, with gains in all income lines • Net reversals driven by improved collateral values
C&I
• Trading and fee income up on increased client activity • Impairment charges remained low C&I Business Personal
21.3
12.0 15.0
20.5
13.3 15.3
Q1-Q3 2015 Q1-Q3 2014
9M 2015 9M 2014 Index 9M 2015 9M 2014 Index 9M 2015 9M 2014 IndexNet interest income 7,057 8,104 87 6,782 6,677 102 2,030 2,001 101 Net fee income 3,956 3,343 118 1,629 1,530 106 1,727 1,614 107 Net trading income 555 459 121 515 445 116 3,770 3,401 111 Other income 479 495 97 481 380 127 4 3 109 Total income 12,047 12,401 97 9,407 9,032 104 7,530 7,018 107 Expenses 7,648 7,787 98 3,849 3,918 98 3,334 3,418 98 Profit before loan impairment charges 4,399 4,614 95 5,558 5,114 109 4,196 3,600 117 Loan impairment charges 388 895 43 -193 846 - - 195 - Profit before tax 4,011 3,719 108 5,751 4,268 135 4,196 3,405 123
Lending (DKK bn) 801 806 99 647 637 102 174 176 99 Deposits (DKK bn) 344 331 104 250 258 97 227 172 132
Personal Business C&I

6
Financial results for Q1 2013 Financial results – first nine months 2015
Danske Capital and Danica Pension: Satisfactory performance continued
Danske Capital: Income statement (DKK m) Danica Pension: Income statement (DKK m)
Danica Pension: Financial highlights, 9M 2015 vs 9M 2014 Danske Capital: Financial highlights, 9M 2015 vs 9M 2014
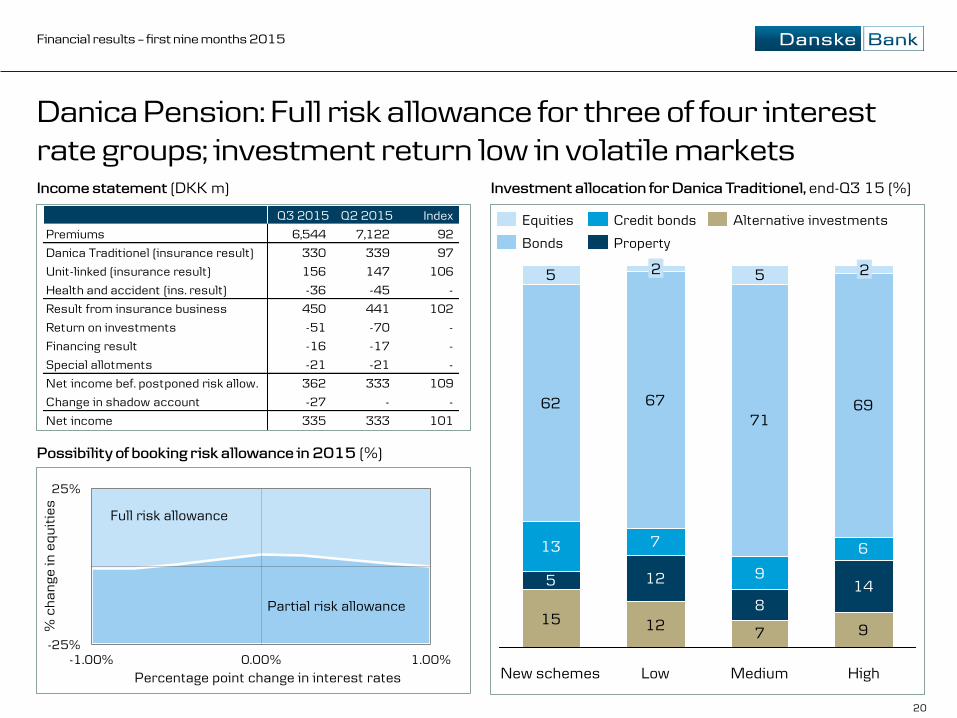
• Premiums of DKK 22 bn, up 8%, primarily from Sweden and Norway
• Risk allowance booked in full for three out of four interest rate groups and booked in part for the last group
• Shadow account balance at DKK 0.6 bn
• Total income up 7% owing to higher assets under management (up 5% on average) and a marginal rise in margins
• Net sales of DKK 33 bn, with 26% to clients outside Denmark
• Assets under management down 5% to DKK 759 bn at the end of September 2015 vs DKK 795 bn at the end of 2014
• DKK 58 bn of assets were transferred to Danica Pension as a result of a new investment strategy at Danica
9M 2015 9M 2014 Index
Net interest income -4 - -
Net fee income 1,708 1,577 108
- portion from performance fees 36 41 88
Other income -9 1 -
Total income 1,695 1,578 107
Expenses 707 746 95
Profit before tax 988 832 119
Assets under management (bn) 759 791 96
9M 2015 9M 2014 Index
Premiums 22,019 20,345 108
Danica Traditionel (insurance result) 1,002 1,023 98
Unit-linked (insurance result) 456 478 95
Health and accident (ins. result) -117 -274 -
Result from insurance business 1,341 1,227 109
Return on investments 239 375 64
Financing result -45 -96 -
Special allotments -63 -72 -
Net income bef. postponed risk allow. 1,472 1,434 103
Change in shadow account -27 -17 -
Net income 1,445 1,418 102

7
Financial results for Q1 2013 Financial results – first nine months 2015
Expenses: Down 4% vs 9M 2014 due to continued cost focus; on track to meet full-year guidance of below DKK 22 bn Total expenses ex goodwill charge (DKK m) Change in expenses ex goodwill (DKK m)
Q1-Q3 2015 15,953
Other costs 111
Depreciation, tangibles
211
Office expenses 209
IT 89
Severance payments
157
Staff costs 43
Q1-Q3 2014 16,551
762
826
931
873
694
590
780
542
20,627
2014
22,641
19,810
2013
23,794
Other costs
Bonuses
Deposit scheme guarantee / bank packages
Severance payments
Consultants etc.
Q1-Q3 2015
15,953
14,242
654
524 146
387

8
Financial results for Q1 2013 Financial results – first nine months 2015
Impairments: Loan loss ratio for Q3 of -2 bp for core activities and -1 bp for the entire Group Group impairments, 2011 to Q3 15 (DKK bn/bp) Impairments (DKK m)
* The loan loss ratio is defined as quarterly annualised impairment charges as a percentage of loans and guarantees.
Loan loss ratio, annualised (bp)
-1
-4
26
-10
0
10
20
30
40
50
60
70
80
90
100
2.5
1.5
1.0
5.0
4.5
4.0
3.5
3.0
2.0
0.0
0.5
-0.5
Q315 Q311 Q313 Q312 Q314
8
Loan loss ratio* (rhs) Impairments
9M 15 9M 14 Index Q3 15 Q2 15 Index
Personal Banking 6 15 40 1 6 17
Business Banking -4 19 - -5 -12 -
C&I - 5 - -1 -13 -
Total core 1 14 7 -2 -5 -
Non-core -35 162 - 71 -1 -
Group 1 17 6 -1 -4 -
9M 15 9M 14 Index Q3 15 Q2 15 Index
Personal Banking 388 895 43 13 131 10
Business Banking -193 846 - -90 -194 -
C&I - 195 - -11 -153 -
Other activities 3 - - 2 - -
Total core 196 1,935 10 -86 -219 -
Non-core -81 517 - 56 -1 -
Group 115 2,452 5 -30 -220 -
9
Financial results for Q1 2013 Financial results – first nine months 2015
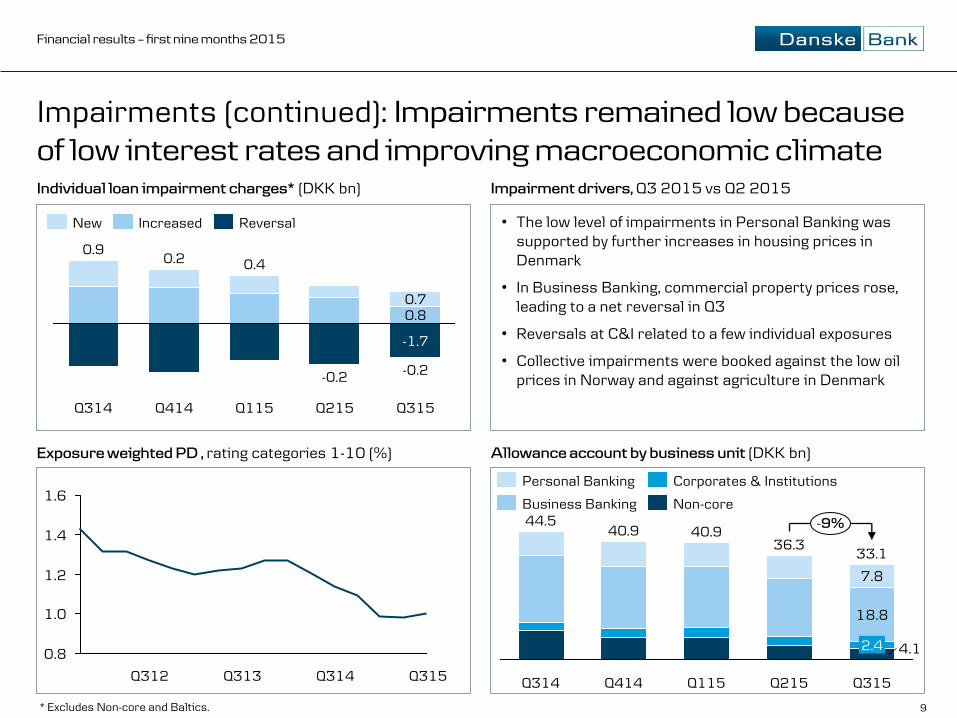
Impairments (continued): Impairments remained low because of low interest rates and improving macroeconomic climate Individual loan impairment charges* (DKK bn)
-0.2
Q215 Q115
0.4
Q414
0.2
Q314
0.9
-0.2
0.7 0.8
-1.7
Q315
New Reversal Increased
Impairment drivers, Q3 2015 vs Q2 2015
• The low level of impairments in Personal Banking was supported by further increases in housing prices in Denmark
• In Business Banking, commercial property prices rose, leading to a net reversal in Q3
• Reversals at C&I related to a few individual exposures
• Collective impairments were booked against the low oil prices in Norway and against agriculture in Denmark
4.1
18.8
7.8
Q215
36.3
2.4
Q115
40.9
Q414
40.9
Q314
44.5
Q315
33.1
-9%
Non-core
Corporates & Institutions
Business Banking
Personal Banking
Allowance account by business unit (DKK bn)
* Excludes Non-core and Baltics.
Exposure weighted PD , rating categories 1-10 (%)
0.8
1.0
1.2
1.4
1.6
Q315 Q314 Q313 Q312
10
Financial results for Q1 2013 Financial results – first nine months 2015
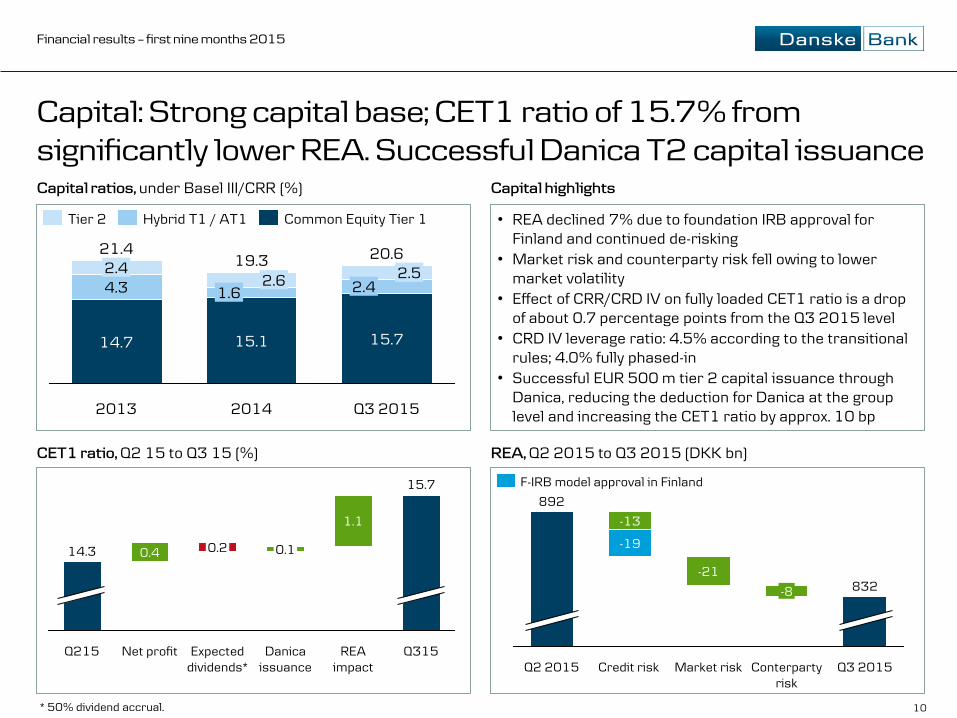
Capital: Strong capital base; CET1 ratio of 15.7% from significantly lower REA. Successful Danica T2 capital issuance Capital ratios, under Basel III/CRR (%) Capital highlights
• REA declined 7% due to foundation IRB approval for Finland and continued de-risking
• Market risk and counterparty risk fell owing to lower market volatility
• Effect of CRR/CRD IV on fully loaded CET1 ratio is a drop of about 0.7 percentage points from the Q3 2015 level
• CRD IV leverage ratio: 4.5% according to the transitional rules; 4.0% fully phased-in
• Successful EUR 500 m tier 2 capital issuance through Danica, reducing the deduction for Danica at the group level and increasing the CET1 ratio by approx. 10 bp
Q3 2015
832
Conterparty risk
-8
Market risk
-21
Credit risk
-19
-13
Q2 2015
892
CET1 ratio, Q2 15 to Q3 15 (%)
Q215
14.3
Q315
15.7
REA impact
1.1
Danica issuance
Expected dividends*
0.2
Net profit
0.4 0.1
* 50% dividend accrual.
REA, Q2 2015 to Q3 2015 (DKK bn)
14.7
4.3 2.4 19.3
15.1
1.6 2.6
2013
21.4
Q3 2015
20.6
15.7
2.4 2.5
2014
Common Equity Tier 1 Hybrid T1 / AT1 Tier 2
F-IRB model approval in Finland

11
Financial results for Q1 2013 Financial results – first nine months 2015
PB Norway: Strong loan growth drives NII higher despite market pressure; new customers have sound credit quality Lending volume in NOK (Q2 2014 = Index 100) Comments
NII and expenses in NOK (Q2 2014 = Index 100)
90
95
100
105
110
115
120
Q315 Q115 Q314 Q214 Q414 Q215
Expenses NII
132
116
105102
100
124
Q214 Q314 Q215 Q115 Q315 Q414
• At PB Norway in Q3, NII rose in NOK and expenses fell slightly
• Strong loan growth since Q1 15 led to an increase in NII in NOK despite market pressure
• Credit quality is generally sound and has improved steadily with the Akademikerne agreement
Exposure weighted PD , rating categories 1-10 (%)
Q215
0.36
0.46
Q315
0.37
Q414
0.39
Q115

12
Financial results for Q1 2013 Financial results – first nine months 2015
Note: This guidance is subject to uncertainty and depends on economic conditions, including developments in monetary policy at central banks.
Total income Income is expected to be in line with the level in 2014
Expenses Expenses are expected to be below DKK 22 bn
Impairments Impairment charges in our core activities are expected to decline to a level significantly lower than in 2014
Non-core Non-core pre-tax result is expected at around DKK 0 million
Net profit Net profit of above DKK 16 bn
Outlook for full-year 2015: Net profit of above DKK 16 bn
13
Financial results for Q1 2013 Financial results – first nine months 2015
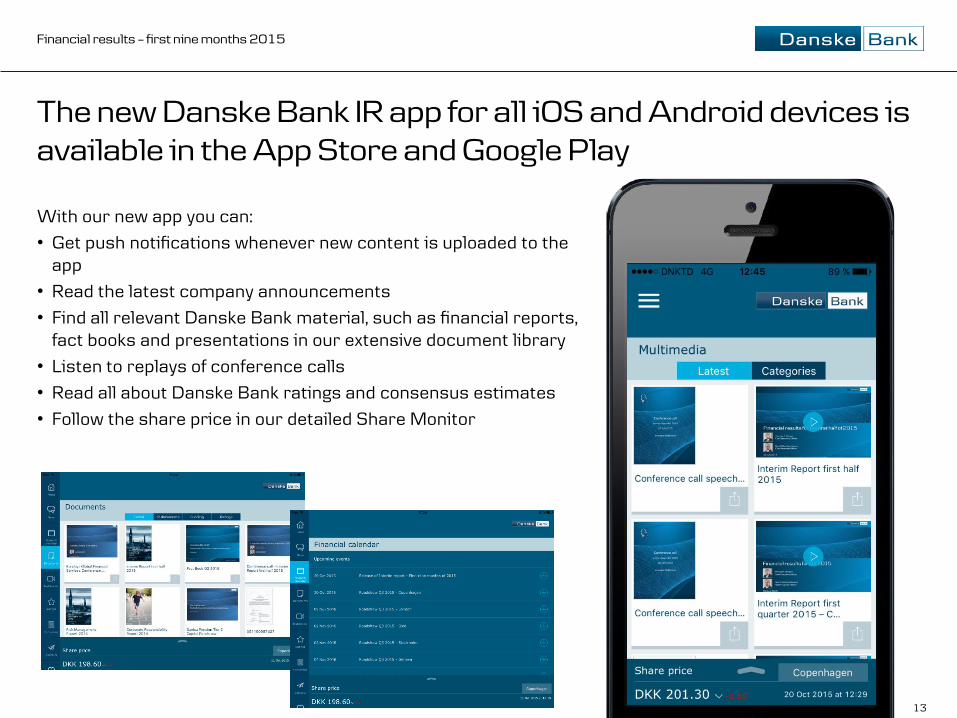
The new Danske Bank IR app for all iOS and Android devices is available in the App Store and Google Play
With our new app you can:
• Get push notifications whenever new content is uploaded to the app
• Read the latest company announcements
• Find all relevant Danske Bank material, such as financial reports, fact books and presentations in our extensive document library
• Listen to replays of conference calls
• Read all about Danske Bank ratings and consensus estimates
• Follow the share price in our detailed Share Monitor

14
Financial results for Q1 2013 Financial results – first nine months 2015
Q&A session
www.danskebank.com/ir

15
Financial results for Q1 2013 Financial results – first nine months 2015
Appendix
Funding, liquidity and ratings 31
Business units 16
Tax 34
Macro, credit quality and portfolio reviews 26
Special topics: NII, trading income, expenses and allowance account 22
Contact details 35

16
Financial results for Q1 2013 Financial results – first nine months 2015
Personal Banking: Positive momentum in costs and impairments in Q3; good trend in Norway continues Income statement & key figures (DKK m) Lending volume by country,* Q2 2014 = Index 100
Profit before tax by country (DKK m)
90
100
110
120
130
140
Q315 Q215 Q115 Q414 Q314 Q214
Sweden
Finland
Denmark
Norway
Northern Ireland
* Based on local currency lending volumes. ** Includes day effect, FX effect, capital costs and off-balance-sheet items.
1,392
Q315 Q314
1,373 1,322 1,298
Q414 Q115
929
Q215
Denmark
Finland
Sweden
Norway
Northern Ireland
Other
Personal Banking NII bridge (DKK m)
87
7
Lending margin
Lending volume
28
Q1-Q3 2014
8,104
Deposit volume
1,007
Deposit margin
11
7,057
Q1-Q3 2015
Other**
Q3 2015 Q2 2015 IndexNet interest income 2,329 2,330 100 Net fee income 1,222 1,383 88 Net trading income 139 148 94 Other income 139 187 74 Total income 3,829 4,048 95 Expenses 2,424 2,597 93 Profit before loan impairment charges 1,405 1,451 97 Loan impairment charges 13 131 10 Profit before tax 1,392 1,322 105
Lending (DKK bn) 801 806 99 Deposits (DKK bn) 344 353 98 FTE 6,527 6,695 97

17
Financial results for Q1 2013 Financial results – first nine months 2015
Business Banking: Income down from high Q2 activity; good customer activity in Sweden and Norway Income statement & key figures (DKK m)
Profit before tax by country (DKK m)
* Based on local currency lending volumes. ** Includes day effect, FX effect, capital costs and off-balance-sheet items.
Lending volume by country,* Q2 2014 = Index 100
90
100
110
120
130
Q315 Q215 Q115 Q414 Q314 Q214
Northern Ireland
Norway
Sweden
Finland
Denmark
Q215
2,182
Q115
1,769
Q414
1,465
Q314
1,455
Q315
1,801
Denmark
Finland
Sweden
Norway
Northern Ireland
Baltics
Other
Business Banking NII bridge (DKK m)
218
249556
183
Q1-Q3 2014
6,677
Deposit volume
11
Lending margin
Lending volume
Q1-Q3 2015
6,782
Other** Deposit margin
Q3 2015 Q2 2015 IndexNet interest income 2,245 2,313 97 Net fee income 490 567 86 Net trading income 73 230 32 Other income 142 165 86 Total income 2,950 3,275 90 Expenses 1,239 1,288 96 Profit before loan impairment charges 1,711 1,988 86 Loan impairment charges -90 -194 -Profit before tax 1,801 2,182 83
Lending (DKK bn) 647 652 99 Deposits (DKK bn) 250 259 97 FTE 2,955 3,065 96

18
Financial results for Q1 2013 Financial results – first nine months 2015
Corporates & Institutions: Income down due to lower activity in Q3, costs down 7% Income statement & key figures (DKK m) Key points, Q3 15 vs Q2 15
Income breakdown (DKK m)
Q315
2,036
Q215
2,523
Q115
2,971
Q414
2,103
Q314
2,483
General Banking Capital Markets FICC
• Trading income down in Q3 due to lower activity and negative XVA adjustments
• Expenses down 7%
• Impairments driven by smaller a smaller reversal in Q3
• Decline in capital consumption from de-risking as well as reduced counterparty risk and market risk
Allocated capital (DKK bn)
Q3 2015 Q2 2015 IndexNet interest income 667 703 95 Net fee income 570 580 98 Net trading income 798 1,240 64 Other income 1 - -Total income 2,036 2,523 81 Expenses 1,050 1,126 93 Profit before loan impairment charges 986 1,398 71 Loan impairment charges -11 -153 -Profit before tax 997 1,551 64
Lending (DKK bn) 174 179 97 Deposits (DKK bn) 227 230 99 FTE 1,811 1,832 99
-2.7
35.7
Q215 Q314
38.5 38.1
Q115
37.5 36.6
Q414 Q315

19
Financial results for Q1 2013 Financial results – first nine months 2015
Danske Capital: AuM down in Q3 due to asset transfer to Danica and negative market impact; continued net inflow Income statement (DKK m)
Net inflow – AuM (DKK bn)
9.1
0
5
10
15 2.5
2.0
1.5
1.0
0.5
0.0
11.4
Q414
0.8%
6.2
Q314
1.1%
Q315
1.2%
Q215
1.5%
12.3
Q115
1.4%
8.5
Net inflow as % of AuM (rhs) Net inflow
Key points, Q3 15 vs Q2 15
* Retail includes Danske Invest.
140
325
278
803 813 795 791
Q215 Q115 Q414 Q314 Q315
16 759
Private Equity Life insurance Institutions Retail*
AuM — customer breakdown (DKK bn)
• Assets under Management down 5% driven by a DKK 21 bn asset transfer to Danica Pension as part of their new investment strategy and negative market impact
• Net sales of DKK 9 bn primarily to institutional clients
Q3 2015 Q2 2015 Index
Net interest income -1 -1 -
Net fee income 558 583 96
- portion from performance fees 2 19 11
Other income -10 -1 -
Total income 547 581 94
Expenses 230 233 99
Profit before tax 317 349 91
Assets under management (bn) 759 803 95
20
Financial results for Q1 2013 Financial results – first nine months 2015
-25%
25%
-1.00% 0.00% 1.00%
Danica Pension: Full risk allowance for three of four interest rate groups; investment return low in volatile markets Income statement (DKK m) Investment allocation for Danica Traditionel, end-Q3 15 (%)
15 12 9
5 12
814
13 7
9
6
62 6771
69
5 5
7
New schemes Medium Low
2 2
High
Bonds
Alternative investments
Property
Credit bonds Equities
% c
han
ge in
eq
uit
ies
Percentage point change in interest rates
Possibility of booking risk allowance in 2015 (%)
Q3 2015 Q2 2015 Index
Premiums 6,544 7,122 92
Danica Traditionel (insurance result) 330 339 97
Unit-linked (insurance result) 156 147 106
Health and accident (ins. result) -36 -45 -
Result from insurance business 450 441 102
Return on investments -51 -70 -
Financing result -16 -17 -
Special allotments -21 -21 -
Net income bef. postponed risk allow. 362 333 109
Change in shadow account -27 - -
Net income 335 333 101
Full risk allowance
Partial risk allowance
21
Financial results for Q1 2013 Financial results – first nine months 2015
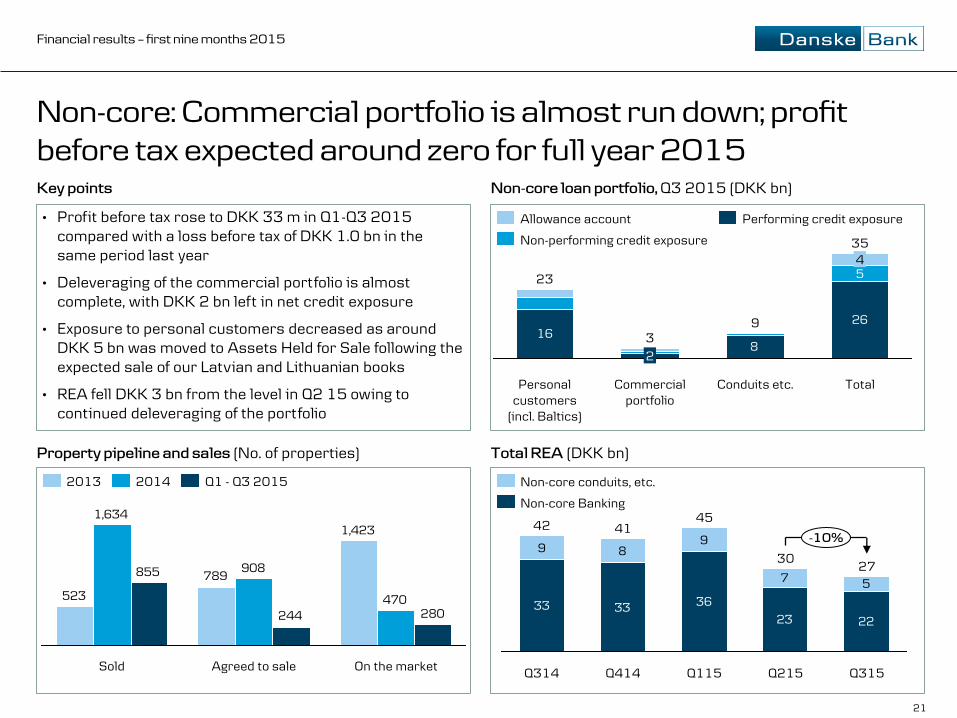
Non-core: Commercial portfolio is almost run down; profit before tax expected around zero for full year 2015
Property pipeline and sales (No. of properties)
Key points Non-core loan portfolio, Q3 2015 (DKK bn)
Total REA (DKK bn)
• Profit before tax rose to DKK 33 m in Q1-Q3 2015 compared with a loss before tax of DKK 1.0 bn in the same period last year
• Deleveraging of the commercial portfolio is almost complete, with DKK 2 bn left in net credit exposure
• Exposure to personal customers decreased as around DKK 5 bn was moved to Assets Held for Sale following the expected sale of our Latvian and Lithuanian books
• REA fell DKK 3 bn from the level in Q2 15 owing to continued deleveraging of the portfolio
28 31 35 37 27
1626
8
5
Personal customers
(incl. Baltics)
23
Total
35 4
Conduits etc.
9
Commercial portfolio
3
2
Performing credit exposure
Non-performing credit exposure
Allowance account
1,423
789
523 470
908
1,634
280244
855
On the market Agreed to sale Sold
Q1 - Q3 2015 2014 2013
33 33 36
23 22
9 89
7 5
-10%
Q315
27
Q215
30
Q115
45
Q414
41
Q314
42
Non-core Banking
Non-core conduits, etc.

22
Financial results for Q1 2013 Financial results – first nine months 2015
Changes in net interest income (DKK m)
Net interest income: Effect from extremely low interest rates and margin pressure
Changes in net interest income (DKK m)
411
16,169 9M 2015
Other* 181
State hybrid 271
Deposit margin 1,705
Deposit volume 165
Lending margin 275
Lending volume
9M 2014 16,571
117
43
57
56
97
Q3 15
Other
FX effect
Days
5,340
Deposit margin
Deposit volume 2
Lending margin
Lending volume 4
Q2 15 5,516

23
Financial results for Q1 2013 Financial results – first nine months 2015
Trading income: Lower customer activity in financial markets
Trading income by business unit (DKK m) Key points
Refinancing income (DKK m)
Q315
1,033
Q215
1,525
Q115
2,715
Q414
928
Q314
1,613
Personal Business C&I Other incl. Treasury • H1 2015 saw extraordinarily high customer activity
• Trading income down in Q3 owing to lower customer activity in financial markets, lower refinancing and remortgaging activity, and value adjustments
• C&I was affected by seasonality and uncertainty in the financial markets about US monetary policy and Chinese economy
242
Q113
138
Q115 Q414
141
186
Q114
148
Q413

24
Financial results for Q1 2013 Financial results – first nine months 2015
Expenses: Positive trend in expenses continues
Change in expenses ex goodwill (DKK m) Total expenses ex goodwill charge (DKK m)
88
54
Q3 2015 5,203
Other costs
IT 119
Severance payments
25
Staff costs
Q2 2015 5,313
Q3 15
5,203
4,632
Q2 15
5,313
4,797
Q1 15
5,437
4,814
Q4 14
6,090
5,175
Q3 14
5,530
4,861
Other costs
Deposit guarantee scheme/bank packages
Bonuses
Severance payments
Consultants etc.

25
Financial results for Q1 2013 Financial results – first nine months 2015
Allowance account: Commercial property and personal customers make up 52% of the individual allowance account
* In addition, the Group has booked DKK 5.1 bn in collective impairment charges. Note: Non-performing loans are loans in rating categories 10 and 11 against which individual impairments have been made.
Gross non-performing loans, ex Non-core (DKK bn)
Shipping 1.1
Materials 1.1
Industrial services etc 1.4
Construction & building products 1.5
Consumer discretionary 2.1
Agriculture 2.7
Commercial property
Non-profit & Associations 1.0
Other
Investment funds 0.4
Consumer staples
1.7
0.3
6.4
Personal customers 8.2
Individual allowance account by industry* (DKK bn)
9 11 11 11 10
19 19 19 1817
31 29 3027
25
Q414
58
Q314 Q315
51
Q215
56
Q115
59 60
Net exposure, In default
Individual allowance account
Net exposure, Not in default

26
Financial results for Q1 2013 Financial results – first nine months 2015
Nordic macro
Real GDP (constant prices, index 2005 = 100) Inflation (%)
Interest rates (lending, %) Unemployment (%)
90
100
110
120
130
2010 2008 2006 2012 2014
Sweden Norway Denmark Finland
0
2
4
6
8
10
2014 2008 2006 2010 2012
Finland Denmark Sweden Norway
-2
-1
0
1
2
3
4
5
6
2008 2010 2012 2006 2014
Norway Sweden Denmark Finland
-1
0
1
2
3
4
5
6
2010 2012 2008 2006 2014
Euro area Norway Sweden Denmark
27
Financial results for Q1 2013 Financial results – first nine months 2015
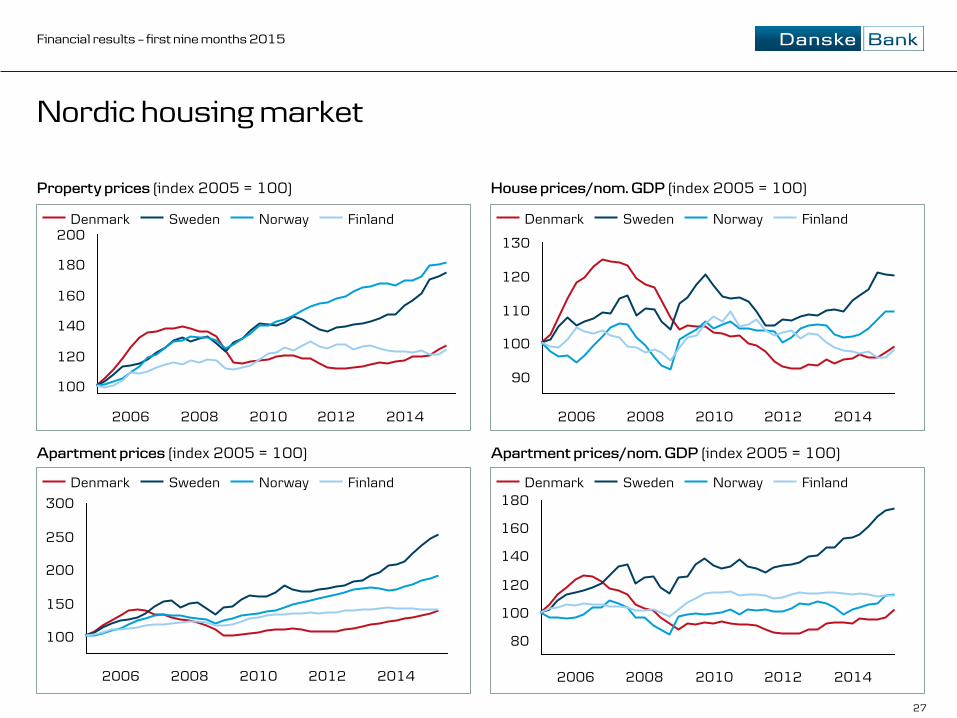
Nordic housing market
Apartment prices (index 2005 = 100) Apartment prices/nom. GDP (index 2005 = 100)
130
120
2008 2006 2012 2010 2014
110
90
100
Finland Norway Denmark Sweden
2008 2006
100
2014 2012 2010
180
160
140
120
200 Finland Norway Sweden Denmark
Property prices (index 2005 = 100) House prices/nom. GDP (index 2005 = 100)
300
100
250
200
150
2014 2012 2010 2008 2006
Norway Sweden Denmark Finland 180
160
140
80
2014
120
100
2012 2010 2008 2006
Norway Denmark Sweden Finland

28
Financial results for Q1 2013 Financial results – first nine months 2015
Realkredit Danmark and the Danish housing market: Portfolio overview Portfolio facts, Realkredit Danmark, end-Q3 15
Unemployment and foreclosures (%/No.) Trend in mortgage margins, 80% LTV, owner-occupied (bp)
• Approx. 377,000 loans (residential and commercial)
• 1,797 loans in 3- and 6-month arrears
• 69 repossessed properties
• DKK 15 bn of loans with LTV ratio > 100%, including DKK 6 bn with public guarantee
• Average LTV ratio of 67%
LTV ratio at origination (legal requirement)
• Residential: max. 80%
• Commercial: max. 60%
52
68
86
101
118Fixed rate Adjustable rate All products
2011 Jan13: with amortisation Jan 13: interest-only
+ r
efin
anci
ng
fee*
+ r
efin
anci
ng
fee*
* We charge a fee of 30 bp of the bond price for refinancing of 1- and 2-year floaters and a fee of 20 bp for floaters of 3 or more years .
Stock of retail loans, Realkredit Danmark, end-Q3 15 (%)
9%
41%
26%
24%
Fixed rate instalments Fixed rate interest-only
Variable rate interest-only Variable rate instalments
1997 2002 2006 2010 1993 2015
0
5
10
0
500
1,000
1,500
10Y swap rate No. of forced sales Unemployment
29
Financial results for Q1 2013 Financial results – first nine months 2015
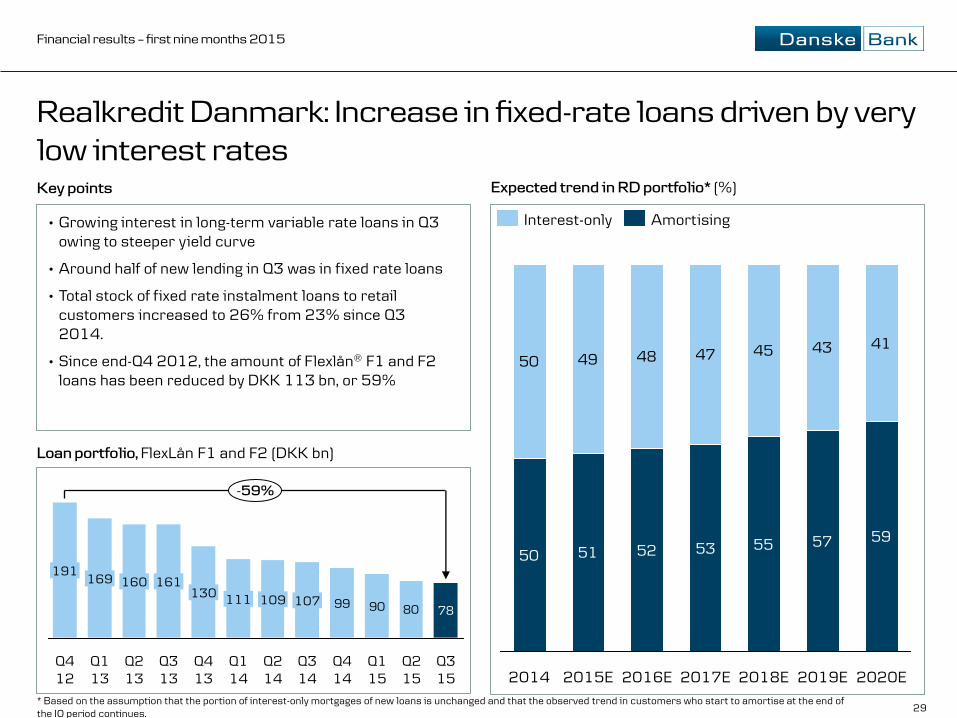
Realkredit Danmark: Increase in fixed-rate loans driven by very low interest rates
* Based on the assumption that the portion of interest-only mortgages of new loans is unchanged and that the observed trend in customers who start to amortise at the end of the IO period continues.
Expected trend in RD portfolio* (%)
Loan portfolio, FlexLån F1 and F2 (DKK bn)
99 90 7880
-59%
Q2 15
Q1 15
Q4 14
Q3 14
107
Q2 14
109
Q1 14
111
Q4 13
130
Q3 13
161
Q2 13
160
Q1 13
169
Q4 12
191
Q3 15
Key points
• Growing interest in long-term variable rate loans in Q3 owing to steeper yield curve
• Around half of new lending in Q3 was in fixed rate loans
• Total stock of fixed rate instalment loans to retail customers increased to 26% from 23% since Q3 2014.
• Since end-Q4 2012, the amount of Flexlån® F1 and F2 loans has been reduced by DKK 113 bn, or 59%
50 51 52 53 55 57 59
50 49 48 47 45 43 41
2020E 2019E 2018E 2017E 2016E 2015E 2014
Amortising Interest-only

30
Financial results for Q1 2013 Financial results – first nine months 2015
Credit exposure: Limited agriculture and shipping/oil exposure
Shipping and oil related exposure (2.0 % of Group exposure)
Agriculture by segments, Q3 2015 (DKK m)
• Market conditions stayed weak. Both milk and pig prices declined in Q3 compared to Q2 and remained at very low levels.
• A collective charge of DKK 100 m was booked in Denmark in Q3. In total, collective impairments amounts to DKK 837 m.
• RD represents 70% of total gross exposure and 11% of total accumulated impairment charges to agriculture in Business Banking.
Shipping exposure, Q3 2015 (DKK m)
Agriculture exposure (2.8 % of Group exposure)
• The shipping portfolio is mainly booked in C&I and the coverage ratio is generally high.
• Oil-related exposure amounts to DKK 17.4bn and relates to Off-shoring (DKK 11.9bn), Oil majors (DKK 1.7bn) and Oil service providers (DKK 3.8bn). The credit quality is generally good, and no individual impairment charges have been booked in this segment in 2015.
• 78% of oil related exposure is denominated in USD.
•The Group’s shipping exposure is managed by specialist teams for customer relationships and credit management.
Gross
credit
exposure
Portionfrom RD
Acc.
Individual
impairment
charges
Net
credit
exposure
NPL
coverage
ratio
Business Banking 61,325 43,046 2,639 58,686 79%
Growing of crops, cereals, etc. 17,696 14,160 440 17,256 79%
Dairy 13,649 7,313 931 12,718 84%
Pig breeding 13,682 10,466 1,092 12,590 75%
Mixed operations etc. 16,298 11,107 177 16,121 81%
C&I 6,818 2,645 0 6,818 100%
Others 360 1 32 329 33%
Total before collective impairments 68,503 2,671 65,833 78%
Collective impairment charges 837 292
Total gross exposure 69,240
Gross
credit
exposure
Acc. Individual
impairment
charges
Net
credit
exposure
NPL
coverage
ratio
C&I 42,226 1,047 41,179 67%
Offshore 12,691 - 12,691 -
Tank 7,801 692 7,108 60%
Container 7,442 37 7,405 87%
LNG/LPG 4,630 - 4,630 -
Dry Bulk 2,948 28 2,920 58%
Car carriers 1,716 - 1,716 -
Others 4,998 289 4,709 94%
Personal & Business Banking 1,440 70 1,371 85%
Total 43,666 1,117 42,549 68%
31
Financial results for Q1 2013 Financial results – first nine months 2015
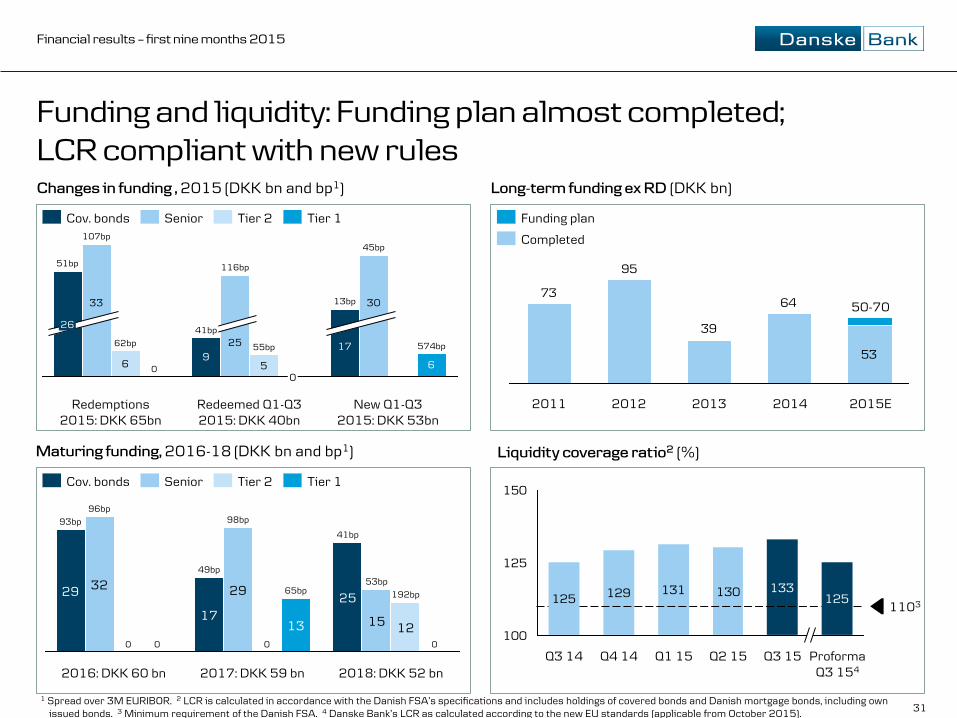
Funding and liquidity: Funding plan almost completed; LCR compliant with new rules
53
64
39
95
73
2013 2012 2011 2014 2015E
50-70
Funding plan
Completed
130131129125 125133
100
125
150
Q3 15 Proforma Q3 154
Q2 15
1103
Q3 14 Q4 14 Q1 15
1 Spread over 3M EURIBOR. 2 LCR is calculated in accordance with the Danish FSA’s specifications and includes holdings of covered bonds and Danish mortgage bonds, including own issued bonds. 3 Minimum requirement of the Danish FSA. 4 Danske Bank’s LCR as calculated according to the new EU standards (applicable from October 2015).
Changes in funding , 2015 (DKK bn and bp1)
Liquidity coverage ratio2
(%)
Long-term funding ex RD (DKK bn)
6 59
6
30
55bp
45bp
13bp
17
Redeemed Q1-Q3 2015: DKK 40bn
574bp
New Q1-Q3 2015: DKK 53bn
26
33
51bp 116bp
41bp
0
25
Redemptions 2015: DKK 65bn
0
62bp
107bp
Cov. bonds Senior Tier 2 Tier 1
93bp
29
41bp
0
192bp
53bp
12
32
96bp
0 0
17
2016: DKK 60 bn
29
13
49bp
98bp
65bp
0
2017: DKK 59 bn
25
15
2018: DKK 52 bn
Maturing funding, 2016-18 (DKK bn and bp1)
Senior Tier 1 Tier 2 Cov. bonds

32
Financial results for Q1 2013 Financial results – first nine months 2015
Funding: Structure and sources; Danish mortgage system is fully pass-through Loan portfolio and long-term funding, Q3 15 (DKK bn)
743743
194317
824529
110
Issued RD bonds RD mortgages
Covered bonds Bank mortgages
Deposits Bank loans
Senior debt
Funding
1,871
Loans
1,590
Funding sources (%)
Short-term funding Long-term funding
9
2
12
6
48
16
1
6
Rep
os
CD
& C
P
Su
bo
rd.
deb
t
Co
vere
d
bo
nd
s
Dep
osi
ts
Sen
ior
u
nse
cure
d
Eq
uit
y
Dep
osi
ts
cred
it in
st.
Q3 2015 Q2 2015
33
Financial results for Q1 2013 Financial results – first nine months 2015
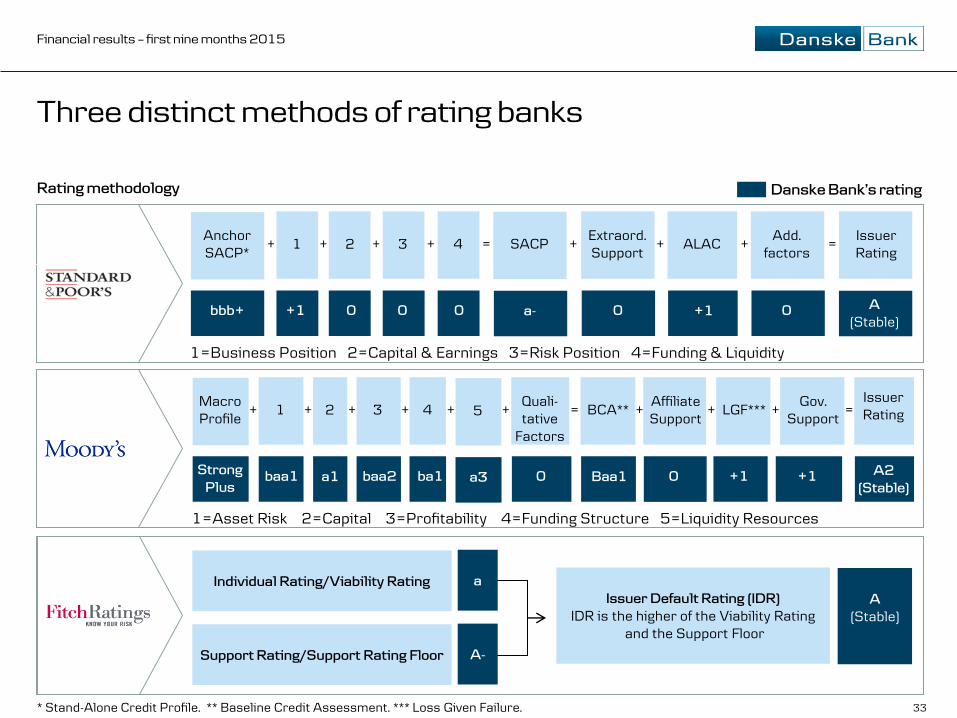
Three distinct methods of rating banks
Individual Rating/Viability Rating
Support Rating/Support Rating Floor
Issuer Default Rating (IDR)
IDR is the higher of the Viability Rating and the Support Floor
a
A-
A
(Stable)
Danske Bank’s rating
* Stand-Alone Credit Profile. ** Baseline Credit Assessment. *** Loss Given Failure.
Rating methodology
Anchor SACP*
Extraord. Support
Add. factors
Issuer Rating
+ + + = + + +
bbb+ +1 0 0 0 0 0 A
(Stable)
SACP
a-
= 1 2 3 4
1=Business Position 2=Capital & Earnings 3=Risk Position 4=Funding & Liquidity
ALAC
+1
+
Macro Profile
Quali- tative
Factors
Gov. Support
Issuer Rating + =
Strong
Plus
baa1 a1 baa2 ba1 0 +1
+ 1 2 3 4
1=Asset Risk 2=Capital 3=Profitability 4=Funding Structure 5=Liquidity Resources
BCA**
Baa1 a3
5
A2
(Stable)
+ LGF***
+1
+ + + + = Affiliate Support
0
+ +

34
Financial results for Q1 2013 Financial results – first nine months 2015
Tax
Tax drivers Actual and adjusted tax rates (DKK m)
• The difference between profit before tax and adjusted pre-tax profit relates mainly to previous years’ losses in Ireland
• Further, the permanent non-taxable difference derives mainly from tax-exempt dividends and value adjustments of shares
Q32015 Q22015 Q12015 Q42014 Q32014
Profit before tax 4,720 5,814 6,362 -5,298 4,503
Ireland core and non-core -193 -206 -433 434 79
Permanent non-taxable difference -87 -278 20 8,969 45
Adjusted pre-tax profit, Group 4,439 5,330 5,949 4,105 4,627
Tax according to P&L 1,051 1,346 1,411 987 1,231
Taxes from previous years -12 -107 33 44 -60
Adjusted tax 1,039 1,240 1,445 1,031 1,171
Adjusted tax rate 23.4% 23.3% 24.3% 25.1% 25.3%
Actual tax rate 22.3% 23.2% 22.2% N/A 27.3%

35
Financial results for Q1 2013 Financial results – first nine months 2015
Contacts
Henrik Ramlau-Hansen Direct: +45 45 14 06 66 Chief Financial Officer Mobile: +45 22 20 73 10 [email protected]
Claus Ingar Jensen Direct: +45 45 12 84 83 Head of IR Mobile: +45 25 42 43 70 [email protected]
John Bäckman Direct: +45 45 14 07 92 Chief IR Officer Mobile: +45 30 51 46 85 [email protected]
Robin Hjelgaard Løfgren Direct: +45 45 14 06 04 IR Officer Mobile: +45 24 75 15 40 [email protected]
Louisa Grue Baruch Direct: +45 45 13 92 34 IR Officer Mobile: +45 21 56 19 35 [email protected]
36
Financial results for Q1 2013 Financial results – first nine months 2015
Disclaimer
Important Notice
This presentation does not constitute or form part of and should not be construed as, an offer to sell or issue or the solicitation of an offer to buy or acquire securities of Danske Bank A/S in any jurisdiction, including the United States, or an inducement to enter into investment activity. No part of this presentation, nor the fact of its distribution, should form the basis of, or be relied on in connection with, any contract or commitment or investment decision whatsoever. The securities referred to herein have not been, and will not be, registered under the Securities Act of 1933, as amended (“Securities Act”), and may not be offered or sold in the United States absent registration or an applicable exemption from the registration requirements of the Securities Act. This presentation contains forward-looking statements that reflect management’s current views with respect to certain future events and potential financial performance. Although Danske Bank believes that the expectations reflected in such forward-looking statements are reasonable, no assurance can be given that such expectations will prove to have been correct. Accordingly, results could differ materially from those set out in the forward-looking statements as a result of various factors many of which are beyond Danske Bank’s control. This presentation does not imply that Danske Bank has undertaken to revise these forward-looking statements, beyond what is required by applicable law or applicable stock exchange regulations if and when circumstances arise that will lead to changes compared to the date when these statements were provided.