first nations - chiefs of ontario
TRANSCRIPT

OPIOID USE
FIRST NATIONS
A REPORT OF CURRENT FINDINGS
PREPARED BY
THE INSTITUTE OF CLINICAL EVALUATIVE SCIENCES
FOR
THE CHIEFS OF ONTARIO
AND THE
CHIEFS IN ASSEMBLY
AMONG
IN ONTARIO

RATE
OPIOID USE AMONG FIRST NATIONS IN ONTARIO
BACKGROUND The rising use of opioids has become a major concern in Ontario and a public health crisis in First Nations communities in particular. One way that opioids are accessed in Ontario is through prescriptions. The limited high-quality data on prescription opioid use and related adverse events among First Nations people in Ontario is a barrier to effective planning of appropriate services and supports that could target these issues in affected communities. In response to this opioid epidemic, on June 26, 2013, the Chiefs in Assembly passed Resolution 13/10 (Prescription Opioid Surveillance) mandating the Chiefs of Ontario (COO) to work with the Institute for Clinical Evaluative Sciences (ICES) and the Non- Insured Health Benefits (NIHB) Program to develop research that is relevant and appropriate to the needs of First Nations. The Opioid Surveillance Steering Committee acted as the technical advisory group for this work. This report was prepared by ICES for the purpose of sharing current findings on opioid use among registered First Nations with COO and the Chiefs in Assembly.
OPIOIDS
ODB The Ontario Drug Benefit (ODB) database contains claims for prescription drugs received under the Ontario Drug Benefit program. To be eligible for the ODB program, an individual must have a valid Ontario health card and be aged 65+. Individuals under the age of 65 can also qualify if they have low socio-economic status, receive disability support or home care, have high drug costs relative to household income, or reside in a long-term care home.
NIHB
KEY TERMS
MEQ
Please refer to the Technical Appendix for a comprehensive list of data sources used in the analyses.
The Non-Insured Health Benefits (NIHB) Program is a national program that provides coverage to registered First Nations for a specified range of medically necessary items and services (including drugs) that are not covered by other plans and programs. NIHB is ‘first payer’ for those who are not eligible for ODB.
Morphine Equivalents (MEQ) allow us to compare doses between people using different types of opioids and are calculated by converting an opioid dose into its equivalent dose in morphine. This is reported as mg MEQ/day.
Opioids are natural or synthetic chemicals that reduce feelings of pain. Common prescription opioid pain relievers include1: Oxycodone (e.g. OxyContin; OxyNeo), Hydromorphone, Fentanyl, Morphine, Codeine, and other combination agents (e.g. Tylenol No. 2 and 3; Percocet).
The frequency with which an event or circumstance occurs per unit of time, population, or other standard of comparison. Example: Based on a rate of 1.5 deaths per 10,000 people, we can expect approximately 15 deaths in a community of 100,000.
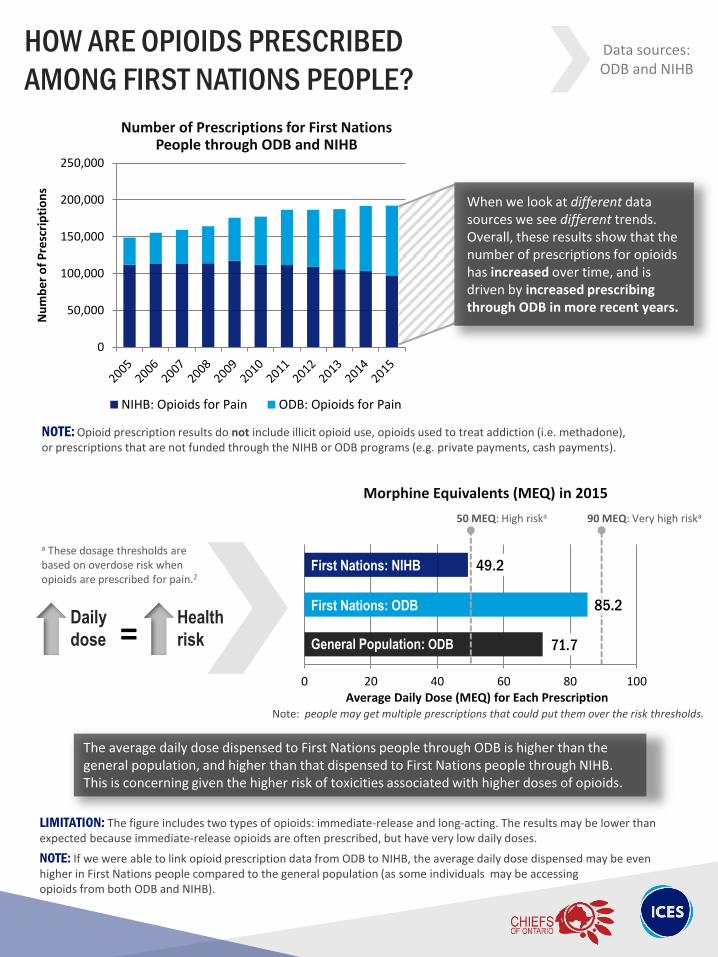
71.7
85.2
49.2
0 20 40 60 80 100Average Daily Dose (MEQ) for Each Prescription
General Population: ODB
First Nations: ODB
First Nations: NIHB
HOW ARE OPIOIDS PRESCRIBED
AMONG FIRST NATIONS PEOPLE?
NOTE: Opioid prescription results do not include illicit opioid use, opioids used to treat addiction (i.e. methadone), or prescriptions that are not funded through the NIHB or ODB programs (e.g. private payments, cash payments).
0
50,000
100,000
150,000
200,000
250,000
Nu
mb
er
of
Pre
scri
pti
on
s
NIHB: Opioids for Pain ODB: Opioids for Pain
Number of Prescriptions for First Nations People through ODB and NIHB
When we look at different data sources we see different trends. Overall, these results show that the number of prescriptions for opioids has increased over time, and is driven by increased prescribing through ODB in more recent years.
Morphine Equivalents (MEQ) in 2015
The average daily dose dispensed to First Nations people through ODB is higher than the general population, and higher than that dispensed to First Nations people through NIHB. This is concerning given the higher risk of toxicities associated with higher doses of opioids.
NOTE: If we were able to link opioid prescription data from ODB to NIHB, the average daily dose dispensed may be even higher in First Nations people compared to the general population (as some individuals may be accessing opioids from both ODB and NIHB).
Daily
dose = Health
risk
50 MEQ: High riska 90 MEQ: Very high riska
a These dosage thresholds are based on overdose risk when opioids are prescribed for pain.2
LIMITATION: The figure includes two types of opioids: immediate-release and long-acting. The results may be lower than expected because immediate-release opioids are often prescribed, but have very low daily doses.
Note: people may get multiple prescriptions that could put them over the risk thresholds.
Data sources: ODB and NIHB

0
10,000
20,000
30,000
40,000
50,000
60,000
70,000
80,000
2005 2006 2007 2008 2009 2010 2011 2012 2013 2014 2015
Nu
mb
er o
f P
resc
rip
tio
ns
Year
CODEINE OXYCODONE MORPHINE
HYDROMORPHONE FENTANYL MEPERIDINE
Number of Prescriptions for First Nations People through ODB and NIHB, by Type of Opioid
HOW ARE OPIOIDS PRESCRIBED
AMONG FIRST NATIONS PEOPLE? Data sources: ODB and NIHB
• Codeine and oxycodone (single agents and combination agents) are the most commonly prescribed opioids over the 10 years shown, largely driven by use of the combination agents that are prescribed more often for short term use (e.g. Tylenol No. 2 and 3; Percocet).
• Despite the high use of codeine, the number of codeine prescriptions have decreased by 16% over the past 10 years.
• The opioids with the most noticeable increase in number of prescriptions are morphine (147% increase) and hydromorphone (768% increase).
• The number of fentanyl and meperidine prescriptions have remained below 10,000 prescriptions per year, over the last 10 years.
What the
figure
(above)
tells us:
Between 2005 and 2015:

WHAT ARE THE IMPLICATIONS OF OPIOID USE?
Opioid-Related Toxicity (may be related to prescription and/or illicit use)
Rates of opioid-related hospitalizations and emergency department visits are nearly
2 times higher among First Nations people off reserve compared to First Nations people on reserve.
LIMITATION: Emergency Department visits and hospitalizations will not capture opioid-related toxicities that occur in nursing stations or in remote communities, which may underestimate events among First Nations.
Rates of opioid-related hospitalizations and emergency
department visits are nearly 4 times higher among First Nations people compared to the general population.
NOTE: Higher rates of opioid toxicity are seen in urban areas among First Nations; in contrast, higher rates are seen in rural areas among the general population.
Rate of hospitalizations
2.6
9.6
0
2
4
6
8
10
12
General Population
First Nations
Op
ioid
-rel
ated
ho
spit
aliz
atio
n a
nd
ED
vi
sit
rate
per
10
,00
0 p
eop
le
Rate of Opioid-Related Hospitalizations and Emergency Department Visits in 2015
Number of hospitalizations n = 3,719
n = 167
Rate of Opioid-Related Hospitalizations and Emergency Department Visits in 2015
2.6
6.3
11.3
0
2
4
6
8
10
12
General Population
First Nations: On Reserve
First Nations: Off Reserve
Op
ioid
-rel
ated
ho
spit
aliz
atio
n a
nd
ED
vi
sit
rate
per
10
,00
0 p
eop
le
n = 3,719 n = 38 n = 129
LIMITATION: Opioid-related toxicity may not be well-captured in emergency department and hospitalization data; therefore we are likely underestimating the true number of events in this report.
Data sources: CIHI-DAD,
CIHI-NACRS
Out of 174,801 hospitalizations

Opioid-Related Toxicity (may be related to prescription and/or illicit use)
WHAT ARE THE IMPLICATIONS OF OPIOID USE? Data sources:
CIHI-DAD, CIHI-NACRS
1.8 1.8 1.8 1.8 1.9 2.1 2.1 2.3 2.5 2.3 2.5 2.6
6.1 6.2 6.2 6.3
7.9 8.0 8.2 8.2
10.1
8.8 8.3
9.6
0
2
4
6
8
10
12
2004 2005 2006 2007 2008 2009 2010 2011 2012 2013 2014 2015
Op
ioid
rel
ated
ho
spit
aliz
atio
n a
nd
ED
vi
sit
rate
per
10
,00
0 p
eop
le
General Population First Nations
Rate of Opioid-Related Hospitalizations and Emergency Department Visits in 2004-2015
Rate
Rates of hospitalizations and emergency department visits between 2004 and 2015 are consistently higher among First Nations people compared to the general population. Moreover, these rates have been increasing to a greater extent in First Nations people compared to the general population.

Opioid-Related Toxicity (may be related to prescription and/or illicit use)
WHAT ARE THE IMPLICATIONS OF OPIOID USE? Data sources:
CIHI-DAD, CIHI-NACRS
0
2
4
6
8
10
12
2004 2005 2006 2007 2008 2009 2010 2011 2012 2013 2014 2015
Op
ioid
rel
ated
ho
spit
aliz
atio
n a
nd
ED
vi
sit
rate
per
10
,00
0 p
eop
le
First Nations: Off Reserve First Nations: On Reserve General Population
Rate of Opioid-Related Hospitalizations and Emergency Department Visits in 2004-2015
Rates of hospitalizations and emergency department visits between 2004 and 2015 are consistently higher among First Nations people living off reserve compared to First Nations people living on reserve. The increase in rates are evident in First Nations living on and off reserve.

WHAT ARE THE IMPLICATIONS OF OPIOID USE?
Opioid-Related Mortality (may be related to prescription and/or illicit use)
0.4
1.5
0
0.5
1
1.5
2
General Population
First Nations O
pio
id-r
elat
ed d
eath
rat
e
per
10
,00
0 p
eop
le
Average Rate of Opioid-Related Deaths in 2014-2015
NOTE: Coroner investigations are completed through the same process for on and off reserve populations.
Rates of opioid-related deaths are
nearly 4 times higher among First Nations people compared to the general population.
NOTE: Due to the presence of small cells when presenting 2015 opioid-related deaths by on/off reserve information, the results for 2014 and 2015 were combined for all opioid-related death data.
Average Rate of Opioid-Related Deaths in 2014-2015
Rates of opioid-related deaths
are nearly 2 times higher among First Nations people off reserve compared to First Nations people on reserve.
n = 1,232 n = 54
0.4
0.9
1.7
0
0.5
1
1.5
2
GeneralPopulation
First Nations:On Reserve
First Nations:Off Reserve
Op
ioid
-rel
ated
dea
th r
ate
p
er 1
0,0
00
peo
ple
n = 1,232 n = 11 n = 40
NOTE: Charts depicting on/off reserve comparisons contain small numbers, which may be more likely to fluctuate from year to year. However, we have found that between 2004 and 2015, rates of opioid-related toxicity and mortality are consistently higher among First Nations people off reserve than those on reserve.
Data source: Coroner
Death Data
Number of deaths over 2 years
Numbers are over 2 years
Rate of deaths

Opioid-Related Mortality (may be related to prescription and/or illicit use)
0.3 0.3 0.3 0.3 0.3
0.5 0.5
0.9 0.9 0.9
1.2
0.9
1.2 1.3
1.0
1.8
1.6 1.5
0.0
0.5
1.0
1.5
2.0
2004 2005 2006 2007 2008 2009 2010 2011 2012 2013 2014 2015
Op
ioid
-rel
ated
dea
th r
ate
p
er 1
0,0
00
peo
ple
General Population First Nations
0.4 0.4 0.4 0.4 0.4 0.4
Rate of Opioid-Related Deaths in 2004-2015
NOTE: We were not able to present the 2004-2015 opioid-related deaths by on/off reserve due to the presence of small cells.
Rates of opioid-related deaths between 2004 and 2015 are consistently higher among First Nations people compared to the general population.
Moreover, the rates of opioid-related deaths have been increasing to a greater extent in First Nations people compared to the general population.
WHAT ARE THE IMPLICATIONS OF OPIOID USE? Data source:
Coroner Death Data
Rate

OVERVIEW & MOVING FORWARD In summary, the rates of prescribing of opioids, doses dispensed, and opioid-related hospitalizations are higher in First Nations people compared to the general population; and higher among First Nations people living off reserve compared to those living on reserve. The rate of opioid-related deaths also appear to be higher in First Nations people compared to the general population. Moving forward, it will be important to understand if clustering of high rates of prescribing and toxicity events exist in certain regions in Ontario. Another key step will be to work towards obtaining permission to link the IRS data to the Narcotics Monitoring System (NMS) database for future work. The NMS includes records on all prescription opioids dispensed in Ontario, regardless of the type of payer (NIHB, ODB, cash, etc.) The NMS will allow us to better characterize prescribing patterns and dose of opioids.
TECHNICAL APPENDIX
ICES Database Details
Indian Registry System (IRS) file Registered/status First Nations living in Ontario, including non-Ontario Band members, up to 2010.
Registered Persons Database (RPDB) Individuals living in Ontario who are eligible for the Ontario Health Insurance Plan. Includes demographic details (sex, age etc.)
Canadian Institute for Health Information Discharge Abstract Database (CIHI-DAD)
Dataset contains inpatient hospitalization records with reason for visit. Opioid-related toxicity codes used to identify hospitalizations include International Classification of Diseases (ICD-10) codes T40.0, T40.1, T40.2, T40.3, T40.4, T40.6.
Canadian Institute for Health Information National Ambulatory Care Reporting System (CIHI-NACRS)
Dataset contains emergency department visit records with reason for visit. Opioid-related toxicity codes used to identify emergency department visits include ICD-10 codes T40.0, T40.1, T40.2, T40.3, T40.4, T40.6.
Office of the Chief Coroner Death Data
Opioid-related deaths in Ontario abstracted from chart records.
Ontario Drug Benefit (ODB) Database
Prescription drugs received under the ODB program. To be eligible, an individual must have a valid Ontario health card and be aged 65+. Individuals under the age of 65 can also qualify if they have low socio-economic status, receive disability support or home care, have high drug costs relative to household income, or reside in a long-term care home.
NIHB Dataset Details
Non-Insured Health Benefits (NIHB) first payer prescription data
Drugs covered for registered First Nations individuals in Ontario. NIHB is ‘first payer’ for those who are not eligible for ODB.
TABLE 1. SOURCES OF DATA USED IN ANALYSIS

TECHNICAL APPENDIX
ADDITIONAL LIMITATIONS Prescribing data for ODB and NIHB are not linked at the user level, and so we could not calculate the number of individuals receiving prescription opioids from both sources. In addition, some opioid-related deaths in Ontario are missing person identifiers. These will not be counted in the estimates shown since it is unknown if this was a First Nations individual. METHODS OVERVIEW A cross-sectional analysis was conducted among individuals living in Ontario to evaluate the rates of opioid prescribing, opioid-related hospitalizations and emergency department visits, and opioid-related deaths, among registered First Nations and the general population in Ontario. All databases used in this study were linked using unique, encoded identifiers and analyzed at the Institute for Clinical Evaluative Sciences (ICES; www.ices.on.ca) using SAS Enterprise Guide Version 6.1. More detail on the methods used can be found elsewhere.3
ON/OFF RESERVE METHODOLOGY
How did we determine if someone lived on reserve or off reserve?
Did the person have a hospital record/ER visit for the specified year?
Did their hospital record indicate that they lived
in a First Nations reserve community?
Was their postal code associated with a First
Nations reserve community?
On reserve Off reserve Off reserve
YES
YES NO
NO
On reserve
YES NO

ACKNOWLEDGEMENTS This study was supported by the Institute for Clinical Evaluative Sciences (ICES), which is funded by an
annual grant from the Ontario Ministry of Health and Long-Term Care (MOHLTC). This study was also supported by the Ontario Drug Policy Research Network (ODPRN) which is funded by a grant from the Ontario MOHLTC, as well as the Ontario Strategy for Patient-Orientated Research (SPOR) Support Unit which is supported by the Canadian Institutes of Health Research and the Province of Ontario. The opinions, results and conclusions reported in this paper are those of the authors and are independent from the funding sources. No endorsement by ICES, the SPOR Unit or the Ontario MOHLTC is intended or should be inferred. We thank IMS Brogan Inc. for use of their Drug Information Database.
Parts of this material are based on data and information provided by Cancer Care Ontario (CCO). The opinions, results, view, and conclusions reported in this paper are those of the authors and do not necessarily reflect those of CCO. No endorsement by CCO is intended or should be inferred.
Parts of this material are based on data and information compiled and provided by the Canadian Institute for Health Information (CIHI). However, the analyses, conclusions, opinions and statements expressed herein are those of the author, and not necessarily those of CIHI.
These datasets were linked using unique encoded identifiers and analyzed at the Institute for Clinical Evaluative Sciences.
CONTRIBUTORS ICES: Joe Eibl, Kinwah Fung, Vasily Giannakeas, Tara Gomes, David Henry, Diana Martins, Evelyn Pyper, Jennifer Walker
COO: Tracy Antone, Laurie Carr, Bernadette deGonzague, Carmen Jones, Emily King, Alexander Yurkiewich
COO Opioid Surveillance Steering Committee: Natalie Binguis, Yvonne Corbiere, Lori Davis Hill, Judy Desmoulin, Penny Hill, Megan Logan, Noella Mandamin, Suzanne Nicholas, Shirley Williams (Elder)

1. Centers for Disease Control and Prevention, National Center for Injury Prevention and Control, Division of Unintentional Injury Prevention. [Webpage]. Available from: https://www.cdc.gov/drugoverdose/prescribing/patients.html
2. Centers for Disease Control and Prevention. Calculating Total Daily Dose of Opioids for Safer Dosage. 2017. [Clinical Guideline]. Available from: https://www.cdc.gov/drugoverdose/pdf/calculating_total_daily_dose-a.pdf
3. The Ontario Drug Policy Research Network. Opioid Use and Related Adverse Events in Ontario. November 2016.
[Report]. Available from: http://odprn.ca/wp-content/uploads/2016/11/ODPRN-Opioid-Use-and-Related-Adverse-Events-Nov-2016.pdf
REFERENCES
CONTACT
For more information, please contact the ICES Indigenous Portfolio, at: