first edition 2017 - south african rand and publications...contents overview 1 financial stability...
TRANSCRIPT
Financial Stability ReviewFirst edition
2017
South African Reserve Bank
Financial Stability ReviewFirst edition
2017
© South African Reserve Bank
All rights reserved. No part of this publication may be reproduced, stored in a retrieval system or transmitted in any form or by any means, electronic, mechanical, photocopying, recording or otherwise, without fully acknowledging the Financial Stability Review of the South African Reserve Bank as the source. The contents of this publication are intended for general information only and are not intended to serve as financial or other advice. While every precaution is taken to ensure the accuracy of information, the South African Reserve Bank shall not be liable to any person for inaccurate information and/or opinions contained in this publication. Unless indicated otherwise, data were supplied by the South African Reserve Bank.
This issue of the Financial Stability Review focuses mainly on the six-month period ending December 2016. However, selected developments up to the date of publication are also reported on. Data may include own calculations made for the purposes of this publication.
Comments and enquiries relating to this Financial Stability Review are welcomed and should be addressed to:
Head: Financial Stability DepartmentSouth African Reserve BankP O Box 427Pretoria 0001
Tel. +27 12 313 3601E-mail: [email protected]
www.resbank.co.za ISSN: 1811-2226

Purpose of the Financial Stability Review
The primary objective of the South African Reserve Bank (SARB) is to protect the value of the currency in the interest of balanced and sustainable economic growth in South Africa.
In addition to this, the SARB’s mandate and function of protecting and enhancing financial stability in the Republic of South Africa is affirmed in the Financial Sector Regulation Bill 2015 which is expected to be promulgated in 2017. In pursuit of this objective and to promote a stable financial system, the SARB publishes a semi-annual Financial Stability Review. The publication aims to identify and analyse potential risks to financial system stability, communicate such assessments and stimulate debate on pertinent issues.
The SARB recognises that it is not the sole custodian of financial system stability in South Africa but that it nevertheless coordinates and contributes significantly towards a larger effort involving government, other regulators, self-regulatory agencies and financial market participants.
Defining ‘financial stability’
Financial stability is not an end in itself but, like price stability, it is generally regarded as an important precondition for sustainable economic growth, development and employment creation.
Financial stability refers to a financial system that is resilient to systemic shocks, facilitates efficient financial intermediation, and mitigates the macroeconomic costs of disruptions in such a way that confidence in the system is maintained.

Contents
Overview ............................................................................................................................ 1Financial stability developments and trends ........................................................................ 2 Economic growth and outlook for advanced economies and emerging markets ................................................................................................. 2 Global and domestic debt dynamics ........................................................................... 5 Financial market developments and trends .................................................................. 6 Financial institutions ..................................................................................................... 6 Non-financial institutions .............................................................................................. 13 Households ................................................................................................................. 15 Residential real estate .................................................................................................. 18 Government finances................................................................................................... 18 Adequacy of foreign exchange reserves ...................................................................... 19The robustness of the domestic financial infrastructure ...................................................... 23 Update on the Financial Sector Regulation Bill 2015 .................................................... 23 Final credit regulations issued ...................................................................................... 23 Regulatory developments affecting the domestic banking sector ................................. 23 Regulatory developments affecting the domestic insurance sector .............................. 25 Regulatory developments affecting the domestic financial markets .............................. 25Financial stability risks and outlook ..................................................................................... 28 Update on financial stability risks ................................................................................. 28 Update on the financial cycle ....................................................................................... 29Macroprudential policy regulation ....................................................................................... 30 Assessing the application of the countercyclical capital buffer for banks ...................... 30 Consideration for the activation of the countercyclical capital buffer for banks ................... 31NOTE: A new macroprudential policy framework for South Africa ....................................... 32Abbreviations ..................................................................................................................... 37
Box
1 Implications of a sub-investment grade for South Africa ................................................. 21
Figures
1 Real economic growth in selected developed eonomies .............................................. 22 Real gross domestic product growth in sub-Saharan Africa ........................................ 43 South Africa: Real GDP growth outcomes and projection ............................................ 44 Total global debt .......................................................................................................... 55 Advanced economies: sectoral indebtedness as a percentage of GDP ....................... 56 Emerging markets: sectoral indebtedness as a percentage of GDP ............................. 57 South African non-financial corporate sector debt as a percentage of GDP ................. 68 Morgan Stanley Capital International 12-month forward earnings annual growth rate ... 69 Performance of asset classes after the US elections.................................................... 610 Improvement in emerging market portfolio flows .......................................................... 711 Total banking sector assets ......................................................................................... 712 Banking sector assets, excluding the five largest banks ............................................... 913 Composition of the income statement of the five largest banks ................................... 914 Composition of the income statement of all banks, excluding the five largest banks .... 915 Impaired advances of the five largest and other banks ................................................. 1016 Credit default ratios of the main asset categories ......................................................... 1017 Investment allocations of pension funds ...................................................................... 1018 Distribution of financial assets between financial intermediaries in jurisdictions that
participated in the global shadow-banking exercise in 2015 ......................................... 1119 Distribution of financial assets between financial intermediaries in South Africa ........... 12
20 Shadow-banking activities ........................................................................................... 1221 South African money market fund exposures .............................................................. 1322 Non-financial corporates’ domestic debt securities and international debt securities ... 1423 Non-financial corporate sector: aggregate interest coverage ratio ................................ 1524 Non-financial corporate sector: sectoral interest coverage ratio ................................... 1525 Non-financial corporate sector: EDF distribution of South African incorporated firms ... 1626 Composition of household debt ................................................................................... 1727 Spread between average household borrowing interest rates and prime rate .............. 1728 Consumer Financial Vulnerability Index and Consumer Confidence Index .................... 1829 Real house price growth in South Africa ...................................................................... 1830 Mortgage-instalment-to-rent and price-to-rent ratios ................................................... 1931 Loan debt of national government ............................................................................... 1932 General government debt-to-GDP ratios of BRICS countries ....................................... 1933 Government debt holdings by domestic financial institutions ....................................... 2034 Domestic vs global foreign reserve holdings ................................................................ 2035 Reserve adequacy for South Africa .............................................................................. 2036 The financial cycle, its components and downward phases of the business cycle ....... 2937 Private sector credit-to-GDP gap ................................................................................. 3038 Private sector credit-to-GDP gap: households and corporates .................................... 3039 Selected private sector credit-to-DGP gaps according to asset class .......................... 30
Tables
1 Selected indicators of the South African banking sector .............................................. 82 Performance indicators for primary short-term insurers ............................................... 113 Spread and categorisation of assets of primary long-term insurers
(excluding professional reinurers and insurance companies in runoff) .......................... 114 Free assets-to-capital-adequacy requirement of all long-term primary insurers ............ 125 Selected indicators for the corporate sector ................................................................ 136 Business confidence index .......................................................................................... 147 Selected indicators for the household sector ............................................................... 178 Risk assessment matrix ............................................................................................... 28
1Financial Stability Review first edition 2017
Overview
The strong inter-relationship between financial stability and economic growth necessitates close attention to recent developments and expectations in these areas both globally and domestically in order to determine the potential impact on the South African financial system. While global economic activity remained subdued during the six months ending 2016, the International Monetary Fund increased its economic growth forecasts for 2017 but kept its forecast for 2018 unchanged, supported by a more positive outlook for advanced economies and expectations of stronger growth in emerging markets. Economic growth in sub-Saharan Africa is also expected to improve as global growth prospects improve. Forecasts for South Africa’s economic growth for 2016 and 2017 were kept unchanged compared with previous forecasts.
Global debt levels have been increasing consistently over the past decade, raising concerns about its sustainability and potential implications for financial stability. Leading this increase was the non-financial corporate sector, making this sector vulnerable to interest rate changes and foreign exchange rate risks. For South Africa’s non-financial corporate sector, the largest exposure is in local currency which peaked in 2009 and has since stabilised. Capital flows to emerging-market economies have improved following, among other things, expectations of reduced risks of a hard lending in China, more gradual policy normalisation in advanced economies and improved investor sentiment of global economic prospects. The sustainability of these capital flows remains a concern should the Federal Reserve raise interest rates more aggressively in future.
South Africa’s sovereign credit ratings for both foreign and local currency have increasingly been under pressure following, among other reasons, a deteriorating economic and fiscal outlook and increased political risks. Triggered by a cabinet reshuffle by the President on 31 March 2017, two rating agencies downgraded South Africa’s sovereign credit rating, citing heightened political tensions and increased policy uncertainty as the main reasons for the downgrades. According to the rating agencies, the cabinet reshuffle is likely to alter the direction of economic policy in South Africa and undermine fiscal policy management. The sub-investment grade ratings assigned to South Africa and the prospect of further downgrades to the local currency rating has also raised concerns about South Africa’s inclusion in key global bond indices. Because the sovereign credit rating acts as a ceiling for bank ratings, seven of the domestic banks had to be changed to sub-investment grade. A sell-off of bank shares at the time led to a significant drop in banks’ market capitalisation. Banks were subjected to a common scenario stress test in 2016, which indicated that South African banks could withstand significant adverse scenarios. The resilience of banks stems from the high capital buffers that are held.
Lending conditions in emerging markets remained tight during the period under review. For sub-Saharan countries in particular, the current elevated levels of political risks are expected to increase further and contributed to tighter lending standards for both corporate and consumer loans. The South African banking sector has been characterised during the period under review by slowing asset growth, muted credit risk, marginally lower profitability and adequate levels of capital. The moderation in asset growth could mainly be ascribed to a decline in loans and advances, and more specifically to term loans, commercial
mortgages, and investments and trading securities. Credit risk remained steady but provisioning for bad loans increased. The moderation in asset growth could make it difficult for banks in future to maintain the current levels of profitability. Other non-bank financial institutions, namely pension funds and provident funds as well as the insurance sector, remained adequately capitalised and profitable during the period under review. South Africa again participated in the shadow-banking monitoring exercise conducted by the Financial Stability Board and will continue monitoring domestic shadow-banking activities.
Households remained financially vulnerable because of high debt levels. Balance sheets of households also weakened slightly during the period under review while growth in disposable income slowed. Consumption expenditure therefore also remained subdued. The weak domestic economic environment, inflationary pressures and high unemployment continued to constrain households’ financial positions. Whereas growth in household debt moderated during the period under review, growth in government debt continued its general upward trend. Pension and provident funds remained the biggest holders of government debt. South Africa’s reserves adequacy decreased marginally during the reporting period, but remained at an acceptable level.
Various developments during the period under review contributed to the robustness of the domestic financial system. Included is the Financial Sector Regulation Bill 2015 which was approved by the National Assembly and moved to the second house of Parliament for approval. It is expected that the implementation of the Financial Sector Regulation Bill 2015 will be phased in from 2017. Also published are the final regulations pertaining to credit life insurance. As part of its reforms in response to the global financial crisis, there is also a drive to a more forward-looking accounting treatment for expected loan losses with the implementation of the International Financial Reporting Standard 9. The South African Reserve Bank has been interacting with the banks to monitor their preparedness to implement the applicable models to comply with this standard of accounting. This change could also have financial stability implications since it is expected that loan loss provisioning, being more forward-looking, would be more aligned to the trends of the business cycle and therefore could amplify peaks and troughs in the credit cycle.
There is growing consensus among jurisdictions globally to direct regulatory frameworks towards placing more emphasis on mitigating systemic risks in the financial system. Included in this edition is a summary of the proposed new macroprudential policy framework, which outlines the SARB’s approach to executing its financial stability policy once mandated.
In its regular assessment of potential risks to financial stability, the SARB also publishes its view of risks and vulnerabilities in the domestic financial system that could materialise in the next 12 months. Potential risks include further credit rating downgrades, tougher conditions for banks to operate in, policy uncertainty in the United States and financial system vulnerabilities in Europe. As part of its responsibilities, the Financial Stability Committee of the SARB also regularly assesses the need for mitigating action. Based on current available data and trends, the Financial Stability Committee has decided not to activate the countercyclical buffer for banks at its latest meeting in February 2017.
Financial Stability Review first edition 20172
Financial stability developments and trends
Economic growth and outlook for advanced economies and emerging marketsThe global financial crisis again confirmed the strong link between financial stability and economic growth. During periods of high uncertainty and excessive market volatility, investors tend to become more risk-averse towards certain asset classes, owing to a lack of certainty on the fundamental value of assets. Hence, institutions become more cautious about their investment decisions and households tend to reduce their spending. These actions can lead to a slowdown or even a contraction in economic activity and can result in negative feedback loops between the financial system and the real economy. Low levels of economic growth and output impact negatively on financial stability through higher unemployment and the reduced ability of households and corporates to service their debts with financial institutions. It is therefore important to monitor trends in both the real economy and the financial sector to assess possible spillovers that are systemic in nature and could affect the stability of the financial system as a whole.
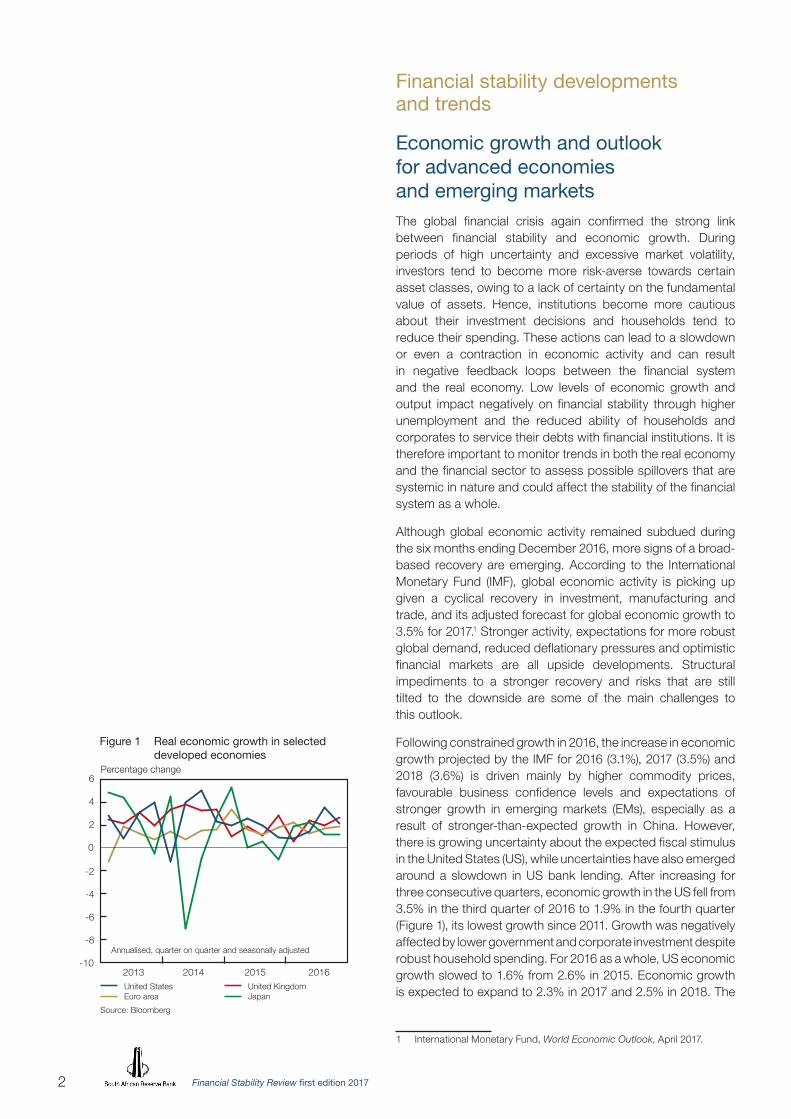
Although global economic activity remained subdued during the six months ending December 2016, more signs of a broad-based recovery are emerging. According to the International Monetary Fund (IMF), global economic activity is picking up given a cyclical recovery in investment, manufacturing and trade, and its adjusted forecast for global economic growth to 3.5% for 2017.1 Stronger activity, expectations for more robust global demand, reduced deflationary pressures and optimistic financial markets are all upside developments. Structural impediments to a stronger recovery and risks that are still tilted to the downside are some of the main challenges to this outlook.
Following constrained growth in 2016, the increase in economic growth projected by the IMF for 2016 (3.1%), 2017 (3.5%) and 2018 (3.6%) is driven mainly by higher commodity prices, favourable business confidence levels and expectations of stronger growth in emerging markets (EMs), especially as a result of stronger-than-expected growth in China. However, there is growing uncertainty about the expected fiscal stimulus in the United States (US), while uncertainties have also emerged around a slowdown in US bank lending. After increasing for three consecutive quarters, economic growth in the US fell from 3.5% in the third quarter of 2016 to 1.9% in the fourth quarter (Figure 1), its lowest growth since 2011. Growth was negatively affected by lower government and corporate investment despite robust household spending. For 2016 as a whole, US economic growth slowed to 1.6% from 2.6% in 2015. Economic growth is expected to expand to 2.3% in 2017 and 2.5% in 2018. The
1 International Monetary Fund, World Economic Outlook, April 2017.
Percentage change
2013 2014 2015 2016 United States Euro area
Source: Bloomberg
United Kingdom Japan
-10
-8
-6
-4
-2
0
2
4
6
Figure 1 Real economic growth in selected developed economies
Annualised, quarter on quarter and seasonally adjusted

3Financial Stability Review first edition 2017
stronger outlook for economic growth reflects expectations of a cyclical recovery in inventory accumulation, stronger consumption expenditure growth, and a somewhat more relaxed US fiscal policy.
Economic growth in the euro area slowed to 1.7% in 2016 from 2.0% in 2015 due to a decrease in domestic demand and lower exports. Output is expected to increase by 1.7% in 2017 and 1.6% in 2018, supported by a mild fiscal expansionary stance amid more accommodative financial conditions, a weaker euro, and positive spillovers for US fiscal policy stimulus. Factors that are, however, expected to weigh on the region include political uncertainty in some countries because of upcoming elections and uncertainty about the European Union’s (EU) future relationship with the United Kingdom (UK). Economic growth in the UK slowed to 1.8% in 2016 from 2.2% in 2015. Fixed investment and household consumption were the main drivers of growth while business investment contracted for four consecutive quarters. The IMF increased its growth projection to 2.0% in 2017 and 1.5% in 2018, reflecting the stronger-than-expected growth performance of the UK following the Brexit vote results and the depreciation of the pound sterling. Japan’s economic growth slowed to 1% in 2016 from 1.2% in 2015. Economic growth projections for Japan have been revised upwards to 1.2% for 2017 but downwards to 0.6% for 2018.
EMs benefited from improved yield differentials owing to lower global interest rates, firmer commodity prices and economic stabilisation in China. China remained a significant driver of EM growth, but weaker-than-expected growth in some Latin American countries (such as Argentina and Brazil) weighed on economic growth potential. The main risks to the EM growth outlook are sharp increases in US interest rates and aggressive US protectionist policies. US dollar appreciation in reaction to higher US interest rates could trigger capital outflows from EMs, also resulting in currency depreciation. In addition, the high levels of corporate debt in many EMs, including China, have weakened the debt-servicing capacity of institutions and this could undermine the resilience of these economies. Despite general expectations that growth in China will pick up somewhat, the IMF projects growth to stabilise at 6.6% in 2017 from 6.7% in 2016 but then to slow to 6.2% in 2018. While policy support is expected to continue, rising debt levels and complicated trade relationships due to growing US protectionism could threaten the country’s growth outlook.
In 2016, sub-Saharan Africa (SSA) continued to be affected by severe drought conditions in southern and eastern Africa, a slowdown in the region’s trading partners (mainly China), and tighter financing conditions. Furthermore, country-specific factors such as political instability and electricity constraints have had a negative impact on economic growth. Although the IMF expects economic growth to recover in 2017 due to an expected further recovery in commodity prices, the recovery will largely depend on country-specific policy actions to address significant macroeconomic imbalances and heightened policy uncertainty prevalent in several of the region’s large

Financial Stability Review first edition 20174
economies.2 Uncertainty surrounding the US policy stance and the unknown full impact of Britain’s exit from the EU is also expected to affect economic growth.
According to the IMF’s latest forecast, the growth rate in SSA is expected to improve from 1.4% in 2016 to a downwards revised 2.6% in 2017,3 as global growth prospects improve (Figure 2). Growth in oil-exporting countries and other resource-intensive countries is projected to increase due to an expected recovery in commodity prices. Nigeria’s and South Africa’s economic growth rates are both expected to increase to 0.8% in 2017, improving the overall growth rate for the region. Economic growth in oil-importing countries is forecast to rise to 4.2% in 2017 from 3.4% of 2016, largely attributed to continued strong infrastructure investment.
In South Africa, low gross domestic product (GDP) growth of 0.3% for 2016 as a whole was recorded, largely owing to weak domestic demand, lower output in the mining and manufacturing sectors, and some other idiosyncratic factors. Nevertheless, the South African Reserve Bank’s (SARB) composite leading business cycle indicator has been trending upwards since August 2016. Also, the Absa Purchasing Managers’ Index (PMI)4 breached the 50-index-point neutral mark for January 2017 but the BankservAfrica Economic Transaction Index (BETI)5 remained unchanged between December 2016 and January 2017. The fan chart (Figure 3) indicates the SARB’s forecast for economic growth for the next two years: 1.2% in 2017, 1.7% in 2018 and 2.0% in 2019.6
A country’s sovereign credit rating reflects its credit worthiness. As was discussed in the second edition 2016 of the Financial Stability Review, the South African sovereign credit rating for foreign currency-denominated debt has been under pressure for some time following, among other reasons, a deteriorating economic and fiscal outlook and increased political risks (see Box 1). Despite the short-term indicators of real economic activity suggesting a more positive outlook for economic growth in the near term, the recent political instability moved rating agencies to downgrade South Africa’s foreign and local currency-denominated debt rating to sub-investment grade. The Bank Supervision Department (BSD) of the SARB and the Financial Services Board (FSB) proactively conducted separate surveys to assess the potential impact on the domestic banking and insurance sectors of what was then just a possible sovereign credit rating downgrade. Based on the results of these surveys, a sovereign credit rating downgrade to sub-investment grade was not envisaged to have a destabilising effect on the functioning of the domestic financial system. In addition, as reported in the second edition 2016 of the Financial Stability
2 International Monetary Fund, Sub-Saharan Regional Report, October 2016.
3 International Monetary Fund, World Economic Outlook, April 2017.4 Absa PMI, Bureau for Economic Research, Stellenbosch University,
1 February 2017.5 BankservAfrica, BankservAfrica Economic Transaction Index, 13 February
2017. The BankservAfrica Economic Transaction Index is an early economic scorecard which provides an overall trend in economic activity in the near term.
6 South African Reserve Bank, Monetary Policy Committee Statement, 30 March 2017, as well as Monetary Policy Review, April 2017.
Per cent
2007 2009 2011 2013 2015 2017
Figure 2 Real GDP growth in sub-Saharan Africa
-5
0
5
10
15
20
25
Ghana Kenya Zambia
Source: IMF and IFS
Angola Nigeria Sub-Saharan Africa
IMFforecast
Côte d’Ivoire South Africa Emerging markets
Percentage change
Figure 3 South Africa: Real GDP* growth outcomes and projection**
2009 2011 2013 2015 2017 2019-8
-6
-4
-2
0
2
4
6
8
* At seasonally adjusted annualised rates
** Fan charts reflect uncertainty associated with the projections at different horizons through a range of confidence intervals. The darkest band at the centre of the fan chart represents the most likely 10.0% of the probable outcomes, including the central projections. Moving away from the central projections, the area covered by each succes-sive band, shaded slightly lighter and added on either side of the central band, adds a further 20.0% to the probability, until the whole shaded area depicts a 90% confidence interval. The width of the coloured confidence bands is an indication of the estimated uncertainty.
Sources: SARB and Stats SA
5Financial Stability Review first edition 2017
Review, initial short-term losses could be expected in the currency and bond markets as well as an outflow of capital. However, the losses were expected to be short-lived, with little or no impact on the functioning of the financial markets.
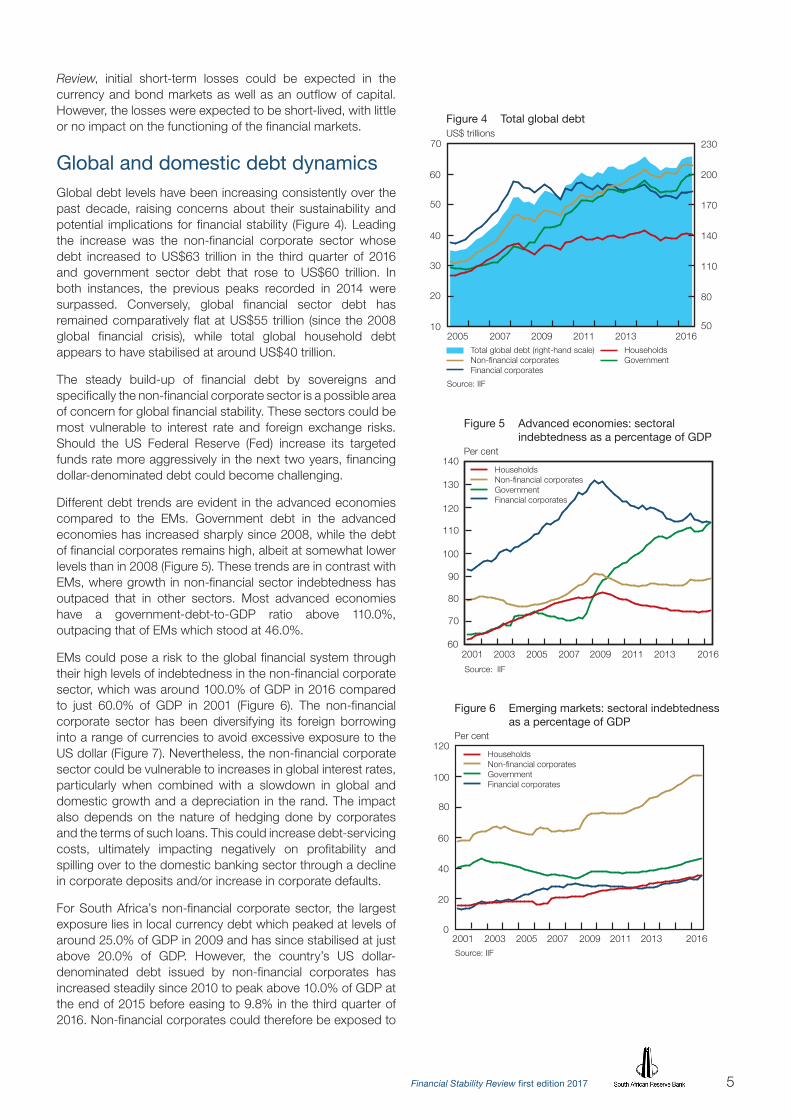
Global and domestic debt dynamics Global debt levels have been increasing consistently over the past decade, raising concerns about their sustainability and potential implications for financial stability (Figure 4). Leading the increase was the non-financial corporate sector whose debt increased to US$63 trillion in the third quarter of 2016 and government sector debt that rose to US$60 trillion. In both instances, the previous peaks recorded in 2014 were surpassed. Conversely, global financial sector debt has remained comparatively flat at US$55 trillion (since the 2008 global financial crisis), while total global household debt appears to have stabilised at around US$40 trillion.
The steady build-up of financial debt by sovereigns and specifically the non-financial corporate sector is a possible area of concern for global financial stability. These sectors could be most vulnerable to interest rate and foreign exchange risks. Should the US Federal Reserve (Fed) increase its targeted funds rate more aggressively in the next two years, financing dollar-denominated debt could become challenging.
Different debt trends are evident in the advanced economies compared to the EMs. Government debt in the advanced economies has increased sharply since 2008, while the debt of financial corporates remains high, albeit at somewhat lower levels than in 2008 (Figure 5). These trends are in contrast with EMs, where growth in non-financial sector indebtedness has outpaced that in other sectors. Most advanced economies have a government-debt-to-GDP ratio above 110.0%, outpacing that of EMs which stood at 46.0%.
EMs could pose a risk to the global financial system through their high levels of indebtedness in the non-financial corporate sector, which was around 100.0% of GDP in 2016 compared to just 60.0% of GDP in 2001 (Figure 6). The non-financial corporate sector has been diversifying its foreign borrowing into a range of currencies to avoid excessive exposure to the US dollar (Figure 7). Nevertheless, the non-financial corporate sector could be vulnerable to increases in global interest rates, particularly when combined with a slowdown in global and domestic growth and a depreciation in the rand. The impact also depends on the nature of hedging done by corporates and the terms of such loans. This could increase debt-servicing costs, ultimately impacting negatively on profitability and spilling over to the domestic banking sector through a decline in corporate deposits and/or increase in corporate defaults.
For South Africa’s non-financial corporate sector, the largest exposure lies in local currency debt which peaked at levels of around 25.0% of GDP in 2009 and has since stabilised at just above 20.0% of GDP. However, the country’s US dollar-denominated debt issued by non-financial corporates has increased steadily since 2010 to peak above 10.0% of GDP at the end of 2015 before easing to 9.8% in the third quarter of 2016. Non-financial corporates could therefore be exposed to
50
80
110
140
170
200
230US$ trillions
2005 2007 201320112009 2016 Total global debt (right-hand scale) Non-financial corporates Financial corporates
Source: IIF
Households Government
Figure 4 Total global debt
10
20
30
40
50
60
70
Per cent
2001 2003 2009 2011 201320072005 2016
Source: IIF
Figure 5 Advanced economies: sectoral indebtedness as a percentage of GDP
60
70
80
90
100
110
120
130
140 Households Non-financial corporates Government Financial corporates
Per cent
2001 2003 2009 2011 201320072005 2016Source: IIF
Figure 6 Emerging markets: sectoral indebtedness as a percentage of GDP
0
20
40
60
80
100
120 Households Non-financial corporates Government Financial corporates

Financial Stability Review first edition 20176
interest rate and foreign exchange rate risks if the Fed were to sustain its interest rate hiking cycle.
Financial market developments and trends
A cyclical recovery in global earnings underpins a rebound in demand for risky assets. The earnings outlook for South African equities continues to lag its international peers despite a significant recovery in expected earnings for EMs that have been supported by stronger economic growth prospects, firmer commodity prices and economic improvement in China (Figure 8).
The global high-yield corporate bond index continues to outperform other investment asset classes by a large margin (Figure 9). Since the US presidential elections in November 2016, demand for high-yield corporate bonds has outperformed the EMs bond index, although the trend has remained positive for both indices.
Capital flows to EMs have improved (Figure 10). Total non-resident portfolio flows to EMs increased to US$4.5 billion in March 2017, spurred by a sharp rise in bond purchases of US$3.6 billion. This was significantly higher than the US$0.9 billion purchases of EM equities over the same period. In line with the decline in demand for some EM equities toward the end of the first quarter of 2017, South Africa recorded cumulative net equity outflows of US$428 million in the first three weeks of March 2017.7
Elevated political and policy uncertainties in some major advanced economies have contributed to a marked decline in EMs’ risk premium, which could render support for increased demand for riskier assets. In addition, EM equities have continued to trade at a discount relative to equities in the advanced markets, which could cushion EMs against a possible global equity market reversal. However, the sustainability of capital flows to EMs remains a concern for global financial stability should the Fed raise interest rates more aggressively in future.
Financial institutions
Banks and bank lending conditions
Although the bank lending conditions in EMs improved slightly from the third quarter of 2016, lending standards remained tight and below the neutral 50-index-point level.8 For SSA countries in particular, the current elevated levels of political risks are expected to increase even further according to the Institute of International Finance (IIF).
7 Institute of International Finance, Emerging Market Bank Lending Conditions Survey, December 2016.
8 Institute of International Finance, Emerging Market Bank Lending Conditions Survey, December 2016.
Per cent
2009 2011 201320072005 2016 US dollar-denominated Other currencies-denominated
Source: IIF
Euro-denominated Rand-denominated (right-hand scale)
Figure 7 South African non-financial corporate sector debt as a percentage of GDP
0
2
4
6
8
10
12
0
5
10
15
20
25
30
Per cent
2010 2012 2014 2016 20172008
Source: Bloomberg
Figure 8 Morgan Stanley Capital International 12-month forward earnings annual growth rate
-60
-40
-20
0
20
40
60 Emerging markets Europe South Africa
China World
Indices: 1 January 2016 = 100
F2016 2017
J AM FJ MJM A S O N DJ
Emerging markets sovereign bond index US government bond index Global high-yield corporate bond index Global investment grade corporate bond index MSCI global equity index
Source: Bloomberg
Figure 9 Performance of asset classes after the US elections
85
90
95
100
105
110
115
120

7Financial Stability Review first edition 2017
Unlike other EM regions surveyed by the IIF, SSA recorded a tightening of lending standards for both corporate and consumer loans. Other than commercial real estate loans, an increase in the demand for corporate and consumer loans was recorded. Funding conditions tightened at a faster pace compared to the previous quarter and remained well below the neutral level. Non-performing loans also increased when compared to the previous quarter. While South African retail banks adopted a neutral stance on their lending standards in the fourth quarter of 2016, they shifted to a slightly easier stance in the first quarter of 2017. Although lending standards for both households and firms were eased, the standards for households remained noticeably tighter.9
The South African banking sector remained sound and well capitalised. Some key banking sector indicators are shown in Table 1. The five largest banks in terms of assets continued to hold more than 90.0% of total assets of the banking sector. The concentration of assets in these five banks increased from an average of 80.0% in 1994–2002 to an average of about 90.0% to date.
During the period under review, the domestic banking sector was characterised by slowing asset growth (Figure 11), muted credit risk, marginally lower profitability and adequate levels of capital. Growth in total assets moderated from 7.1% year on year in August 2016 to 1.0% in January 2017. This moderation in growth could mainly be ascribed to a decline in loans and advances, more specifically to a decline in term loans, commercial mortgages, and investments and trading securities. Capital adequacy consistently remained above the minimum regulatory requirement of 9.75%.
Impaired advances as a percentage of total loans and advances (a key indicator of credit risk) stabilised at 2.9% from October 2016, mainly brought about by a steady decrease in impaired advances despite a slight uptick in January 2017. Specific credit impairments as a percentage of impaired loans (an indicator of the level of provisioning made for impaired loans) increased from 39.1% in August 2016 to 43.6% in January 2017.
9 Lending standards for the South African banking sector are compiled by the Bureau for Economic Research and used a net balance statistic to interpret the survey results. The net balance is the percentage of bank survey respondents who tightened lending standards compared with the same quarter a year earlier minus those banks that eased lending standards. The percentage that did not make changes is ignored.
US$ billions
2016J F M J F MA A S O N DM J J
2017 Total weekly portfolio flows Weekly net non-resident purchases of emerging market equities Weekly net non-residents purchases of emerging market bonds
Source: IIF
-10
-8
-6
-4
-2
0
2
4
6
Figure 10 Improvement in emerging market portfolio flows
R trillions Twelve-month percentage changeFigure 11 Total banking sector assets
Total assets Growth in total assets (right-hand scale)
Gross loans and advances Growth in gross loans and advances (right-hand scale)
0
1
2
3
4
5
-20
-16
-12
-8
-4
0
4
8
12
16
20
2013 2014 2015 2016 2017

Financial Stability Review first edition 20178
Table 1 Selected indicators of the South African banking sector*
Per cent, unless indicated otherwise
2016/17
Aug Sep Oct Nov Dec Jan
Market share (largest five banks) ..................................... 90.02 90.37 90.68 90.52 90.69 90.45
Gini concentration index .................................................. 82.53 82.67 82.88 82.84 82.95 82.80
Herfindahl–Hirschman Index (H-index) ............................. 0.178 0.180 0.181 0.181 0.182 0.180
Banks’ share prices (year-on-year percentage change) ... -6.13 -4.82 -6.03 1.90 23.96 34.50
Balance sheet
Total assets (R billions)..................................................... 4873.6 4852.5 4881.3 4878.8 4876.7 4889.7
Year-on-year percentage change .................................. 7.1 5.2 7.2 4.1 1.0 1.0
Total loans and advances (R billions) ............................... 3710.1 3690.9 3706.2 3707.0 3708.1 3725.7
Year-on-year percentage change .................................. 6.4 4.4 6.1 3.7 3.0 1.4
Capital adequacy
Total capital adequacy ratio ............................................. 15.4 15.5 15.5 15.5 15.9 15.9
Tier 1 capital adequacy ratio ........................................... 12.6 12.6 12.5 12.6 12.9 12.9
Common equity tier 1 capital adequacy ratio................... 12.2 12.2 12.1 12.1 12.4 12.5
Credit risk
Impaired advances (R billions)** ....................................... 117.6 119.8 108.0 105.6 105.9 107.5
Impaired advances to gross loans and advances ........................................................ 3.2 3.3 2.9 2.9 2.9 2.9
Specific credit impairments (R billions) ........................................................................ 45.9 46.5 46.3 46.2 46.4 46.9
Specific credit impairments to impaired advances ........... 39.1 38.8 42.9 43.8 43.9 43.6
Specific credit impairments to gross loans and advances ........................................... 1.24 1.26 1.25 1.25 1.25 1.26
Profitability
Return on assets (smoothed)........................................... 1.23 1.31 1.31 1.33 1.32 1.32
Return on equity (smoothed) ........................................... 17.15 18.03 17.93 18.08 17.69 17.50
Interest margin to gross income (smoothed) .................... 57.21 57.00 57.14 56.95 57.30 57.43
Operating expenses to gross income (smoothed) ............ 54.88 54.62 54.76 54.47 55.07 55.25
Liquidity
Liquid assets to total assets (liquid-asset ratio) ................ 9.60 9.28 9.48 9.80 9.86 9.64
Liquid assets to short-term liabilities ................................ 18.83 18.44 18.63 19.68 18.95 18.93
Liquidity coverage ratio (LCR) .......................................... 100.83 104.17 107.40 117.60 107.83 110.30
* Data were updated on 16 March 2017. ** Impaired advances are advances in respect of which the bank has raised a specific impairment
Sources: SARB. Data on share prices were obtained from JSE Limited

9Financial Stability Review first edition 2017
Banks remained profitable in the aggregate, but should the moderation in asset growth continue, they could find it difficult in future to maintain the levels of profitability recorded in 2016. Net interest income remained the largest portion of total gross operating income. Growth in operating expenses marginally exceeded growth in operating income, causing the cost-to-income ratio, known as the efficiency ratio, to increase marginally to 55.3% in January 2017. Liquid assets as a percentage of total assets and short-term liabilities remained adequate and stable at about 9.6% and 19% respectively. The Basel III liquidity coverage ratio (LCR), indicates that South African banks have sufficient liquid assets of a high quality to address any short-term outflows. In fact, the LCR improved further to 110.0% in January 2017, significantly higher than the minimum requirement of 70.0%.
Despite the smaller banks experiencing declining asset growth (Figure 12), their profitability (as measured by the return on equity (ROE)) increased from 17.0% in June 2016 to 17.5% in January 2017. This increase was largely brought about by increased interest income (emanating from the term loans and ‘other loans’ categories), increased service charge income as well as a reduction in credit losses (Figure 14).
The smaller banks reported an almost 60.0% rise in operating profits. The increased profitability was largely due to a 61.0% decline in credit losses since February 2015, as well as an increase in revenue from service charges and foreign exchange trading income.
Credit risk in the total banking sector remained muted, as reflected by the lower ratio of impaired advances to gross loans and advances, 3.2% in June 2016 compared with 2.9% in January 2017. Decreases in impaired advances were reported by almost all the banks (Figure 15), with the smaller banks reporting year-on-year contractions in impaired advances of between 35.0% and 42.0% since April 2016. The ratio of impaired advances to gross loans and advances of the five largest banks decreased from 3.0% in August 2016 to 2.7% in January 2017. Although there was a marked contraction in the impaired advances of the smaller banks, this contraction was offset by a year-on-year contraction in gross loans and advances evident from November 2016. Specific credit impairments as a percentage of impaired advances increased from 39.1% in August 2016 to 43.6% in January 2017.
R billions 12-month percentage change
Figure 12 Banking sector assets, excluding the five largest banks
Total assets Growth in total assets (right-hand scale)
Gross loans and advances Growth in gross loans and advances (right-hand scale)
0
100
200
300
400
500
600
-20
-10
0
10
20
30
40
2013 2014 2015 2016 2017
-40
-30
-20
-10
0
10
20
30
40
Net interest income Credit losses Indirect taxation
R billions
Figure 14 Composition of the income statement of all banks, excluding the five largest banks
2013 2014 2015 2016 2017 Non-interest income Operating expenses Operating profit
-200
-150
-100
-50
0
50
100
150
200
250
300
Net interest income Credit losses Indirect taxation
R billions
Figure 13 Composition of the income statement of the five largest banks
2013 2014 2015 2016 2017 Non-interest income Operating expenses Operating profit
Financial Stability Review first edition 201710
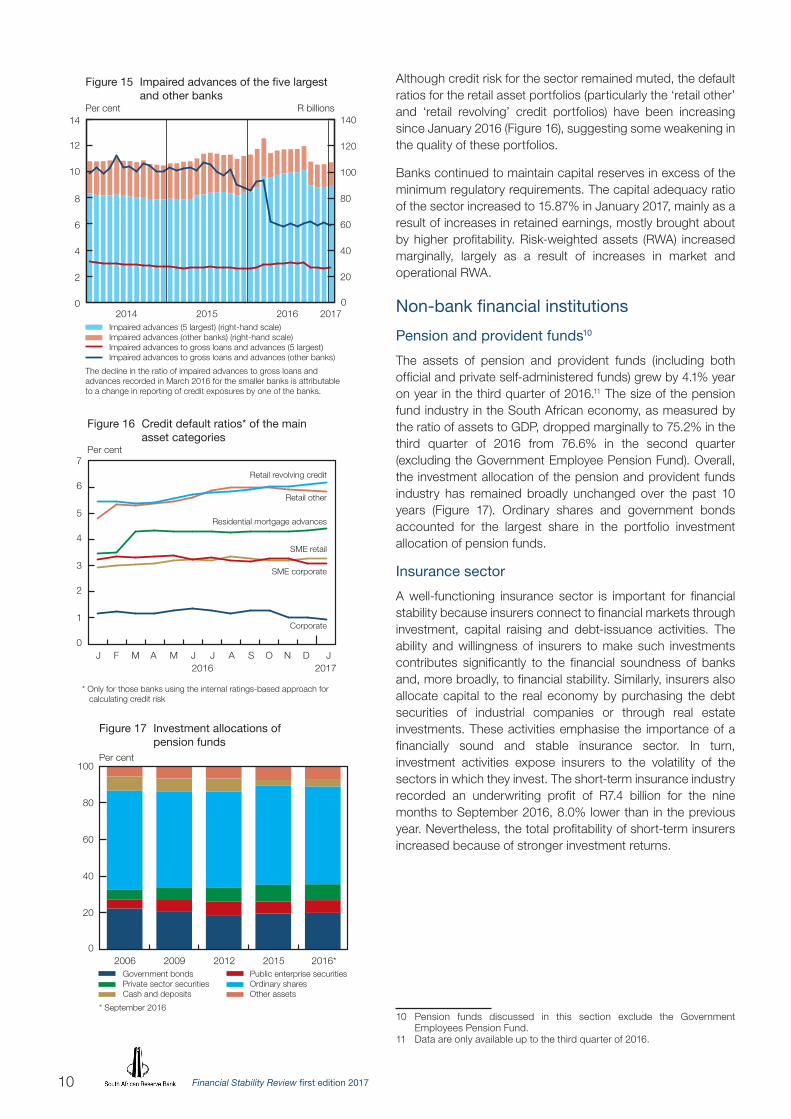
Although credit risk for the sector remained muted, the default ratios for the retail asset portfolios (particularly the ‘retail other’ and ‘retail revolving’ credit portfolios) have been increasing since January 2016 (Figure 16), suggesting some weakening in the quality of these portfolios.
Banks continued to maintain capital reserves in excess of the minimum regulatory requirements. The capital adequacy ratio of the sector increased to 15.87% in January 2017, mainly as a result of increases in retained earnings, mostly brought about by higher profitability. Risk-weighted assets (RWA) increased marginally, largely as a result of increases in market and operational RWA.
Non-bank financial institutions
Pension and provident funds10
The assets of pension and provident funds (including both official and private self-administered funds) grew by 4.1% year on year in the third quarter of 2016.11 The size of the pension fund industry in the South African economy, as measured by the ratio of assets to GDP, dropped marginally to 75.2% in the third quarter of 2016 from 76.6% in the second quarter (excluding the Government Employee Pension Fund). Overall, the investment allocation of the pension and provident funds industry has remained broadly unchanged over the past 10 years (Figure 17). Ordinary shares and government bonds accounted for the largest share in the portfolio investment allocation of pension funds.
Insurance sector
A well-functioning insurance sector is important for financial stability because insurers connect to financial markets through investment, capital raising and debt-issuance activities. The ability and willingness of insurers to make such investments contributes significantly to the financial soundness of banks and, more broadly, to financial stability. Similarly, insurers also allocate capital to the real economy by purchasing the debt securities of industrial companies or through real estate investments. These activities emphasise the importance of a financially sound and stable insurance sector. In turn, investment activities expose insurers to the volatility of the sectors in which they invest. The short-term insurance industry recorded an underwriting profit of R7.4 billion for the nine months to September 2016, 8.0% lower than in the previous year. Nevertheless, the total profitability of short-term insurers increased because of stronger investment returns.
10 Pension funds discussed in this section exclude the Government Employees Pension Fund.
11 Data are only available up to the third quarter of 2016.
Figure 15 Impaired advances of the five largest and other banks
R billionsPer cent
Impaired advances (5 largest) (right-hand scale) Impaired advances (other banks) (right-hand scale) Impaired advances to gross loans and advances (5 largest) Impaired advances to gross loans and advances (other banks)The decline in the ratio of impaired advances to gross loans andadvances recorded in March 2016 for the smaller banks is attributableto a change in reporting of credit exposures by one of the banks.
0
20
40
60
80
100
120
140
0
2
4
6
8
10
12
14
2014 2015 2016 2017
Figure 16 Credit default ratios* of the main asset categoriesPer cent
0
1
2
3
4
5
6
7
2016J J J JF M MA A S O N D
2017
Corporate
SME corporate
SME retail
Residential mortgage advances
Retail other
Retail revolving credit
* Only for those banks using the internal ratings-based approach for calculating credit risk
Figure 17 Investment allocations of pension fundsPer cent
Government bonds Private sector securities Cash and deposits
* September 2016
0
20
40
60
80
100
20122006 2009 2015 2016* Public enterprise securities Ordinary shares Other assets

11Financial Stability Review first edition 2017
Table 2 Performance indicators for primary short-term insurers
Performance indicators
12 months ended
December 2014
12 months ended
December 2015
9 months ended
September 2015
9 months ended
September 2016
Net premium increase (year-on-year percentage change) ....... 11 7 3 2
Loss ratio* ........................................... 60 56 56 58
Combined ratio*# ................................ 83 77 79 79
Management expenses** ..................... 24 23 22 24
Commission** ...................................... 7 7 7 6
Underwriting profit/loss ratio** ............. 9 13 13 12
Underwriting and investment income ratio** ......................................
17 22 20 21
Capital adequacy ratio cover (median) . 2.3 2.4 2.3 2.3
* Expressed as a percentage of net earned premium during the period** Expressed as a percentage of net written premium during the period# Claims plus commission plus expenses less total investment income as a percentage of net earned premium
Source: FSB
Table 3 Spread and categorisation of assets of primary long-term insurers30 (excluding professional reinsurers and insurance companies in runoff)
Kinds of assets
12 months ended December 2014
12 months ended December 2015
9 months ended September 2016
R millions % R millions % R millions %
Cash and deposits 186 022 7 224 582 8 251 165 9
Government and semi-government 190 478 8 181 219 7 185 715 7
Equities and collective investment schemes 1 637 469 65 1 728 878 65 1 769 012 64Debentures and loan stock . 257 257 10 282 721 11 290 107 11
Immovable properties 49 473 2 49 774 2 53 653 2
Fixed assets .... 2 153 0 1 881 0 1 937 0
Debtors ........... 147 790 6 151 173 6 162 332 6
Other assets .... 34 007 1 40 711 1 35 837 1
Total ............... 2 504 650 100 2 660 938 100 2 749 758 100
Source: FSB
Table 4 Free assets-to-capital-adequacy requirement of all long-term primary insurers*
Number of insurers
12 months ended
December 2014
12 months ended
December 2015
9 months ended
September 2015
9 months ended
September 2016
Covered 0–1 time ......... 2 0 0 1
Covered 1–2 times ....... 23 24 25 23
Covered 2–5 times ....... 30 30 29 25
Covered 5–10 times ..... 6 7 8 11
Covered 10+ times ...... 6 7 6 8
* The primary long-term insurance industry includes typical insurers, niche insurers, cell captive insurers, linked investment insurers and assistance insurers, but excludes reinsurers
Source: FSB
Financial Stability Review first edition 201712
The total assets of long-term insurers increased by 3.3% in the nine months to September 2016. The asset composition of long-term insurers also remained fairly stable.
Long-term primary insurers maintained adequate capital buffers. Most long-term insurance companies were covered by a free assets-to-capital-adequacy requirement – also referred to as CAR cover – of 2–5 times. Any insurer with a CAR cover below 1 is investigated and the Registrar of Long-term Insurance takes corrective measures.
Shadow banking
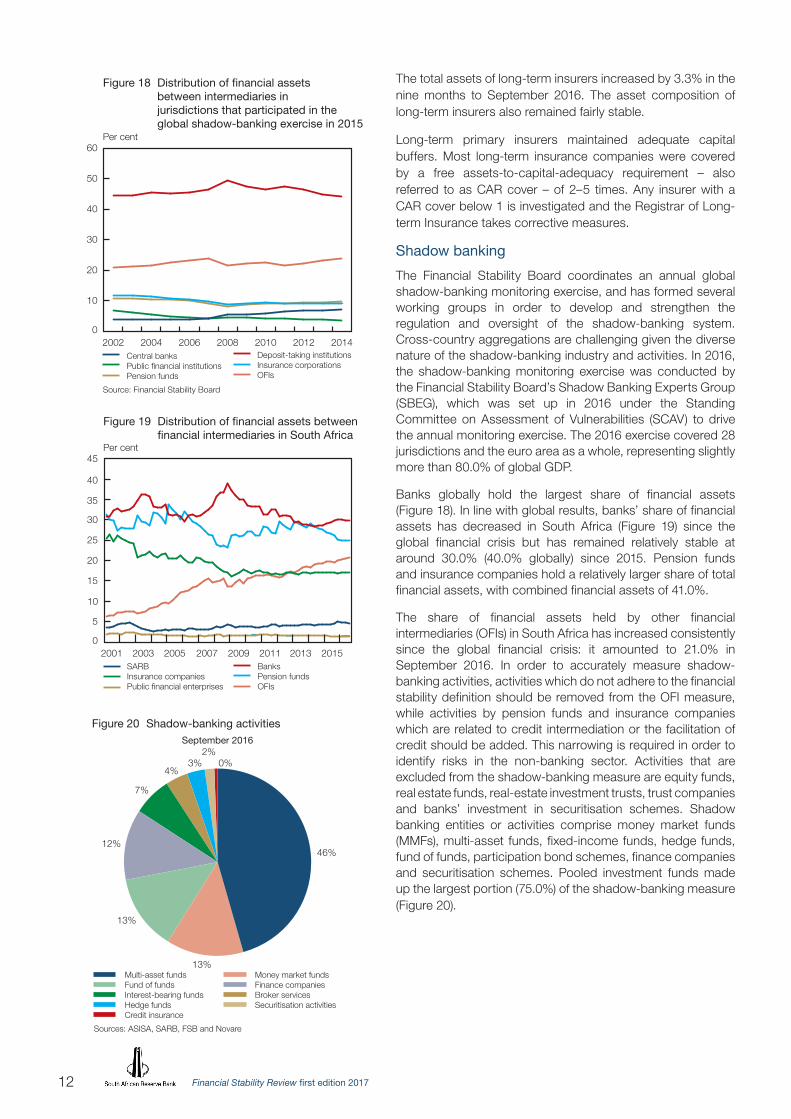
The Financial Stability Board coordinates an annual global shadow-banking monitoring exercise, and has formed several working groups in order to develop and strengthen the regulation and oversight of the shadow-banking system. Cross-country aggregations are challenging given the diverse nature of the shadow-banking industry and activities. In 2016, the shadow-banking monitoring exercise was conducted by the Financial Stability Board’s Shadow Banking Experts Group (SBEG), which was set up in 2016 under the Standing Committee on Assessment of Vulnerabilities (SCAV) to drive the annual monitoring exercise. The 2016 exercise covered 28 jurisdictions and the euro area as a whole, representing slightly more than 80.0% of global GDP.
Banks globally hold the largest share of financial assets (Figure 18). In line with global results, banks’ share of financial assets has decreased in South Africa (Figure 19) since the global financial crisis but has remained relatively stable at around 30.0% (40.0% globally) since 2015. Pension funds and insurance companies hold a relatively larger share of total financial assets, with combined financial assets of 41.0%.
The share of financial assets held by other financial intermediaries (OFIs) in South Africa has increased consistently since the global financial crisis: it amounted to 21.0% in September 2016. In order to accurately measure shadow-banking activities, activities which do not adhere to the financial stability definition should be removed from the OFI measure, while activities by pension funds and insurance companies which are related to credit intermediation or the facilitation of credit should be added. This narrowing is required in order to identify risks in the non-banking sector. Activities that are excluded from the shadow-banking measure are equity funds, real estate funds, real-estate investment trusts, trust companies and banks’ investment in securitisation schemes. Shadow banking entities or activities comprise money market funds (MMFs), multi-asset funds, fixed-income funds, hedge funds, fund of funds, participation bond schemes, finance companies and securitisation schemes. Pooled investment funds made up the largest portion (75.0%) of the shadow-banking measure (Figure 20).
Figure 18 Distribution of financial assets between intermediaries in jurisdictions that participated in the global shadow-banking exercise in 2015Per cent
Central banks Public financial institutions Pension funds
Source: Financial Stability Board
0
10
20
30
40
50
60
2014201220102008200620042002 Deposit-taking institutions Insurance corporations OFIs
Figure 19 Distribution of financial assets between financial intermediaries in South Africa Per cent
SARB Insurance companies Public financial enterprises
0
5
10
15
20
25
30
35
40
45
Banks Pension funds OFIs
2001 2003 2005 2007 2009 2011 2013 2015
Multi-asset funds Fund of funds Interest-bearing funds Hedge funds Credit insurance
Sources: ASISA, SARB, FSB and Novare
Figure 20 Shadow-banking activitiesSeptember 2016
2%0%
4%3%
7%
12%
13%
13%
46%
Money market funds Finance companies Broker services Securitisation activities
13Financial Stability Review first edition 2017
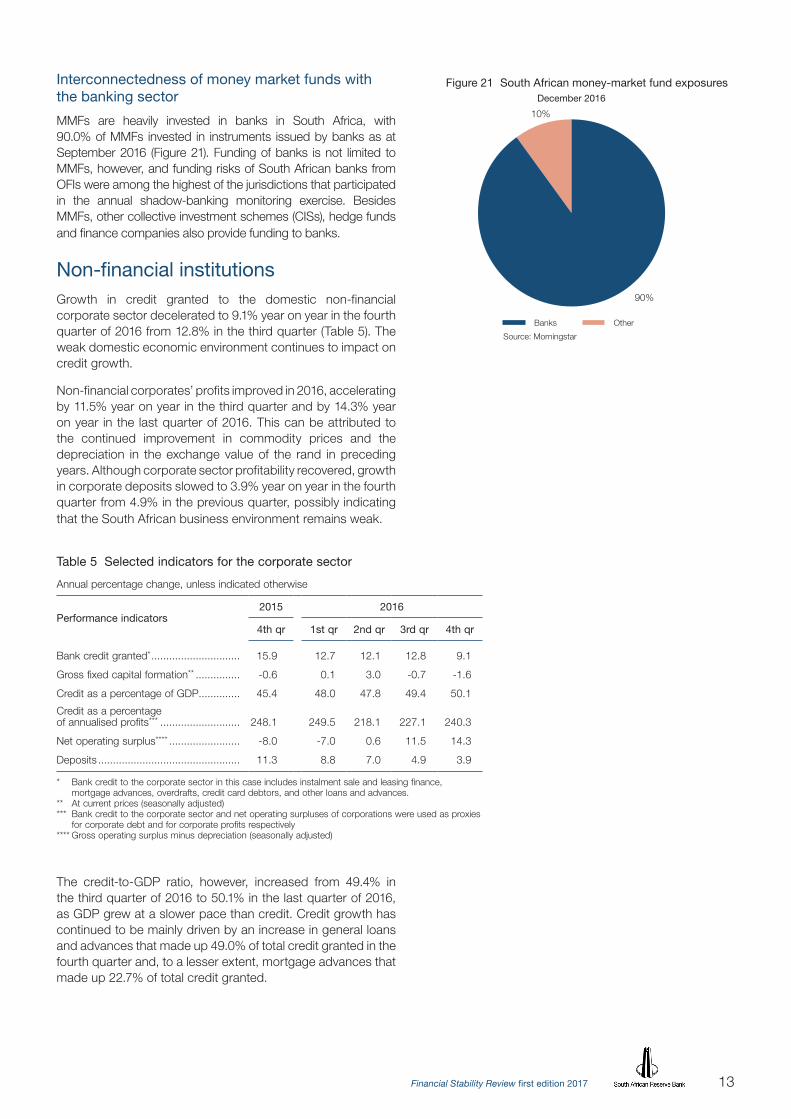
Interconnectedness of money market funds with the banking sector
MMFs are heavily invested in banks in South Africa, with 90.0% of MMFs invested in instruments issued by banks as at September 2016 (Figure 21). Funding of banks is not limited to MMFs, however, and funding risks of South African banks from OFIs were among the highest of the jurisdictions that participated in the annual shadow-banking monitoring exercise. Besides MMFs, other collective investment schemes (CISs), hedge funds and finance companies also provide funding to banks.
Non-financial institutionsGrowth in credit granted to the domestic non-financial corporate sector decelerated to 9.1% year on year in the fourth quarter of 2016 from 12.8% in the third quarter (Table 5). The weak domestic economic environment continues to impact on credit growth.
Non-financial corporates’ profits improved in 2016, accelerating by 11.5% year on year in the third quarter and by 14.3% year on year in the last quarter of 2016. This can be attributed to the continued improvement in commodity prices and the depreciation in the exchange value of the rand in preceding years. Although corporate sector profitability recovered, growth in corporate deposits slowed to 3.9% year on year in the fourth quarter from 4.9% in the previous quarter, possibly indicating that the South African business environment remains weak.
The credit-to-GDP ratio, however, increased from 49.4% in the third quarter of 2016 to 50.1% in the last quarter of 2016, as GDP grew at a slower pace than credit. Credit growth has continued to be mainly driven by an increase in general loans and advances that made up 49.0% of total credit granted in the fourth quarter and, to a lesser extent, mortgage advances that made up 22.7% of total credit granted.
Banks
Source: Morningstar
Figure 21 South African money-market fund exposuresDecember 2016
10%
90%
Other
Table 5 Selected indicators for the corporate sector
Annual percentage change, unless indicated otherwise
Performance indicators2015 2016
4th qr 1st qr 2nd qr 3rd qr 4th qr
Bank credit granted* .............................. 15.9 12.7 12.1 12.8 9.1
Gross fixed capital formation** ............... -0.6 0.1 3.0 -0.7 -1.6
Credit as a percentage of GDP.............. 45.4 48.0 47.8 49.4 50.1
Credit as a percentage of annualised profits*** ........................... 248.1 249.5 218.1 227.1 240.3
Net operating surplus**** ........................ -8.0 -7.0 0.6 11.5 14.3
Deposits ................................................ 11.3 8.8 7.0 4.9 3.9
* Bank credit to the corporate sector in this case includes instalment sale and leasing finance, mortgage advances, overdrafts, credit card debtors, and other loans and advances.
** At current prices (seasonally adjusted) *** Bank credit to the corporate sector and net operating surpluses of corporations were used as proxies
for corporate debt and for corporate profits respectively**** Gross operating surplus minus depreciation (seasonally adjusted)

Financial Stability Review first edition 201714
After a moderate recovery in business confidence in the third quarter of 2016 due to the strengthening of the exchange value of the rand and a decline in fuel prices, the index deteriorated in the fourth quarter. This deterioration in business confidence was driven mainly by lower confidence from new vehicle dealers, retail traders and wholesale traders, pressured by higher inflation, weak employment growth and subdued growth in both credit extension and consumers’ real disposable income. Confidence is expected to deteriorate further in the first quarter of 2017 amid tighter fiscal policy. New building contractors’ confidence, however, rose to 48 index points even though it remained below the 50-index-point benchmark. This improvement was largely attributed to an increase in residential building activity.
With the deceleration in credit growth and domestic interest rates on hold at 7% since March 2016, the Experian Business Debt Index (BDI)12 improved marginally in the last quarter of 2016 to negative 0.034 index points from a negative 0.098 in the previous quarter. Growth in gross fixed investment by the private corporate sector slowed further in the last quarter of 2016.
Since the second half of 2015, there has been an increase in the issuance of both domestic and international debt securities. Total debt securities outstanding in the fourth quarter of 2016 increased slightly to US$32.5 billion from US$30.2 billion in the previous quarter, driven mainly by domestic debt securities. Although domestic debt securities remained the largest component for non-financial corporates, total outstanding international debt increased by 13.8% year on year. This can be attributed to the current generally low global interest rate environment that has made international debt securities more attractive and more cost-efficient than domestic debt securities.
12 The Experian Business Debt Index (BDI) is a measure of the debt stress experienced by domestic corporates. For the BDI, 0 is the base, >0 indicates improving business conditions and <0 shows deteriorating business conditions.
US$ billions
Figure 22 Non-financial corporates’ domestic debt securities and international debt securities
Total domestic debt securities Total debt securitiesSource: BIS
Total international debt securities
0
10
20
30
40
50
2008 2009 2010 2011 2012 2013 2014 2015 2016
Table 6 Business confidence index*
Indices2015 2016
4th qr 1st qr 2nd qr 3rd qr 4th qr
Business confidence index ........................... 36 36 32 42 38
New vehicle dealers’ confidence ....... 19 24 25 37 26
Retail traders’ confidence .................. 40 44 26 43 34
Wholesale traders’ confidence ........... 47 50 47 56 53
Building contractors’ confidence ....... 39 43 38 44 48
Manufacturers’ confidence ................ 34 18 23 30 30
* The business confidence level is measured on a scale of 0 to 100, where 0 indicates ‘an extreme lack of confidence’,50 ‘neutral’ and 100 ‘extreme confidence’
Source: BER, (Stellenbosch University)

15Financial Stability Review first edition 2017
The increasing reliance on international debt securities increases the vulnerability of corporates should global interest rates increase and the exchange value of the rand depreciate.
The interest coverage ratio (ICR) is an estimation of a firm’s ability to generate cash flows to finance its interest expenses on outstanding debt by dividing its earnings before interest and taxes (EBIT) by its annual interest expenses. According to the IMF, an ICR below 1 is defined as a ‘technical default’. In such a situation, many of these firms can survive for some time by selling assets to meet their debt obligations, but if their ICRs remain below 1 for a sustained period of time, they could eventually run out of assets and actually default on their debt obligations.
Corporates with an ICR below 2 are classified as ‘weak’. The ICR for South African corporates has been improving since the first quarter of 2016. However, it dropped from 3.7 in the third quarter to 2.5 in the last quarter of 2016, remaining above the benchmark of 2 (Figure 23). This indicates that South African corporates managed to generate sufficient cash flows to service the cost of debt.
On an industry level (Figure 24), the electricity, gas and water supply industry recorded an ICR of 0 in the fourth quarter of 2016, indicating some vulnerability in the industry. Although the business services industries recorded an ICR of more than 1, their ICR remained below the benchmark of 2. The remaining industries all had ICRs of 2 or higher. The construction industry, transport, storage and communication industry and mining and quarrying industry experienced large improvements while the ICR for the manufacturing industry and personal services industry reported sharp declines as their EBIT decreased and annual interest expenses increased.
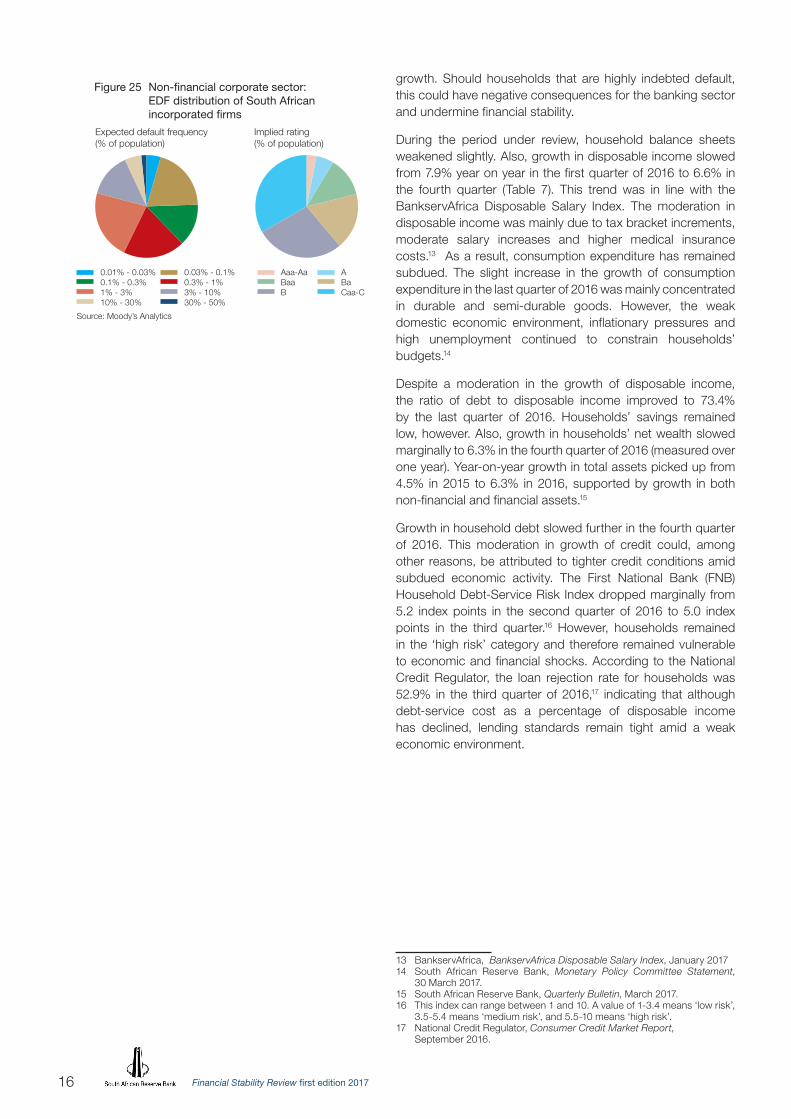
The expected default frequency (EDF) measures the probability that a firm will default within a specific time horizon (in this case, within a year) by failing to make an interest and/or principal payment. The EDF assesses a firm’s ability to service its debt by calculating its probability of default based on the values of the firm’s assets and liabilities. The measure is forward-looking as it uses market-based variables, including equity prices, equity volatilities and default barriers.
About 79.0% of South African corporates have EDFs below 3.0% (Figure 25), implying that there is a probability of less than 3.0% that these corporates will not be able to honour their debt obligations in the following year. Of the 192 companies included in the portfolio, 152 have an EDF of 3.0% and less, 40 have an EDF of 3.0% and above (which is lower than the 28.0% a year ago) and 3 have an EDF of above 30.0%. As at 7 March 2017, South African non-financial corporates recorded an average one-year EDF of 2.9%, lower than the 3.5% reported in the previous edition of the Financial Stability Review.
HouseholdsHighly indebted households are particularly vulnerable to any tightening in monetary policy. A high level of debt leads to households decreasing consumption in order to service their debt, reducing economic activity and hence economic
Interest coverage ratio
Figure 23 Non-financial corporate sector: aggregate interest coverage ratio*
All industries* Excluding public administration, defence activities and educationSources: Stats SA and IMF
IMF benchmark
0
1
2
3
4
5
2009 2010 2011 2012 2013 2014 2015 2016
2015 Q4 2016 Q2 2016 Q4
* Excluding public administration, defence activities and education.
Source: IMF
Personal services
Trade
Manufacturing
Construction
Business services
Transport, storageand communications
Mining
Electricity, gasand water supply
0 2 4 6 8 10 12
Figure 24 Non-financial corporate sector*: sectoral interest coverage ratio
2016 Q1 2016 Q3 IMF benchmarks
Financial Stability Review first edition 201716
growth. Should households that are highly indebted default, this could have negative consequences for the banking sector and undermine financial stability.
During the period under review, household balance sheets weakened slightly. Also, growth in disposable income slowed from 7.9% year on year in the first quarter of 2016 to 6.6% in the fourth quarter (Table 7). This trend was in line with the BankservAfrica Disposable Salary Index. The moderation in disposable income was mainly due to tax bracket increments, moderate salary increases and higher medical insurance costs.13 As a result, consumption expenditure has remained subdued. The slight increase in the growth of consumption expenditure in the last quarter of 2016 was mainly concentrated in durable and semi-durable goods. However, the weak domestic economic environment, inflationary pressures and high unemployment continued to constrain households’ budgets.14
Despite a moderation in the growth of disposable income, the ratio of debt to disposable income improved to 73.4% by the last quarter of 2016. Households’ savings remained low, however. Also, growth in households’ net wealth slowed marginally to 6.3% in the fourth quarter of 2016 (measured over one year). Year-on-year growth in total assets picked up from 4.5% in 2015 to 6.3% in 2016, supported by growth in both non-financial and financial assets.15
Growth in household debt slowed further in the fourth quarter of 2016. This moderation in growth of credit could, among other reasons, be attributed to tighter credit conditions amid subdued economic activity. The First National Bank (FNB) Household Debt-Service Risk Index dropped marginally from 5.2 index points in the second quarter of 2016 to 5.0 index points in the third quarter.16 However, households remained in the ‘high risk’ category and therefore remained vulnerable to economic and financial shocks. According to the National Credit Regulator, the loan rejection rate for households was 52.9% in the third quarter of 2016,17 indicating that although debt-service cost as a percentage of disposable income has declined, lending standards remain tight amid a weak economic environment.
13 BankservAfrica, BankservAfrica Disposable Salary Index, January 201714 South African Reserve Bank, Monetary Policy Committee Statement,
30 March 2017.15 South African Reserve Bank, Quarterly Bulletin, March 2017.16 This index can range between 1 and 10. A value of 1-3.4 means ‘low risk’,
3.5-5.4 means ‘medium risk’, and 5.5-10 means ‘high risk’.17 National Credit Regulator, Consumer Credit Market Report,
September 2016.
Expected default frequency(% of population)
Implied rating (% of population)
0.01% - 0.03% 0.1% - 0.3% 1% - 3% 10% - 30%
Source: Moody’s Analytics
Aaa-Aa Baa B
Figure 25 Non-financial corporate sector: EDF distribution of South African incorporated firms
A Ba Caa-C
0.03% - 0.1% 0.3% - 1% 3% - 10% 30% - 50%

17Financial Stability Review first edition 2017
Mortgage advances still make up the majority of credit (in absolute terms) extended to households (Figure 26). Mortgage advances made up 60.0% of total credit extended to households in the last quarter of 2016, a slight increase from the 59.0% in the last quarter of 2015. About 15.5% of credit extended to households was in the form of credit cards and 13.7% was general loans and advances. Mortgage advances are a relatively safer type of loan for banks in the sense that they are secured by the property as collateral. Also, mortgage advances are usually extended to high-income earners. Instalment sales credit as well as general loans and advances, conversely, are unsecured and mostly utilised by low-income consumers. The interest premium on unsecured loans tends to be markedly higher than that on secured loans making low-income consumers more vulnerable to interest rate hikes.
The spread between the prime rate and average interest rates that households in South Africa pay18 (Figure 27) has been increasing steadily until 2015, after which it started decreasing but still remained relatively high at 247.38 index points compared to the 10-year average of 165 index points. Debt-service cost as a percentage of disposable income generally tends to move in line with interest rates and has therefore been on an upward slope since the third quarter of 2013.
18 This is calculated by taking the financing cost of household debt and dividing it by total household debt.
Table 7 Selected indicators for the household sector
Annual percentage change, unless indicated otherwise
2015 2016
4th qr 1st qr 2nd qr 3rd qr 4th qr
Disposable income ........................................ 7.7 7.9 7.6 7.2 6.6
Financial assets ............................................. 4.3 3.3 5.1 6.2 4.7
Total assets ................................................... 4.9 4.5 5.3 6.3 5.8
Net wealth* .................................................... 4.8 4.6 5.8 6.8 6.3
Consumption expenditure ............................. 1.5 0.6 0.9 0.8 1.0
Consumption expenditure to GDP ................ 59.6 59.5 59.3 59.4 59.5
Capital gearing** ........................................... 16.6 16.3 16.3 16.3 16.2
Credit extension ............................................ 4.5 4.6 2.1 1.2 0.7
Mortgage advances extended to households 4.6 4.7 4.1 3.5 2.7
Mortgage debt as a percentage of household disposable income ....................................... 37.5 37.4 36.9 36.6 36.1
Savings as a percentage of disposable income ......................................................... -0.4 -0.5 -0.6 -0.5 -0.5
Debt as a percentage of disposable income .. 75.9 75.4 74.9 74.1 73.4
Debt to GDP ................................................. 45.1 44.6 44.2 43.8 43.5
Debt-service cost of household debt ............ 9.9 12.6 13.0 10.5 8.1
Debt-service cost as a percentage of disposable income ................................... 9.4 9.7 9.7 9.6 9.5
Debt ........................................................... 4.9 4.4 4.3 3.6 3.1
FNB Household Debt-Service Risk Index ... 5.6 5.3 5.2 5.0 n/a
* Household net wealth is defined as total assets of households less total financial liabilities** Capital gearing refers to household debt as a percentage of total assets of households. Data are
preliminary.
Sources: SARB and FNB
R trillions
2001 2003 200920072005 20132011 2016
Figure 26 Composition of household debt
0
0.2
0.4
0.6
0.8
1.0
1.2
1.4
1.6 Instalment sales credit Leasing finance Mortgage advances Overdrafts General loans and advances Credit cards Total debt
0
50
100
150
200
250
300
5
10
15
20Basis points Per cent
Figure 27 Spread between average household borrowing interest rates and prime rate
Spread between average household borrowing interest rates and prime rate Average interest rate on current household debt (right-hand scale) Prime rate (right-hand scale) Debt-service cost to disposable income (right-hand scale)
20102009 2011 2012 2013 2014 2015 2016

Financial Stability Review first edition 201718
After recovering somewhat in the third quarter of 2016, the FNB/Bureau for Economic Research (BER) Consumer Confidence Index (CCI) fell in the last quarter of 2016 to -10 index points from -3 index points in the previous quarter (Figure 28). Consumer confidence has remained well below the long-term average reading of 4 index points since the second half of 2014, and also relatively low compared to the lowest reading of -6 index points recorded during the 2008/09 global economic recession. Most sub-indices of the CCI dropped in the last quarter of 2016. Consumers remain concerned about the outlook for domestic economic growth, the state of household finances and persistently high levels of unemployment.
The MBD Credit Solutions/Bureau of Market Research (MBD/BMR) Consumer Financial Vulnerability Index (CFVI) increased further in the fourth quarter of 2016. The rise in this index can be largely attributed to an increase in the expenditure, income and debt servicing vulnerability scores. According to the MBD/BMR, consumers are ‘financially mildly exposed’ suggesting that any changes in taxes, prices and/or interest rates could harm their financial position. Even though the growth in credit to households has slowed during the period under review, households remain vulnerable to economic and financial shocks.
Residential real estateProperty values are important to consider in the assessment of fundamental vulnerabilities in the financial system since a sudden fall in property prices could have a destabilising effect on the economy. This phenomenon occurs especially where assets are widely held and their value is supported by high leverage, as is often the case with the real estate sector.
Between 2008 and 2012 and from 2015 onwards, house price growth did not keep up with inflation (Figure 29). This is a concern as property is a major part of the wealth of households.
To measure the current affordability of property and its possible impact on financial stability, a monthly mortgage payment series was developed by employing predominant interest rates over time and the long-run Absa House Price Index (HPI). The series is compared to the average price-to-rent (P/R) ratio. The mortgage-instalment-to-rent and P/R ratios (Figure 30) indicate the affordability and profitability of owning residential property in South Africa. Both these indicators have increased somewhat since the second quarter of 2016, indicating that households rent rather than buy property, which is also a reflection of the record-low confidence levels.
Government financesThe sustainability of government finances is crucial for an economy as it directly affects its debt holders, which in South Africa’s case is mainly pension and provident funds and banks. Coupled with a number of other factors, fiscal sustainability has been raised in the past as one of the determining factors for a possible sovereign credit rating downgrade (see Box 1).19
19 Also see South African Reserve Bank. Financial Stability Review, second edition 2016.
45
47
49
51
53
55
57
59
61
Consumer Financial Vulnerability Index (CFVI) Consumer Confidence Index (CCI) (right-hand scale)
Indices
-20
-15
-10
-5
0
5
10
15
20
Figure 28 Consumer Financial Vulnerability Index* and Consumer Confidence Index**
2009 2011 2013 20152010 2012 2014 2016
* 0–19.9 means ‘financially very vulnerable’, 20–39.9 ‘financially vulnerable’, 40–49.9 ‘financially very exposed’, 50–59.9 ‘financially mildly exposed’, 60–79.9 ‘financially secure’ and 80–100 ‘financially very secure’.
** The consumer confidence index is expressed as a net balance between optimistic and pessimistic consumers. According to the Bureau for Economic Research at Stellenbosch University, the index can vary between -100 for ‘extreme pessimism’ and 100 for ‘extreme optimism’, with 0 being ‘neutral’.
Sources: MBD Credit Solutions, Bureau of Market Research (Unisa), FNB/BER (Stellenbosch University)
Annual percentage change
2013201220112010200920082007 2014 2015 2016** September 2016
Sources: National sources, BIS Residential Property Price database
-10
-8
-6
-4
-2
0
2
4
6
Figure 29 Real house price growth in South Africa
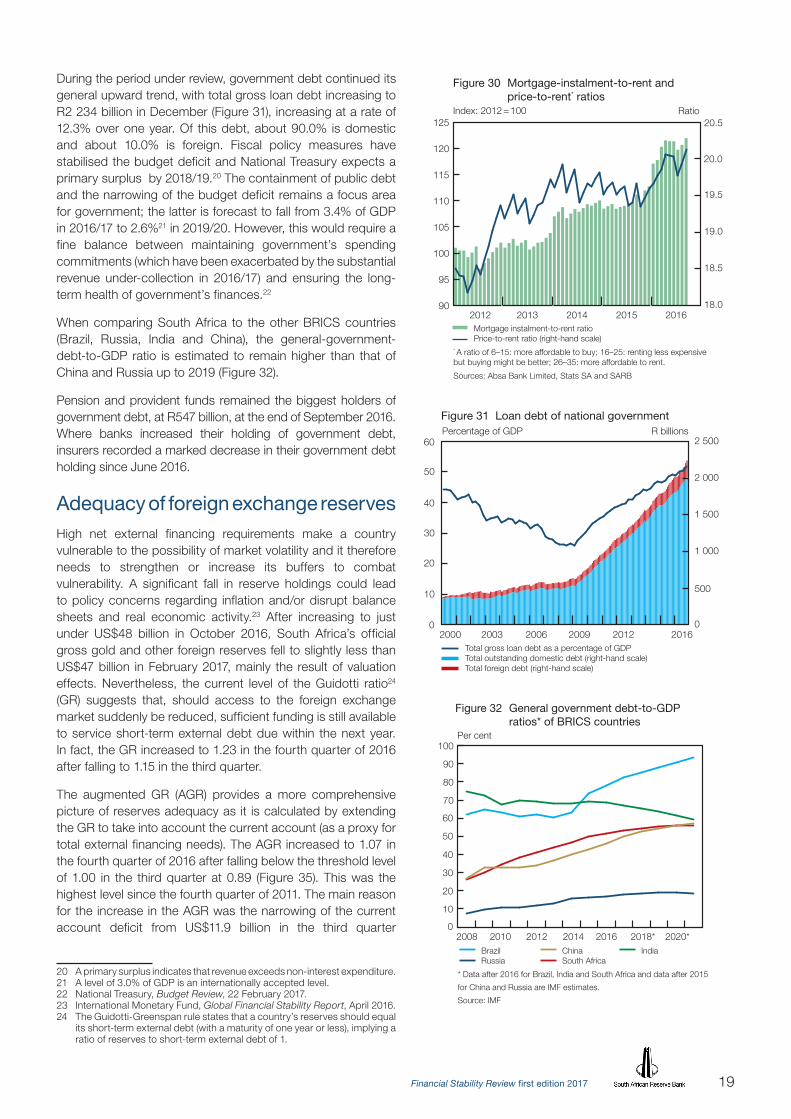
19Financial Stability Review first edition 2017
During the period under review, government debt continued its general upward trend, with total gross loan debt increasing to R2 234 billion in December (Figure 31), increasing at a rate of 12.3% over one year. Of this debt, about 90.0% is domestic and about 10.0% is foreign. Fiscal policy measures have stabilised the budget deficit and National Treasury expects a primary surplus by 2018/19.20 The containment of public debt and the narrowing of the budget deficit remains a focus area for government; the latter is forecast to fall from 3.4% of GDP in 2016/17 to 2.6%21 in 2019/20. However, this would require a fine balance between maintaining government’s spending commitments (which have been exacerbated by the substantial revenue under-collection in 2016/17) and ensuring the long-term health of government’s finances.22
When comparing South Africa to the other BRICS countries (Brazil, Russia, India and China), the general-government-debt-to-GDP ratio is estimated to remain higher than that of China and Russia up to 2019 (Figure 32).
Pension and provident funds remained the biggest holders of government debt, at R547 billion, at the end of September 2016. Where banks increased their holding of government debt, insurers recorded a marked decrease in their government debt holding since June 2016.
Adequacy of foreign exchange reservesHigh net external financing requirements make a country vulnerable to the possibility of market volatility and it therefore needs to strengthen or increase its buffers to combat vulnerability. A significant fall in reserve holdings could lead to policy concerns regarding inflation and/or disrupt balance sheets and real economic activity.23 After increasing to just under US$48 billion in October 2016, South Africa’s official gross gold and other foreign reserves fell to slightly less than US$47 billion in February 2017, mainly the result of valuation effects. Nevertheless, the current level of the Guidotti ratio24 (GR) suggests that, should access to the foreign exchange market suddenly be reduced, sufficient funding is still available to service short-term external debt due within the next year. In fact, the GR increased to 1.23 in the fourth quarter of 2016 after falling to 1.15 in the third quarter.
The augmented GR (AGR) provides a more comprehensive picture of reserves adequacy as it is calculated by extending the GR to take into account the current account (as a proxy for total external financing needs). The AGR increased to 1.07 in the fourth quarter of 2016 after falling below the threshold level of 1.00 in the third quarter at 0.89 (Figure 35). This was the highest level since the fourth quarter of 2011. The main reason for the increase in the AGR was the narrowing of the current account deficit from US$11.9 billion in the third quarter
20 A primary surplus indicates that revenue exceeds non-interest expenditure.21 A level of 3.0% of GDP is an internationally accepted level.22 National Treasury, Budget Review, 22 February 2017.23 International Monetary Fund, Global Financial Stability Report, April 2016.24 The Guidotti-Greenspan rule states that a country’s reserves should equal
its short-term external debt (with a maturity of one year or less), implying a ratio of reserves to short-term external debt of 1.
90
95
100
105
110
115
120
125
Mortgage instalment-to-rent ratio Price-to-rent ratio (right-hand scale)* A ratio of 6–15: more affordable to buy; 16–25: renting less expensivebut buying might be better; 26–35: more affordable to rent.
Sources: Absa Bank Limited, Stats SA and SARB
Index: 2012 = 100 Ratio
18.0
18.5
19.0
19.5
20.0
20.5
Figure 30 Mortgage-instalment-to-rent and price-to-rent* ratios
2012 2013 2014 2015 2016
0
500
1 000
1 500
2 000
2 500
0
10
20
30
40
50
60Percentage of GDP R billions
Figure 31 Loan debt of national government
Total gross loan debt as a percentage of GDP Total outstanding domestic debt (right-hand scale) Total foreign debt (right-hand scale)
2000 2003 2006 2009 2012 2016
Brazil Russia
* Data after 2016 for Brazil, India and South Africa and data after 2015
for China and Russia are IMF estimates.
Source: IMF
Per cent
0
10
20
30
40
50
60
70
80
90
100
Figure 32 General government debt-to-GDP ratios* of BRICS countries
2008 2014 2016 2018* 2020*2010 2012 China South Africa
India
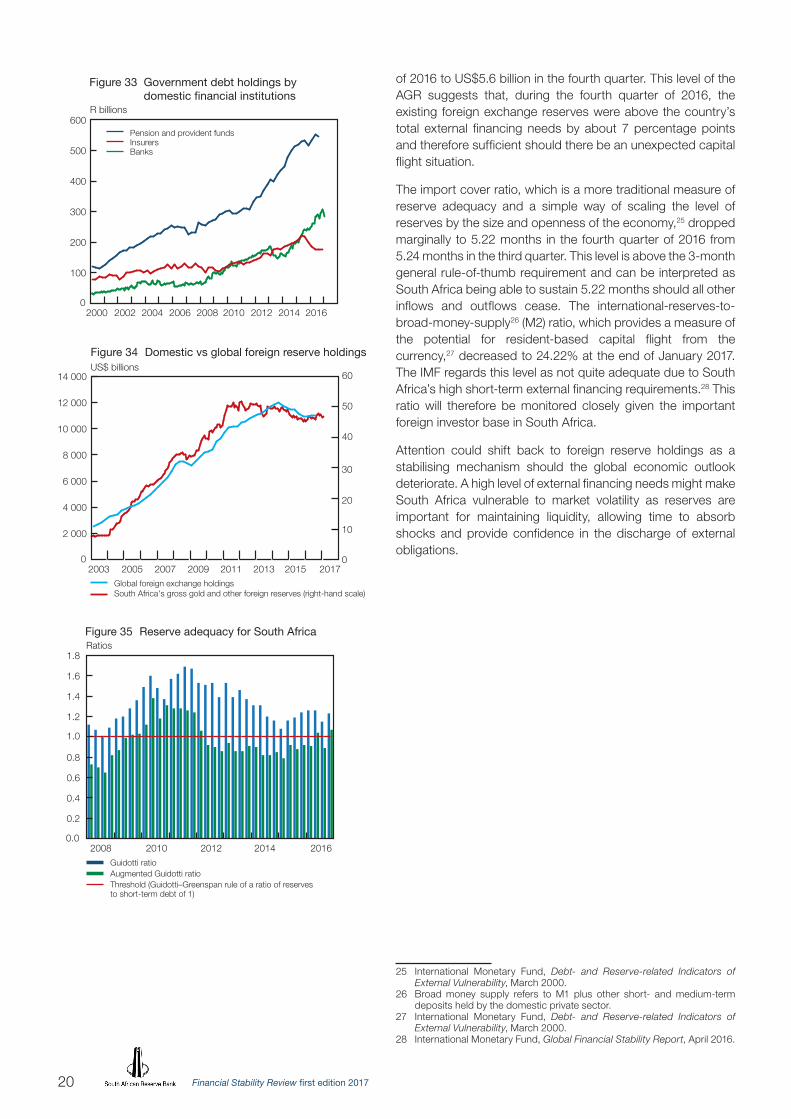
Financial Stability Review first edition 201720
of 2016 to US$5.6 billion in the fourth quarter. This level of the AGR suggests that, during the fourth quarter of 2016, the existing foreign exchange reserves were above the country’s total external financing needs by about 7 percentage points and therefore sufficient should there be an unexpected capital flight situation.
The import cover ratio, which is a more traditional measure of reserve adequacy and a simple way of scaling the level of reserves by the size and openness of the economy,25 dropped marginally to 5.22 months in the fourth quarter of 2016 from 5.24 months in the third quarter. This level is above the 3-month general rule-of-thumb requirement and can be interpreted as South Africa being able to sustain 5.22 months should all other inflows and outflows cease. The international-reserves-to-broad-money-supply26 (M2) ratio, which provides a measure of the potential for resident-based capital flight from the currency,27 decreased to 24.22% at the end of January 2017. The IMF regards this level as not quite adequate due to South Africa’s high short-term external financing requirements.28 This ratio will therefore be monitored closely given the important foreign investor base in South Africa.
Attention could shift back to foreign reserve holdings as a stabilising mechanism should the global economic outlook deteriorate. A high level of external financing needs might make South Africa vulnerable to market volatility as reserves are important for maintaining liquidity, allowing time to absorb shocks and provide confidence in the discharge of external obligations.
25 International Monetary Fund, Debt- and Reserve-related Indicators of External Vulnerability, March 2000.
26 Broad money supply refers to M1 plus other short- and medium-term deposits held by the domestic private sector.
27 International Monetary Fund, Debt- and Reserve-related Indicators of External Vulnerability, March 2000.
28 International Monetary Fund, Global Financial Stability Report, April 2016.
Pension and provident funds Insurers Banks
R billions
0
100
200
300
400
500
600
Figure 33 Government debt holdings by domestic financial institutions
2000 20042002 2006 2008 2014 20162010 2012
Global foreign exchange holdings South Africa's gross gold and other foreign reserves (right-hand scale)
US$ billions
0
10
20
30
40
50
60
Figure 34 Domestic vs global foreign reserve holdings
2003 2005 2007 2009 2011 2013 2015 20170
2 000
4 000
6 000
8 000
10 000
12 000
14 000
Guidotti ratio Augmented Guidotti ratio Threshold (Guidotti–Greenspan rule of a ratio of reserves to short-term debt of 1)
Ratios
0.0
0.2
0.4
0.6
0.8
1.0
1.2
1.4
1.6
1.8
Figure 35 Reserve adequacy for South Africa
2008 2010 2012 2014 2016
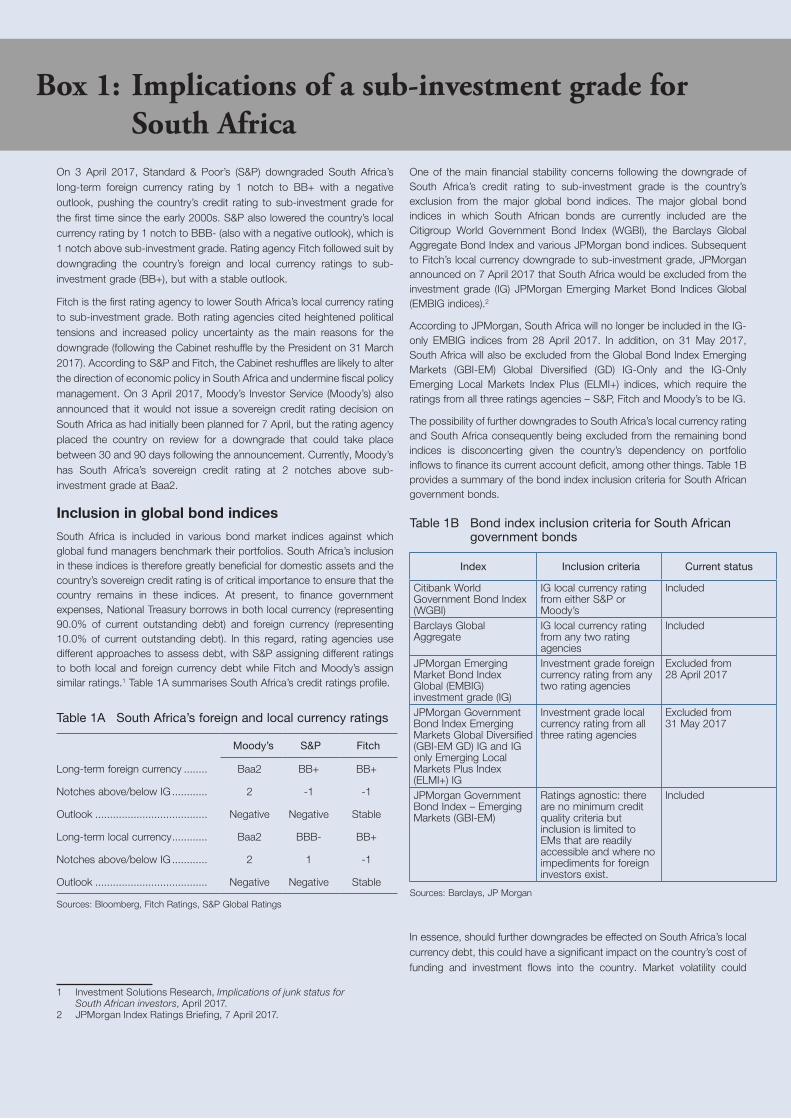
21Financial Stability Review first edition 2017
On 3 April 2017, Standard & Poor’s (S&P) downgraded South Africa’s long-term foreign currency rating by 1 notch to BB+ with a negative outlook, pushing the country’s credit rating to sub-investment grade for the first time since the early 2000s. S&P also lowered the country’s local currency rating by 1 notch to BBB- (also with a negative outlook), which is 1 notch above sub-investment grade. Rating agency Fitch followed suit by downgrading the country’s foreign and local currency ratings to sub-investment grade (BB+), but with a stable outlook.
Fitch is the first rating agency to lower South Africa’s local currency rating to sub-investment grade. Both rating agencies cited heightened political tensions and increased policy uncertainty as the main reasons for the downgrade (following the Cabinet reshuffle by the President on 31 March 2017). According to S&P and Fitch, the Cabinet reshuffles are likely to alter the direction of economic policy in South Africa and undermine fiscal policy management. On 3 April 2017, Moody’s Investor Service (Moody’s) also announced that it would not issue a sovereign credit rating decision on South Africa as had initially been planned for 7 April, but the rating agency placed the country on review for a downgrade that could take place between 30 and 90 days following the announcement. Currently, Moody’s has South Africa’s sovereign credit rating at 2 notches above sub-investment grade at Baa2.
Inclusion in global bond indices
South Africa is included in various bond market indices against which global fund managers benchmark their portfolios. South Africa’s inclusion in these indices is therefore greatly beneficial for domestic assets and the country’s sovereign credit rating is of critical importance to ensure that the country remains in these indices. At present, to finance government expenses, National Treasury borrows in both local currency (representing 90.0% of current outstanding debt) and foreign currency (representing 10.0% of current outstanding debt). In this regard, rating agencies use different approaches to assess debt, with S&P assigning different ratings to both local and foreign currency debt while Fitch and Moody’s assign similar ratings.1 Table 1A summarises South Africa’s credit ratings profile.
Table 1A South Africa’s foreign and local currency ratings
Moody’s S&P Fitch
Long-term foreign currency ........ Baa2 BB+ BB+
Notches above/below IG ............ 2 -1 -1
Outlook ...................................... Negative Negative Stable
Long-term local currency ............ Baa2 BBB- BB+
Notches above/below IG ............ 2 1 -1
Outlook ...................................... Negative Negative Stable
Sources: Bloomberg, Fitch Ratings, S&P Global Ratings
1 Investment Solutions Research, Implications of junk status for South African investors, April 2017.
2 JPMorgan Index Ratings Briefing, 7 April 2017.
One of the main financial stability concerns following the downgrade of South Africa’s credit rating to sub-investment grade is the country’s exclusion from the major global bond indices. The major global bond indices in which South African bonds are currently included are the Citigroup World Government Bond Index (WGBI), the Barclays Global Aggregate Bond Index and various JPMorgan bond indices. Subsequent to Fitch’s local currency downgrade to sub-investment grade, JPMorgan announced on 7 April 2017 that South Africa would be excluded from the investment grade (IG) JPMorgan Emerging Market Bond Indices Global (EMBIG indices).2
According to JPMorgan, South Africa will no longer be included in the IG-only EMBIG indices from 28 April 2017. In addition, on 31 May 2017, South Africa will also be excluded from the Global Bond Index Emerging Markets (GBI-EM) Global Diversified (GD) IG-Only and the IG-Only Emerging Local Markets Index Plus (ELMI+) indices, which require the ratings from all three ratings agencies – S&P, Fitch and Moody’s to be IG.
The possibility of further downgrades to South Africa’s local currency rating and South Africa consequently being excluded from the remaining bond indices is disconcerting given the country’s dependency on portfolio inflows to finance its current account deficit, among other things. Table 1B provides a summary of the bond index inclusion criteria for South African government bonds.
Table 1B Bond index inclusion criteria for South African government bonds
Index Inclusion criteria Current status
Citibank World Government Bond Index (WGBI)
IG local currency rating from either S&P or Moody’s
Included
Barclays Global Aggregate
IG local currency rating from any two rating agencies
Included
JPMorgan Emerging Market Bond Index Global (EMBIG) investment grade (IG)
Investment grade foreign currency rating from any two rating agencies
Excluded from 28 April 2017
JPMorgan Government Bond Index Emerging Markets Global Diversified (GBI-EM GD) IG and IG only Emerging Local Markets Plus Index (ELMI+) IG
Investment grade local currency rating from all three rating agencies
Excluded from 31 May 2017
JPMorgan Government Bond Index – Emerging Markets (GBI-EM)
Ratings agnostic: there are no minimum credit quality criteria but inclusion is limited to EMs that are readily accessible and where no impediments for foreign investors exist.
Included
Sources: Barclays, JP Morgan
In essence, should further downgrades be effected on South Africa’s local currency debt, this could have a significant impact on the country’s cost of funding and investment flows into the country. Market volatility could
Box 1: Implications of a sub-investment grade for South Africa
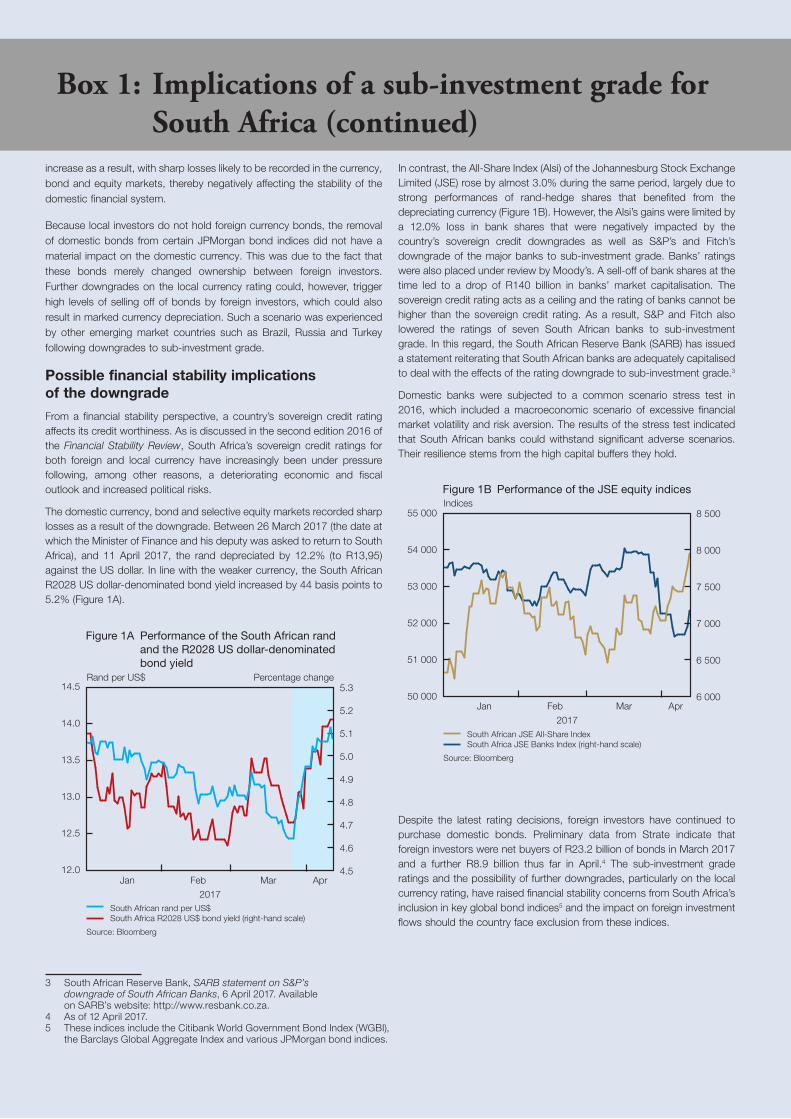
Financial Stability Review first edition 201722
increase as a result, with sharp losses likely to be recorded in the currency, bond and equity markets, thereby negatively affecting the stability of the domestic financial system.
Because local investors do not hold foreign currency bonds, the removal of domestic bonds from certain JPMorgan bond indices did not have a material impact on the domestic currency. This was due to the fact that these bonds merely changed ownership between foreign investors. Further downgrades on the local currency rating could, however, trigger high levels of selling off of bonds by foreign investors, which could also result in marked currency depreciation. Such a scenario was experienced by other emerging market countries such as Brazil, Russia and Turkey following downgrades to sub-investment grade.
Possible financial stability implications of the downgrade
From a financial stability perspective, a country’s sovereign credit rating affects its credit worthiness. As is discussed in the second edition 2016 of the Financial Stability Review, South Africa’s sovereign credit ratings for both foreign and local currency have increasingly been under pressure following, among other reasons, a deteriorating economic and fiscal outlook and increased political risks.
The domestic currency, bond and selective equity markets recorded sharp losses as a result of the downgrade. Between 26 March 2017 (the date at which the Minister of Finance and his deputy was asked to return to South Africa), and 11 April 2017, the rand depreciated by 12.2% (to R13,95) against the US dollar. In line with the weaker currency, the South African R2028 US dollar-denominated bond yield increased by 44 basis points to 5.2% (Figure 1A).
Rand per US$ Percentage change
Jan Feb2017
Mar Apr
South African rand per US$ South Africa R2028 US$ bond yield (right-hand scale)
Source: Bloomberg
4.5
4.6
4.7
4.8
4.9
5.0
5.1
5.2
5.3
12.0
12.5
13.0
13.5
14.0
14.5
Figure 1A Performance of the South African rand and the R2028 US dollar-denominated bond yield
3 South African Reserve Bank, SARB statement on S&P’s downgrade of South African Banks, 6 April 2017. Available on SARB’s website: http://www.resbank.co.za.
4 As of 12 April 2017.5 These indices include the Citibank World Government Bond Index (WGBI),
the Barclays Global Aggregate Index and various JPMorgan bond indices.
In contrast, the All-Share Index (Alsi) of the Johannesburg Stock Exchange Limited (JSE) rose by almost 3.0% during the same period, largely due to strong performances of rand-hedge shares that benefited from the depreciating currency (Figure 1B). However, the Alsi’s gains were limited by a 12.0% loss in bank shares that were negatively impacted by the country’s sovereign credit downgrades as well as S&P’s and Fitch’s downgrade of the major banks to sub-investment grade. Banks’ ratings were also placed under review by Moody’s. A sell-off of bank shares at the time led to a drop of R140 billion in banks’ market capitalisation. The sovereign credit rating acts as a ceiling and the rating of banks cannot be higher than the sovereign credit rating. As a result, S&P and Fitch also lowered the ratings of seven South African banks to sub-investment grade. In this regard, the South African Reserve Bank (SARB) has issued a statement reiterating that South African banks are adequately capitalised to deal with the effects of the rating downgrade to sub-investment grade.3
Domestic banks were subjected to a common scenario stress test in 2016, which included a macroeconomic scenario of excessive financial market volatility and risk aversion. The results of the stress test indicated that South African banks could withstand significant adverse scenarios. Their resilience stems from the high capital buffers they hold.
Indices
Jan Feb2017
Mar Apr
South African JSE All-Share Index South Africa JSE Banks Index (right-hand scale)
Source: Bloomberg
6 000
6 500
7 000
7 500
8 000
8 500
50 000
51 000
52 000
53 000
54 000
55 000
Figure 1B Performance of the JSE equity indices
Despite the latest rating decisions, foreign investors have continued to purchase domestic bonds. Preliminary data from Strate indicate that foreign investors were net buyers of R23.2 billion of bonds in March 2017 and a further R8.9 billion thus far in April.4 The sub-investment grade ratings and the possibility of further downgrades, particularly on the local currency rating, have raised financial stability concerns from South Africa’s inclusion in key global bond indices5 and the impact on foreign investment flows should the country face exclusion from these indices.
Box 1: Implications of a sub-investment grade for South Africa (continued)
23Financial Stability Review first edition 2017
Box 1: Implications of a sub-investment grade for South Africa (continued)
The robustness of the domestic financial infrastructure
This section reviews the developments in both domestic and international financial infrastructure as well as the regulatory environment.
Update on the Financial Sector Regulation Bill 2015In 201429 and 201530 the Financial Stability Review reported on the rationale for establishing a Twin Peaks regulatory system in South Africa, the processes underway and the objectives in mind. In late 2016, the Financial Sector Regulation Bill 2015 (FSR Bill), the main legal basis for establishing the domestic Twin Peaks regulatory architecture, was subjected to an extensive series of hearings by the Standing Committee on Finance (SCOF) of Parliament. The FSR Bill was subsequently amended to enhance collaboration between regulators, cater for financial inclusion and transformation, strengthen the consultation process with stakeholders, refine the parliamentary consultative process in the making of regulatory instruments, and clarify requirements in terms of the changing status of significant owners.
The amended FSR Bill was approved by the National Assembly on 6 December 2016 and moved to the National Council of Provinces (NCOP), the second house of Parliament, for approval. The NCOP conducted hearings on the FSR Bill in late March 2017. Once both houses of Parliament approve the FSR Bill, the President will be required to assent to it and the implementation date will also have to be finalised. Regulatory agencies expect the implementation of the FSR Bill be phased in from 2017 or 2018.
Final credit life regulations issuedIn the Financial Stability Review of September 2015,31 measures taken by the National Creditor Regulator and the Department of Trade and Industry (the dti) aimed, in part, to limit customer abuse by capping interest rates and fees on credit agreements were reported on. On 9 February 2017, the dti published the final credit life insurance regulations.32 These regulations limit the cost of credit life insurance for various credit facilities, specify the minimum benefits that must be offered to consumers, and clarify the limitations or exclusions that apply to insurance cover. The new credit life insurance rules are likely to enhance consumer protection in the credit markets in South Africa.
29 South African Reserve Bank, Financial Stability Review, March 2014 and September 2014.
30 South African Reserve Bank, Financial Stability Review, March 2015.31 South African Reserve Bank, Financial Stability Review, September 2015.32 Final Credit Life Insurance Regulations, Government Gazette No 40606,
9 February 2017.
Regulatory developments affecting the domestic banking sector
Expected credit loss accounting framework
As part of its reforms in response to the global financial crisis, the International Accounting Standards Board (IASB) replaced International Accounting Standard (IAS) 39, Financial instruments: recognition and measurement with International Financial Reporting Standard (IFRS) 9, Financial Instruments in July 2014.33 The project consisted of three phases, the first phase being the classification and measurement of financial instruments that was completed during 2010. Phase 2 entailed the change from an incurred loss impairment model to an expected loss impairment model. Phase 3, which addresses hedge accounting, was completed during 2013. IFRS 9 becomes effective for financial years beginning on or after 1 January 2018 (with early application permitted).34 As from the effective date, banks and other entities will have to account for impairments applying the expected credit loss (ECL) model. The new impairment model will result in earlier recognition of loan losses by requiring banks to account for 12-month ECLs from the date when the financial instruments are first recognised and lifetime ECLs for those financial instruments for which there has been a significant increase in credit risk since initial recognition. A weakness of IAS 39 identified during the global financial crisis was that a loan loss provision could only be recognised when there was objective evidence of impairment. Losses expected as a result of future events, no matter how likely, were not allowed to be recognised.35 Entities therefore had to wait for a loss event to occur before being able to recognise a credit loss on a loan (as well as certain other financial instruments) and as a result impairments were raised too late. The IFRS 9 impairment model, on the other hand, requires entities to take into account forward-looking macro-economic information when determining impairments, which will result in the more timely recognition of impairment losses.
In December 2015, the Basel Committee on Banking Supervision (BCBS) issued guidance on credit risk and accounting for expected losses to assist banks to understand how the ECL model should interact with a bank’s credit risk practices and to provide guidelines for supervisors on evaluating the effectiveness of a bank’s credit risk practices that affect allowance levels.36 The International Auditing and Assurance Standards Board’s (IAASB) International Standard on Auditing (ISA) 540 Task Force issued a project proposal in March 2016 to consider, among other matters, the challenges for audits of financial institutions arising from the adoption of
33 Full details are available on the IFRS Foundation website at: http://www.ifrs.org
34 Refer to the Bank Supervision Department Annual Report 2015 for the South African banking sector’s initiatives to implement the standard by the effective date. South African Reserve Bank. Bank Supervision Department Annual Report 2015.
35 Impairment losses (or gains) refer to the amount of expected credit losses or reversals that are adjusted against a bank’s loan loss allowance.
36 Bank for International Settlements. Available at http://www.bis.org.
Financial Stability Review first edition 201724
IFRS 9, and an Exposure Draft of a revised ISA 540, which deals with the audit of accounting estimates, is expected to be issued by the IAASB soon.37 The SARB has been represented on industry working groups and has held discussions with the domestic Independent Regulatory Board for Auditors and the banking sector with a view to facilitating consistent application of the standard in the banking sector. The focus of these interactions has been on the banking sector’s preparedness to implement the impairment models. The implementation of this standard poses complex challenges, including having appropriately skilled resources as well as model and data risks and tight deadlines, for industry participants, auditors and supervisors. It also has the potential for significant day one and ongoing financial impact as a result of changes in banks’ impairments for credit losses from current levels, especially when impairments are based on lifetime expected losses of long-term loans. Results from Deloitte’s sixth Global Banking IFRS Survey in May 2016 indicated respondents expect an increase in total impairment provisions across asset classes, accompanied by a related reduction in core tier 1 capital ratios and a potential impact on product pricing.38 In March 2017 the BCBS issued a document which clarifies the regulatory treatment of accounting provisions subsequent to the issue of IFRS 9 (as well as the Current Expected Credit Loss Model issued by the US Financial Accounting Standards Board in June 2016). In terms of this document, the treatment of accounting provisions for regulatory purposes does not change for the time being. The document also allows jurisdictions to apply a transitional approach, thereby spreading the capital impact over a maximum period of five years. In addition, the BCBS issued a discussion paper in October 2016 to outline its considerations for the longer-term regulatory treatment of ECL accounting provisions within the capital framework. The implementation of IFRS 9 has potential implications for financial stability should the investment community not be adequately sensitised to the standard’s impact prior to the application of the standard. The disclosure of the impact of IFRS 9 is receiving significant attention at industry forums, and banks are generally aware that this is an area that must be managed well in order to avoid any negative impact on financial stability.
Reduction in correspondent banking relationships and the potential impact of delays in the promulgation of the Financial Intelligence Centre Amendment Bill, 2016
Correspondent banking was discussed in the second edition of the 2016 Financial Stability Review. One of the reasons cited for a reduction in correspondent banking relationships (CBRs), especially for respondent banks with customers and/or products that pose a higher risk with respect to money-laundering and/or the financing of terrorism, was that these relationships are difficult to manage.39 The CBRs of institutions
37 IFAC. Available online at http://www.ifac.org/.38 Deloitte, Deloitte Sixth Global IFRS Banking Survey – No time like the
present, 24 May 2016. Available at https://www.iasplus.com39 Committee on Payments and Market Infrastructures, Bank for International
Settlements, Correspondent Banking, July 2016.
operating in smaller EMs and developing economies are under increased pressure, especially where institutions are not always clear about the regulatory expectations relating to the due diligence requirements for entering into CBRs. It is difficult to mitigate risks that cannot be quantified. Pressure on CBRs could disrupt financial services and cross-border flows, including trade finance and remittances, potentially undermining financial stability.40 Jurisdictions that have or are perceived to have weaknesses in their anti-money laundering and combating the financing of terrorism (AML/CFT) systems are at an increased risk of having their CBR services reduced or terminated, which has the potential of increasing the cost of those jurisdictions’ access to international cross-border flows.41 South Africa is one of 35-member jurisdictions of the Financial Action Task Force (FATF),42 the multinational inter-governmental body that promotes the effective implementation of legal, regulatory and operational measures for combating money laundering.43
During its meeting in February 2017, the Financial Action Task Force (FATF) Plenary considered the 12th Mutual Evaluation Follow-up Report on South Africa’s progress with its processes to remedy deficiencies identified during the 2009 mutual evaluation. These deficiencies are addressed in the Financial Intelligence Centre (FIC) Amendment Bill, 2016 (Amendment Bill). Parliament passed the Amendment Bill in May 2016.44 However, the President exercised his constitutional mandate and referred it back to the National Assembly in November 2016 based on constitutionality concerns pertaining to a specific section relating to warrantless searches. In February 2017, the FATF Plenary acceded to a request from South Africa to defer the decision to issue a public statement on the Plenary’s concern at the failure to address the deficiencies. South Africa is expected to undergo a comprehensive assessment against the revised 2012 FATF AML/CFT standards after 2017.45 The FATF Plenary has a number of measures at its disposal should satisfactory progress towards mutual evaluation deficiencies not be achieved, including issuing a formal public statement that the member jurisdiction is not in compliance with the standards.46 Ultimately, South Africa’s access to global financial markets and trade could be restricted should the country be listed as a high-risk or non-cooperative country with significant AML/CFT deficiencies.
40 International Monetary Fund, The withdrawal of correspondent banking relations: a case for policy action, June 2016.
41 Bloomberg, StanChart Joins BofA in Ending Angola Dollar Bank Services, 2 December 2015. Available at: https://www.bloomberg.com/.
42 The Financial Action Task Force (FATF) promotes the adoption and implementation of its recommendations globally and monitors its members’ progress in implementing its recommendations.
43 Financial Action Task Force (FATF) information is available at http://www.fatf-gafi.org
44 For more detail on the Financial Action Task Force (FATF) Bill of 2016, refer to the September 2015 Financial Stability Review.
45 International Monetary Fund, South Africa Financial Sector Assessment Program Anti-Money Laundering and Combating the Financing of Terrorism Technical Note, Country Report no. 15/51, March 2015.
46 Financial Action Task Force, Procedures for the FATF fourth round of AML/CFT mutual evaluations, October 2013.
25Financial Stability Review first edition 2017
Competition Commission action on certain banks’ foreign currency trades
In February 2017, the Competition Commission of South Africa (Commission), the domestic regulator mandated to maintain and promote competition, announced that it had completed an investigation into misconduct by certain foreign currency traders involving, among other things, alleged price fixing and market allocation in the trading of foreign currency pairs involving the South African rand. Seventeen banks are implicated and the allegations relate to currency trading involving the US dollar/rand currency pair in mainly offshore financial centres.47 Three of the banks are from South Africa and the rest have headquarters abroad. This investigation was initiated in 2015 in the wake of similar investigations in the UK and the US in 2014 and 2015 respectively. Should the Competition Tribunal to whom the case was referred find any of the implicated banks guilty, such banks could be liable to pay administrative penalties of up to 10% of their annual turnover.
On 27 October 2014, the SARB and the FSB announced a joint process, by means of a Foreign Exchange Review Committee (FXRC), to review the foreign exchange operations of authorised foreign exchange dealers in the domestic market. On 19 October 2015, the FXRC released its findings and recommendations. One of the FXRC’s findings was that it could find no evidence of malpractice or serious misconduct in the South African foreign exchange market; nonetheless, there is scope for improvement in overall market conduct. Therefore, the FXRC proposed a number of recommendations to strengthen and enhance the efficiency, integrity and credibility of this market. A key recommendation is having a domestic code of conduct for foreign exchange market participants.48
Only one of the implicated banks has to date reached a settlement agreement with the Commission to pay an administrative penalty of R69.5 million. Financial authorities, such as the SARB and National Treasury, have publicly made their views on the allegations known.49 Both institutions have indicated that they view the allegations against the affected banks in a serious light and that the processes initiated by the Commission must be allowed to run their course.
Regulatory developments affecting the domestic insurance sector
Draft Insurance Bill
Developments in the enactment of the draft Insurance Bill were reported on in the September 2015 and March 2016 editions of the Financial Stability Review. The draft Insurance Bill was tabled in Parliament on 28 January 2016. It forms part of Phase 2 of the implementation process of the Twin Peaks
47 For further detail see the Commission’s media statement of 15 February 2017 available on its website.
48 See pages 5, 24, 39 and 30 of the FXRC report, which is available on the SARB website at https://www.resbank.co.za/
49 See SARB media release titled Competition Commission Finding on the Banks, dated 16 February 2016. Available on the SARB and the National Treasury websites.
regulatoryframework. The Insurance Bill will repeal the current Long-term Insurance Act 52 of 1998 and Short-term Insurance Act 53 of 1998 and introduce the solvency assessment and management (SAM) regime in alignment with international standards. The Insurance Bill also introduces insurance group supervision, strengthens governance requirements, and increases access to insurance products through a dedicated micro-insurance framework. The SCOF held public hearings on 7 February 2017.
Amendments to draft Insurance Regulations
In December 2016, National Treasury in conjunction with the FSB issued amendments to the draft Insurance Regulations50 and Policyholder Protection Rules (PPRs). Amendments to the draft Insurance Regulations form part of Phase 1 of the Twin Peaks regulatory reforms51 and address the conduct of business risks and abuses that have been identified through supervision, but which cannot be addressed through the existing regulatory framework.
The greater protection afforded to consumers forms part of the broader agenda of strengthening the market conduct framework and, more specifically, the Treating Customers Fairly initiative. The targeted effective date of the regulatory changes is 1 May 2017. These initiatives are aimed at building greater resilience and sustainability in the insurance industry and aligning this sector with the Twin Peaks regulatory reform, thereby enhancing the resilience of the domestic financial system.
Regulatory developments affecting the domestic financial markets
Developments relating to Financial Market Infrastructures
In June 2016 the Committee on Payments and Market Infrastructures (CPMI) and the Board of the International Organization of Securities Commissions (IOSCO) released a final report titled Guidance on cyber-resilience for financial market infrastructures (Guidance).52 Rapid developments in information and communication technology (ICT) have resulted in financial services providers and consumers becoming increasingly dependent on technology. Some actors in the cyber-world have exploited these dependencies on technology and have caused financial harm to financial sector participants. The Guidance is the first internationally agreed upon framework addressing cyber security for the financial sector. The Guidance framework supplements the CPMI-IOSCO Principles for Financial Market Infrastructures (PFMIs).53 The main objectives of the PFMIs are to enhance safety and efficiency in payment,
50 National Treasury. Available at http://www.treasury.gov.za51 Phase 2 of the Twin Peaks regulatory reform centralises insurance conduct
matters in a planned Conduct of Financial Institutions Bill.52 The full Guidance report is available at http://www.bis.org/cpmi/publ/
d146.pdf.53 Financial market infrastructures (FMIs) are defined as systemically
important payment systems, central securities depositories, securities settlement systems, central counterparties and trade repositories.
Financial Stability Review first edition 201726
clearing, settlement, and recording arrangements, and to limit systemic risk and foster transparency and financial stability”. The Guidance specifically supplements those PFMIs that contribute to resilience against cyber-attacks.
The PFMIs addressed by the Guidance framework include governance, risk management, settlement finality, operational risks and Financial Market Infrastructure (FMI) links. The report also provides regulatory authorities with a set of internationally agreed upon guidelines to support consistent and effective oversight and supervision of FMIs relating to cyber-risks.
The FSR Bill, currently before Parliament, provides for a financial stability mandate which will cover, among other things, FMIs and other systemically important financial institutions. This expanded mandate means that the SARB will have to strengthen its capacity on cyber risk matters and engage with FMIs and the financial industry as a whole to keep abreast of developments on cyber security. South African authorities have noted the increasing trends in domestic cybercrime and have moved to criminalising certain activities committed by means of ICT. Authorities have therefore issued the Cybercrimes and Cybersecurity Bill 201754 (Cyber Bill), which was drafted in line with the requirements contained in the National Cybersecurity Policy Framework (NCPF).55 The Cyber Bill was tabled in Parliament on 22 February 2017 and is expected to be enacted in 2018/19. A country-wide survey of domestic cyber security readiness is being undertaken in the first half of 2017 under the auspices of the Department of Telecommunications and Postal Services. Domestic financial authorities will have access to the results thereof. Internationally, a number of jurisdictions have already built, or are in the process of building, capacity to deal with the increase of cyber-crime.
Revised draft Pension Fund Default Regulations
On 9 December 2016, National Treasury published a second draft of the Retirement Funds Default Regulations for final public comment. The aim of default strategies is to reduce complexity by requiring retirement funds to develop cost-effective, relatively simple and standardised products during the accumulation phase, when members withdraw from funds before they retire and when they convert their retirement savings into income upon retirement. Default options are automatic choices made on behalf of members who did not indicate their preferences. These Regulations also form part of the reform programme to deliver better customer outcomes across the financial sector.
National Treasury had released the first draft of the Retirement Funds Default Regulations on 22 July 2015. Major issues were raised during the initial consultation process related to the practicality of implementing certain requirements. The revised draft aims to take the first major step towards implementing
54 The Cyber Bill is available at http://www.gov.za55 The National Cybersecurity Policy Framework was approved by Cabinet in
2012. It gave rise to a review and alignment of cybersecurity laws in South Africa.
regulations that aim to lower charges and improve market conduct in the retirement industry. The public consultation process closed on 28 February 2017.
Over-the-counter derivatives market reforms
Following the global financial crisis, the Group of Twenty (G-20) agreed on a broad range of regulatory reforms to address the weaknesses revealed in the financial system. One of the areas identified was the opacity of over-the-counter (OTC) derivatives markets, transactions and products as well as the systemic risks that these pose to financial stability.
At its recent plenary meeting, the Financial Stability Board discussed, among other things, the progress in OTC derivatives market reforms and their effects to date.56 The results of the reviews, together with updated evidence on the overall effects of the post-crisis G20 financial reforms, will be published ahead of the G20 Leaders’ Summit in July 2017.
Legislation to enable a framework for the central clearing of OTC derivatives in South Africa is also being constructed. Nevertheless, it is anticipated that the legislative framework for establishing trade repositories and a mandatory clearing of OTC derivatives will be introduced through regulations later in 2017. It is also anticipated that the implementation of a robust regulatory framework for OTC derivatives will contribute to the overall stability of financial markets by mitigating systemic risks associated with these products and providing greater transparency.
Policy recommendations to address structural vulnerabilities emanating from asset management activities
The Financial Stability Board has published policy recommendations57 to address certain structural vulnerabilities from asset management activities that could present financial stability risks. Asset managers generally manage investments on behalf of others. The risks identified by the Financial Stability Board include:
• liquidity mismatches between fund-investment and fund-redemption terms and conditions for open-ended funds;
• leverage within investment funds;
• operational risks and challenges facing asset managers in stressed conditions; and
• securities lending activities of asset managers and funds.
Asset management activities, primarily measured by assets under management, have increased significantly over the past decade, including through open-ended funds that offer daily redemptions to their investors. Open-ended funds are collective investment schemes that can issue and redeem
56 Financial Stability Board, Financial Stability Board Plenary Press Statement, 28 February 2017, available on http://www.fsb.org
57 The document can be accessed at http://www.fsb.org/2017/01/policy- recommendations-to-address-structural-vulnerabilities-from-asset- management-activities/.
27Financial Stability Review first edition 2017
shares at any time as compared with closed-ended funds that are pooled investment funds which raise a fixed amount of capital, usually through an initial public offering. According to the same Financial Stability Board report, global assets under management rose from US$53.6 trillion in 2005 to US$76.7 trillion in 2015, equating to 40.0% of global financial system assets. Growth has been accompanied by increased investment in particular asset classes, which encompass some less actively traded markets. The trend towards greater market-based intermediation through asset management entities should enhance efficiency and contribute to the overall resilience of the financial system. While historical evidence suggests that open-ended funds generally have not created financial stability concerns in recent periods of distress, growth in the sector and increasing holdings of less liquid assets by investment funds suggest that risks might have increased.
Given the important intermediary and agency roles that asset managers play, policymakers and regulators should consider the systemic implications of asset management activities. South Africa participated in a simulation exercise adopted by the Financial Stability Board SCAV to assess second-round spillover effects associated with asset sales and how this could amplify market stress. At a high level, the main finding of the exercise was that market dislocation as a result of asset sales is a tail event although its probability could increase if the asset management industry continued to grow. In South Africa, as in many other emerging economies, there is a need to consider the impact on asset holders globally to accurately capture the price impacts of fire-sales for a certain region. A unique characteristic of the South African asset management industry is that it is the main provider of wholesale funding to the banking sector. Although this arrangement presents a liquidity risk to the sector, it has always been well contained and managed within a closed rand system. For South Africa, the stability risks posed by the asset management industry relate to the size of the industry, its interconnections with banking sector funding markets, and its location within financial conglomerates.

Financial Stability Review first edition 201728
Financial stability risks and outlook
Update on financial stability risksThe SARB regularly assesses the risks to financial stability in the following 12 months, with a view to identifying and mitigating risks and vulnerabilities in the domestic financial system. A number of key scenarios regarding potential threats to financial stability are identified. These potential threats are rated according to the likelihood of their occurrence as well as their expected impact on the domestic financial system. The risks identified are classified as ‘high’, ‘medium’ or ‘low’ in terms of likelihood of the risk occurring, and as ‘severe’ or ‘moderate’ in terms of their impact (Table 8).
Table 8 Risk assessment matrix
Risk and probability Expected impact on financial stability in South Africa
Further credit rating downgrades
High High
Further credit rating downgrades as a result of weak economic growth, political developments, fiscal sustainability, including contingent liabilities linked to state-owned enterprises, and the slow progress with structural reforms.
Capital outflows, potential spillovers to rand-denominated South African government debt, exclusion from major global bond indices, sovereign ceiling downgrades leading to higher cost of and reduced access to funding, more expensive funding for banks; reduced credit to the private sector. Severity is dependent on the extent to which downgrades are already priced in.
Headwinds for the South African financial system
Medium Medium
Domestic banking sector headwinds from low domestic economic growth, elevated household and corporate sector debt increasing vulnerability, and political developments.
Higher unemployment, low growth in disposable income, vulnerable household and corporate debt positions as well as weak corporate profitability spill over to the banking sector through increasing impairments and reduced profitability.
Policy uncertainty in the US
Medium Medium
US policies related to trade protectionism, fiscal stimulus, and a possible rollback of financial regulation may generate negative spillovers for EMs, including South Africa.
Policy shocks could result in expectations of US growth and debt dynamics that are less benign than previously expected, resulting in increased global risk premiums and volatility. Spillovers to South Africa would follow via capital outflows, exchange rate volatility and increased credit and funding risks.
Financial system vulnerabilities in Europe
Medium Medium
Threats to the financial system in Europe, including vulnerability of the EU banking sector, impact of Brexit, elections in some European jurisdictions, Greece’s bailout, etc.
Weaker confidence, higher financial market volatility and/or asset price losses (exchange rate, bond yields, equities), slower global and EM growth (due to a slowdown or even reversal of fiscal and structural reform and trade from nationalist policies), implications for domestic monetary policy (rand effects on inflation).
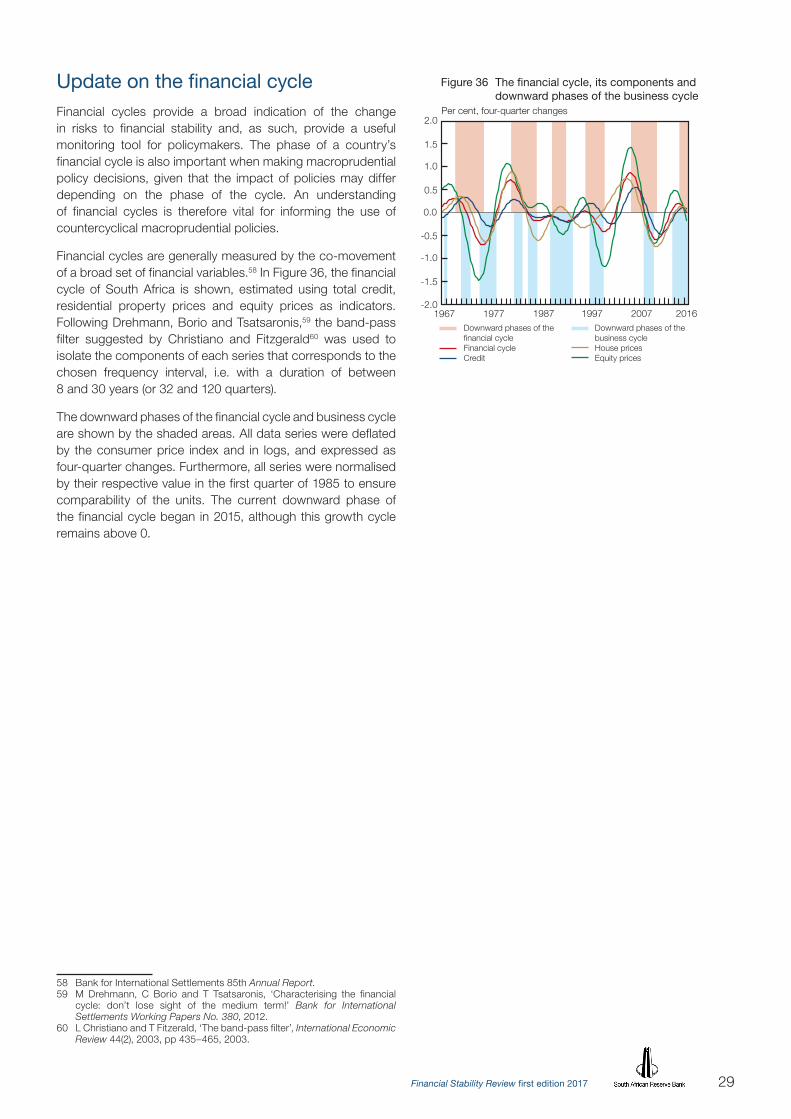
29Financial Stability Review first edition 2017
Update on the financial cycleFinancial cycles provide a broad indication of the change in risks to financial stability and, as such, provide a useful monitoring tool for policymakers. The phase of a country’s financial cycle is also important when making macroprudential policy decisions, given that the impact of policies may differ depending on the phase of the cycle. An understanding of financial cycles is therefore vital for informing the use of countercyclical macroprudential policies.
Financial cycles are generally measured by the co-movement of a broad set of financial variables.58 In Figure 36, the financial cycle of South Africa is shown, estimated using total credit, residential property prices and equity prices as indicators. Following Drehmann, Borio and Tsatsaronis,59 the band-pass filter suggested by Christiano and Fitzgerald60 was used to isolate the components of each series that corresponds to the chosen frequency interval, i.e. with a duration of between 8 and 30 years (or 32 and 120 quarters).
The downward phases of the financial cycle and business cycle are shown by the shaded areas. All data series were deflated by the consumer price index and in logs, and expressed as four-quarter changes. Furthermore, all series were normalised by their respective value in the first quarter of 1985 to ensure comparability of the units. The current downward phase of the financial cycle began in 2015, although this growth cycle remains above 0.
58 Bank for International Settlements 85th Annual Report.59 M Drehmann, C Borio and T Tsatsaronis, ‘Characterising the financial
cycle: don’t lose sight of the medium term!’ Bank for International Settlements Working Papers No. 380, 2012.
60 L Christiano and T Fitzerald, ‘The band-pass filter’, International Economic Review 44(2), 2003, pp 435–465, 2003.
Per cent, four-quarter changes
-2.0
-1.5
-1.0
-0.5
0.0
0.5
1.0
1.5
2.0
Figure 36 The financial cycle, its components and downward phases of the business cycle
1967 19971977 1987 2007 2016 Downward phases of the financial cycle Financial cycle Credit
Downward phases of the business cycle House prices Equity prices
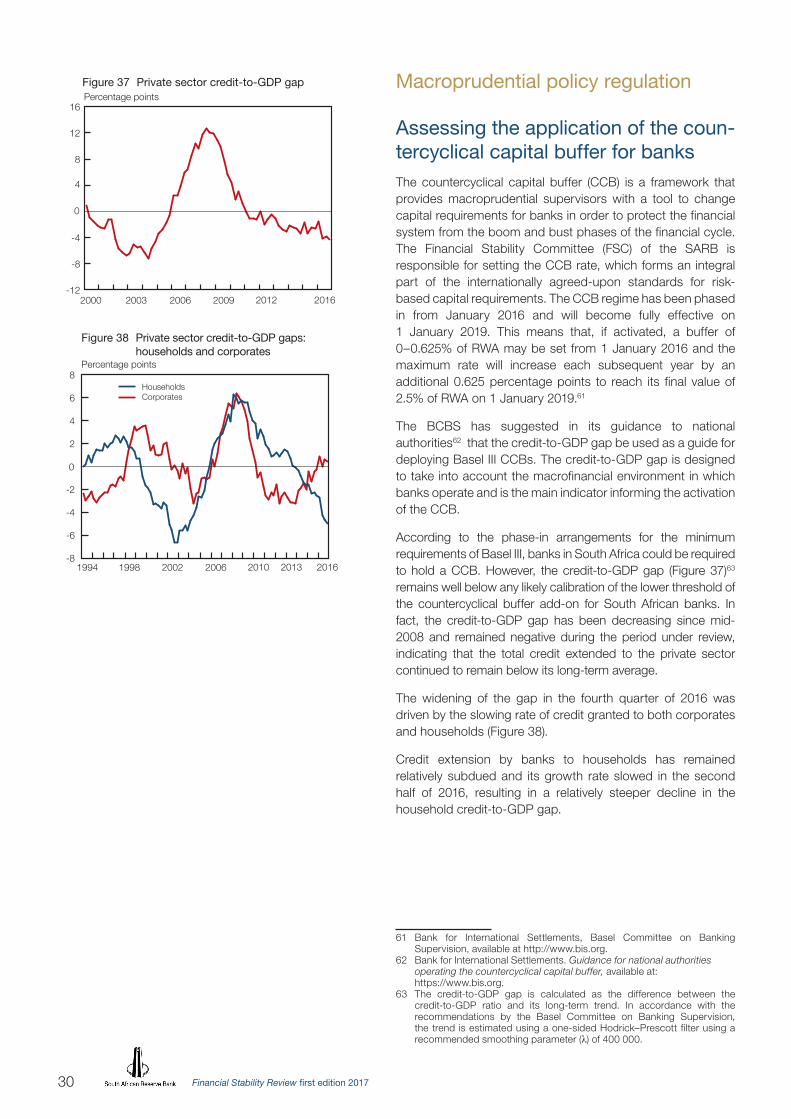
Financial Stability Review first edition 201730
Macroprudential policy regulation
Assessing the application of the coun-tercyclical capital buffer for banksThe countercyclical capital buffer (CCB) is a framework that provides macroprudential supervisors with a tool to change capital requirements for banks in order to protect the financial system from the boom and bust phases of the financial cycle. The Financial Stability Committee (FSC) of the SARB is responsible for setting the CCB rate, which forms an integral part of the internationally agreed-upon standards for risk-based capital requirements. The CCB regime has been phased in from January 2016 and will become fully effective on 1 January 2019. This means that, if activated, a buffer of 0–0.625% of RWA may be set from 1 January 2016 and the maximum rate will increase each subsequent year by an additional 0.625 percentage points to reach its final value of 2.5% of RWA on 1 January 2019.61
The BCBS has suggested in its guidance to national authorities62 that the credit-to-GDP gap be used as a guide for deploying Basel III CCBs. The credit-to-GDP gap is designed to take into account the macrofinancial environment in which banks operate and is the main indicator informing the activation of the CCB.
According to the phase-in arrangements for the minimum requirements of Basel III, banks in South Africa could be required to hold a CCB. However, the credit-to-GDP gap (Figure 37)63 remains well below any likely calibration of the lower threshold of the countercyclical buffer add-on for South African banks. In fact, the credit-to-GDP gap has been decreasing since mid-2008 and remained negative during the period under review, indicating that the total credit extended to the private sector continued to remain below its long-term average.
The widening of the gap in the fourth quarter of 2016 was driven by the slowing rate of credit granted to both corporates and households (Figure 38).
Credit extension by banks to households has remained relatively subdued and its growth rate slowed in the second half of 2016, resulting in a relatively steeper decline in the household credit-to-GDP gap.
61 Bank for International Settlements, Basel Committee on Banking Supervision, available at http://www.bis.org.
62 Bank for International Settlements. Guidance for national authorities operating the countercyclical capital buffer, available at: https://www.bis.org.
63 The credit-to-GDP gap is calculated as the difference between the credit-to-GDP ratio and its long-term trend. In accordance with the recommendations by the Basel Committee on Banking Supervision, the trend is estimated using a one-sided Hodrick–Prescott filter using a recommended smoothing parameter (λ) of 400 000.
Percentage points
-12
-8
-4
0
4
8
12
16
Figure 37 Private sector credit-to-GDP gap
2000 2003 2006 2009 2012 2016
Percentage points
-8
-6
-4
-2
0
2
4
6
8
Figure 38 Private sector credit-to-GDP gaps: households and corporates
1994 1998 2002 2006 2010 2013 2016
Households Corporates

31Financial Stability Review first edition 2017
Credit extended in different credit categories continued to exhibit different and, in some cases, divergent growth trends (Figure 39).64 However, the credit-to-GDP gaps for all subcategories of credit were below 2 percentage points in the second half of 2016. The credit-to-GDP gap for mortgage advances not only remained well below its long-term trend, but declined even further, possibly displaying persistent and generally weak confidence and economic outlook levels.
Consideration for the activation of the countercyclical capital buffer for banksAccording to the arrangements for the minimum requirements of Basel III, the CCB could be applied to banks from 2016 if required. However, at a recent meeting of the FSC it was decided, after taking all relevant information into account, not to activate the CCB add-on for banks at this stage and to keep the rate at 0%.
64 Note that the South African Reserve Bank has not yet contemplated applying the countercyclical capital buffer add-on on individual loan categories.
Instalment sale credit Mortgages Other loans and advances
Percentage points
-8
-6
-4
-2
0
2
4
6
8
10
Figure 39 Selected private sector credit-to-GDP gaps according to asset class
Leasing finance Overdrafts and credit cards
1994 1998 2002 2006 2010 2013 2016

Financial Stability Review first edition 201732
• Financial institutions are capable of continuing to provide financial products and financial services, and market infrastructures are capable of continuing to perform their functions and duties in terms of financial sector laws, without interruption despite changes in economic circumstances.
• There is general confidence in the ability of financial institutions to continue to provide financial products and financial services, and in the ability of market infrastructures to continue to perform their functions and duties in terms of financial sector laws, without interruption despite changes in economic circumstances.
The SARB is tasked with monitoring the financial system for potential systemic risks. Also, if a systemic event has occurred or is imminent, the SARB is tasked with restoring and maintaining stability.66 The FSR Bill also provides for the establishment of an advisory committee, the Financial Stability Oversight Committee (FSOC), to be chaired by the Governor of the SARB and to include member representatives from the SARB, National Treasury and other financial regulators.67
The formulation of macroprudential policy within the SARB in support of the financial stability mandate is envisaged to be the responsibility of the Financial Stability Committee (FSC). The FSC was established in 2000 and was recently restructured in accordance with the SARB’s extended responsibilities. The FSC has overlapping membership with the Monetary Policy Committee (MPC), which facilitates communication between the committees and coordinates macroprudential and monetary policies. In addition to MPC members, the FSC also includes senior SARB officials who represent relevant areas of the SARB. The FSC meets each quarter or as required, and a press statement will be issued after each FSC meeting once the FSR Bill has been promulgated.
The coordination of policies that have a bearing on financial stability is a challenging matter. Macroprudential policy clearly interacts with monetary policy, and is interdependent with it. Both policies are aimed at economic stability in the interest of maximising sustained long-term growth. However, coordination with other policies is also important. For example, when international capital mobility is high, some recent literature suggests that macroprudential capital flow management measures – controls aimed at mitigating externalities to reduce the risk of financial crises – may be considered. There are also both complementarities and possible conflicts with fiscal, microprudential, market conduct, exchange control, resolution and competition policies. Furthermore, where financial
66 A systemic event means an event or circumstance, including one that occurs or arises outside South Africa, that may reasonably be expected to have a substantial adverse effect on the financial system or on economic activity in South Africa, including an event or circumstance that leads to a loss of confidence that operators of, or participants in, payment systems, settlement systems or financial markets, or financial institutions, are able to continue to provide financial products or financial services.
67 In terms of the draft Financial Sector Regulation Bill 2015, the Financial Stability Oversight Committee will consist of the following members: the Governor of the SARB, the Deputy Governor of the SARB responsible for financial stability matters, the Chief Executive Officer of the Prudential Authority, the Commissioner of the Financial Sector Conduct Authority, the Chief Executive Officer of the National Credit Regulator, the Director-General of National Treasury, the Director of the Financial Intelligence Centre, and a maximum of three additional persons appointed by the Governor of the SARB.
NOTE: A new macroprudential policy framework for South Africa65
IntroductionThe severity of the 2007–08 global financial crisis and the magnitude of the costs imposed on countries resulted in a renewed focus on the role of the financial system as the source of financial crises. There is growing consensus among jurisdictions globally to direct regulatory frameworks towards placing more emphasis on mitigating systemic risks in the financial system. South Africa launched a formal review of its financial regulatory system in 2007, resulting in a number of policy papers and culminating in the publication of the Financial Sector Regulation Bill 2015 (FSR Bill). The FSR Bill assigns primary responsibility to the South African Reserve Bank (SARB) for protecting and enhancing financial stability, and seeks to ensure cooperation between regulators in pursuing the stability of the financial system. This note outlines the SARB’s approach to executing its financial stability policy mandate within this context.
In considering the macroprudential policy framework, it is important to understand systemic risk and its sources. It is the SARB’s responsibility to take all reasonable steps to prevent systemic events from occurring and to mitigate the adverse effects of events on financial stability through the application of a range of macroprudential policy instruments.
Macroprudential policy instruments are generally classified into three categories, namely capital-based instruments (e.g. countercyclical capital buffers, sectoral capital requirements and dynamic provisions), asset-side instruments (e.g. loan-to-value (LTV) and debt-to-income (DTI) ratio limits), and liquidity-based instruments (e.g. countercyclical liquidity requirements). Although empirical evidence remains limited, a detailed understanding of how the different instruments function, including their transmission mechanisms, is crucial for their effective and transparent application. It is against this background that the SARB seeks to outline the rationale for a macroprudential policy approach and describe the steps to be taken in its execution.
Institutional structure The definition of ‘financial stability’ that has been adopted in the FSR Bill (October 2016 version) stresses the importance of ‘resilience’ and ‘confidence’:
• Financial institutions generally provide financial products and financial services, and market infrastructures generally perform their functions and duties in terms of financial sector laws, without interruption.
65 This note is a shortened version of the paper that was released during November 2016 for public comment and which is available on the SARB’s website: https://www.resbank.co.za.
33Financial Stability Review first edition 2017
institutions have cross-border operations, the assessment of systemic risk in both home and host countries becomes more difficult, and requires bilateral and multilateral coordination and consultation.
Systemic risk as the focus of macroprudential policy In considering the macroprudential policy framework, it is important to focus on systemic risk and its sources. Macroprudential policy is primarily concerned with the use of macroprudential instruments to limit systemic risk. ‘Systemic risk’ is defined here as the risk of a disruption(s) to the provision of any of the key financial services that is caused by an impairment of a part(s) of the financial system or the financial system as a whole, and which can have serious consequences for the real economy. Systemic risk may arise at certain points in the economic cycle where borrowers exceed their means, when leverage in the financial sector is high, and when maturity transformation is excessive.
Objectives of macroprudential policy Macroprudential policy has two broad aims that are not mutually exclusive: first, strengthening the resilience of the financial system to economic downturns and other adverse aggregate shocks, and second, leaning against the financial cycle to limit both the accumulation of financial risks and the likelihood or the extent of a financial crisis.
A framework for macroprudential policy decision making Three key steps can be identified to the macroprudential policy process leading up to the activation of macroprudential tools. These are conducting a systemic risk assessment, building a case and motivation for macroprudential intervention, and selecting and implementing the appropriate macroprudential instruments.
The first step in the decision-making process requires monitoring the financial system in order to provide a systemic risk assessment. The focus of the monitoring exercise is on systemic vulnerabilities that propagate adverse shocks (rather than on the shocks themselves)68 and includes analyses of risks in financial institutions identified as systemically important (SIFIs), shadow banks, asset markets, and the non-financial sector. The risk assessment process uses indicators that confirm the build-up of imbalances in the financial system.
Following a systemic risk assessment process, the second step is to determine whether there is a case for macroprudential intervention. The SARB satisfies itself that, despite the continued application of monetary policy and microprudential supervision, the level and distribution of risk(s) across the financial system will intensify if it remains unaddressed. In
68 T Adrian, D Covitz and N Liang, ‘Financial stability monitoring’, Annual Review of Financial Economics 7, 2015, pp 357–395. B Bernanke, ‘Monitoring the financial system’, speech at the 49th Annual Conference on Bank Structure and Competition, 10 May 2013.
this regard, an assessment of the viability of monetary and/or microprudential policy would precede the determination of a need for macroprudential intervention. In determining a case for macroprudential intervention, it is important to assess the potential cost of the intervention relative to the expected benefits, and to balance the possible trade-off between missing the build-up of a risk and implementing measures that are not needed.69
Macroprudential tools may have costs, but so too does inaction (the most recent global financial crisis serves as a reminder). Timing is also important. Late intervention often renders the tools ineffective as there is insufficient time for them to work, only resulting in a further deterioration of financial conditions. Similarly, a mistimed deactivation could lead to undesired results, sending the wrong signal to markets and amplifying the adverse procyclical effects.
The third and last step is about the selection and implementation of appropriate macroprudential tools that target the source(s) of systemic risk, such as liquidity and maturity mismatches, leverage or interconnectedness. Although this note focuses mainly on the banking sector, systemic vulnerabilities could emerge in non-bank SIFIs, the shadow-banking sector, asset markets and/or the non-financial sector, and the macroprudential policy framework would have to be cognisant of this. Before applying an instrument, it would be important to first confirm its appropriateness and whether its impact is assessable. Each instrument should be related to the intermediate target(s) of macroprudential policy in order to track its success (or failure) in reducing either cyclical or structural risks. The purpose of the instruments is to respond to developments in the financial cycle, taking into account macroeconomic conditions. During an upward phase of the credit cycle, the cyclical backdrop of macroeconomic conditions should be supportive of the view to tighten credit conditions if the build-up of a particular vulnerability is clearly identifiable.
Macroprudential instruments can also be applied to a specific sector that poses a systemic risk. The level of success in implementing macroprudential instruments will depend on the ability to identify and assess the level of systemic risks and vulnerabilities, and to correctly time the required intervention.
Conclusion to the noteInformation on policy instruments, their activation and deactivation as well as their impact on financial system stability will be published in future issues of the Financial Stability Review. A new regular feature in the publication will describe the policy measures taken by the FSC and their expected and/or observed impact. Communication will also take place through press releases.
69 X Freixas, L Laeven, and J L Peydro, Systemic risk, crises, and macroprudential regulation, 2015.
Financial Stability Review first edition 201734
Abbreviations
AGR augmented Guidotti ratio
Alsi All-Share Index
AML/CFT anti-money laundering and combating the financing of terrorism
BCBS Basel Committee on Banking Supervision
BDI Business Debt Index
BER Bureau for Economic Research (Stellenbosch University)
BETI BankservAfrica Economic Transaction Index
BMR Bureau of Market Research
BRICS Brazil, Russia, India, China, South Africa
BSD Bank Supervision Department
CAR capital adequacy ratio
CBR Conduct of Business Return
CCB countercyclical capital buffer
CCI Consumer Confidence Index
CFVI Consumer Financial Vulnerability Index
CIS collective investment schemes
CPMI Committee on Payments and Market Infrastructures
DTI debt-to-income ratio
EBIT earnings before interest and taxes
ECL expected credit loss
EDF expected default frequency
e.g. for example, from exempli gratia (Latin)
ELMI+ Emerging Local Markets Index Plus
EM emerging markets
EMBIG Emerging Market Bond Indices Global
EU European Union
FATF Financial Action Task Force
FMI financial market infrastructure
FNB First National Bank
FSB Financial Services Board
FSC Financial Stability Committee
FSOC Financial Stability Oversight Committee
FSR Bill Financial Sector Regulation Bill 2015
FXRC Foreign Exchange Review Committee
G-20 Group of Twenty
GBI-EM Global Bond Index Emerging Markets
GD Global Diversified
GDP gross domestic product
GR Guidotti ratio
HPI House Price Index
IAASB International Standard on Auditing and Assurance Standards Board
IAS International Accounting Standard
IASB International Accounting Standard Board
ICR interest coverage ratio
ICT information and communication technology
i.e. that is to say, from id est (Latin)
IFRS International Financial Reporting Standard
IG investment grade
IIF Institute of International Finance
IMF International Monetary Fund
IOSCO International Organization of Securities Commissions
ISA International Standard on Auditing
LCR liquidity coverage ratio
LTV loan-to-value ratio
MMF money market funds
MPC Monetary Policy Committee
MSCI Morgan Stanley Capital International
NCOP National Council of Provinces
NCPF National Cybersecurity Policy Framework
OFI other financial intermediary
OTC over the counter
PMI Purchasing Managers’ Index
PPR Policyholder Protection Rules
ROE return on equity
SAM Solvency Assessment and Management
SARB South African Reserve Bank
SBEG Shadow Banking Experts Group (Financial Stability Board)
SCAV Standing Committee on Assessment of Vulnerabilities
SCOF Standing Committee on Finance
SIFI systemically important financial institutions
SME small and medium enterprise
SSA sub-Saharan Africa
the dti Department of Trade and Industry
UK United Kingdom
US United States
WGBI World Government Bond Index