first alter global climate - eesc.columbia.edu · ral source —the decomposition ......
TRANSCRIPT

46 S C I E N T I F I C A M E R I C A N M A R C H 2 0 0 5
AGRICULTUR AL TERR ACES have been constructed for some 2,000 years. Those on the opposite page are in Guizhou Province, China.
A bold new hypothesis suggests that our ancestors’ farming practices kicked off global warming thousands of years before we started burning coal and driving cars
By William F. Ruddiman
The scientifi c consensusthat human actions fi rst began to have a warming effect on the earth’s climate within the past century has become part of the public perception as well. With the advent of coal-burning factories and power plants, industrial societies be-gan releasing carbon dioxide (CO2) and other greenhouse gases into the air. Later, motor vehicles added to such emis-sions. In this scenario, those of us who have lived during the industrial era are responsible not only for the gas buildup in the atmosphere but also for at least part of the accompanying global warming trend. Now, though, it seems our ancient agrarian ancestors may have begun adding these gases to the atmosphere many millennia ago, thereby altering the earth’s climate long before anyone thought.
New evidence suggests that concentrations of CO2 start-ed rising about 8,000 years ago, even though natural trends indicate they should have been dropping. Some 3,000 years later the same thing happened to methane, another heat-trap-ping gas. The consequences of these surprising rises have been profound. Without them, current temperatures in northern parts of North America and Europe would be cool-er by three to four degrees Celsius—enough to make agricul-ture diffi cult. In addition, an incipient ice age—marked by the appearance of small ice caps—would probably have be-gun several thousand years ago in parts of northeastern Can-ada. Instead the earth’s climate has remained relatively warm and stable in recent millennia.
HOW DID HUMANSFIRST ALTER GLOBAL CLIMATE?
GE
OR
G G
ER
STE
R P
ho
to R
es
ea
rch
ers
, In
c.
COPYRIGHT 2005 SCIENTIFIC AMERICAN, INC.

w w w. s c i a m . c o m S C I E N T I F I C A M E R I C A N 47
CR
ED
IT
COPYRIGHT 2005 SCIENTIFIC AMERICAN, INC.

48 S C I E N T I F I C A M E R I C A N M A R C H 2 0 0 5
Until a few years ago, these anoma-lous reversals in greenhouse gas trends and their resulting effects on climate had escaped notice. But after studying the problem for some time, I realized that about 8,000 years ago the gas trends stopped following the pattern that would be predicted from their past long-term behavior, which had been marked by regular cycles. I concluded that human activities tied to farming—primarily ag-ricultural deforestation and crop irriga-tion—must have added the extra CO2 and methane to the atmosphere. These activities explained both the reversals in gas trends and the ongoing increases right up to the start of the industrial era. Since then, modern technological inno-vations have brought about even faster
rises in greenhouse gas concentrations.My claim that human contributions
have been altering the earth’s climate for millennia is provocative and controver-sial. Other scientists have reacted to this proposal with the mixture of enthusi-asm and skepticism that is typical when novel ideas are put forward, and testing of this hypothesis is now under way.
The Current View this new idea builds on decades of advances in understanding long-term climate change. Scientists have known since the 1970s that three predictable variations in the earth’s orbit around the
sun have exerted the dominant control over long-term global climate for mil-lions of years. As a consequence of these orbital cycles (which operate over 100,000, 41,000 and 22,000 years), the amount of solar radiation reaching vari-ous parts of the globe during a given sea-son can differ by more than 10 percent. Over the past three million years, these regular changes in the amount of sunlight reaching the planet’s surface have pro-duced a long sequence of ice ages (when great areas of Northern Hemisphere con-tinents were covered with ice) separated by short, warm interglacial periods.
Dozens of these climatic sequences occurred over the millions of years when hominids were slowly evolving toward anatomically modern humans. At the
end of the most recent glacial period, the ice sheets that had blanketed northern Europe and North America for the pre-vious 100,000 years shrank and, by 6,000 years ago, had disappeared. Soon after, our ancestors built cities, invented writing and founded religions. Many scientists credit much of the progress of civilization to this naturally warm gap between less favorable glacial intervals, but in my opinion this view is far from the full story.
In recent years, cores of ice drilled in the Antarctic and Greenland ice sheets have provided extremely valuable evi-dence about the earth’s past climate, in-
cluding changes in the concentrations of the greenhouse gases. A three-kilome-ter-long ice core retrieved from Vostok Station in Antarctica during the 1990s contained trapped bubbles of ancient air that revealed the composition of the at-mosphere (and the gases) at the time the ice layers formed. The Vostok ice con-fi rmed that concentrations of CO2 and methane rose and fell in a regular pat-tern during virtually all of the past 400,000 years.
Particularly noteworthy was that these increases and decreases in green-house gases occurred at the same inter-vals as variations in the intensity of solar radiation and the size of the ice sheets. For example, methane concentrations fl uctuate mainly at the 22,000-year tem-
po of an orbital cycle called precession. As the earth spins on its rotation axis, it wobbles like a top, slowly swinging the Northern Hemisphere closer to and then farther from the sun. When this preces-sional wobble brings the northern conti-nents nearest the sun during the sum-mertime, the atmosphere gets a notable boost of methane from its primary natu-ral source—the decomposition of plant matter in wetlands.
After wetland vegetation fl ourishes in late summer, it then dies, decays and emits carbon in the form of methane, sometimes called swamp gas. Periods of maximum summertime heating enhance methane production in two primary ways: In southern Asia, the warmth draws additional moisture-laden air in from the Indian Ocean, driving strong tropical monsoons that fl ood regions that might otherwise stay dry. In far northern Asia and Europe, hot summers thaw boreal wetlands for longer periods of the year. Both processes enable more vegetation to grow, decompose and emit methane every 22,000 years. When the Northern Hemisphere veers farther from
■ A new hypothesis challenges the conventional assumption that greenhouse gases released by human activities have perturbed the earth’s delicate climate only within the past 200 years.
■ New evidence suggests instead that our human ancestors began contributing signifi cant quantities of greenhouse gases to the atmosphere thousands of years earlier by clearing forests and irrigating fi elds to grow crops.
■ As a result, human beings kept the planet notably warmer than it would have been otherwise—and possibly even averted the start of a new ice age.
Overview/Early Global Warming
My claim that human contributions have been ALTERING THE EARTH’S CLIMATE FOR MILLENNIA
is provocative and controversial.
COPYRIGHT 2005 SCIENTIFIC AMERICAN, INC.

w w w. s c i a m . c o m S C I E N T I F I C A M E R I C A N 49
the sun, methane emissions start to de-cline. They bottom out 11,000 years later—the point in the cycle when North-ern Hemisphere summers receive the least solar radiation.
Unexpected Reversalse x a m i n i ng r e c or d s from the Vostok ice core closely, I spotted some-thing odd about the recent part of the record. Early in previous interglacial in-tervals, the methane concentration typi-cally reached a peak of almost 700 parts per billion (ppb) as precession brought summer radiation to a maximum. The
same thing happened 11,000 years ago, just as the current interglacial period be-gan. Also in agreement with prior cycles, the methane concentration then declined by 100 ppb as summer sunshine subse-quently waned. Had the recent trend continued to mimic older interglacial in-tervals, it would have fallen to a value near 450 ppb during the current mini-mum in summer heating. Instead the trend reversed direction 5,000 years ago and rose gradually back to almost 700 ppb just before the start of the industrial era. In short, the methane concentration rose when it should have fallen, and it
ended up 250 ppb higher than the equiv-alent point in earlier cycles.
Like methane, CO2 has behaved un-expectedly over the past several thou-sand years. Although a complex combi-nation of all three orbital cycles controls CO2 variations, the trends during previ-ous interglacial intervals were all sur-prisingly similar to one another. Con-centrations peaked at 275 to 300 parts per million (ppm) early in each warm pe-riod, even before the last remnants of the great ice sheets fi nished melting. The CO2 levels then fell steadily over the next 15,000 years to an average of about
IIIII
Thousands of Years Ago
Sola
r Rad
iatio
n (w
atts
per
squ
are
met
er)
520
480
440
Methane in Vostok Ice Cores
(parts per billion)
800
600
400
200
Solar RadiationMethane
200 150 100 50 0
-
-
-
-
-
Summer warmth in the Northern Hemisphere peaks once every 22,000 years, when the yearly northern summer coincides with the earth’s closest passage to the sun and the Northern Hemisphere receives the most intense sunlight.
Summer heat bottoms out 11,000 years later, after the earth’s axis has shifted (precessed) to the opposite position. The Northern Hemisphere then receives the least summer sunlight, because the earth is farthest from the sun.
Methane concentrations rose and fell over the past 250,000 years in near harmony with the precession-induced ups and downs of solar radiation in the Northern Hemisphere. The highest temperatures stimulated extreme methane production in wetlands, which are the atmosphere’s primary natural source of this greenhouse gas.
CO2 concentrations, which fl uctuated in cycles over the past 350,000 years, varied in response to precession as well as to shifts in the tilt of the earth’s rotational axis and in the shape of its orbit. These other cycles occur every 41,000 and 100,000 years, respectively.
Wobble in the earth’s axis of rotation, known as precession, is one of the three orbital cycles that account for sunlight variations in the Northern Hemisphere. Like a toy top about to fall, the earth’s axis traces imaginary circles in space, making one revolution every 22,000 years.
IIII
Carb
on D
ioxi
de(p
arts
per
mill
ion) 280
240
200
-
-
-
Thousands of Years Ago300 200 100 0
MAXIMUM SOLAR RADIATION IN NORTHERN HEMISPHERE
MINIMUM SOLAR RADIATION IN NORTHERN HEMISPHERE
Sun
Yearly orbit
Precession
Equator
Orbital Controls over Greenhouse Gases Natural variations in the earth’s orbit, such as those related to precession (diagrams), redistribute the sunlight that reaches the globe over long timescales. For the past million years, these subtle changes have driven major dips and swells in atmospheric concentrations of methane and carbon dioxide
(graphs). Although scientists do not fully understand why, global concentrations of these greenhouse gases respond mainly to changes that occur during summer in the Northern Hemisphere, the time of year when the North Pole is pointed most directly at the sun.
Northernwinter
Northernwinter
LU
CY
RE
AD
ING
-IK
KA
ND
A
Northernsummer
Northernsummer
11,000 YEARS LATER
COPYRIGHT 2005 SCIENTIFIC AMERICAN, INC.

50 S C I E N T I F I C A M E R I C A N M A R C H 2 0 0 5
245 ppm. During the current interglacial interval, CO2 concentrations reached the expected peak around 10,500 years ago and, just as anticipated, began a sim-ilar decline. But instead of continuing to drop steadily through modern times, the trend reversed direction 8,000 years ago. By the start of the industrial era, the concentration had risen to 285 ppm—
roughly 40 ppm higher than expected from the earlier behavior.
What could explain these unexpect-ed reversals in the natural trends of both methane and CO2? Other investigators suggested that natural factors in the cli-mate system provided the answer. The methane increase has been ascribed to expansion of wetlands in Arctic regions and the CO2 rise to natural losses of car-bon-rich vegetation on the continents, as well as to changes in the chemistry of the ocean. Yet it struck me that these expla-nations were doomed to fail for a simple reason. During the four preceding inter-glaciations, the major factors thought to infl uence greenhouse gas concentrations in the atmosphere were nearly the same as in recent millennia. The northern ice sheets had melted, northern forests had reoccupied the land uncovered by ice, meltwater from the ice had returned sea
level to its high interglacial position, and solar radiation driven by the earth’s or-bit had increased and then begun to de-crease in the same way.
Why, then, would the gas concentra-tions have fallen during the last four in-terglaciations yet risen only during the current one? I concluded that something new to the natural workings of the cli-mate system must have been operating during the past several thousand years.
The Human Connectionthe most plausible “new factor” operating in the climate system during the present interglaciation is farming. The basic timeline of agricultural inno-vations is well known. Agriculture orig-inated in the Fertile Crescent region of the eastern Mediterranean around 11,000 years ago, shortly thereafter in northern China, and several thousand years later in the Americas. Through subsequent millennia it spread to other regions and increased in sophistication. By 2,000 years ago, every crop food eat-en today was being cultivated some-where in the world.
Several farming activities generate methane. Rice paddies fl ooded by irriga-tion generate methane for the same rea-
son that natural wetlands do—vegeta-tion decomposes in the stagnant stand-ing water. Methane is also released as farmers burn grasslands to attract game and promote growth of berries. In addi-tion, people and their domesticated ani-mals emit methane with feces and belch-es. All these factors probably contribut-ed to a gradual rise in methane as human populations grew slowly, but only one process seems likely to have accounted for the abruptness of the reversal from a natural methane decline to an unexpect-ed rise around 5,000 years ago—the on-set of rice irrigation in southern Asia.
Farmers began flooding lowlands near rivers to grow wet-adapted strains of rice around 5,000 years ago in the south of China. With extensive fl ood-plains lying within easy reach of several large rivers, it makes sense that broad swaths of land could have been fl ooded soon after the technique was discovered, thus explaining the quick shift in the methane trend. Historical records also indicate a steady expansion in rice irri-gation throughout the interval when methane values were rising. By 3,000 years ago the technique had spread south into Indochina and west to the Ganges River Valley in India, further increasing
Human Activities and Greenhouse GasesOur human ancestors invented agriculture about 11,000 years ago—around the same time that atmospheric concentrations of methane and CO2 peaked in the wake of the last ice age. Had the gas trends subsequently mimicked older interglacial intervals, as expected, they would have fallen right up through the start of the industrial era. Instead the declining trends of both gases reversed direction several thousand years ago and have risen steadily ever since. The timing of key agricultural innovations—namely, deforestation and rice irrigation—may explain these surprising reversals. —W.F.R.
8,000 years ago: Late Stone Age Europeans begin clearing forests to grow wheat, barley, peas and other nonindigenous crop plants
7,500 years ago: Humans adapt wild rice for cultivation
P E T R I E M U S E U M O F E G Y P T I A N A R C H A E O L O G Y, U N I V E R S I T Y C O L L E G E L O N D O N (s i c k l e b l a d e a n d c a r b o n i ze d w h e a t) ; J O N AT H A N B L A I R Co r b i s (r i c e)
Carb
on D
ioxi
de (p
arts
per
mill
ion)
Years Ago10,000 5000 0
Observedtrend
Natural trend
280
260
2408,000
11,000 years ago: Early peoples invent agriculture in Mesopotamia and China
8,000 years ago: CO2 trend, which has been falling for 2,500 years, bottoms out and suddenly reverses direction
10,000 YEARS AGO 8,000 YEARS AGO
Carbonized wheatPaleolithic sickle blade
COPYRIGHT 2005 SCIENTIFIC AMERICAN, INC.

w w w. s c i a m . c o m S C I E N T I F I C A M E R I C A N 51
methane emissions. After 2,000 years, farmers began to construct rice paddies on the steep hillsides of Southeast Asia.
Future research may provide quanti-tative estimates of the amount of land irrigated and methane generated through this 5,000-year interval. Such estimates will be probably be diffi cult to come by, however, because repeated irrigation of the same areas into modern times has probably disturbed much of the earlier evidence. For now, my case rests mainly on the basic fact that the methane trend went the “wrong way” and that farmers began to irrigate wetlands at just the right time to explain this wrong-way trend.
Another common practice tied to farming—deforestation—provides a plausible explanation for the start of the anomalous CO2 trend. Growing crops in naturally forested areas requires cut-ting trees, and farmers began to clear forests for this purpose in Europe and
China by 8,000 years ago, initially with axes made of stone and later from bronze and then iron. Whether the fallen trees were burned or left to rot, their carbon would have soon oxidized and ended up in the atmosphere as CO2.
Scientists have precisely dated evi-dence that Europeans began growing nonindigenous crop plants such as wheat, barley and peas in naturally for-ested areas just as the CO2 trend reversed 8,000 years ago. Remains of these plants, initially cultivated in the Near East, fi rst appear in lake sediments in southeastern Europe and then spread to the west and north over the next several thousand years. During this interval, silt and clay began to wash into rivers and lakes from denuded hillsides at increas-ing rates, further attesting to ongoing forest clearance.
The most unequivocal evidence of early and extensive deforestation lies in a
unique historical document—the Dooms-day Book. This survey of England, or-dered by William the Conqueror, report-ed that 90 percent of the natural forest in lowland, agricultural regions was cleared as of A.D. 1086. The survey also counted 1.5 million people living in England at the time, indicating that an average den-sity of 10 people per square kilometer was suffi cient to eliminate the forests. Because the advanced civilizations of the major river valleys of China and India had reached much higher population densities several thousand years prior, many historical ecologists have conclud-ed that these regions were heavily defor-ested some two or even three thousand years ago. In summary, Europe and southern Asia had been heavily defor-ested long before the start of the indus-trial era, and the clearance process was well under way throughout the time of the unusual CO2 rise.
An Ice Age Prevented?i f fa r m ers w er e responsible for greenhouse gas anomalies this large—
250 ppb for methane and 40 ppm for CO2 by the 1700s—the effect of their practices on the earth’s climate would have been substantial. Based on the aver-
WILLIAM F. RUDDIMAN is a marine geologist and professor emeritus of environmental sciences at the University of Virginia. He joined the faculty there in 1991 and served as department chair from 1993 to 1996. Ruddiman fi rst began studying records of climate change in ocean sediments as a graduate student at Columbia University, where he re-ceived his doctorate in 1969. He then worked as a senior scientist and oceanographer with the U.S. Naval Oceanographic Offi ce in Maryland and later as a senior research sci-entist at Columbia’s Lamont-Doherty Earth Observatory.
THE
AU
THO
R
5,000 years ago: Methane trend, which
has been falling for 6,000 years, suddenly
reverses direction
5,000 years ago: Farmers in the south of China begin fl ooding lowlands near rivers to grow rice
2,000 years ago: Europe, India, Southeast Asia and China have cleared much of their natural forest cover to grow crops such as wheat
2,000 years ago: Farmers in Southeast Asia begin to construct terraced rice paddies on steep hillsides
200 years ago: Combustion of fossil fuels and accelerating deforestation result in unprecedented releases of greenhouse gases
J U L I A W AT E R L O W Ey e U b i q u i to u s / Co r b i s ( i r r i g a ti o n) ; T H E I M A G E B A N K (d e f o r e s ta ti o n) ; V I N C E S T R E A N O Co r b i s (w h e a t f i e l d ) ; D AV I D G R E E D Y G e t ty I m a g e s (r i c e te r r a c e s) ; S C I E N C E L I B R A R Y/ S S P L (c o m b u s ti o n e n g i n e) ; L U C Y R E A D I N G - I K K A N D A ( g r a p h s)
700
600
500Met
hane
(pa
rts
per b
illio
n)
Years Ago10,000 5,000 0
Observedtrend
Natural trend
6,000 YEARS AGO 4,000 YEARS AGO 2,000 YEARS AGO PRESENT
Otto engine
COPYRIGHT 2005 SCIENTIFIC AMERICAN, INC.

52 S C I E N T I F I C A M E R I C A N M A R C H 2 0 0 5
age sensitivity shown by a range of cli-mate models, the combined effect from these anomalies would have been an av-erage warming of almost 0.8
degree C
just before the industrial era. That amount is larger than the 0.6 degree C warming measured during the past cen-tury—implying that the effect of early farming on climate rivals or even exceeds the combined changes registered during the time of rapid industrialization.
How did this dramatic warming ef-fect escape recognition for so long? The main reason is that it was masked by natural climatic changes in the opposite direction. The earth’s orbital cycles were driving a simultaneous natural cooling trend, especially at high northern lati-tudes. The net temperature change was a gradual summer cooling trend lasting until the 1800s.
Had greenhouse gases been allowed to follow their natural tendency to de-cline, the resulting cooling would have augmented the one being driven by the drop in summer radiation, and this plan-et would have become considerably cooler than it is now. To explore this possibility, I joined with Stephen J. Vavrus and John E. Kutzbach of the Uni-versity of Wisconsin–Madison to use a climate model to predict modern-day temperature in the absence of all hu-man-generated greenhouse gases. The model simulates the average state of the earth’s climate—including temperature and precipitation—in response to differ-ent initial conditions.
For our experiment, we reduced the greenhouse gas levels in the atmosphere to the values they would have reached today without early farming or indus-trial emissions. The resulting simulation showed that our planet would be almost two degrees C cooler than it is now—a signifi cant difference. In comparison, the global mean temperature at the last glacial maximum 20,000 years ago was only fi ve to six degrees C colder than it is today. In effect, current tempera-tures would be well on the way toward typical glacial temperatures had it not been for the greenhouse gas contribu-tions from early farming practices and later industrialization.
Human Disease and Global CoolingConcentrations of CO2 in the atmosphere have been climbing since about 8,000 years ago. During the past two millennia, however, that steady increase at times reversed direction, and the CO2 levels fell for decades or more. Scientists usually attribute such CO2 drops—and the accompanying dips in global temperature—to natural reductions in the sun’s energy output or to volcanic eruptions. These factors have been regarded as major drivers of climate change over decades or centuries, but for the CO2 patterns, such explanations fall short—which implies that an additional factor forced CO2 levels downward. Because I had already concluded that our human ancestors had caused the slow rise in CO2 for thousands of years by clearing forests for agriculture (see main article), this new fi nding made me wonder whether some kind of reversal of the ongoing clearance could explain the brief CO2 drops.
The most likely root cause turns out to be disease—the massive human mortality accompanying pandemics. Two severe outbreaks of bubonic plague, the single most devastating killer in human history, correlate well with large CO2 drops at approximately A.D. 540 and 1350 (graph). Plague fi rst erupted during the Roman era, with the most virulent pandemic, the Plague of Justinian, in A.D. 540 to 542. The infamous “Black Death” struck between 1347 and 1352, followed by lesser outbreaks for more than a century. Each of these pandemics killed some 25 to 40 percent of the population of Europe. An even worse catastrophe followed in the Americas after 1492, when Europeans introduced smallpox and a host of other diseases that killed around 50 million people, or about 90 percent of the pre-Columbian population. The American pandemic coincides with the largest CO2 drop of all, from 1550 to 1800.
Observers at the time noted that the massive mortality rates produced by these pandemics caused widespread abandonment of rural villages and farms, leaving untended farmland to revert to the wild. Ecologists have shown that forests will reoccupy abandoned land in just 50 years. Coupled with estimates of human population and the acreage cultivated by each farmer, calculations of forest regrowth in pandemic-stricken regions indicate that renewed forests could have sequestered enough carbon to reduce concentrations of CO2 in the atmosphere by the amounts observed. Global climate would have cooled as a result, until each pandemic passed and rebounding populations began cutting and burning forests anew. —W.F.R.
500 B.C. 0 500
275
280
285
290
Year1000 1500 2000
Smallpox and other Europeandiseases kill 90 percent of nativepopulation in the Americas
Middle Ages “Black Death” kills 25 to 40 percent of Europeans Long-term
deforestationtrend
Roman-era plague episodesculminate in deaths of 25 to 40 percent of Europeans
Ice core 1
Ice core 2
Carb
on D
ioxi
de (p
arts
per
mill
ion)
MOS T DR AMATIC DROP S in atmospheric CO2 concentrations during the past 2,000 years (as recorded in two Antarctic ice cores) occurred around the same periods that disease outbreaks were taking the greatest toll on human life (yellow bars).
LU
CY
RE
AD
ING
-IK
KA
ND
A
COPYRIGHT 2005 SCIENTIFIC AMERICAN, INC.
w w w. s c i a m . c o m S C I E N T I F I C A M E R I C A N 53
I had also initially proposed that new ice sheets might have begun to form in the far north if this natural cooling had been allowed to proceed. Other re-searchers had shown previously that parts of far northeastern Canada might be ice covered today if the world were cooler by just 1.5 to two
degrees C—the
same amount of cooling that our exper-iment suggested has been offset by the greenhouse gas anomalies. The later modeling effort with my Wisconsin col-leagues showed that snow would now persist into late summer in two areas of northeastern Canada: Baffi n Island, just east of the mainland, and Labrador, far-ther south. Because any snow that sur-vives throughout the summer will accu-mulate in thicker piles year by year and eventually become glacial ice, these re-sults suggest that a new ice age would have begun in northeast Canada several millennia ago, at least on a small scale.
This conclusion is startlingly differ-ent from the traditional view that hu-man civilization blossomed within a pe-riod of warmth that nature provided. As I see it, nature would have cooled the earth’s climate, but our ancestors kept it warm by discovering agriculture.
Implications for the Futuret h e conclusion t h at humans prevented a cooling and arguably stopped the initial stage of a glacial cycle bears directly on a long-running dispute over what global climate has in store for us in the near future. Part of the reason that policymakers had trouble embrac-ing the initial predictions of global warming in the 1980s was that a num-ber of scientists had spent the previous decade telling everyone almost exactly the opposite—that an ice age was on its way. Based on the new confi rmation that orbital variations control the growth and decay of ice sheets, some scientists studying these longer-scale changes had reasonably concluded that the next ice age might be only a few hundred or at most a few thousand years away.
In subsequent years, however, inves-tigators found that greenhouse gas con-centrations were rising rapidly and that the earth’s climate was warming, at least
in part because of the gas increases. This evidence convinced most scientists that the relatively near-term future (the next century or two) would be dominated by global warming rather than by global cooling. This revised prediction, based on an improved understanding of the cli-mate system, led some policymakers to discount all forecasts—whether of glob-al warming or an impending ice age—as untrustworthy.
My fi ndings add a new wrinkle to each scenario. If anything, such fore-casts of an “impending” ice age were ac-tually understated: new ice sheets should have begun to grow several millennia ago. The ice failed to grow because hu-man-induced global warming actually began far earlier than previously thought—well before the industrial era.
In these kinds of hotly contested top-ics that touch on public policy, scientifi c results are often used for opposing ends. Global-warming skeptics could cite my
work as evidence that human-generated greenhouse gases played a benefi cial role for several thousand years by keeping the earth’s climate more hospitable than it would otherwise have been. Others might counter that if so few humans with relatively primitive technologies were able to alter the course of climate so signifi cantly, then we have reason to be concerned about the current rise of greenhouse gases to unparalleled con-centrations at unprecedented rates.
The rapid warming of the past cen-tury is probably destined to persist for at least 200 years, until the economically accessible fossil fuels become scarce. Once that happens, the earth’s climate should begin to cool gradually as the deep ocean slowly absorbs the pulse of excess CO2 from human activities. Whether global climate will cool enough to produce the long-overdue glaciation or remain warm enough to avoid that fate is impossible to predict.
Glaciationthreshold
Natural temperaturetrend
Today
Present10,000
Years Ago20,000
Years Ago0
I I II
Actualtrend
Natural start of nextglaciation in a world
absent of human activity
I
Greenhouse effectfrom human activities
Early agricultureRapid industrializationFuture activities
After fossil fuelsare depleted
a
b
M O R E T O E X P L O R EPlagues and Peoples. William McNeill. Doubleday, 1976.Ice Ages: Solving the Mystery. John Imbrie and Katherine Palmer Imbrie. Enslow, 1979.Guns, Germs, and Steel: The Fates of Human Societies. Jared Diamond. W. W. Norton, 1999. Earth’s Climate: Past and Future. William F. Ruddiman. W. H. Freeman, 2001.The Anthropogenic Greenhouse Era Began Thousands of Years Ago. William F. Ruddiman in Climatic Change, Vol. 61, No. 3, pages 261–293; 2003.Deforesting the Earth: From Prehistory to Global Crisis. Michael A. Williams. University of Chicago Press, 2003. Plows, Plagues, and Petroleum: How Humans Took Control of Climate. William F. Ruddiman. Princeton University Press (in press).
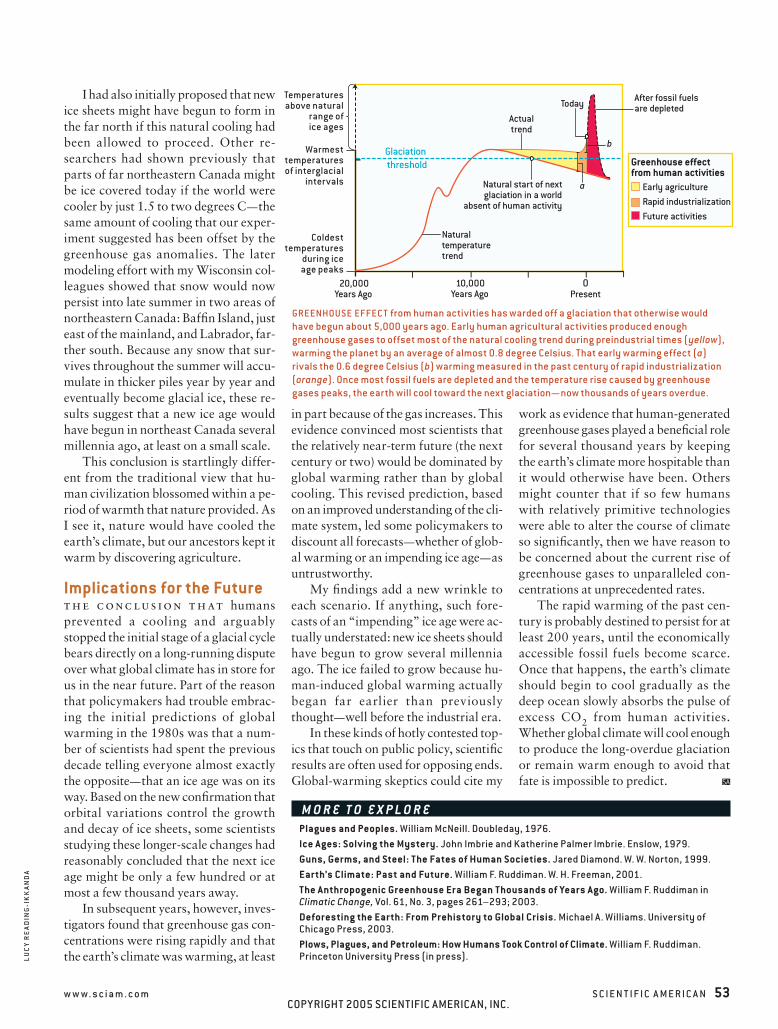
GREENHOUSE EFFEC T from human activities has warded off a glaciation that otherwise would have begun about 5,000 years ago. Early human agricultural activities produced enough greenhouse gases to offset most of the natural cooling trend during preindustrial times (yellow), warming the planet by an average of almost 0.8 degree Celsius. That early warming effect (a) rivals the 0.6 degree Celsius (b) warming measured in the past century of rapid industrialization (orange). Once most fossil fuels are depleted and the temperature rise caused by greenhouse gases peaks, the earth will cool toward the next glaciation— now thousands of years overdue.
LU
CY
RE
AD
ING
-IK
KA
ND
A
Temperatures above natural
range of ice ages
Warmest temperatures of interglacial
intervals
Coldest temperatures
during ice age peaks
COPYRIGHT 2005 SCIENTIFIC AMERICAN, INC.
