firm exports, foreign owner- ship, and the global
TRANSCRIPT
8808 2020 December 2020
Firm Exports, Foreign Owner-ship, and the Global Financial Crisis Peter Eppinger, Marcel Smolka
Impressum:
CESifo Working Papers ISSN 2364-1428 (electronic version) Publisher and distributor: Munich Society for the Promotion of Economic Research - CESifo GmbH The international platform of Ludwigs-Maximilians University’s Center for Economic Studies and the ifo Institute Poschingerstr. 5, 81679 Munich, Germany Telephone +49 (0)89 2180-2740, Telefax +49 (0)89 2180-17845, email [email protected] Editor: Clemens Fuest https://www.cesifo.org/en/wp An electronic version of the paper may be downloaded · from the SSRN website: www.SSRN.com · from the RePEc website: www.RePEc.org · from the CESifo website: https://www.cesifo.org/en/wp
CESifo Working Paper No. 8808
Firm Exports, Foreign Ownership, and the Global Financial Crisis
Abstract The exceptional export performance of foreign-owned firms is a well-established stylized fact, but the underlying mechanism is not yet fully understood. In this paper, we provide theory and empirical evidence demonstrating that this fact can be explained by ownership differences in access to finance. We develop a theoretical model of international trade featuring firm heterogeneity and credit market frictions in which foreign-owned firms can access foreign capital markets via their multinational parents. The model predicts a financial advantage of foreign ownership for exporting that gains importance as credit conditions deteriorate. To empirically identify this effect, we estimate a triple differences model using rich micro data from Spain that exploits the global financial crisis as an exogenous shock to credit supply. We find that foreign ownership significantly stabilized firm exports when liquidity dried out in the crisis, in particular among small and financially vulnerable firms. JEL-Codes: F100, F140, F230, G010, G320. Keywords: firm exports, foreign ownership, multinational firms, financial frictions, financial crisis.
Peter Eppinger
University of Tübingen Nauklerstr. 50
Germany – 72074 Tübingen [email protected]
Marcel Smolka University of Flensburg
Munketoft 3b Germany – 24937 Flensburg
December 23, 2020 We thank the Volkswagen Foundation under the project “Europe’s Global Linkages and the Impact of the Financial Crisis” for financial support. We are grateful for helpful suggestions by Wilhelm Kohler, Hong Ma, and Claudia Steinwender, as well as for comments we received at various seminars, workshops, and conferences.
1 Introduction
Foreign-owned firms are exceptional exporters. They are more likely to export; they export largervolumes as well as larger shares of their output; they serve more export markets; and they ex-port more products than their domestically owned peers.1 The superior export performance offoreign-owned firms is interesting not only from an academic perspective, but it is also of centralimportance to policy makers, as it speaks to widespread arguments that inflows of foreign directinvestment (FDI) are an effective vehicle to promote exports and economic development.
One key challenge for economic research is to sort out correlation from causation. In principle,the export success of foreign-owned firms could be purely driven by a selection effect: multi-national enterprises (MNEs) may seek to acquire the most competitive and internationally activefirms. While selection does play a role in the data, it does not tell the whole story. Carefullydesigned empirical studies suggest that foreign-acquired firms improve their export performancefollowing acquisition compared to the counterfactual of non-acquisition (Guadalupe et al., 2012;Wang and Wang, 2015; Fons-Rosen et al., 2019).2 This poses another, even greater challenge forresearch: to identify the precise mechanism by which foreign ownership promotes exports. Thisissue has not been resolved to date, yet it is crucial for designing effective policies regulating tradeand FDI.
In this paper, we exploit rich micro data for Spain to overcome this challenge and identifyprecisely one channel through which foreign ownership promotes exports: access to finance. Toachieve this, we build on the seminal contribution by Manova (2013), who demonstrates that fi-nancial market imperfections severely restrict firm exports. To gain a theoretical perspective onthe role of foreign ownership in promoting exports, we introduce sharp ownership differences inaccess to finance into the Manova (2013) framework. Specifically, we assume that foreign-ownedfirms can tap into additional funds via internal capital markets within multinationals, as shown byDesai et al. (2004) and Egger et al. (2014). This implies a financial advantage of foreign ownershipthat may rationalize their superior export performance compared to domestically owned firms. Inthe model, a credit supply shock causes a drop in firm-level exports, but this drop is mitigatedamong foreign-owned firms due to their financial advantage. Moreover, our model predicts thatthis differential effect on exports is larger among financially vulnerable firms that require financingfor a larger share of their trade costs.
Our empirical analysis leverages the global financial crisis of 2008/09 as a major exogenous
1These facts have been established in micro data from many different countries, including Indonesia (Arnold andJavorcik, 2009), Germany (Raff and Wagner, 2014), China (Manova et al., 2015), as well as 30 lower and middleincome countries (Boddin et al., 2017).
2In a similar vein, foreign-divested firms (i.e., firms switching from foreign to domestic ownership) display a poorerexport performance compared to the counterfactual of non-divestment (Javorcik and Poelhekke, 2017).
1
shock to credit market conditions. This crisis was not reasonably foreseeable and beyond thecontrol of individual firms in Spain. In a first step, we estimate the differential impact of thecrisis on exports across foreign and domestically owned firms—the ownership differential—usinga difference-in-differences (DiD) model. To identify the crisis impact on exports beyond its effecton production, we focus on the export share (defined as exports over total sales) as our mainoutcome variable. In a second step, we pin down the credit channel by allowing the ownershipdifferential to vary by the pre-crisis financial vulnerability of firms. More precisely, we proposea triple differences (DiDiD) identification strategy, motivated by our theoretical model, whichexploits variation along three margins: the ownership structure of firms (foreign vs. domestic), thetiming of the credit supply shock in the financial crisis, and the degree of financial vulnerabilityacross firms prior to the crisis. Intuitively, firms entering the crisis with higher degrees of financialvulnerability are hit more severely by deteriorating credit market conditions, so that we expect theexports of these firms to benefit relatively more from the financial advantage of foreign ownership.To mitigate the influence of confounding factors, we control for firm-specific fixed effects as wellas arbitrary industry-specific shocks over time, and we combine our estimates with a propensityscore reweighting approach that controls for selection into foreign ownership based on past firmcharacteristics (akin to Guadalupe et al., 2012; Garicano and Steinwender, 2016).
In our analysis, we exploit panel data from the Encuesta Sobre Estrategias Empresariales(ESEE), which covers a representative sample of manufacturing firms in Spain over the years2005–2012. The ESEE data set combines a unique set of firm-level information that makes it ide-ally suited for our analysis. It includes detailed information, not only on the ownership structureof firms as well as the volume of exports and domestic sales, but also on the financial situation offirms, including debt levels (by maturity) and interest rates (on different debt components). Thisallows us to construct a precise measure of firms’ financial vulnerability, viz. the debt service-to-sales ratio, where debt service is the sum of debt repayments and interest payments. Usingthis measure, we can pinpoint the financial advantage of foreign ownership. A rare feature of thedata set is that it contains specific information on whether firms used the distribution channels oftheir foreign parents to access export markets. This is an interesting variable in the context of ouranalysis, as this mode of exporting could benefit firms in the form of lower trade costs and financ-ing needs. This suggests potential interactions with the financial channel of foreign ownership inpromoting exports, which we are able to investigate with the ESEE data.
We begin our empirical analysis by showing in the ESEE data that foreign-owned firms are,indeed, exceptional exporters also in Spain. We find that the share of exports in total sales is onaverage more than three times as large for foreign-owned (37%) compared to domestically ownedfirms (11%). A significant difference of 6 percentage points prevails even after controlling forindustry composition, firm size, or whether the firm mainly produces intermediates or final goods.
2
Similar sharp differences exist both on the extensive and on intensive margin of firm exports. Mostnotably, these differences widened substantially in the financial crisis. Taking a close look atfirms’ financial conditions, we find sharp ownership differences in the raw data: While the averagedebt service-to-sales ratios were almost identical across firms in domestic and foreign ownershipbefore the crisis, financial vulnerability increased dramatically among domestically owned firmsafter 2008. By contrast, foreign-owned firms were able to issue relatively more new debt at lowerinterest rates, and the composition of this new debt suggests that this was at least partly driven byinternal borrowing from the firm’s foreign parent. In a nutshell, our descriptive analyses show thatboth the export performance and the financial situation of foreign-owned firms improved relativeto their domestically owned peers over the crisis years.
Our econometric analysis starts out by estimating the ownership differential in our DiD model.We find that, as the credit crunch hit Spain in 2009, foreign-owned firms significantly increasedtheir export shares compared to domestically owned firms. This finding of a positive ownershipdifferential is consistent with the presumption that exports depend more heavily on finance thandomestic sales, as found e.g. by Minetti and Zhu (2011). Importantly, the ownership differentialpersisted over the subsequent crisis years, while we cannot reject a common trend in the exportshares of both ownership groups over the pre-crisis years. We further show that the differentialeffect is concentrated in small firms, which are more likely to be credit constrained (see Gertlerand Gilchrist, 1994; Guiso et al., 2004; Beck et al., 2008), and absent in large firms. These resultsconstitute first indicative evidence of the credit channel described by our model.
We then scrutinize the credit channel further in DiDiD estimations, which reveal that the owner-ship differential is increasing in firms’ financial vulnerability (measured just before the crisis).This finding implies that financial frictions have played a decisive role for the superior exportperformance of foreign-owned firms in the crisis. Among financially vulnerable firms, the crisissubstantially magnified the positive effect of foreign ownership on exports. What is more, theseeffects are again much more pronounced among small firms, for which other sources of financeare likely harder to access. The economic magnitude of the estimates is striking: The effect offoreign ownership on export shares in 2009 was larger by 5.4 percentage points for firms at the75th percentile of financial vulnerability compared to those at the 25th percentile in the sample ofsmall firms. This differential effect is more than half the size of the mean export share of 10.6%in this sample. Our findings thus provide strong support for the hypothesis that MNEs grant theiraffiliates a substantial financial advantage, which served to stabilize firm exports in the crisis.
Building on our main finding, we distinguish between the DiDiD effects on export marketentry and exit (i.e., the extensive margin of exports) and on changes in the volume of export sales(i.e., the intensive margin). We find no significant difference in the crisis impact on the extensivemargin of exports across firms with a different ownership status or degree of financial vulnerability.
3
Instead, our main findings are mainly driven by the intensive margin. This result is in line withmicro evidence from several countries showing that the global financial crisis reduced firm exportspredominantly at the intensive margin (see Behrens et al., 2013; Bricongne et al., 2012; Eppingeret al., 2018; Paravisini et al., 2014).
Is the ownership differential in export performance due to specific features of foreign owner-ship, or due to the general benefit of belonging to a large group of firms? We shed some light onthis question by comparing the role of foreign ownership to the role of belonging to a corporategroup (whether domestic or foreign). The evidence points to a differential effect of a corporategroup that is around half the size of the foreign ownership effect, and it does not seem to interactsignificantly with financial vulnerability. What seemed to be crucial for crisis exports was thereforethe foreignness of the parent firm, which is a distinguishing feature of FDI.
In a final set of analyses, we investigate the role of foreign ownership in facilitating exportmarket access. Exploiting direct information on this market access channel in our data set gen-erates valuable new insights: Access to finance and access to distribution networks seem to besubstitutive rather than complementary benefits of foreign ownership. In general, firms using theirparents’ distribution networks at the onset of the crisis did not fare better in the crisis than otherforeign-owned firms. However, among financially vulnerable firms, the export-promoting effectof foreign ownership was substantially reduced for those firms that were already relying on theirparents’ distribution networks. This is consistent with the presumption that access to MNEs’ dis-tribution networks lowers trade costs and hence the financial burden on firms, which consequentlyreduces the value of internal capital markets for these firms. In line with this interpretation, firmsthat started using their foreign parent’s distribution networks over the crisis years showed a betterexport performance, and this difference is greater among financially vulnerable firms. These find-ings point to two distinct benefits of foreign ownership – funding via internal capital markets andfacilitating market access – but the use of the latter diminishes the value of the former.
Our paper contributes to two strands of the literature at the intersection of corporate financeand international economics (see Foley and Manova, 2015, for an overview). The first is theliterature on the nexus between international trade and financial frictions. This literature arguesthat export sales are inherently more dependent on external finance than domestic sales due toadditional costs of exporting, longer shipping times, and greater risk involved in internationaltransactions. Therefore, financial development can be a source of comparative advantage (Kletzerand Bardhan, 1987; Beck, 2002; Egger and Keuschnigg, 2017). To study the impact of financialfrictions across heterogeneous firms, theoretical work by Manova (2013), Feenstra et al. (2014),and Chaney (2016) has extended the Melitz (2003) model with capital market imperfections.3
3While the bulk of the literature focuses on the case in which the exporting firm needs to raise finance, Antras andFoley (2015) and Schmidt-Eisenlohr (2013) explicitly study different trade finance regimes.
4
These models predict that financial frictions may reduce aggregate exports through adverse effectson three different margins: selection of firms into production, selection of firms into exporting,and the quantity of exports. Several empirical studies have confirmed these key predictions (mostprominently Manova, 2013).4 Focusing on the 2008/09 financial crisis, several contributions showthat financial frictions played an important role in the great trade collapse (Auboin, 2009; Ahn etal., 2011; Chor and Manova, 2012).5 We contribute to this literature by providing evidence thatfinancial frictions constrain firms more strongly in exports than in domestic sales, and that foreignownership can be crucial to alleviate the detrimental effect of a financial crisis on firm exports.
The second strand of the literature closely related to our work focuses on MNEs and corpo-rate finance. Desai et al. (2004) demonstrate how foreign affiliates of U.S. multinationals accessinternal capital markets to circumvent financial frictions in external capital markets. Consistentwith this finding, Desai et al. (2008) show that foreign-owned firms intensify their activities in cur-rency crises and outperform domestically owned firms in terms of sales growth. Alfaro and Chen(2012) investigate the benefits of foreign ownership in the global financial crisis using a worldwidepanel of establishments. They find that foreign-owned plants fared significantly better in terms ofsales growth at the time of the credit crunch. This effect is larger in sectors with stronger finan-cial linkages or higher financial dependence and it is very weak in the pre-crisis years. Garicanoand Steinwender (2016) investigate firms’ investment behavior in the ESEE data set. They showthat firms decreased their investments during the crisis, in particular long-term ones, if and onlyif they were in domestic ownership. All of these findings support the view that foreign ownershipimproves the crisis resilience of firms’ real activities by alleviating financial constraints.6 We com-plement this literature with a detailed analysis of MNEs’ role in mitigating the impact of the globalfinancial crisis on firm exports, a dimension of firm performance that is particularly sensitive tofinancial conditions.
Most intimately related to our work is the research by Manova et al. (2015), which connectsthe aforementioned two strands of the literature. The authors find that foreign-owned firms inChina account for disproportionate shares of exports in finance-intensive industries. This special-ization pattern is consistent with the idea that foreign-owned firms enjoy a comparative advantage
4The empirical literature shows that improved financial market conditions due to financial development (Beck,2002; Berman and Hericourt, 2010) or equity market liberalizations (Manova, 2008) boost exports. Muuls (2015)provides evidence on the nexus between credit constrains and the margins of trade from linked Belgian micro data.See Greenaway et al. (2007) for evidence on the converse result that exporting can improve financial health. Recently,Minetti et al. (2018) have shown that credit-rationed firms in Italy are more likely to participate in international supplychains.
5Amiti and Weinstein (2011, for Japan) and Paravisini et al. (2014, for Peru) have made further progress towardsidentifying a causal effect of financial crises on trade by linking micro-level trade data with bank data, and they confirmthat financial frictions impede trade.
6As a notable exception, Alvarez and Gorg (2007) find no stabilizing effect of foreign ownership for the Chileancrisis in the late 1990s.
5
in finance-intensive industries due to internal capital markets within MNEs.7 Manova et al. (2015)identify the effect of credit constraints from variation in external financial dependence across in-dustries within multi-product firms. Our approach adds to this by exploiting the exogenous creditshock in the financial crisis in combination with a firm-specific, pre-determined measure of fi-nancial vulnerability. This identification strategy allow us to establish a clear link between creditsupply, financial vulnerability, and foreign ownership in determining firm-level exports.8 In addi-tion, since we have information on firms’ total sales, we can show that exports responded morestrongly to the credit shock than domestic sales.
The remainder of this paper is organized as follows. Section 2 develops a theoretical model oftrade finance and foreign ownership, and derives predictions regarding the impact of the financialcrisis on firm exports. Section 3 describes our firm-level data and offers descriptive evidence.In Section 4, we present our empirical strategy and estimation results. Section 5 offers someconclusions.
2 A simple theory of trade finance and foreign ownership
In this section, we present a heterogeneous firms model of international trade with financial marketimperfections in the spirit of Manova (2013). To establish a close link between theory and empiri-cal analysis, we extend Manova (2013) by drawing a sharp line between firms in domestic versusforeign ownership: while domestically owned firms must finance their export activities throughdomestic banks, foreign-owned firms can access foreign capital markets through their parent ifneeded.
2.1 General setup
Consider a world of two countries.9 Consumers are homogenous and identical across countrieswith preferences given by a Cobb-Douglas aggregate over industries j:
U =∏
j
[∫
ω∈Ωj
qj(ω)σ−1σ dω
]θj σσ−1
,
7This is an endogenous outcome in Antras et al. (2009), who show how financial frictions shape the pattern offoreign direct investment (FDI) in theory and in firm-level data.
8In related work, Wang and Wang (2015) use Chinese data to exploit variation in ownership over time within firms.They benchmark the effects of foreign acquisitions against domestic acquisitions and show that foreign ownershipimproves firm-level financial health and export performance, in line with our main finding.
9We focus on the two-country case for simplicity. Extending the setup to a large number of countries is straight-forward. In anticipation of our empirical analysis, the two countries in our setup may be thought of as Spain and therest of the world. We neglect the country index where it is not essential to keep the notation simple.
6
where ω ∈ Ωj refers to a specific variety of industry j, σ > 1 is the constant elasticity of substi-tution (CES) between any two varieties, and θj ∈ (0, 1) is the consumer’s expenditure share onindustry j. Demand for each variety follows as
qj(ω) = pj(ω)−σθjY Pσ−1j , (1)
where Y is aggregate income, pj(ω) is the price of variety ω in industry j, and
Pj =[∫
ω∈Ωjpj(ω)1−σdω
] 11−σ
is the CES price index.Each industry is characterized by a continuum of heterogeneous firms in monopolistic compe-
tition. As in Melitz (2003), firms are identical ex ante and may choose to pay a sunk entry costequal to bjfE . Upon entry, each firm draws its productivity 1/a from a known distribution G(a)
with support [a, a] , a > a > 0. For a high enough productivity draw, the firm will start producing;otherwise it will exit immediately. Since a is specific to the firm and each firm produces a distinctvariety, we henceforth use a to index variety ω. The minimum unit-cost function is given by bja,where bj is the cost of a cost-minimizing input bundle.
To service a specific market, the firm has to incur fixed market-access costs and variable tradecosts. More precisely, fixed costs are equal to bjfX for exporting and bjfH for servicing the homemarket. We make the standard assumption that the fixed costs of market access, marketing, anddistribution are higher in the export market: fX > fH > 0. Variable costs of exporting take theusual iceberg form, such that τ > 1 units of the good need to be shipped in order for one unitto arrive in the other country. These assumptions imply the standard Melitz-type selection intoexporting.
2.2 Trade finance
As in Manova (2013), we relax the assumption of perfect capital markets that is implicit in Melitz(2003). We assume that firms must finance a share d(a) ∈ (0, 1) of all costs associated withexporting (production costs as well as fixed and variable trade costs) through an investor, while allother costs are financed internally. The parameter d(a) thus reflects a firm’s financial vulnerability,which will play a key role in our analysis. Since the availability of internal funds may differ acrossfirms, we assume that d(a) is firm specific. The investor will be repaid with exogenous probabilityλ ∈ (0, 1) due to frictions in the capital market. This notion of credit constraints is agnostic aboutthe underlying source of the financial friction, but simply invokes that credit will not be repaid withcertainty if capital markets function imperfectly.
We first consider the profit-maximization problem of a domestically owned firm. Such a firmmust, by assumption, borrow the required funds from a domestic bank. We assume that there is alarge number of domestic banks in perfect competition and that all parties are risk neutral. As a
7
result, the firm maximizes its expected profits from exporting:
ΠX(a) = pj(a)qj(a)− [1− d(a)] [qj(a)τbja+ fXbj]− λR(a) (2)
subject to R(a) ≤ pj(a)qj(a)− [1− d(a)] [qj(a)τbja+ fXbj] , (FC)
and λR(a) ≥ (1 + rD) [d(a) (qj(a)τbja+ fXbj)] , (PC-D)
and subject to demand from equation (1).10 The financial constraint (FC) states that the firm can-not repay more than its total export revenue. The participation constraint of the domestic in-vestor (PC-D) states that her net return (expected repayment minus credit) must exceed her outsideoption. The investor’s outside option reflects the returns from investing the amount of credit (theterm in brackets) into an alternative project at the real interest rate rD > 0 that prevails in thedomestic capital market.
Since the capital market is perfectly competitive, investors are paid their outside option andequation (PC-D) holds with equality in equilibrium. We can plug this condition and demand fromequation (1) into equation (2). Solving this maximization problem for highly productive firms thatface no binding financial constraint yields optimal prices p∗j(a) and quantities q∗j (a):
p∗j(a) =σ
σ − 1[1− d(a) + (1 + rD)d(a)] τbja and (3)
q∗j (a) =
(σ
σ − 1[1− d(a) + (1 + rD)d(a)] τbja
)−σθjY P
σ−1j . (4)
Some domestically owned firms have a high enough productivity to become exporters, but facea binding financial constraint, so they cannot export at first-best levels. These constrained exportershave productivity levels below the threshold 1/aDH , which is obtained by plugging the optimal priceand quantity along with the binding participation constraint into the binding financial constraint:
1
aDH=
[[1− d(a) + (1 + rD)d(a)/λ]
(σσ−1
[1 + rDd(a)])σ
σσ−1
[1 + rDd(a)]− [1− d(a)]− (1 + rD)d(a)/λ
] 1σ−1 (fXbσj
θjY
) 1σ−1 τ
Pj. (5)
Firms with productivity levels just below this threshold will export a smaller quantity (at ahigher price) than in the first-best case, in order to lower the repayment required by the investor.The optimal prices p∗∗j (a) for constrained exporters are determined by the binding financial con-straint and can be obtained by plugging equation (1) and equation (PC-D) into equation (FC), all
10We depart from the program formulated by Manova (2013, Web Appendix, equation 2) in two ways. First, weabstract from collateral since it plays no role in our empirical analysis. Allowing for firms to pledge a certain share ofthe fixed entry costs as collateral is straightforward, but does not change our theoretical predictions. Second, we allowfor a non-zero outside option of the investor, such that the interest rate can play a relevant role in the model.
8
holding with equality:
p∗∗j (a)1−σ − p∗∗j (a)−στbja [1− d(a) + (1 + rD)d(a)/λ] =fXbj [1− d(a) + (1 + rD)d(a)/λ]
θjY Pσ−1j
.
(6)Appendix A.1 shows that the left-hand side of equation (6) is increasing in the optimal price,while the right-hand side is constant. Hence, equation (6) implicitly pins down the optimal pricesp∗∗j (a) for constrained exporters, which are negatively related to the quantity sold (via the demandschedule in equation (1)) and the associated export revenues.
Another productivity threshold for domestically owned firms, 1/aDL , separates exporters fromfirms serving only the domestic market. The highest price that constrained exporters may want toset is
pL(a) =σ
σ − 1τbja [1− d(a) + (1 + rD)d(a)/λ] , (7)
which maximizes the left-hand side of equation (6). Firms with productivity levels below 1/aDLcannot compensate the investor even if they set this price and offer all revenues as a repayment tothe investor. Formally, we obtain 1/aDL by plugging pL(a) from equation (7) back into equation (6):
1
aDL=
σ
σ − 1[1− d(a) + (1 + rD)d(a)/λ]
σσ−1
(σfXb
σj
θjY
) 1σ−1 τ
Pj. (8)
Our assumptions imply that domestically owned firms sort into different activities based ontheir productivity levels. This is illustrated in Figure 1 (above the horizontal line). While the leastproductive firms below the entry cut-off 1/aE exit the market immediately, those with productivitylevels equal to 1/a ∈ [1/aE, 1/a
DL ) remain active, but serve only the domestic market. Constrained
exporters with productivity levels equal to 1/a ∈ [1/aDL , 1/aDH) serve both the domestic and the
export market, but they export lower quantities at higher prices than in the first-best case. Only themost productive firms export at first-best levels.
2.3 Foreign ownership and internal capital markets
We now proceed by adding foreign-owned firms to the picture. Our focus is exclusively on thefinancial aspects of foreign ownership. In particular, we assume that foreign-owned firms haveaccess to the foreign capital market through their foreign parent (at zero cost). This assumption ismotivated by ample evidence showing that MNEs use internal capital markets to finance the activ-ities of their subsidiaries (see e.g. Desai et al., 2004; Egger et al., 2014).11 For domestically ownedfirms, in contrast, we make the simplifying assumption that the cost of finding and contracting a
11For a formal treatment of the choice between internal and external capital markets, see Gertner et al. (1994).
9
suitable investor abroad is prohibitively high.To keep matters simple, all differences between the domestic and foreign capital markets are
summarized by the real interest rate differential. We denote the real interest rate in the foreign(or world) capital market by rF . In the context of our analysis, it can be interpreted as the lowestinterest rate at which the multinational parent can borrow foreign capital and lend to its affiliate inthe domestic economy.
The optimization problem of a foreign-owned firm is identical to that of a domestically ownedfirm except for that fact the foreign-owned firm must additionally decide between domestic and for-eign capital to finance its export activities. Depending on this choice, the firm faces either (PC-D)or the participation constraint of the foreign investor:
λR(a) ≥ (1 + rF ) [d(a) (qj(a)τbja+ fXbj)] . (PC-F)
It is obvious from comparing the two participation constraints (PC-D) and (PC-F) that foreign-owned firms will opt for foreign capital if rF < rD, and for domestic capital if rF > rD.12 Whilein principle both cases are possible, the case of rF < rD seems to be the more plausible one dueto the greater liquidity of the world capital market as well as the size of MNEs, which allows themto raise funds directly in the credit market by issuing corporate bonds and to diversify financialactivities across countries. We will focus below on this interesting case since it implies, consistentwith our empirical analysis, that foreign-owned firms enjoy a financial advantage.13
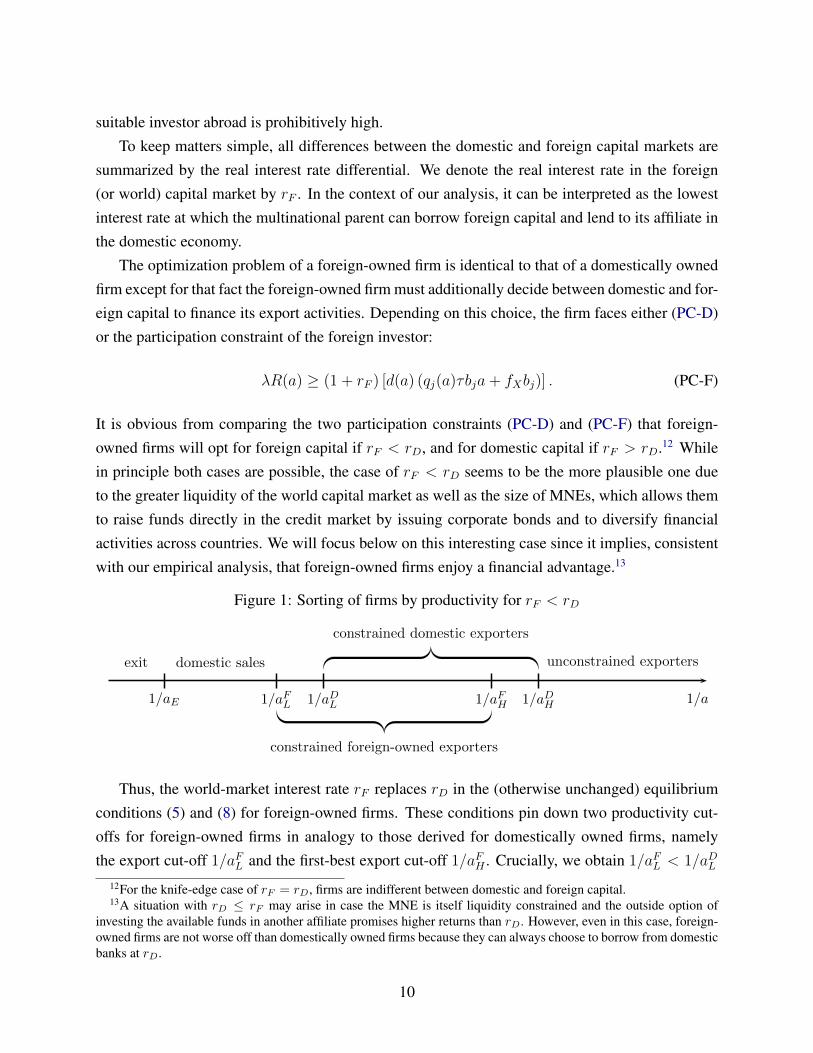
Figure 1: Sorting of firms by productivity for rF < rD
Figure 1: Sorting pattern of firms by productivity for rF < rD
1/aE 1/aFL 1/aDL 1/aFH 1/aDH 1/a
exit domestic sales
constrained foreign-owned exporters
constrained domestic exporters
unconstrained exporters
2.4 Comparative statics regarding the impact of the financial crisis
We are interested in how the credit crunch in the financial crisis affected the export intensities
(exports/sales) of domestically owned relative to foreign-owned firms. In our framework, the credit
crunch may have an impact on firm behavior via two channels. It may be modeled as (i) a negative
shock to the efficiency of the capital market, reflected in the repayment probability λ, or (ii) a
positive shock to the interest rates rD and rF (or the interest rate differential rD − rF ). We choose
to focus on the first case in the main text and consider the second case in Appendix A.2. This
choice is motivated by the idea that the financial crisis substantially increased the uncertainty of
loan repayments, beyond the uncertainty associated with firms’ fundamental characteristics. Around
the peak of the financial crisis, marked by the bankruptcy of Lehman Brothers in September 2008,
even loan repayments by major financial institutions were perceived as uncertain, which brought
the interbank lending market to the verge of collapse. We view the deterioration of capital market
efficiency reflected in the drop in λ as a temporary but global shock, which is the same for domestic
and foreign financing.
We already know from the above analysis that firms of ownership type f ∈ D,F with pro-
ductivity levels below 1/afL will not export, and those with very high productivity levels above the
cut-off 1/afH are not credit constrained and hence export at first-best levels. Note that our model
predicts that the drop in λ will shift these cut-offs up and induces some firms to change their export
status. However, it turns out that these effects of the financial crisis on export market entry and
exit, which may be called the extensive margin of exports, turn out to be small and insignificant
empirically in Spain (see Section ?? and Eppinger et al., forthcoming). Hence, this discussion con-
centrates on analyzing the export intensities of the most interesting firms with productivity levels
1/a in the critical range[1/aDL (λcrisis), 1/a
FH(λinitial)
), which are constrained exporters both before
and after the shock. While not studied in detail here, the effects at the extensive margin generally
work in the same direction as those on the intensive margin. They can be thought of as reinforcing
the adverse effect of the financial crisis on total exports and the differential effect on foreign-owned
compared to domestically owned firms.
In the interesting case of rF < rD, all foreign-owned exporting firms choose foreign financing
both before and after the shock. Equation (6) delivers an implicit solution for p∗∗j (a) for constrained
11
Thus, the world-market interest rate rF replaces rD in the (otherwise unchanged) equilibriumconditions (5) and (8) for foreign-owned firms. These conditions pin down two productivity cut-offs for foreign-owned firms in analogy to those derived for domestically owned firms, namelythe export cut-off 1/aFL and the first-best export cut-off 1/aFH . Crucially, we obtain 1/aFL < 1/aDL
12For the knife-edge case of rF = rD, firms are indifferent between domestic and foreign capital.13A situation with rD ≤ rF may arise in case the MNE is itself liquidity constrained and the outside option of
investing the available funds in another affiliate promises higher returns than rD. However, even in this case, foreign-owned firms are not worse off than domestically owned firms because they can always choose to borrow from domesticbanks at rD.
10
and 1/aFH < 1/aDH , so the two cut-offs for foreign-owned firms lie strictly to the left of the cor-responding cut-offs for domestically owned firms, as illustrated in Figure 1. This sorting patternarises because the cut-offs are strictly increasing in the interest rate. Since foreign-owned firmshave access to cheaper credit, they are not only more likely to export, but they are also more likelyto export first-best quantities.
2.4 Comparative statics regarding the impact of the financial crisis
We are interested in how the credit crunch in the financial crisis affected the export shares (exports/
sales) of domestically owned relative to foreign-owned firms. In our framework, the credit crunchcan impact firms via two channels. The first channel is an efficiency loss in the capital market,reflected in a drop in the repayment probability λ. The second channel is an increase in credit costsmodelled by a rise in the interest rates rD and rF (or the interest rate differential rD − rF ). Wechoose to focus on the first case in the main text and consider the second case in Appendix A.2.14
We know from the analysis above that firms of ownership type f ∈ D,F with productivitylevels below 1/afL will not export at all, and those with very high productivity levels above the cut-off 1/afH are not credit constrained and hence export at first-best levels. The model predicts thatthe drop in λ will raise these cut-offs and induce some firms to exit the export market. Empiricallyspeaking, these effects of the financial crisis on export market entry and exit turn out to be small andinsignificant in Spain (see Section 4.3 and Eppinger et al., 2018). Hence, our discussion focuseson those firms that are constrained exporters before and after the credit shock. These are the firmswith productivity levels in the critical interval
[1/aDL (λcrisis), 1/a
FH(λinitial)
).15
Since rF < rD, all foreign-owned exporters choose foreign financing both before and after theshock. Equation (6) delivers an implicit solution for p∗∗j (a) for constrained exporters dependingon their ownership type, which determines the interest rate they are facing rf , f ∈ D,F, anddepending on their internal funds d(a). It allows us to derive the effect of a change in λ on pricesp∗∗j (a) conditional on these characteristics. Comparative statics for export quantities q∗∗j (a) and ex-port revenues p∗∗j (a)q∗∗j (a) follow from this, as they are inversely related to p∗∗j (a) via the demandschedule from equation (1).
These considerations imply that a deterioration in credit market efficiency λ reduces the exportrevenues of all constrained exporters. Since domestic sales are financed internally and remain un-
14The financial crisis substantially increased the uncertainty of loan repayments, beyond the uncertainty associatedwith firms’ fundamental characteristics. Around the peak of the financial crisis, marked by the bankruptcy of LehmanBrothers in September 2008, even loan repayments by major financial institutions were perceived as uncertain, whichbrought the interbank lending market to the verge of collapse. We view the deterioration of capital market efficiencyreflected in the drop in λ as a temporary but global shock.
15The effects operating through export market entry and exit generally work in the same direction as the ones wefocus on here. They can be thought of as reinforcing the adverse effect of the financial crisis on total exports and itsdifferential effect across foreign and domestically owned firms.
11
affected by changes in λ, this translates directly into a reduction of firms’ export shares. Crucially,the effect is larger for domestically owned firms, since they face a higher interest rate rD. Intu-itively, as credit market frictions worsen, the financial advantage of foreign ownership becomesmore important. By a similar logic, the differential effect will be larger among more financiallyvulnerable firms that have less internal funds available (a high d(a)). We summarize these predic-tions in:
Proposition 1 Among constrained exporters, a deterioration in capital market efficiency decreases
the export shares of domestically owned firms relative to foreign-owned firms. This differential ef-
fect is larger among more financially vulnerable firms.
Proof. See Appendix A.1.
In Appendix A.2, we take a slightly different approach and model the financial crisis as acredit shock that raises the domestic real interest rate rD (rather than causing a drop in λ). Thepredictions from this scenario parallel those stated in Proposition 1. Interestingly, such a shockwould also reduce the export shares of unconstrained domestically owned exporters (i.e. domesticfirms with productivity levels beyond 1/aDH), while it would leave unconstrained foreign-ownedexporters unaffected.
3 Data and descriptives
In this section we introduce the data set used in our empirical analysis and provide descriptiveanalyses of firms’ export behavior and their financial situation.
3.1 Data source and key variables
Our data come from the Encuesta Sobre Estrategias Empresariales (ESEE), an annual survey ofabout 2,000 manufacturing firms in Spain.16 The sample we use for our analysis is a panel data setcovering the period 2005–2012, which allows us to track firms through the years before, during,and after the financial crisis. The initial sampling of the data in 1990 followed a two-tier structuredesigned to guarantee representativeness of the data for the manufacturing sector at large. Surveyquestionnaires were sent out to all ‘large’ firms (those with more than 200 employees), and toa subset of ‘small’ firms (those with 10 to 200 employees). Small firms were selected throughstratified, proportional, and systematic sampling with a random seed. Industry affiliation and sizeclass (defined by the number of employees) serve as stratification variables. Industries are defined
16The ESEE is managed by the Spanish foundation Sociedad Estatal de Participaciones Industriales (SEPI). Seehttp://www.fundacionsepi.es/esee/en/epresentacion.asp for more information.
12
by product categories at the 2-digit level of the NACE Rev. 2 industry classification.17 To mitigatesample attrition, SEPI incorporates refreshment samples, i.e., new firms are added to the survey asother firms exit. This is done in a way that preserves the representativeness of the data set overtime.
It is crucial for our analysis that the data set includes information about (i) the ownershipstructure of firms (foreign vs. domestic), (ii) their export and domestic sales volumes, and (iii) theirfinancial situation and debt structure. We define a firm as foreign owned if more than 50% of itsequity is held by foreigners, and as domestically owned otherwise.18 In the Spanish manufacturingsector at large, around 4% of firms are foreign owned over the period 2005–2012. This number isconsiderably higher for large firms (around 37%), and lower for small firms (around 3%), similarto other countries. In terms of employment, sales, and exports, foreign-owned firms are quiteimportant in Spain. Of the total number of effective working hours reported in 2012, 29% can beattributed to foreign-owned firms. For sales and exports the numbers are even higher, standing at46% and 60%, respectively.19 Table B.1 in Appendix B.1 provides summary statistics of all keyvariables used in the analysis.
3.2 Export behavior
Table 1 reveals a pronounced difference in the export performance between foreign and domesti-cally owned firms. We pool all observations across the years 2005–2012 and then sort them intogroups of firms depending on their ownership structure. Virtually all foreign-owned firms (95%)are exporters, as opposed to less than half of the domestically owned firms (46%). Among ex-porting firms, those in foreign ownership also export more, on average, than those in domesticownership. These differences in both export status and export volumes translate into a consider-ably higher export share (exports/sales) for foreign-owned compared to domestically owned firms(37% vs. 11%). In Appendix B.2, we show that a significant foreign ownership premium in the
17Until 2009, the survey defined industries according to the NACE Rev. 1 classification. We accommodate the twoclassifications based on concordance information provided by SEPI.
18A small number of firms is foreign owned by more than zero, but not more than 50%, and thus labeled as do-mestically owned. We have checked that these firms are not driving our results by excluding them from the sampleor by relabeling them as foreign owned. Our data set also includes information about unusual events such as mergers,acquisitions, and splitting up of firms. Such events can contaminate the analysis, as they often imply a drastic changenot only in the ownership structure of the firm, but also in the type and scale of its output and exports (e.g. because theacquired entity is a large exporter). Hence, whenever a firm experiences one of the above-mentioned events, we treatit as a different firm afterwards. This applies to 30 firms in our sample.
19These and other descriptive statistics provided below are computed by applying sampling weights to describethe Spanish manufacturing sector at large. The sampling weights reflect the inverse sampling probability of a firmrelative to the population of firms by industry-size stratum in 2010, based on data from the Spanish Instituto Nacionalde Estadıstica (INE). Throughout the paper, we express exports and sales in constant 2005 prices using firm-leveloutput price indexes from the ESEE data. Where firm-level price information is missing, we complement it withindustry-level price information from INE.
13
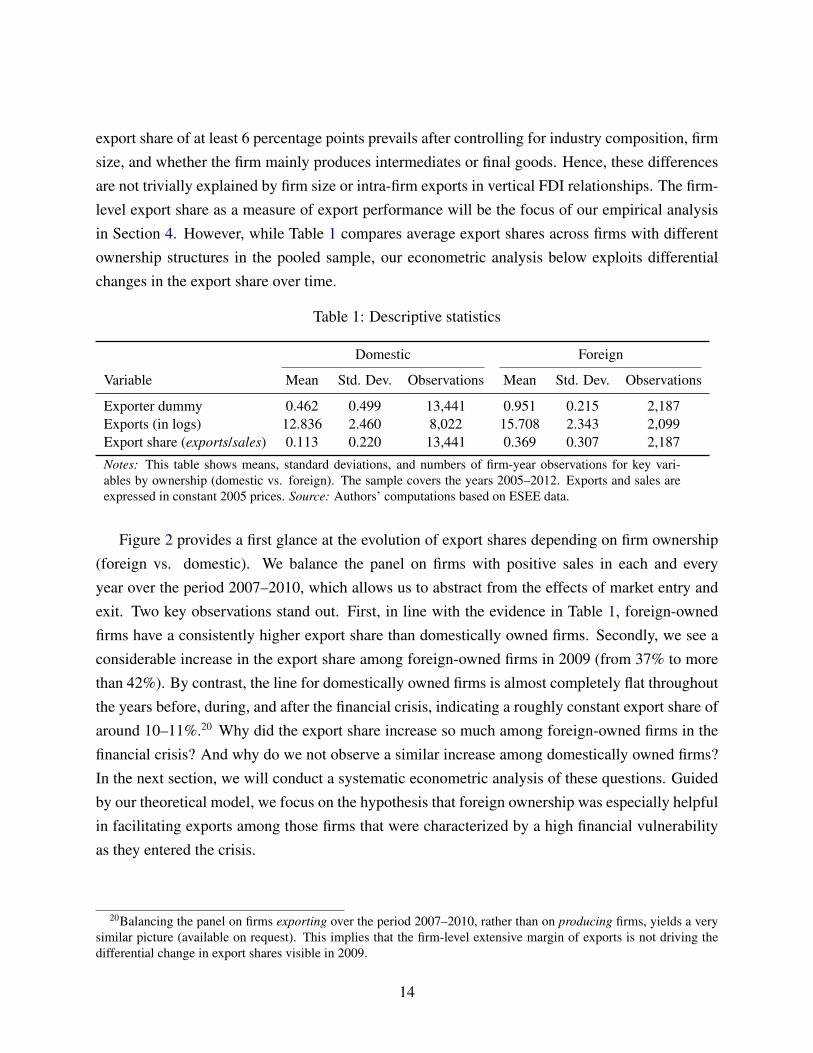
export share of at least 6 percentage points prevails after controlling for industry composition, firmsize, and whether the firm mainly produces intermediates or final goods. Hence, these differencesare not trivially explained by firm size or intra-firm exports in vertical FDI relationships. The firm-level export share as a measure of export performance will be the focus of our empirical analysisin Section 4. However, while Table 1 compares average export shares across firms with differentownership structures in the pooled sample, our econometric analysis below exploits differentialchanges in the export share over time.
Table 1: Descriptive statistics
Domestic Foreign
Variable Mean Std. Dev. Observations Mean Std. Dev. Observations
Exporter dummy 0.462 0.499 13,441 0.951 0.215 2,187Exports (in logs) 12.836 2.460 8,022 15.708 2.343 2,099Export share (exports/sales) 0.113 0.220 13,441 0.369 0.307 2,187
Notes: This table shows means, standard deviations, and numbers of firm-year observations for key vari-ables by ownership (domestic vs. foreign). The sample covers the years 2005–2012. Exports and sales areexpressed in constant 2005 prices. Source: Authors’ computations based on ESEE data.
Figure 2 provides a first glance at the evolution of export shares depending on firm ownership(foreign vs. domestic). We balance the panel on firms with positive sales in each and everyyear over the period 2007–2010, which allows us to abstract from the effects of market entry andexit. Two key observations stand out. First, in line with the evidence in Table 1, foreign-ownedfirms have a consistently higher export share than domestically owned firms. Secondly, we see aconsiderable increase in the export share among foreign-owned firms in 2009 (from 37% to morethan 42%). By contrast, the line for domestically owned firms is almost completely flat throughoutthe years before, during, and after the financial crisis, indicating a roughly constant export share ofaround 10–11%.20 Why did the export share increase so much among foreign-owned firms in thefinancial crisis? And why do we not observe a similar increase among domestically owned firms?In the next section, we will conduct a systematic econometric analysis of these questions. Guidedby our theoretical model, we focus on the hypothesis that foreign ownership was especially helpfulin facilitating exports among those firms that were characterized by a high financial vulnerabilityas they entered the crisis.
20Balancing the panel on firms exporting over the period 2007–2010, rather than on producing firms, yields a verysimilar picture (available on request). This implies that the firm-level extensive margin of exports is not driving thedifferential change in export shares visible in 2009.
14
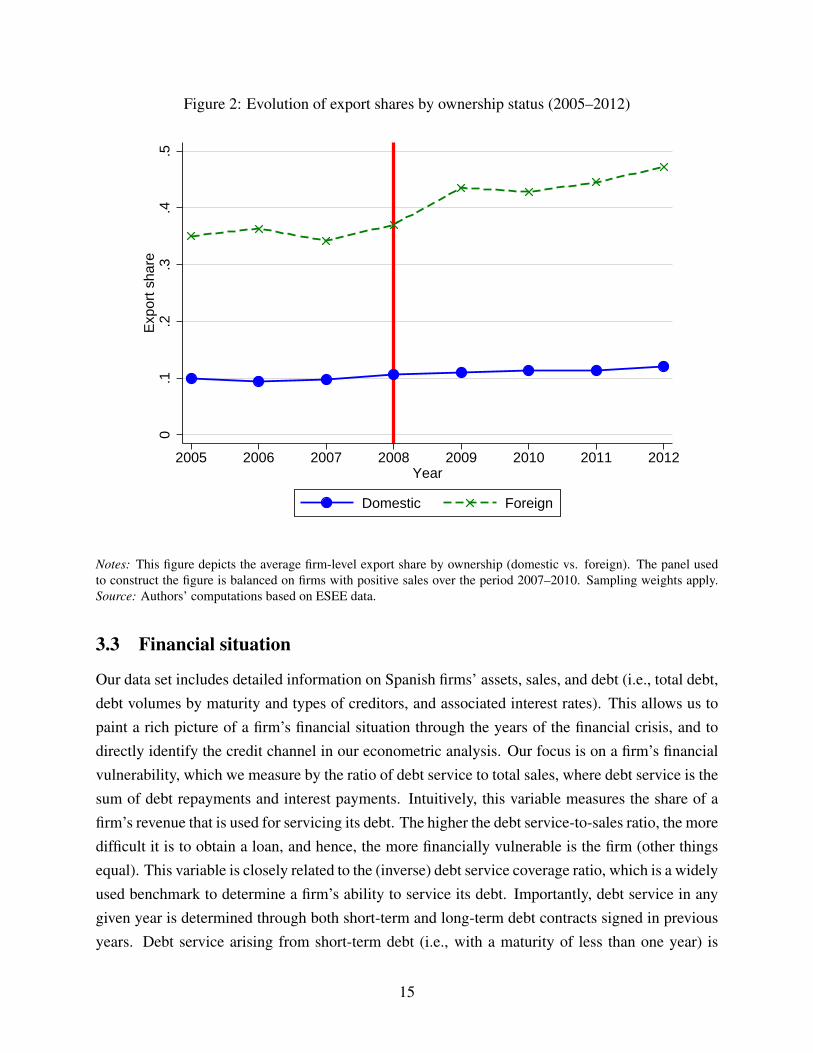
Figure 2: Evolution of export shares by ownership status (2005–2012)
0.1
.2.3
.4.5
Exp
ort s
hare
2005 2006 2007 2008 2009 2010 2011 2012Year
Domestic Foreign
Notes: This figure depicts the average firm-level export share by ownership (domestic vs. foreign). The panel usedto construct the figure is balanced on firms with positive sales over the period 2007–2010. Sampling weights apply.Source: Authors’ computations based on ESEE data.
3.3 Financial situation
Our data set includes detailed information on Spanish firms’ assets, sales, and debt (i.e., total debt,debt volumes by maturity and types of creditors, and associated interest rates). This allows us topaint a rich picture of a firm’s financial situation through the years of the financial crisis, and todirectly identify the credit channel in our econometric analysis. Our focus is on a firm’s financialvulnerability, which we measure by the ratio of debt service to total sales, where debt service is thesum of debt repayments and interest payments. Intuitively, this variable measures the share of afirm’s revenue that is used for servicing its debt. The higher the debt service-to-sales ratio, the moredifficult it is to obtain a loan, and hence, the more financially vulnerable is the firm (other thingsequal). This variable is closely related to the (inverse) debt service coverage ratio, which is a widelyused benchmark to determine a firm’s ability to service its debt. Importantly, debt service in anygiven year is determined through both short-term and long-term debt contracts signed in previousyears. Debt service arising from short-term debt (i.e., with a maturity of less than one year) is
15
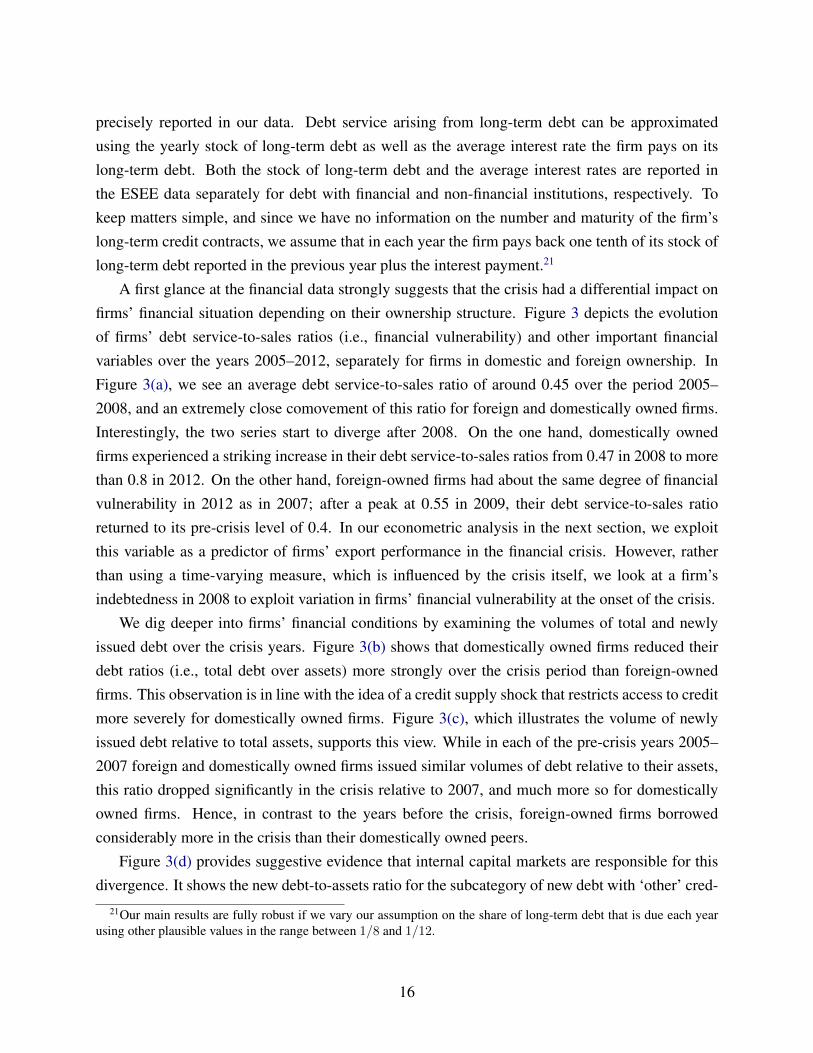
precisely reported in our data. Debt service arising from long-term debt can be approximatedusing the yearly stock of long-term debt as well as the average interest rate the firm pays on itslong-term debt. Both the stock of long-term debt and the average interest rates are reported inthe ESEE data separately for debt with financial and non-financial institutions, respectively. Tokeep matters simple, and since we have no information on the number and maturity of the firm’slong-term credit contracts, we assume that in each year the firm pays back one tenth of its stock oflong-term debt reported in the previous year plus the interest payment.21
A first glance at the financial data strongly suggests that the crisis had a differential impact onfirms’ financial situation depending on their ownership structure. Figure 3 depicts the evolutionof firms’ debt service-to-sales ratios (i.e., financial vulnerability) and other important financialvariables over the years 2005–2012, separately for firms in domestic and foreign ownership. InFigure 3(a), we see an average debt service-to-sales ratio of around 0.45 over the period 2005–2008, and an extremely close comovement of this ratio for foreign and domestically owned firms.Interestingly, the two series start to diverge after 2008. On the one hand, domestically ownedfirms experienced a striking increase in their debt service-to-sales ratios from 0.47 in 2008 to morethan 0.8 in 2012. On the other hand, foreign-owned firms had about the same degree of financialvulnerability in 2012 as in 2007; after a peak at 0.55 in 2009, their debt service-to-sales ratioreturned to its pre-crisis level of 0.4. In our econometric analysis in the next section, we exploitthis variable as a predictor of firms’ export performance in the financial crisis. However, ratherthan using a time-varying measure, which is influenced by the crisis itself, we look at a firm’sindebtedness in 2008 to exploit variation in firms’ financial vulnerability at the onset of the crisis.
We dig deeper into firms’ financial conditions by examining the volumes of total and newlyissued debt over the crisis years. Figure 3(b) shows that domestically owned firms reduced theirdebt ratios (i.e., total debt over assets) more strongly over the crisis period than foreign-ownedfirms. This observation is in line with the idea of a credit supply shock that restricts access to creditmore severely for domestically owned firms. Figure 3(c), which illustrates the volume of newlyissued debt relative to total assets, supports this view. While in each of the pre-crisis years 2005–2007 foreign and domestically owned firms issued similar volumes of debt relative to their assets,this ratio dropped significantly in the crisis relative to 2007, and much more so for domesticallyowned firms. Hence, in contrast to the years before the crisis, foreign-owned firms borrowedconsiderably more in the crisis than their domestically owned peers.
Figure 3(d) provides suggestive evidence that internal capital markets are responsible for thisdivergence. It shows the new debt-to-assets ratio for the subcategory of new debt with ‘other’ cred-
21Our main results are fully robust if we vary our assumption on the share of long-term debt that is due each yearusing other plausible values in the range between 1/8 and 1/12.
16
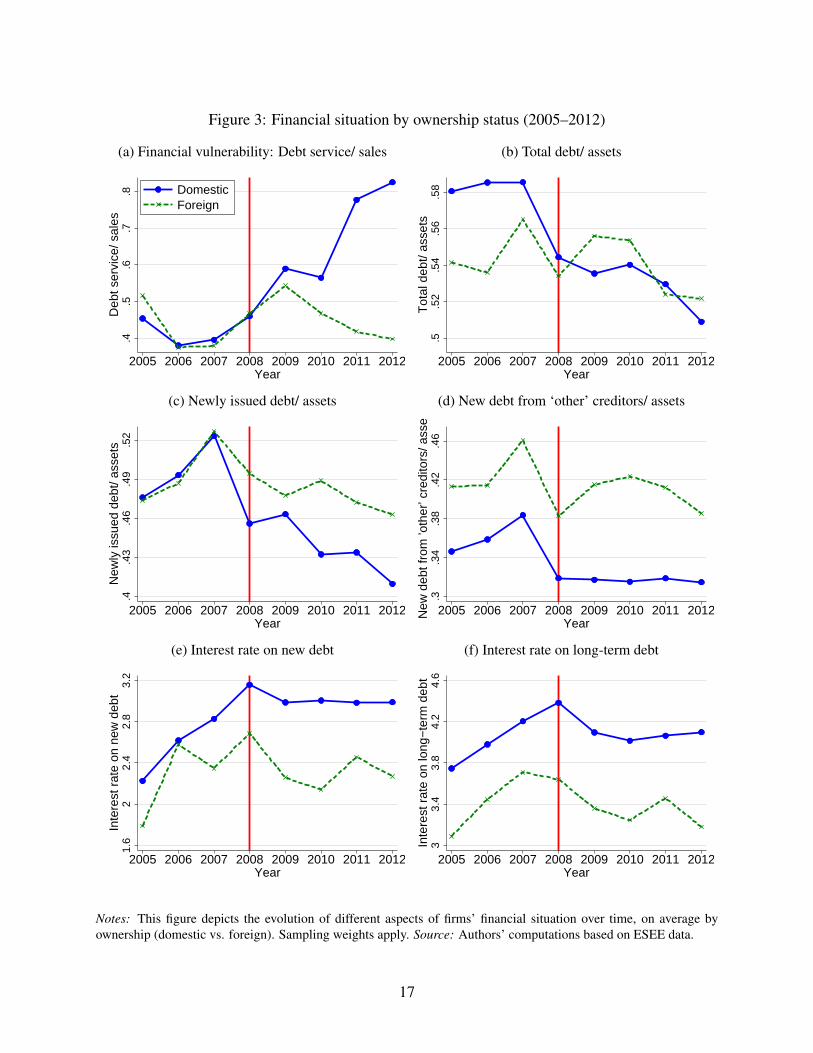
Figure 3: Financial situation by ownership status (2005–2012)
(a) Financial vulnerability: Debt service/ sales
.4.5
.6.7
.8D
ebt s
ervi
ce/ s
ales
2005 2006 2007 2008 2009 2010 2011 2012Year
DomesticForeign
(b) Total debt/ assets
.5.5
2.5
4.5
6.5
8T
otal
deb
t/ as
sets
2005 2006 2007 2008 2009 2010 2011 2012Year
(c) Newly issued debt/ assets
.4.4
3.4
6.4
9.5
2N
ewly
issu
ed d
ebt/
asse
ts
2005 2006 2007 2008 2009 2010 2011 2012Year
(d) New debt from ‘other’ creditors/ assets
.3.3
4.3
8.4
2.4
6N
ew d
ebt f
rom
’oth
er’ c
redi
tors
/ ass
ets
2005 2006 2007 2008 2009 2010 2011 2012Year
(e) Interest rate on new debt
1.6
22.
42.
83.
2In
tere
st r
ate
on n
ew d
ebt
2005 2006 2007 2008 2009 2010 2011 2012Year
(f) Interest rate on long-term debt
33.
43.
84.
24.
6In
tere
st r
ate
on lo
ng−
term
deb
t
2005 2006 2007 2008 2009 2010 2011 2012Year
Notes: This figure depicts the evolution of different aspects of firms’ financial situation over time, on average byownership (domestic vs. foreign). Sampling weights apply. Source: Authors’ computations based on ESEE data.
17
itors. Importantly, this debt category includes intra-firm lending by the parent firm, and thereforeit is plausibly greater for foreign-owned firms in all years. However, following a strikingly similarevolution across the two ownership groups up until 2008, this ratio clearly increased in 2009 and2010 among foreign-owned firms, while it remained low and completely flat among domesticallyowned firms. This pattern is consistent with rising internal borrowing from the foreign parent overthe crisis years 2009–2011.
Finally, we examine the interest rates paid by firms to shed some light on the question whetherthe observed changes in credit volumes are driven by factors related to credit demand or supply.Figure 3(e) shows the interest rate on new debt, which is a weighted average of interest rates paidon short-term debt and newly issued long-term debt, while Figure 3(f) shows the interest rate onlong-term debt. In both figures we see that average interest rates are generally lower for foreign-owned firms, which squares well with our assumption that they can access foreign capital at alower cost (see Section 2.3). Figure 3(e) shows that the interest rate paid on new debt peakedin 2008 and remained high for domestically owned firms, in line with an adverse credit supplyshock. Foreign-owned firms had a vastly different experience. They seemed to be able to sidestepthe credit shortage, as the interest rate on their new debt rose by less between 2006 and 2008 andquickly fell in 2009–2010, even below the pre-crisis level of 2006–2007. When it comes to theinterest rates paid on long-term debt, illustrated in Figure 3(f), we see a similar picture, thoughthe adjustments there are naturally more sluggish. We can conclude that the gap in credit costsbetween foreign and domestically owned firms widened sharply over the crisis years. The rawdata thus support the view that foreign-owned firms benefited in the crisis from more and cheapercredit, accessed through or with the assistance of their foreign parents.
4 Empirical analysis
Our empirical analysis proceeds in three steps. First, we estimate what we call the ownership dif-
ferential of the financial crisis, i.e., the differential effect of the crisis on export shares of foreign-owned relative to domestically owned firms, using a difference-in-differences (DiD) framework.Secondly, we focus explicitly on the credit channel by estimating the ownership differential as afunction of the financial vulnerability of the firm, measured just before the crisis, using a tripledifferences (DiDiD) framework. Thirdly, we scrutinize various aspects of our analysis: We distin-guish the DiDiD effects at the extensive vs. intensive margin of exports; we contrast the financialadvantage of foreign ownership with the benefit of belonging to a corporate group more generally,to learn about the role of foreignness of the parent firm as such; we test the potential advantage offoreign-owned firms to export their goods through the distributional network of the foreign parent(market access channel); and we conclude the section with an extensive robustness analysis.
18
4.1 The effect of foreign ownership
We begin by estimating the following DiD model:
(exports/sales)it =2012∑
r=2006
φr · (Foreignit · Yr) + γ · Foreignit +Di +Dst + εit, (9)
where the dependent variable is the export share of firm i in year t, Foreignit is a dummy variablefor foreign ownership with a corresponding coefficient γ, and Yr is a dummy variable equal toone if r = t, so that the sum collects interaction terms between the foreign ownership dummyand a comprehensive set of year dummies with corresponding coefficients φr (indexed by r =
2006, . . . , 2012). The parameter Di is a firm fixed effect, while Dst is an industry-year fixedeffect, corresponding to the 2-digit industry code first reported by the firm in our sample period(typically in the base year 2005). Finally, εit is an error term with zero conditional mean. Statisticalinference will be based on robust standard errors clustered by firm, robust to serial correlation andheteroskedasticity.
This model allows us to study the evolution of firm-level export shares through the financialcrisis in a systematic and flexible way, and to exploit the credit crunch in 2008/09 as a source ofexogenous variation in credit supply. Our main interest is in whether the response to the crisis wascontingent on foreign ownership. Against the backdrop of Proposition 1, we expect foreign-ownedfirms to outperform their domestically owned peers on export markets in the financial crisis. Theflexible specification (9) has three advantages. First, we do not need to take a stance on whetherthe crisis first hit Spain in one of the years 2008, 2009, or 2010; instead we let the data speakas to when the crisis actually left a mark on exports. Secondly, we can test for differences in theevolution of export shares across ownership groups in the years before the crisis, which serves asan important plausibility check for the identifying assumption of a common trend. Thirdly, we caninvestigate whether the ownership differential is persistent over time, or whether it fades out.
Crucial for the interpretation of our estimates is the variation in the data we use for identifica-tion. Notice that the sets of fixed effects included in the model absorb a wide variety of potentialconfounding factors. In particular, the firm fixed effects capture any time-invariant heterogeneityin observable or unobservable firm characteristics, such as firm-specific productivity, managementquality, or the fixed cost of exporting.22 The industry-year fixed effects flexibly account for theindustry-specific evolution of comparative advantage and arbitrary domestic or foreign demand
22Manova et al. (2015) point out several potential reasons why foreign-owned firms are doing better on exportmarkets than domestically owned firms. Apart from enjoying better financing conditions, foreign-owned firms maye.g. have access to their parents’ superior distribution network, an aspect that we investigate further in Section 4.5.The use of firm fixed effects in the estimation of (9) allows us to control for such factors to the extent that they areconstant through time.
19
shocks across industries in the crisis. The interaction effects φr in equation (9) are hence iden-tified from differences in within-firm variation over time across the two ownership groups, aftercontrolling for industry-specific shocks.
A fundamental endogeneity problem stems from selection into foreign ownership based on pastfirm characteristics. The same factors that explain why firms are foreign owned might also explainwhy their exports are more resilient in the financial crisis. To tackle this problem, we follow theliterature and combine the fixed effects model in (9) with a propensity score reweighting approach(Hirano et al., 2003). Specifically, we construct propensity scores and reweigh each observationin order to generate a similar distribution of key observable characteristics across foreign anddomestically owned firms. The intention of this approach is to match also the distribution ofimportant unobservable characteristics across the two groups. To estimate the propensity scores,we first consider the years 2007, 2008, and 2009 in our panel and sort those firms that are foreignowned in all three years into the treatment group and those that are domestically owned into thecontrol group. Hence, we exclude those firms that switch their ownership status over time, as wellas those firms that enter or leave the sample in one of the years 2007, 2008, and 2009. Importantly,this approach allows us to focus on a subsample of firms for which we can properly model therelationship between treatment assignment and covariates before the crisis, but study their exportresponse during the crisis. Inspired by the literature studying selection into foreign ownership(e.g. Guadalupe et al., 2012), we then obtain the propensity scores for the remaining firms byrunning cross-sectional probit regressions of foreign ownership in 2007 (the treatment) on firm-specific sales, sales growth, capital intensity (all in logs), export share, and a full set of industrydummies. The firm-specific variables are all lagged by one year, i.e., they are observed in 2006.Each treated firm is reweighted by 1/p and each control group firm by 1/(1 − p), where p is theestimated propensity score.23 Importantly, p reflects the estimated probability that the firm is inforeign ownership shortly before the crisis materialized (i.e., in 2007), and is thus orthogonal tothe crisis itself.
Columns (1) and (2) of Table 2 present estimates of γ and φr, r = 2006, . . . , 2012, based onthe fixed effects (FE) estimator and the propensity score reweighting (PSR) estimator, respectively.The results show a significant increase in the export share of foreign-owned relative to domesticallyowned firms in the crisis, as predicted by Proposition 1. The fixed effects estimator identifies
23We only keep those observations in the analysis that are in the region of common support, and we have checkedthat the balancing property is supported in the data. More specifically, after stratifying the panel into six subsamplesaccording to their propensity scores, all observed characteristics of foreign and domestically owned firms are bal-anced within each subsample. This means that within each subsample we cannot reject the null hypothesis (at anyconventional significance level) that the means of the variables are identical across treatment and control group. Wealso winsorize the propensity scores at the 99th percentile, following Guadalupe et al. (2012). Detailed results of thepropensity score estimation are available from the authors on request.
20
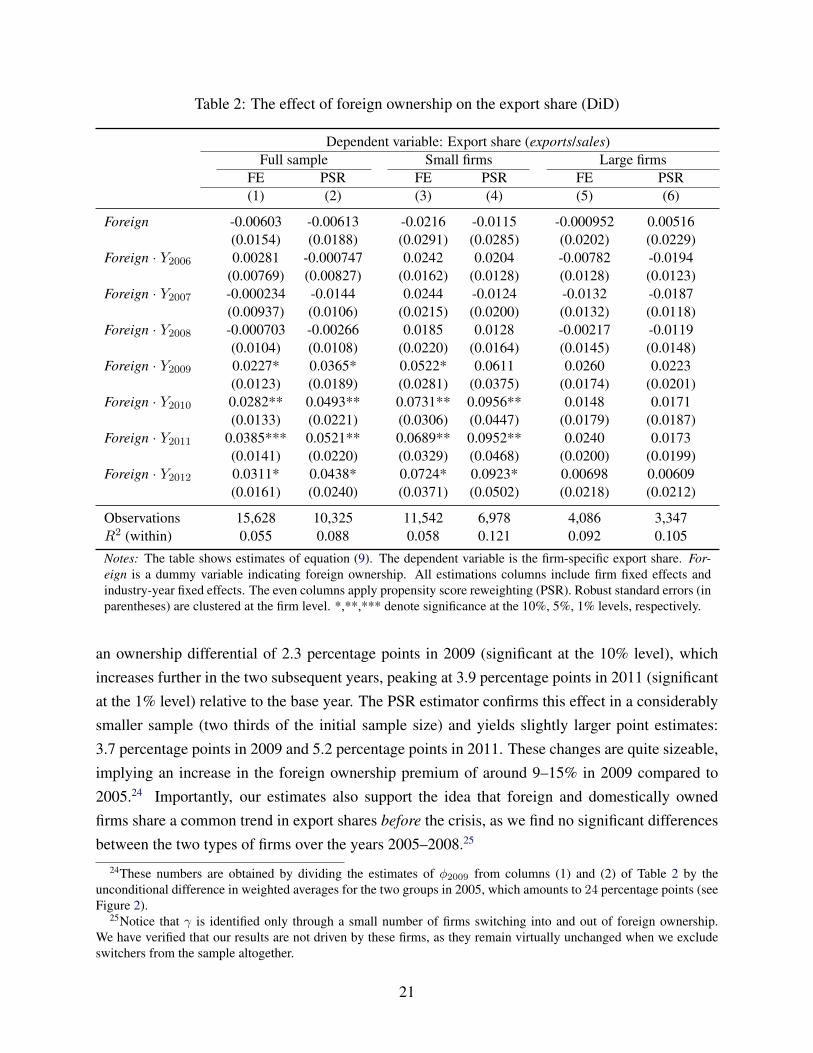
Table 2: The effect of foreign ownership on the export share (DiD)
Dependent variable: Export share (exports/sales)Full sample Small firms Large firms
FE PSR FE PSR FE PSR(1) (2) (3) (4) (5) (6)
Foreign -0.00603 -0.00613 -0.0216 -0.0115 -0.000952 0.00516(0.0154) (0.0188) (0.0291) (0.0285) (0.0202) (0.0229)
Foreign · Y2006 0.00281 -0.000747 0.0242 0.0204 -0.00782 -0.0194(0.00769) (0.00827) (0.0162) (0.0128) (0.0128) (0.0123)
Foreign · Y2007 -0.000234 -0.0144 0.0244 -0.0124 -0.0132 -0.0187(0.00937) (0.0106) (0.0215) (0.0200) (0.0132) (0.0118)
Foreign · Y2008 -0.000703 -0.00266 0.0185 0.0128 -0.00217 -0.0119(0.0104) (0.0108) (0.0220) (0.0164) (0.0145) (0.0148)
Foreign · Y2009 0.0227* 0.0365* 0.0522* 0.0611 0.0260 0.0223(0.0123) (0.0189) (0.0281) (0.0375) (0.0174) (0.0201)
Foreign · Y2010 0.0282** 0.0493** 0.0731** 0.0956** 0.0148 0.0171(0.0133) (0.0221) (0.0306) (0.0447) (0.0179) (0.0187)
Foreign · Y2011 0.0385*** 0.0521** 0.0689** 0.0952** 0.0240 0.0173(0.0141) (0.0220) (0.0329) (0.0468) (0.0200) (0.0199)
Foreign · Y2012 0.0311* 0.0438* 0.0724* 0.0923* 0.00698 0.00609(0.0161) (0.0240) (0.0371) (0.0502) (0.0218) (0.0212)
Observations 15,628 10,325 11,542 6,978 4,086 3,347R2 (within) 0.055 0.088 0.058 0.121 0.092 0.105
Notes: The table shows estimates of equation (9). The dependent variable is the firm-specific export share. For-eign is a dummy variable indicating foreign ownership. All estimations columns include firm fixed effects andindustry-year fixed effects. The even columns apply propensity score reweighting (PSR). Robust standard errors (inparentheses) are clustered at the firm level. *,**,*** denote significance at the 10%, 5%, 1% levels, respectively.
an ownership differential of 2.3 percentage points in 2009 (significant at the 10% level), whichincreases further in the two subsequent years, peaking at 3.9 percentage points in 2011 (significantat the 1% level) relative to the base year. The PSR estimator confirms this effect in a considerablysmaller sample (two thirds of the initial sample size) and yields slightly larger point estimates:3.7 percentage points in 2009 and 5.2 percentage points in 2011. These changes are quite sizeable,implying an increase in the foreign ownership premium of around 9–15% in 2009 compared to2005.24 Importantly, our estimates also support the idea that foreign and domestically ownedfirms share a common trend in export shares before the crisis, as we find no significant differencesbetween the two types of firms over the years 2005–2008.25
24These numbers are obtained by dividing the estimates of φ2009 from columns (1) and (2) of Table 2 by theunconditional difference in weighted averages for the two groups in 2005, which amounts to 24 percentage points (seeFigure 2).
25Notice that γ is identified only through a small number of firms switching into and out of foreign ownership.We have verified that our results are not driven by these firms, as they remain virtually unchanged when we excludeswitchers from the sample altogether.
21
While these results are consistent with a financial advantage of foreign ownership that helped insupporting exports in the crisis, they could be caused by factors unrelated to credit constraints. Forexample, the international distribution network maintained by MNEs might have helped foreign-owned firms to channel their sales into foreign markets that fared better than the Spanish marketduring the crisis (e.g. emerging-market economies). Therefore, a more convincing identificationstrategy needs to exploit an additional margin of variation in the data in order to clearly disentanglethe credit channel from other potential explanations.
One such margin could be firm size. The evidence suggests that small firms are more likely tobe credit constrained than large firms (see Gertler and Gilchrist, 1994; Guiso et al., 2004; Beck etal., 2008). This observation is fully consistent with our theory. In the model in Section 2, only theless productive and thus smaller exporting firms are credit constrained, while the most productiveand thus larger firms can always export at first-best levels. Hence, we next estimate the model inequation (9) separately for small and large firms (with up to 200 vs. more than 200 employees,respectively).
Columns (3) to (6) in Table 2 report the results. We find that the above-described ownershipdifferential is strongly confirmed in the sample of small firms, but not in the sample of large firms.The larger coefficient estimates in the sample of small firms further suggest a more important rolefor foreign ownership among small firms. While we believe that these results serve as an indicationfor the credit channel to be at work, we cannot rule out the possibility that other benefits of foreignownership also gained importance for small firms’ exports in the crisis. An alternative and morepromising route to pin down the credit channel is suggested by our model: to focus on a firm’sfinancial situation rather than on firm size. The financial advantage of foreign ownership should bemore important for exports among financially vulnerable firms that are highly indebted at the onsetof the crisis. Therefore, we directly focus on firms’ financial vulnerability in the next section.
4.2 The credit channel of foreign ownership
To identify the credit channel of foreign ownership in promoting firm exports, we propose a tripledifferences (DiDiD) identification strategy that exploits three margins: variation in the ownershipstructure of firms (foreign vs. domestic), variation in credit supply caused by the financial crisis,and variation in financial vulnerability across firms prior to the crisis. The estimation equationreads as follows:
(exports/sales)it =2012∑
r=2006
θr · (Foreignit · FinVuli · Yr) +2012∑
r=2006
φr · (Foreignit · Yr) + γ · Foreignit
+ ρ · (Foreignit · FinVuli) +2012∑
r=2006
δr · (FinVuli · Yr) +Di +Dst + εit, (10)
22
where Foreignit is the foreign ownership dummy (as before), FinVuli is our firm-specific measureof pre-crisis financial vulnerability, and the main parameters of interest are the coefficients of thetriple interaction terms with year dummies: θr, r = 2006, . . . , 2012.26 From Proposition 1, weexpect θr > 0 in the crisis years.
This model allows us to see whether the ownership differential identified in the previous sectionis larger among financially vulnerable firms. The main rationale behind this approach is that firmswith a higher debt service-to-sales ratio in 2008 will have found it more difficult to finance theirexport activities when liquidity dried out in the financial crisis. Importantly, we measure financialvulnerability in 2008, based on credit contracts signed in or before 2007, in the manner describedin Section 3.3. Hence, this variable is exogenous to the credit crunch in the financial crisis, whichcame unexpected and the severity of which had not been anticipated.27 Moreover, as shown inFigure 3, there was virtually no difference in the degree of financial vulnerability between foreignand domestically owned firms in any of the pre-crisis years 2005–2008. The foreign ownershipstatus of firms was thus orthogonal to the measure of financial vulnerability we use in estimatingthe model in (10).
Table 3 reports our main estimation results. It demonstrates that it was especially the groupof financially vulnerable firms for which the adverse effect of the financial crisis on firms’ exportshares was mitigated by foreign ownership. In other words, the ownership differential identifiedabove is increasing in a firm’s degree of financial vulnerability. The table reports estimates ofthe triple interaction effects θr, r = 2006, . . . , 2012 in equation (10), first for the full sample(columns (1) and (2)), and then separately for the samples of small firms (columns (3) and (4))and large firms (columns (5) and (6)). In each case, we first use the FE estimator and then thePSR estimator described in the previous section. We find economically and statistically significanttriple interaction effects for 2009 and the subsequent years in the full sample. As in the case ofour DiD results, the DiDiD effects are greater among small firms, which were more likely to facebinding credit constraints. In the sample of large firms, the DiDiD effects are not statistically sig-nificant. Overall, these results provide strong support for Proposition 1 and the financial advantageof foreign ownership on export markets.
To provide a quantitative perspective on our estimates, we evaluate the ownership differentialat different degrees of financial vulnerability. Focusing on the sample of small firms, we find thatthe estimated ownership differential is larger by 5.4 percentage points at the 75th percentile of
26Further parameters to be estimated in equation (10) are the coefficients of the two-way interaction terms, i.e., ρ,φr and δr, r = 2006, . . . , 2012, as well as the coefficient of the foreign ownership dummy γ. The fixed effects Di
and Dst absorb FinVuli and Yr, r = 2006, . . . , 2012. These estimates are not reported below to economize on space.27We carefully explore the timing of our measure of financial vulnerability and its implications for our main results
in Appendix B.3.
23

Table 3: The credit channel of foreign ownership (DiDiD)
Dependent variable: Export share (exports/sales)
Full sample Small firms Large firms
FE PSR FE PSR FE PSR
(1) (2) (3) (4) (5) (6)
Foreign · FinVul · Y2006 -0.0182 -0.0301 -0.0189 -0.0376 0.0689 0.0203(0.0233) (0.0227) (0.0335) (0.0249) (0.0622) (0.0526)
Foreign · FinVul · Y2007 -0.00485 -0.00975 0.00784 -0.00394 0.0254 -0.00270(0.0230) (0.0200) (0.0319) (0.0230) (0.0568) (0.0474)
Foreign · FinVul · Y2008 0.00961 -0.000947 0.0157 -0.0100 0.0681 0.0548(0.0214) (0.0178) (0.0367) (0.0179) (0.0571) (0.0503)
Foreign · FinVul · Y2009 0.0810* 0.155*** 0.185*** 0.182*** 0.0767 0.104(0.0464) (0.0414) (0.0206) (0.0115) (0.0650) (0.0808)
Foreign · FinVul · Y2010 0.0843 0.149*** 0.201*** 0.181*** 0.0639 0.0856(0.0546) (0.0476) (0.0243) (0.0170) (0.0648) (0.0588)
Foreign · FinVul · Y2011 0.0799* 0.138*** 0.200*** 0.178*** 0.0510 0.0382(0.0483) (0.0412) (0.0264) (0.0142) (0.0764) (0.0597)
Foreign · FinVul · Y2012 0.0779 0.131*** 0.194*** 0.174*** 0.0224 -0.0131(0.0494) (0.0363) (0.0316) (0.0146) (0.0716) (0.0641)
Observations 12,488 9,937 8,873 6,720 3,615 3,217R2 (within) 0.069 0.165 0.093 0.289 0.106 0.116
Notes: The table shows estimates of equation (10). The dependent variable is the export share. Foreign is adummy variable indicating foreign ownership. FinVul is the financial vulnerability of the firm measured by thedebt service-to-sales ratio in 2008. Yt are year dummies. All estimations include the Foreign dummy, a full setof two-way interaction terms between Foreign, FinVul, and the year dummies, as well as firm fixed effects andindustry-year fixed effects. The even columns apply propensity score reweighting (PSR). Robust standard errors (inparentheses) are clustered at the firm level. *,**,*** denote significance at the 10%, 5%, 1% levels, respectively.
financial vulnerability compared to the 25th percentile.28 The magnitude of this triple differenceeffect is large, since it must be evaluated against the mean export share of 10.6% in the underlyingestimation sample. And it is even twice as large, amounting to 12 percentage points, if we comparefirms at the 90th to the 10th percentile of financial vulnerability.
Note that in the sample of small firms, the results are very similar across the two differentestimators, both in terms of magnitudes and significance levels. Moreover, we cannot reject thenull hypothesis that θ2009 = θ2010 = θ2011 = θ2012, i.e., the coefficients of the triple interactionterms are remarkably stable over the period 2009–2012. For the remaining part of our analysis, we
28The 25th and 75th percentiles of financial vulnerability in the estimation sample of small firms are 0.210 and0.507, respectively, after applying sampling weights. We compute the differential effect as θ2009 · (0.507 − 0.210),using the estimate of θ2009 from column (4). Note that these effects are estimated relative to the base year 2005.However, we find no evidence of differential effects before 2009, consistent with a common pre-crisis trend. Thus, thereported magnitudes are approximately equal to the effect in 2009 relative to 2008.
24
therefore define a Crisis dummy variable which takes on the value zero for the period 2005–2008and the value one for the period 2009–2012.
4.3 Extensive versus intensive margin of exports
We proceed by investigating the precise firm-level margin that is driving our results. In particular,we distinguish between the extensive and the intensive margin of exports in our triple differencesanalysis. This allows us to see whether, among financially vulnerable firms, foreign ownershiphelped firms to continue (or even start) exporting in the crisis, or to maintain high volumes ofexports, or both. This distinction is important: If the effect is concentrated at the extensive marginof exports, then it must be the fixed rather than the variable costs of exporting that matter inthe presence of capital market imperfections (see e.g. the discussions in Minetti and Zhu, 2011;Muuls, 2015). It also connects our findings to the literature on the micro structure of the greattrade collapse, which has found predominantly intensive-margin adjustments in the crisis (Behrenset al., 2013; Bricongne et al., 2012; Eppinger et al., 2018).
We estimate our triple differences model using two different dependent variables: For the ex-tensive margin, we define an exporter dummy which is equal to one if the firm has positive exportsin a given year and zero otherwise. For the intensive margin, we use the volume of exports (deflatedand in logs), which implies that we only include exporting firms in this regression.
Our estimates in Table 4 reveal that the export-promoting effect of foreign ownership in the cri-sis was concentrated at the intensive rather than the extensive margin. This suggests that problemswith financing the fixed costs of exporting played a minor role in the crisis. Before dissecting thetwo margins, we estimate our benchmark specification (10) using the export share as the main de-pendent variable as well as the Crisis dummy instead of the year dummies in the main interactionterms. We find the same triple differences results as before in the previous section; see columns (1)and (2). When using the export dummy as the dependent variable in columns (3) and (4), we findno evidence of a differential effect at the extensive margin of exports. The triple interaction ef-fect is not significantly different from zero, and the same applies to the two-way interaction effectbetween Foreign and Crisis in this model or in a DiD model (not reported). By contrast, at theintensive margin, foreign ownership had a large and highly significant differential effect on thevolume of exports for financially vulnerable firms, as revealed in columns (5) and (6). In termsof magnitude, the estimated triple interaction effect in column (6) suggests that foreign owner-ship raised export volumes in the crisis by 20.1% more for firms at the 75th percentile of financialvulnerability compared to those at the 25th percentile.
25
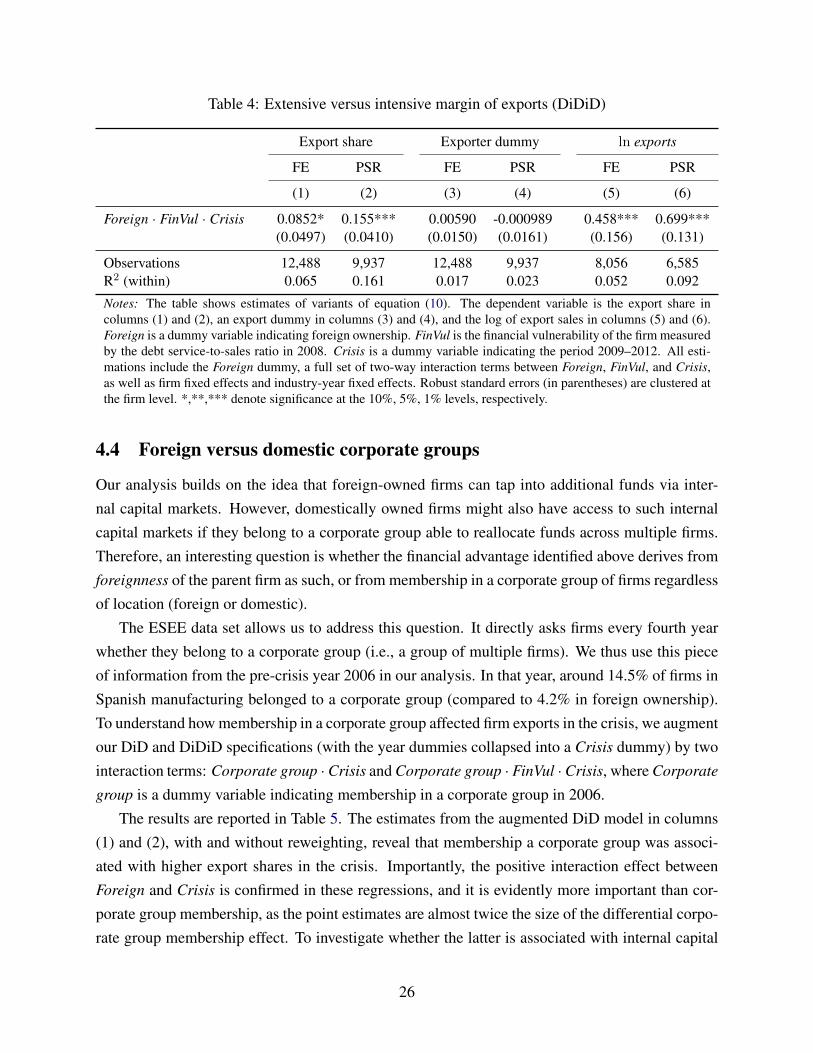
Table 4: Extensive versus intensive margin of exports (DiDiD)
Export share Exporter dummy ln exports
FE PSR FE PSR FE PSR
(1) (2) (3) (4) (5) (6)
Foreign · FinVul · Crisis 0.0852* 0.155*** 0.00590 -0.000989 0.458*** 0.699***(0.0497) (0.0410) (0.0150) (0.0161) (0.156) (0.131)
Observations 12,488 9,937 12,488 9,937 8,056 6,585R2 (within) 0.065 0.161 0.017 0.023 0.052 0.092
Notes: The table shows estimates of variants of equation (10). The dependent variable is the export share incolumns (1) and (2), an export dummy in columns (3) and (4), and the log of export sales in columns (5) and (6).Foreign is a dummy variable indicating foreign ownership. FinVul is the financial vulnerability of the firm measuredby the debt service-to-sales ratio in 2008. Crisis is a dummy variable indicating the period 2009–2012. All esti-mations include the Foreign dummy, a full set of two-way interaction terms between Foreign, FinVul, and Crisis,as well as firm fixed effects and industry-year fixed effects. Robust standard errors (in parentheses) are clustered atthe firm level. *,**,*** denote significance at the 10%, 5%, 1% levels, respectively.
4.4 Foreign versus domestic corporate groups
Our analysis builds on the idea that foreign-owned firms can tap into additional funds via inter-nal capital markets. However, domestically owned firms might also have access to such internalcapital markets if they belong to a corporate group able to reallocate funds across multiple firms.Therefore, an interesting question is whether the financial advantage identified above derives fromforeignness of the parent firm as such, or from membership in a corporate group of firms regardlessof location (foreign or domestic).
The ESEE data set allows us to address this question. It directly asks firms every fourth yearwhether they belong to a corporate group (i.e., a group of multiple firms). We thus use this pieceof information from the pre-crisis year 2006 in our analysis. In that year, around 14.5% of firms inSpanish manufacturing belonged to a corporate group (compared to 4.2% in foreign ownership).To understand how membership in a corporate group affected firm exports in the crisis, we augmentour DiD and DiDiD specifications (with the year dummies collapsed into a Crisis dummy) by twointeraction terms: Corporate group ·Crisis and Corporate group · FinVul ·Crisis, where Corporate
group is a dummy variable indicating membership in a corporate group in 2006.The results are reported in Table 5. The estimates from the augmented DiD model in columns
(1) and (2), with and without reweighting, reveal that membership a corporate group was associ-ated with higher export shares in the crisis. Importantly, the positive interaction effect betweenForeign and Crisis is confirmed in these regressions, and it is evidently more important than cor-porate group membership, as the point estimates are almost twice the size of the differential corpo-rate group membership effect. To investigate whether the latter is associated with internal capital
26
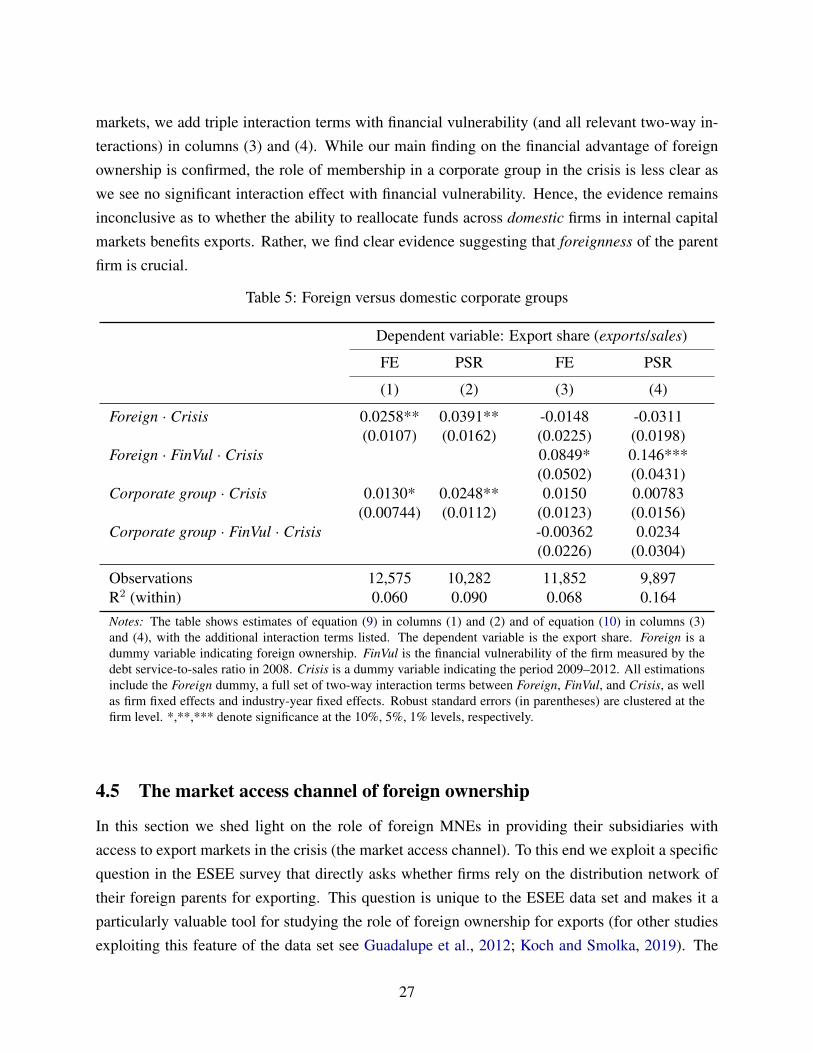
markets, we add triple interaction terms with financial vulnerability (and all relevant two-way in-teractions) in columns (3) and (4). While our main finding on the financial advantage of foreignownership is confirmed, the role of membership in a corporate group in the crisis is less clear aswe see no significant interaction effect with financial vulnerability. Hence, the evidence remainsinconclusive as to whether the ability to reallocate funds across domestic firms in internal capitalmarkets benefits exports. Rather, we find clear evidence suggesting that foreignness of the parentfirm is crucial.
Table 5: Foreign versus domestic corporate groups
Dependent variable: Export share (exports/sales)
FE PSR FE PSR
(1) (2) (3) (4)
Foreign · Crisis 0.0258** 0.0391** -0.0148 -0.0311(0.0107) (0.0162) (0.0225) (0.0198)
Foreign · FinVul · Crisis 0.0849* 0.146***(0.0502) (0.0431)
Corporate group · Crisis 0.0130* 0.0248** 0.0150 0.00783(0.00744) (0.0112) (0.0123) (0.0156)
Corporate group · FinVul · Crisis -0.00362 0.0234(0.0226) (0.0304)
Observations 12,575 10,282 11,852 9,897R2 (within) 0.060 0.090 0.068 0.164Notes: The table shows estimates of equation (9) in columns (1) and (2) and of equation (10) in columns (3)and (4), with the additional interaction terms listed. The dependent variable is the export share. Foreign is adummy variable indicating foreign ownership. FinVul is the financial vulnerability of the firm measured by thedebt service-to-sales ratio in 2008. Crisis is a dummy variable indicating the period 2009–2012. All estimationsinclude the Foreign dummy, a full set of two-way interaction terms between Foreign, FinVul, and Crisis, as wellas firm fixed effects and industry-year fixed effects. Robust standard errors (in parentheses) are clustered at thefirm level. *,**,*** denote significance at the 10%, 5%, 1% levels, respectively.
4.5 The market access channel of foreign ownership
In this section we shed light on the role of foreign MNEs in providing their subsidiaries withaccess to export markets in the crisis (the market access channel). To this end we exploit a specificquestion in the ESEE survey that directly asks whether firms rely on the distribution network oftheir foreign parents for exporting. This question is unique to the ESEE data set and makes it aparticularly valuable tool for studying the role of foreign ownership for exports (for other studiesexploiting this feature of the data set see Guadalupe et al., 2012; Koch and Smolka, 2019). The
27
question appears in the survey every four years, which allows us to study two related yet distinctaspects of the market access channel: First, we study the evolution of export shares through thecrisis conditional on the use of the parent’s distribution network as reported in 2006 (i.e., beforethe crisis). Second, we consider also changes in this variable between 2006 and the crisis year2010, and focus on firms that started to use their foreign parent’s distribution network in the crisis.
While the role of market access in promoting exports of foreign-owned firms in the crisis isinteresting by itself, it is also of crucial importance in the context of our analysis for two reasons.First, the market access channel could be a confounding factor explaining our finding of a sizableand significant ownership differential in our DiD model that we might falsely attribute to the finan-cial channel. Secondly, and more importantly, the market access channel and the financial channelof foreign ownership might be intertwined, in the sense that firms relying on their foreign parent’sdistribution channels face lower cost of exporting and hence have less financing needs. This wouldimply a twin financial advantage for foreign-owned firms: On the one hand, they can finance theirexport activities through funds available from their foreign parents, and on the other hand, theycan reduce their financing needs by relegating distribution and marketing activities associated withexporting to their foreign parents.29 In the following we explore these aspects in detail.
We start by investigating whether firms’ exports performed better in the crisis if they used theirforeign parents’ distribution networks in 2006, which is pre-determined and hence exogenous tothe crisis. Columns (1) and (2) in panel A of Table 6 report estimates of the DiD model augmentedby an interaction term between Use parent network2006 and Crisis, where the former is a firm-specific and time-constant dummy variable for the use of the foreign parent’s distribution networkfor exporting in 2006.30 Whether we look at the FE estimator or the PSR estimator, the resultsprovide no indication that using this distribution channel on average helped to promote exports be-yond the effect of foreign ownership per se. We obtain the same result in the DiDiD specificationin columns (3) and (4), where our previous finding on the financial advantage of foreign owner-ship is confirmed, but the interaction effect between Use parent network2006 and Crisis remainsinsignificant.
An interesting pattern emerges as we focus explicitly on the firm’s financial vulnerability. Thespecification in columns (5) and (6) augments the DiDiD model with a triple interaction term Use
parent network2006 · FinVul · Crisis, and thus provides insights into potential interdependenciesbetween the market access channel and the financial channel. Specifically, if using the foreignparent’s distribution network serves to reduce the cost of exporting, this should lower the finan-
29While the theoretical modeling of the market access channel is beyond the scope of our paper, it is clear thatoptimal decision-making on the part of the foreign MNE must involve the efficient allocation of scarce financialresources across subsidiaries as well as the efficient integration of subsidiaries into the MNE’s distribution network.
30By definition, the foreign ownership dummy is equal to one in 2006 when Use parent network2006 is one, but notvice versa.
28
cial burden on firms using this network, and hence the role of financial vulnerability in the crisisshould be diminished for these firms. This intuition is confirmed in our regressions. The tripleinteraction effect Foreign · FinVul · Crisis is positive and significant, as before. By contrast, thetriple interaction effect between Use parent network2006, FinVul, and Crisis is negative and highlysignificant, at least when using the PSR estimator, indicating a less important role of financialvulnerability among firms that are exporting via their foreign parent’s distribution network. Theseresults suggest that foreign ownership fostered firm exports in the crisis by providing both creditand market access — but the use of the distribution network seems to be diminishing the value ofinternal capital markets.
To open up another perspective on the link between the financial channel and MNEs’ distribu-tion networks, we next exploit changes in the use of the market access channel over time. Given thedifficulties in raising finance in the financial crisis, it seems reasonable to expect that the parent’sdistribution network has become a more attractive vehicle for exporting in the crisis. Indeed, ourdata reveal that the share of foreign-owned firms using this distribution channel increased consid-erably between 2006 and 2010, from 43.1% to 54.9%. This constitutes highly suggestive evidencethat foreign-owned firms started using their parent’s distribution network in response to the finan-cial crisis in order to reduce exporting costs and mitigate liquidity problems. To identify the effecton exports, we run a series of regressions on a reduced sample, restricted to the years 2006 and2010 (i.e., the two years around the crisis in which we have data on the market access channel).The central variable of interest that we add to our benchmark DiDiD model is the time-varyingdummy variable Use parent networkt, the coefficient of which is identified only from within-firmvariation over time. Notably, these regressions should not be interpreted as causal evidence on themarket access channel, since the use of distribution networks plausibly changed due to the crisisand may hence be endogenous to exports.
Panel B of Table 6 investigates whether increased reliance on foreign parents’ distribution net-works helped in promoting exports in the crisis. To benchmark our estimates, columns (1) and (2)first validate our previous result on the financial channel of foreign ownership in the reduced sam-ple for 2006 and 2010 using the FE and PSR estimators, respectively. Columns (3) and (4) add themarket access channel and shows that firms which started using their parent’s distribution networksignificantly improved their export performance in 2010. This is novel evidence that highlightsthe value of MNEs’ distribution networks in the crisis. In the final two columns of panel B, weinteract the time-varying variable Use parent networkt with the firm’s financial vulnerability. Thepositive and significant interaction effect demonstrates that the exports of financially vulnerablefirms benefitted the most from adopting the market access channel in the crisis. This is intuitivebecause doing so serves to lower the cost of exporting and thus to sidestep the associated financ-
29
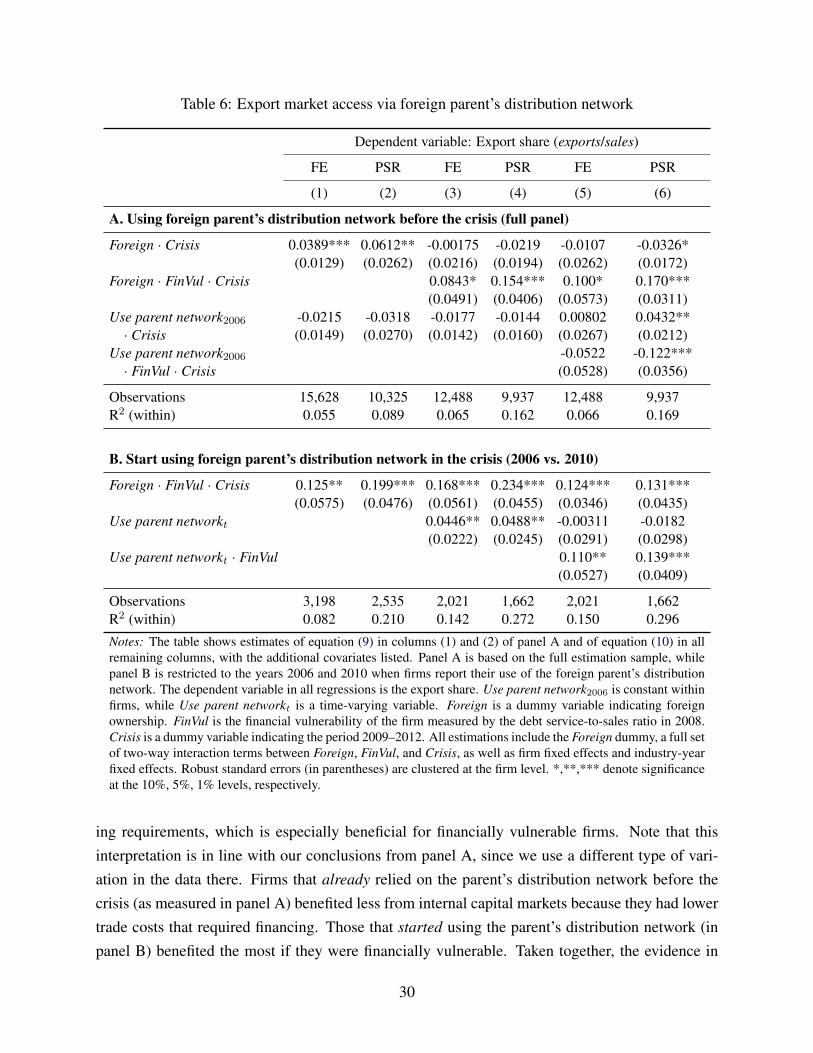
Table 6: Export market access via foreign parent’s distribution network
Dependent variable: Export share (exports/sales)
FE PSR FE PSR FE PSR
(1) (2) (3) (4) (5) (6)
A. Using foreign parent’s distribution network before the crisis (full panel)
Foreign · Crisis 0.0389*** 0.0612** -0.00175 -0.0219 -0.0107 -0.0326*(0.0129) (0.0262) (0.0216) (0.0194) (0.0262) (0.0172)
Foreign · FinVul · Crisis 0.0843* 0.154*** 0.100* 0.170***(0.0491) (0.0406) (0.0573) (0.0311)
Use parent network2006 -0.0215 -0.0318 -0.0177 -0.0144 0.00802 0.0432**· Crisis (0.0149) (0.0270) (0.0142) (0.0160) (0.0267) (0.0212)
Use parent network2006 -0.0522 -0.122***· FinVul · Crisis (0.0528) (0.0356)
Observations 15,628 10,325 12,488 9,937 12,488 9,937R2 (within) 0.055 0.089 0.065 0.162 0.066 0.169
B. Start using foreign parent’s distribution network in the crisis (2006 vs. 2010)
Foreign · FinVul · Crisis 0.125** 0.199*** 0.168*** 0.234*** 0.124*** 0.131***(0.0575) (0.0476) (0.0561) (0.0455) (0.0346) (0.0435)
Use parent networkt 0.0446** 0.0488** -0.00311 -0.0182(0.0222) (0.0245) (0.0291) (0.0298)
Use parent networkt · FinVul 0.110** 0.139***(0.0527) (0.0409)
Observations 3,198 2,535 2,021 1,662 2,021 1,662R2 (within) 0.082 0.210 0.142 0.272 0.150 0.296
Notes: The table shows estimates of equation (9) in columns (1) and (2) of panel A and of equation (10) in allremaining columns, with the additional covariates listed. Panel A is based on the full estimation sample, whilepanel B is restricted to the years 2006 and 2010 when firms report their use of the foreign parent’s distributionnetwork. The dependent variable in all regressions is the export share. Use parent network2006 is constant withinfirms, while Use parent networkt is a time-varying variable. Foreign is a dummy variable indicating foreignownership. FinVul is the financial vulnerability of the firm measured by the debt service-to-sales ratio in 2008.Crisis is a dummy variable indicating the period 2009–2012. All estimations include the Foreign dummy, a full setof two-way interaction terms between Foreign, FinVul, and Crisis, as well as firm fixed effects and industry-yearfixed effects. Robust standard errors (in parentheses) are clustered at the firm level. *,**,*** denote significanceat the 10%, 5%, 1% levels, respectively.
ing requirements, which is especially beneficial for financially vulnerable firms. Note that thisinterpretation is in line with our conclusions from panel A, since we use a different type of vari-ation in the data there. Firms that already relied on the parent’s distribution network before thecrisis (as measured in panel A) benefited less from internal capital markets because they had lowertrade costs that required financing. Those that started using the parent’s distribution network (inpanel B) benefited the most if they were financially vulnerable. Taken together, the evidence in
30
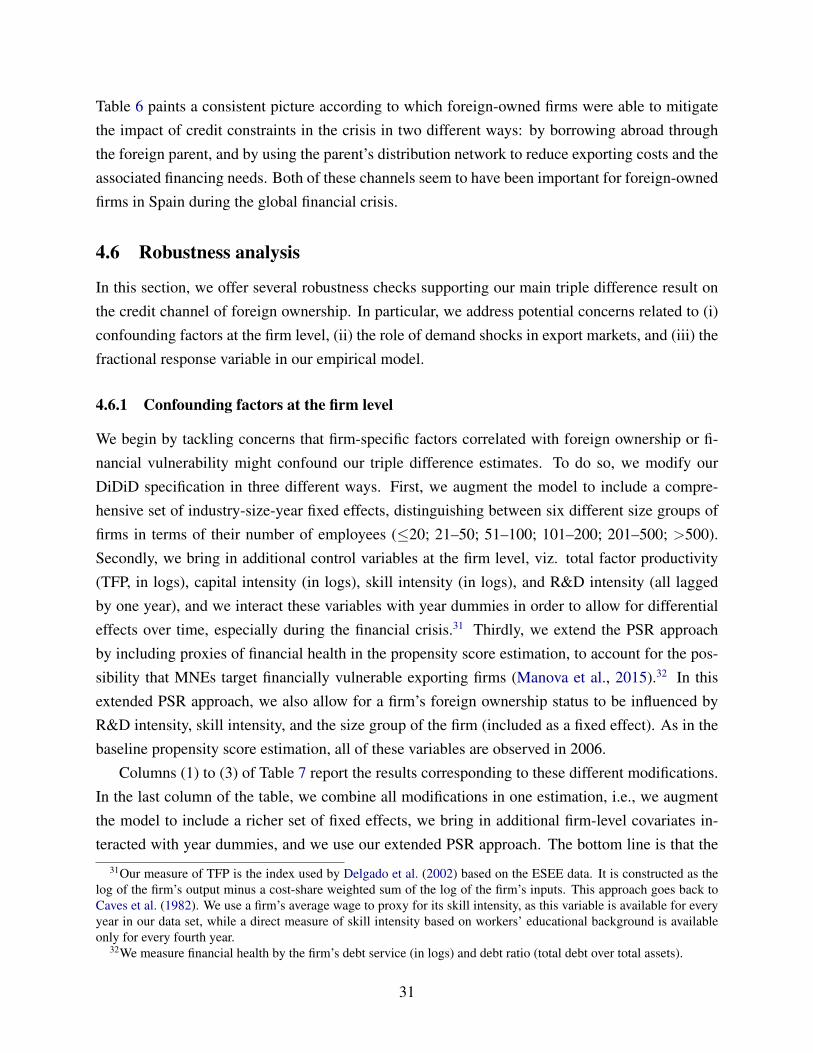
Table 6 paints a consistent picture according to which foreign-owned firms were able to mitigatethe impact of credit constraints in the crisis in two different ways: by borrowing abroad throughthe foreign parent, and by using the parent’s distribution network to reduce exporting costs and theassociated financing needs. Both of these channels seem to have been important for foreign-ownedfirms in Spain during the global financial crisis.
4.6 Robustness analysis
In this section, we offer several robustness checks supporting our main triple difference result onthe credit channel of foreign ownership. In particular, we address potential concerns related to (i)confounding factors at the firm level, (ii) the role of demand shocks in export markets, and (iii) thefractional response variable in our empirical model.
4.6.1 Confounding factors at the firm level
We begin by tackling concerns that firm-specific factors correlated with foreign ownership or fi-nancial vulnerability might confound our triple difference estimates. To do so, we modify ourDiDiD specification in three different ways. First, we augment the model to include a compre-hensive set of industry-size-year fixed effects, distinguishing between six different size groups offirms in terms of their number of employees (≤20; 21–50; 51–100; 101–200; 201–500; >500).Secondly, we bring in additional control variables at the firm level, viz. total factor productivity(TFP, in logs), capital intensity (in logs), skill intensity (in logs), and R&D intensity (all laggedby one year), and we interact these variables with year dummies in order to allow for differentialeffects over time, especially during the financial crisis.31 Thirdly, we extend the PSR approachby including proxies of financial health in the propensity score estimation, to account for the pos-sibility that MNEs target financially vulnerable exporting firms (Manova et al., 2015).32 In thisextended PSR approach, we also allow for a firm’s foreign ownership status to be influenced byR&D intensity, skill intensity, and the size group of the firm (included as a fixed effect). As in thebaseline propensity score estimation, all of these variables are observed in 2006.
Columns (1) to (3) of Table 7 report the results corresponding to these different modifications.In the last column of the table, we combine all modifications in one estimation, i.e., we augmentthe model to include a richer set of fixed effects, we bring in additional firm-level covariates in-teracted with year dummies, and we use our extended PSR approach. The bottom line is that the
31Our measure of TFP is the index used by Delgado et al. (2002) based on the ESEE data. It is constructed as thelog of the firm’s output minus a cost-share weighted sum of the log of the firm’s inputs. This approach goes back toCaves et al. (1982). We use a firm’s average wage to proxy for its skill intensity, as this variable is available for everyyear in our data set, while a direct measure of skill intensity based on workers’ educational background is availableonly for every fourth year.
32We measure financial health by the firm’s debt service (in logs) and debt ratio (total debt over total assets).
31
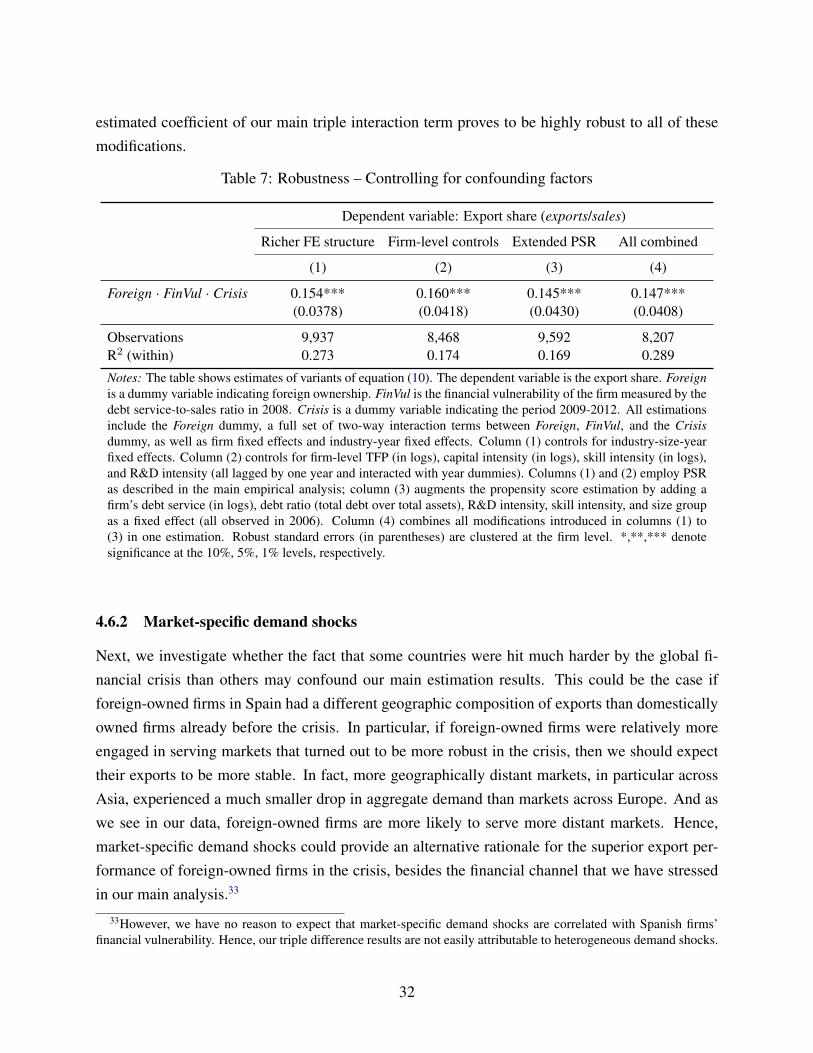
estimated coefficient of our main triple interaction term proves to be highly robust to all of thesemodifications.
Table 7: Robustness – Controlling for confounding factors
Dependent variable: Export share (exports/sales)
Richer FE structure Firm-level controls Extended PSR All combined
(1) (2) (3) (4)
Foreign · FinVul · Crisis 0.154*** 0.160*** 0.145*** 0.147***(0.0378) (0.0418) (0.0430) (0.0408)
Observations 9,937 8,468 9,592 8,207R2 (within) 0.273 0.174 0.169 0.289
Notes: The table shows estimates of variants of equation (10). The dependent variable is the export share. Foreignis a dummy variable indicating foreign ownership. FinVul is the financial vulnerability of the firm measured by thedebt service-to-sales ratio in 2008. Crisis is a dummy variable indicating the period 2009-2012. All estimationsinclude the Foreign dummy, a full set of two-way interaction terms between Foreign, FinVul, and the Crisisdummy, as well as firm fixed effects and industry-year fixed effects. Column (1) controls for industry-size-yearfixed effects. Column (2) controls for firm-level TFP (in logs), capital intensity (in logs), skill intensity (in logs),and R&D intensity (all lagged by one year and interacted with year dummies). Columns (1) and (2) employ PSRas described in the main empirical analysis; column (3) augments the propensity score estimation by adding afirm’s debt service (in logs), debt ratio (total debt over total assets), R&D intensity, skill intensity, and size groupas a fixed effect (all observed in 2006). Column (4) combines all modifications introduced in columns (1) to(3) in one estimation. Robust standard errors (in parentheses) are clustered at the firm level. *,**,*** denotesignificance at the 10%, 5%, 1% levels, respectively.
4.6.2 Market-specific demand shocks
Next, we investigate whether the fact that some countries were hit much harder by the global fi-nancial crisis than others may confound our main estimation results. This could be the case ifforeign-owned firms in Spain had a different geographic composition of exports than domesticallyowned firms already before the crisis. In particular, if foreign-owned firms were relatively moreengaged in serving markets that turned out to be more robust in the crisis, then we should expecttheir exports to be more stable. In fact, more geographically distant markets, in particular acrossAsia, experienced a much smaller drop in aggregate demand than markets across Europe. And aswe see in our data, foreign-owned firms are more likely to serve more distant markets. Hence,market-specific demand shocks could provide an alternative rationale for the superior export per-formance of foreign-owned firms in the crisis, besides the financial channel that we have stressedin our main analysis.33
33However, we have no reason to expect that market-specific demand shocks are correlated with Spanish firms’financial vulnerability. Hence, our triple difference results are not easily attributable to heterogeneous demand shocks.
32
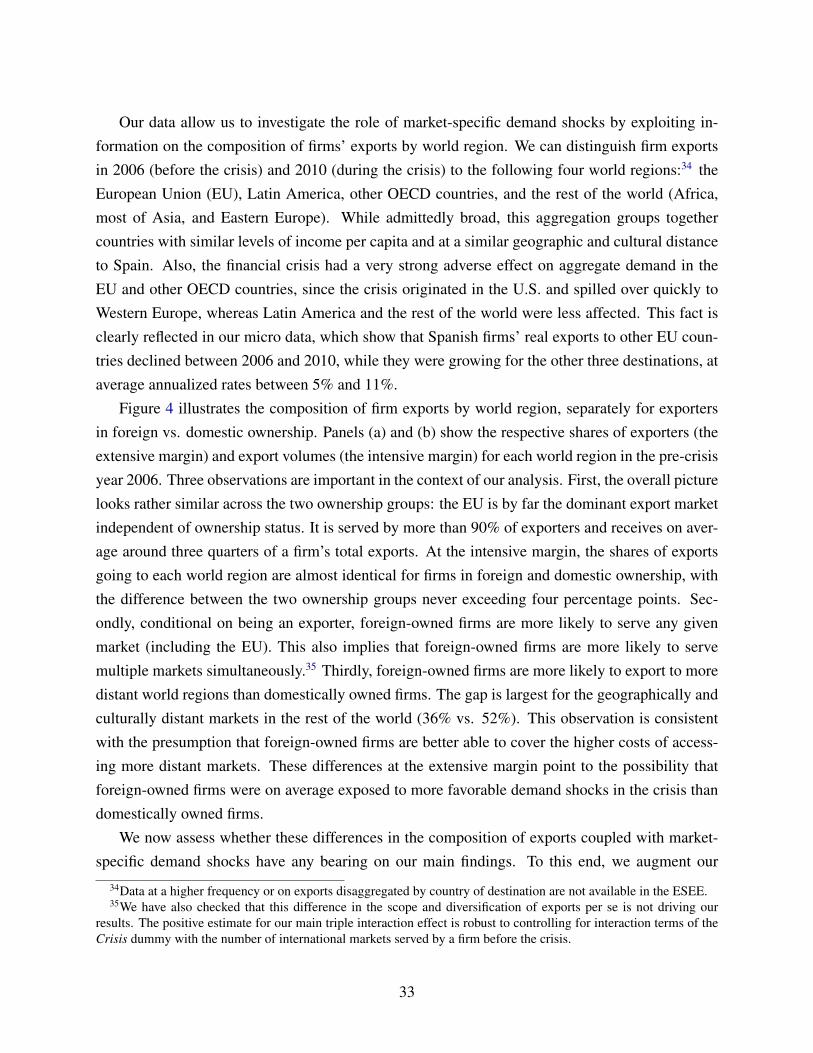
Our data allow us to investigate the role of market-specific demand shocks by exploiting in-formation on the composition of firms’ exports by world region. We can distinguish firm exportsin 2006 (before the crisis) and 2010 (during the crisis) to the following four world regions:34 theEuropean Union (EU), Latin America, other OECD countries, and the rest of the world (Africa,most of Asia, and Eastern Europe). While admittedly broad, this aggregation groups togethercountries with similar levels of income per capita and at a similar geographic and cultural distanceto Spain. Also, the financial crisis had a very strong adverse effect on aggregate demand in theEU and other OECD countries, since the crisis originated in the U.S. and spilled over quickly toWestern Europe, whereas Latin America and the rest of the world were less affected. This fact isclearly reflected in our micro data, which show that Spanish firms’ real exports to other EU coun-tries declined between 2006 and 2010, while they were growing for the other three destinations, ataverage annualized rates between 5% and 11%.
Figure 4 illustrates the composition of firm exports by world region, separately for exportersin foreign vs. domestic ownership. Panels (a) and (b) show the respective shares of exporters (theextensive margin) and export volumes (the intensive margin) for each world region in the pre-crisisyear 2006. Three observations are important in the context of our analysis. First, the overall picturelooks rather similar across the two ownership groups: the EU is by far the dominant export marketindependent of ownership status. It is served by more than 90% of exporters and receives on aver-age around three quarters of a firm’s total exports. At the intensive margin, the shares of exportsgoing to each world region are almost identical for firms in foreign and domestic ownership, withthe difference between the two ownership groups never exceeding four percentage points. Sec-ondly, conditional on being an exporter, foreign-owned firms are more likely to serve any givenmarket (including the EU). This also implies that foreign-owned firms are more likely to servemultiple markets simultaneously.35 Thirdly, foreign-owned firms are more likely to export to moredistant world regions than domestically owned firms. The gap is largest for the geographically andculturally distant markets in the rest of the world (36% vs. 52%). This observation is consistentwith the presumption that foreign-owned firms are better able to cover the higher costs of access-ing more distant markets. These differences at the extensive margin point to the possibility thatforeign-owned firms were on average exposed to more favorable demand shocks in the crisis thandomestically owned firms.
We now assess whether these differences in the composition of exports coupled with market-specific demand shocks have any bearing on our main findings. To this end, we augment our
34Data at a higher frequency or on exports disaggregated by country of destination are not available in the ESEE.35We have also checked that this difference in the scope and diversification of exports per se is not driving our
results. The positive estimate for our main triple interaction effect is robust to controlling for interaction terms of theCrisis dummy with the number of international markets served by a firm before the crisis.
33
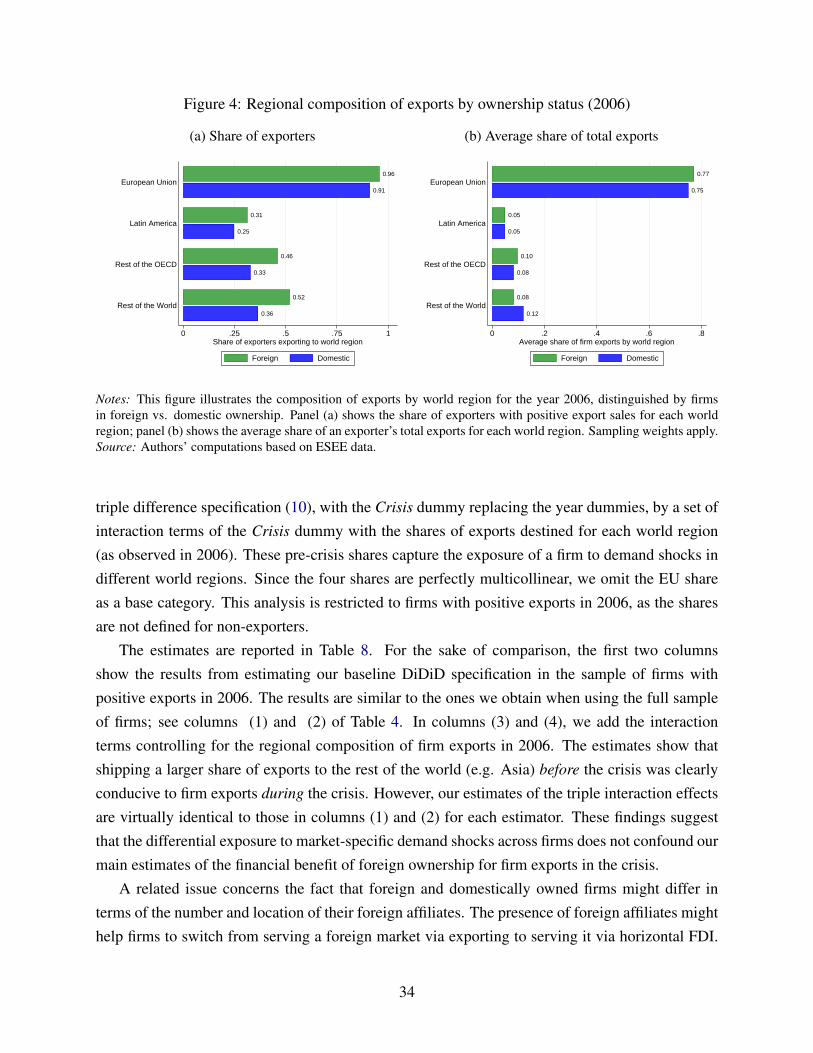
Figure 4: Regional composition of exports by ownership status (2006)
(a) Share of exporters
0.36
0.52
0.33
0.46
0.31
0.25
0.91
0.96
Rest of the World
Rest of the OECD
Latin America
European Union
0 .25 .5 .75 1Share of exporters exporting to world region
Foreign Domestic
(b) Average share of total exports
0.12
0.08
0.10
0.08
0.05
0.05
0.75
0.77
Rest of the World
Rest of the OECD
Latin America
European Union
0 .2 .4 .6 .8Average share of firm exports by world region
Foreign Domestic
Notes: This figure illustrates the composition of exports by world region for the year 2006, distinguished by firmsin foreign vs. domestic ownership. Panel (a) shows the share of exporters with positive export sales for each worldregion; panel (b) shows the average share of an exporter’s total exports for each world region. Sampling weights apply.Source: Authors’ computations based on ESEE data.
triple difference specification (10), with the Crisis dummy replacing the year dummies, by a set ofinteraction terms of the Crisis dummy with the shares of exports destined for each world region(as observed in 2006). These pre-crisis shares capture the exposure of a firm to demand shocks indifferent world regions. Since the four shares are perfectly multicollinear, we omit the EU shareas a base category. This analysis is restricted to firms with positive exports in 2006, as the sharesare not defined for non-exporters.
The estimates are reported in Table 8. For the sake of comparison, the first two columnsshow the results from estimating our baseline DiDiD specification in the sample of firms withpositive exports in 2006. The results are similar to the ones we obtain when using the full sampleof firms; see columns (1) and (2) of Table 4. In columns (3) and (4), we add the interactionterms controlling for the regional composition of firm exports in 2006. The estimates show thatshipping a larger share of exports to the rest of the world (e.g. Asia) before the crisis was clearlyconducive to firm exports during the crisis. However, our estimates of the triple interaction effectsare virtually identical to those in columns (1) and (2) for each estimator. These findings suggestthat the differential exposure to market-specific demand shocks across firms does not confound ourmain estimates of the financial benefit of foreign ownership for firm exports in the crisis.
A related issue concerns the fact that foreign and domestically owned firms might differ interms of the number and location of their foreign affiliates. The presence of foreign affiliates mighthelp firms to switch from serving a foreign market via exporting to serving it via horizontal FDI.
34
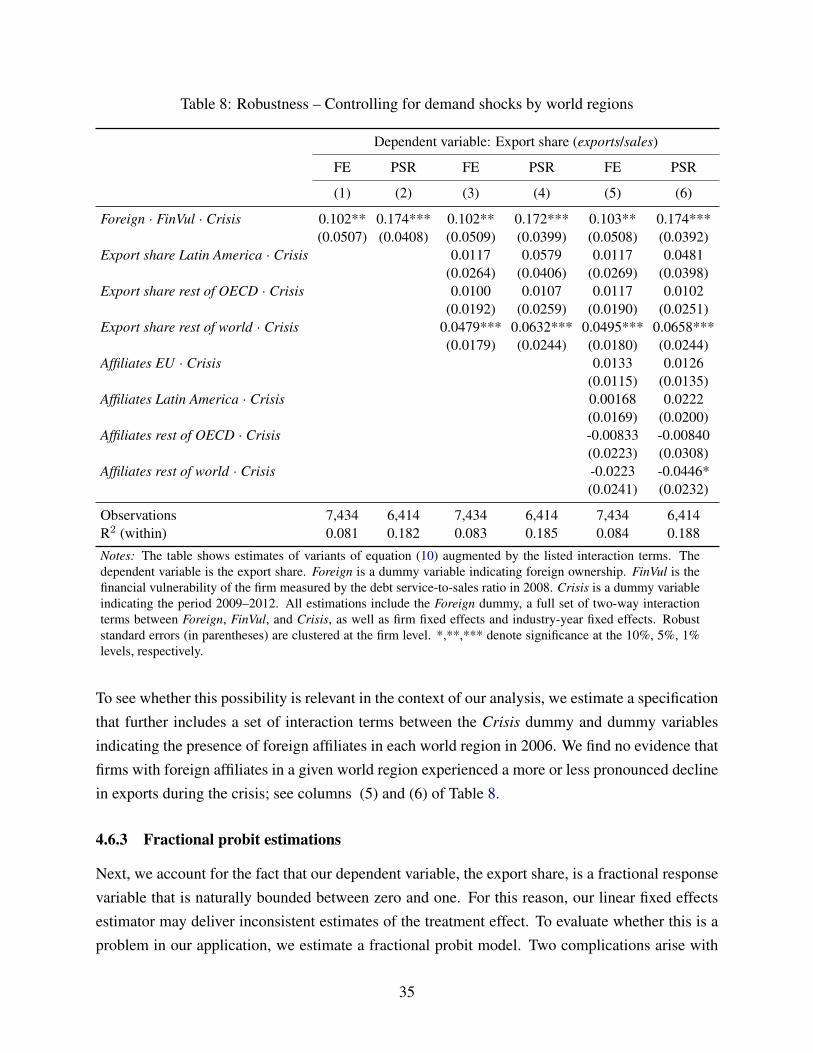
Table 8: Robustness – Controlling for demand shocks by world regions
Dependent variable: Export share (exports/sales)
FE PSR FE PSR FE PSR
(1) (2) (3) (4) (5) (6)
Foreign · FinVul · Crisis 0.102** 0.174*** 0.102** 0.172*** 0.103** 0.174***(0.0507) (0.0408) (0.0509) (0.0399) (0.0508) (0.0392)
Export share Latin America · Crisis 0.0117 0.0579 0.0117 0.0481(0.0264) (0.0406) (0.0269) (0.0398)
Export share rest of OECD · Crisis 0.0100 0.0107 0.0117 0.0102(0.0192) (0.0259) (0.0190) (0.0251)
Export share rest of world · Crisis 0.0479*** 0.0632*** 0.0495*** 0.0658***(0.0179) (0.0244) (0.0180) (0.0244)
Affiliates EU · Crisis 0.0133 0.0126(0.0115) (0.0135)
Affiliates Latin America · Crisis 0.00168 0.0222(0.0169) (0.0200)
Affiliates rest of OECD · Crisis -0.00833 -0.00840(0.0223) (0.0308)
Affiliates rest of world · Crisis -0.0223 -0.0446*(0.0241) (0.0232)
Observations 7,434 6,414 7,434 6,414 7,434 6,414R2 (within) 0.081 0.182 0.083 0.185 0.084 0.188
Notes: The table shows estimates of variants of equation (10) augmented by the listed interaction terms. Thedependent variable is the export share. Foreign is a dummy variable indicating foreign ownership. FinVul is thefinancial vulnerability of the firm measured by the debt service-to-sales ratio in 2008. Crisis is a dummy variableindicating the period 2009–2012. All estimations include the Foreign dummy, a full set of two-way interactionterms between Foreign, FinVul, and Crisis, as well as firm fixed effects and industry-year fixed effects. Robuststandard errors (in parentheses) are clustered at the firm level. *,**,*** denote significance at the 10%, 5%, 1%levels, respectively.
To see whether this possibility is relevant in the context of our analysis, we estimate a specificationthat further includes a set of interaction terms between the Crisis dummy and dummy variablesindicating the presence of foreign affiliates in each world region in 2006. We find no evidence thatfirms with foreign affiliates in a given world region experienced a more or less pronounced declinein exports during the crisis; see columns (5) and (6) of Table 8.
4.6.3 Fractional probit estimations
Next, we account for the fact that our dependent variable, the export share, is a fractional responsevariable that is naturally bounded between zero and one. For this reason, our linear fixed effectsestimator may deliver inconsistent estimates of the treatment effect. To evaluate whether this is aproblem in our application, we estimate a fractional probit model. Two complications arise with
35
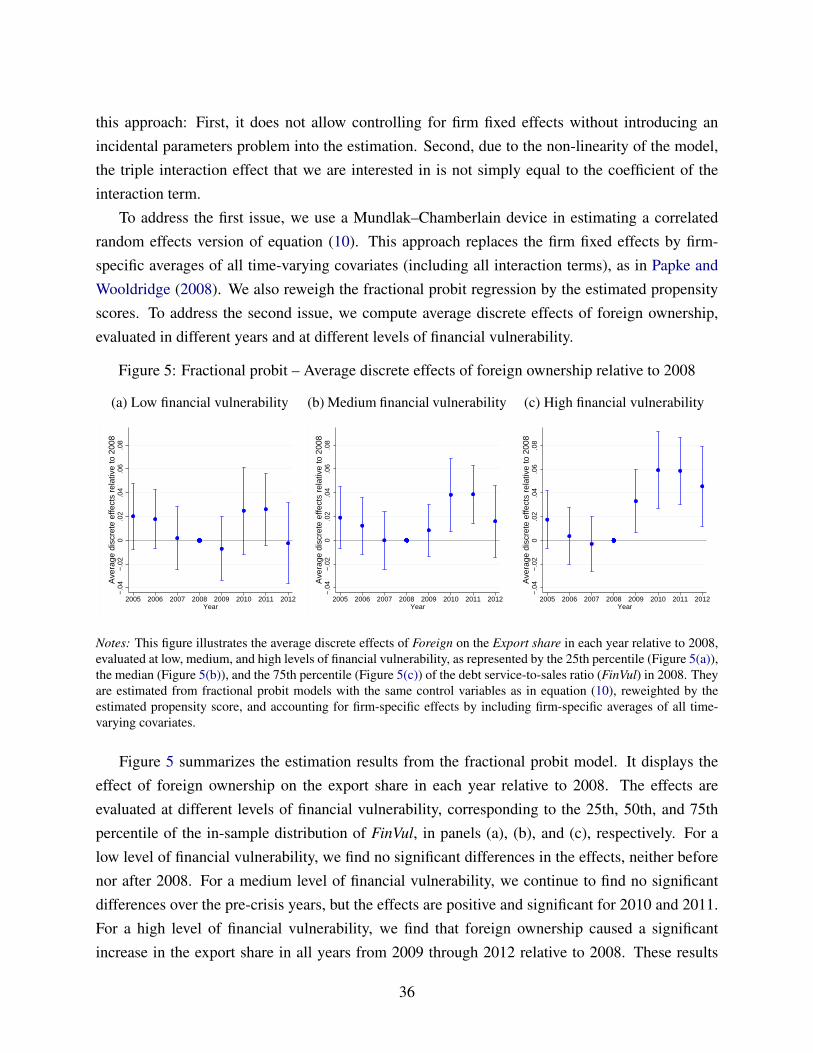
this approach: First, it does not allow controlling for firm fixed effects without introducing anincidental parameters problem into the estimation. Second, due to the non-linearity of the model,the triple interaction effect that we are interested in is not simply equal to the coefficient of theinteraction term.
To address the first issue, we use a Mundlak–Chamberlain device in estimating a correlatedrandom effects version of equation (10). This approach replaces the firm fixed effects by firm-specific averages of all time-varying covariates (including all interaction terms), as in Papke andWooldridge (2008). We also reweigh the fractional probit regression by the estimated propensityscores. To address the second issue, we compute average discrete effects of foreign ownership,evaluated in different years and at different levels of financial vulnerability.
Figure 5: Fractional probit – Average discrete effects of foreign ownership relative to 2008
(a) Low financial vulnerability
−.0
4−
.02
0.0
2.0
4.0
6.0
8A
vera
ge d
iscr
ete
effe
cts
rela
tive
to 2
008
2005 2006 2007 2008 2009 2010 2011 2012Year
(b) Medium financial vulnerability
−.0
4−
.02
0.0
2.0
4.0
6.0
8A
vera
ge d
iscr
ete
effe
cts
rela
tive
to 2
008
2005 2006 2007 2008 2009 2010 2011 2012Year
(c) High financial vulnerability
−.0
4−
.02
0.0
2.0
4.0
6.0
8A
vera
ge d
iscr
ete
effe
cts
rela
tive
to 2
008
2005 2006 2007 2008 2009 2010 2011 2012Year
Notes: This figure illustrates the average discrete effects of Foreign on the Export share in each year relative to 2008,evaluated at low, medium, and high levels of financial vulnerability, as represented by the 25th percentile (Figure 5(a)),the median (Figure 5(b)), and the 75th percentile (Figure 5(c)) of the debt service-to-sales ratio (FinVul) in 2008. Theyare estimated from fractional probit models with the same control variables as in equation (10), reweighted by theestimated propensity score, and accounting for firm-specific effects by including firm-specific averages of all time-varying covariates.
Figure 5 summarizes the estimation results from the fractional probit model. It displays theeffect of foreign ownership on the export share in each year relative to 2008. The effects areevaluated at different levels of financial vulnerability, corresponding to the 25th, 50th, and 75thpercentile of the in-sample distribution of FinVul, in panels (a), (b), and (c), respectively. For alow level of financial vulnerability, we find no significant differences in the effects, neither beforenor after 2008. For a medium level of financial vulnerability, we continue to find no significantdifferences over the pre-crisis years, but the effects are positive and significant for 2010 and 2011.For a high level of financial vulnerability, we find that foreign ownership caused a significantincrease in the export share in all years from 2009 through 2012 relative to 2008. These results
36
strongly support our main conclusions based on the linear model.
5 Conclusions
Foreign-owned firms are exceptionally successful on export markets along various margins. In thispaper, we argue theoretically and empirically that this fact can be explained by the role of foreignownership in mitigating financial constraints. In terms of theory, we introduce ownership differ-ences in access to finance into a canonical trade model featuring firm heterogeneity and capitalmarket imperfections (Manova, 2013). In the model, foreign-owned firms can raise export financeby tapping into additional funds via their foreign parent’s internal capital market, an option that isunavailable to domestically owned firms. This provides foreign-owned firms with a financial ad-vantage that allows them to maintain higher export levels and shares than their domestically ownedcompetitors. Crucially, the model predicts that this financial advantage of foreign ownership willbe more pronounced among financially vulnerable firms.
In our empirical analysis, we exploit rich firm-level data from Spain and leverage the globalfinancial crisis as an exogenous shock to credit market conditions. We propose a triple differencesidentification strategy that exploits variation in the ownership structure of firms (foreign vs. domes-tic), the timing of the financial crisis, and firms’ financial vulnerability just before the crisis. Ourestimations reveal clear-cut evidence that the credit supply shock in the financial crisis increasedthe exports of foreign-owned compared to domestically owned firms. Consistent with a financialadvantage of foreign ownership, we find that this differential effect was significantly larger amongfirms that entered the crisis with higher degrees of financial vulnerability.
We further contribute to the literature by investigating how using the distribution network oftheir foreign parent contributed to promoting the exports of foreign-owned firms in the crisis.This allows us to shed light on hitherto unexplored interdependencies between this market accesschannel and the credit channel discussed before. The evidence suggests that using their parent’sdistribution network serves to reduce the exporting costs of foreign-owned firms and thereby miti-gates financial problems. Consistent with this interpretation, exports in the crisis were increasinglychanneled through the foreign parents’ distribution network.
Our findings point to significant firm-level complementarities between FDI and trade, whichgained particular importance in the crisis. More specifically, the financial advantage of foreignownership that we have identified suggests that multinational firms can play an important role incircumventing cross-border frictions in capital markets, which in turn proves to be particularlybeneficial for international trade. These interdependencies should be duly taken into account indesigning effective policies regulating FDI and trade.
37
References
Ahn, J., M. Amiti, and D. E. Weinstein, “Trade Finance and the Great Trade Collapse,” American
Economic Review, 2011, 101 (3), 298–302.
Alfaro, L. and M. X. Chen, “Surviving the Global Financial Crisis: Foreign Ownership andEstablishment Performance,” American Economic Journal: Economic Policy, 2012, 4 (3), 30–55.
Alvarez, R. and H. Gorg, “Multinationals as Stabilizers? Economic Crisis and Plant EmploymentGrowth,” IZA Discussion Papers 2692, Institute for the Study of Labor (IZA) March 2007.
Amiti, M. and D. E. Weinstein, “Exports and Financial Shocks,” The Quarterly Journal of Eco-
nomics, 2011, 126 (4), 1841–1877.
Antras, P. and C. F. Foley, “Poultry in Motion: A Study of International Trade Finance Practices,”Journal of Political Economy, 2015, 123 (4), 853–901.
, M. A. Desai, and C. F. Foley, “Multinational Firms, FDI Flows, and Imperfect Capital Mar-kets,” The Quarterly Journal of Economics, 2009, 124 (3), 1171–1219.
Arnold, J. M. and B. S. Javorcik, “Gifted Kids or Pushy Parents? Foreign Direct Investment andPlant Productivity in Indonesia,” Journal of International Economics, 2009, 79 (1), 42–53.
Auboin, M., “Boosting the Availability of Trade Finance in the Current Crisis: Background Anal-ysis for a Substantial G20 Package,” CEPR Policy Insight 35, CEPR 2009.
Beck, T., “Financial Development and International Trade: Is There a Link?,” Journal of Interna-
tional Economics, 2002, 57 (1), 107–131.
, A. Demirguc-Kunt, L. Laeven, and R. Levine, “Finance, Firm Size, and Growth,” Journal of
Money, Credit and Banking, 2008, 40 (7), 1379–1405.
Behrens, K., G. Corcos, and G. Mion, “Trade Crisis? What Trade Crisis?,” Review of Economics
and Statistics, 2013, 95 (2), 702–709.
Berman, N. and J. Hericourt, “Financial factors and the margins of trade: Evidence from cross-country firm-level data,” Journal of Development Economics, 2010, 93 (2), 206–217.
Boddin, D., H. Raff, and N. Trofimenko, “Foreign Ownership and the Export and Import Propen-sities of Developing-country Firms,” The World Economy, 2017, 40 (12), 2543–2563.
38
Bricongne, J.-C., L. Fontagne, G. Gaulier, D. Taglioni, and V. Vicard, “Firms and the GlobalCrisis: French Exports in the Turmoil,” Journal of International Economics, 2012, 87 (1), 134–146.
Caves, D. W., L. R. Christensen, and W. Diewert, “The Economic Theory of Index Numbers andthe Measurement of Input, Output, and Productivity,” Econometrica, 1982, 50 (6), 1393–1414.
Chaney, T., “Liquidity Constrained Exporters,” Journal of Economic Dynamics and Control, 2016,72 (C), 141–154.
Chor, D. and K. Manova, “Off the Cliff and Back? Credit Conditions and International Tradeduring the Global Financial Crisis,” Journal of International Economics, 2012, 87 (1), 117–133.
Delgado, M. A., J. C. F. nas, and S. Ruano, “Firm Productivity and Export Markets: A Non-parametric Approach,” Journal of International Economics, 2002, 57 (2), 397–422.
Desai, M. A., C. F. Foley, and J. R. Hines, “A Multinational Perspective on Capital StructureChoice and Internal Capital Markets,” The Journal of Finance, 2004, 59 (6), 2451–2487.
Desai, M. A., C. F. Foley, and K. J. Forbes, “Financial Constraints and Growth: Multinationaland Local Firm Responses to Currency Depreciations,” Review of Financial Studies, November2008, 21 (6), 2857–2888.
Egger, P. and C. Keuschnigg, “Access to Credit and Comparative Advantage,” Canadian Journal
of Economics, 2017, 50 (2), 481–505.
, , V. Merlo, and G. Wamser, “Corporate Taxes and Internal Borrowing within MultinationalFirms,” American Economic Journal: Economic Policy, 2014, 6 (2), 54–93.
Eppinger, P., N. Meythaler, M.-M. Sindlinger, and M. Smolka, “The Great Trade Collapse andthe Spanish Export Miracle: Firm-level Evidence from the Crisis,” The World Economy, 2018,41 (2), 457–493.
Feenstra, R. C., Z. Li, and M. Yu, “Exports and Credit Constraints under Incomplete Information:Theory and Evidence from China,” The Review of Economics and Statistics, 2014, 96 (3), 729–744.
Foley, C. and K. Manova, “International Trade, Multinational Activity, and Corporate Finance,”Annual Review of Economics, 2015, 7 (1), 119–146.
39
Fons-Rosen, C., S. Kalemli-Ozcan, B. E. Sørensen, C. Villegas-Sanchez, and V. Volosovych,“Quantifying Productivity Gains from Foreign Investment,” 2019. University of California atMerced, mimeo.
Garicano, L. and C. Steinwender, “Survive Another Day: Using Changes in the Composition ofInvestments to Measure the Cost of Credit Constraints,” The Review of Economics and Statistics,2016, 98 (5), 913–924.
Gertler, M. and S. Gilchrist, “Monetary Policy, Business Cycles, and the Behavior of SmallManufacturing Firms,” Quarterly Journal of Economics, 1994, 109 (2), 309–340.
Gertner, R. H., D. S. Scharfstein, and J. C. Stein, “Internal versus External Capital Markets,”The Quarterly Journal of Economics, 1994, 109 (4), 1211–30.
Greenaway, D., A. Guariglia, and R. Kneller, “Financial Factors and Exporting Decisions,”Journal of International Economics, 2007, 73 (2), 377–395.
Guadalupe, M., O. Kuzmina, and C. Thomas, “Innovation and Foreign Ownership,” American
Economic Review, 2012.
Guiso, L., P. Sapienza, and L. Zingales, “Does Local Financial Development Matter?,” Quarterly
Journal of Economics, 2004, 119 (3), 929–969.
Hirano, K., G. W. Imbens, and G. Ridder, “Efficient Estimation of Average Treatment EffectsUsing the Estimated Propensity Score,” Econometrica, 2003, 71 (4), 1161–1189.
Javorcik, B. and S. Poelhekke, “Former Foreign Affiliates: Cast Out and Outperformed?,” Jour-
nal of the European Economic Association, 2017, 15 (3), 501–539.
Kletzer, K. and P. Bardhan, “Credit Markets and Patterns of International Trade,” Journal of
Development Economics, 1987, 27 (1-2), 57–70.
Koch, M. and M. Smolka, “Foreign Ownership and Skill-biased Technological Change,” Journal
of International Economics, 2019, 118, 84–104.
Manova, K., “Credit Constraints, Equity Market Liberalizations and International Trade,” Journal
of International Economics, 2008, 76 (1), 33–47.
, “Credit Constraints, Heterogeneous Firms, and International Trade,” Review of Economic Stud-
ies, 2013, 80 (2), 711–744.
, S.-J. Wei, and Z. Zhang, “Firm Exports and Multinational Activity under Credit Constraints,”Review of Economics and Statistics, 2015, 97 (3), 574–588.
40

Melitz, M. J., “The Impact of Trade on Intra-Industry Reallocations and Aggregate Industry Pro-ductivity,” Econometrica, 2003, 71 (6), 1695–1725.
Minetti, R. and S. C. Zhu, “Credit Constraints and Firm Export: Microeconomic Evidence fromItaly,” Journal of International Economics, 2011, 83 (2), 109–125.
, P. Murro, Z. Rotondi, and S. C. Zhu, “Financial Constraints, Firms’ Supply Chains, andInternationalization,” Journal of the European Economic Association, 01 2018, 17 (2), 327–375.
Muuls, M., “Exporters, Importers and Credit Constraints,” Journal of International Economics,2015, 95 (2), 333–343.
Papke, L. E. and J. M. Wooldridge, “Panel data methods for fractional response variables withan application to test pass rates,” Journal of Econometrics, July 2008, 145 (1-2), 121–133.
Paravisini, D., V. Rappoport, P. Schnabl, and D. Wolfenzon, “Dissecting the Effect of CreditSupply on Trade: Evidence from Matched Credit-Export Data,” The Review of Economic Stud-
ies, 2014.
Raff, H. and J. Wagner, “Foreign Ownership and the Extensive Margins of Exports: Evidencefor Manufacturing Enterprises in Germany,” The World Economy, 2014, 37 (5), 579–591.
Schmidt-Eisenlohr, T., “Towards a Theory of Trade Finance,” Journal of International Eco-
nomics, 2013, 91 (1), 96–112.
Wang, J. and X. Wang, “Benefits of Foreign Ownership: Evidence from Foreign Direct Invest-ment in China,” Journal of International Economics, 2015, 97 (2), 325–338.
41
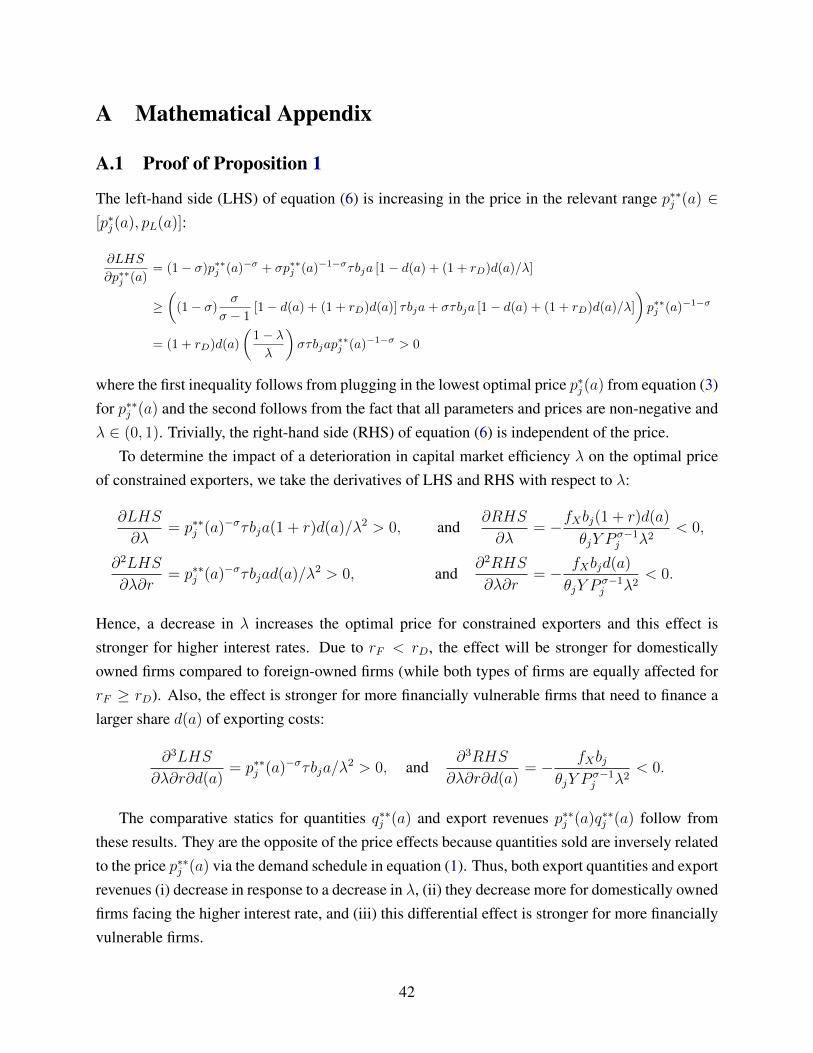
A Mathematical Appendix
A.1 Proof of Proposition 1
The left-hand side (LHS) of equation (6) is increasing in the price in the relevant range p∗∗j (a) ∈[p∗j(a), pL(a)]:
∂LHS
∂p∗∗j (a)= (1− σ)p∗∗j (a)−σ + σp∗∗j (a)−1−στbja [1− d(a) + (1 + rD)d(a)/λ]
≥((1− σ) σ
σ − 1[1− d(a) + (1 + rD)d(a)] τbja+ στbja [1− d(a) + (1 + rD)d(a)/λ]
)p∗∗j (a)−1−σ
= (1 + rD)d(a)
(1− λλ
)στbjap
∗∗j (a)−1−σ > 0
where the first inequality follows from plugging in the lowest optimal price p∗j(a) from equation (3)for p∗∗j (a) and the second follows from the fact that all parameters and prices are non-negative andλ ∈ (0, 1). Trivially, the right-hand side (RHS) of equation (6) is independent of the price.
To determine the impact of a deterioration in capital market efficiency λ on the optimal priceof constrained exporters, we take the derivatives of LHS and RHS with respect to λ:
∂LHS
∂λ= p∗∗j (a)−στbja(1 + r)d(a)/λ2 > 0, and
∂RHS
∂λ= −fXbj(1 + r)d(a)
θjY Pσ−1j λ2
< 0,
∂2LHS
∂λ∂r= p∗∗j (a)−στbjad(a)/λ2 > 0, and
∂2RHS
∂λ∂r= − fXbjd(a)
θjY Pσ−1j λ2
< 0.
Hence, a decrease in λ increases the optimal price for constrained exporters and this effect isstronger for higher interest rates. Due to rF < rD, the effect will be stronger for domesticallyowned firms compared to foreign-owned firms (while both types of firms are equally affected forrF ≥ rD). Also, the effect is stronger for more financially vulnerable firms that need to finance alarger share d(a) of exporting costs:
∂3LHS
∂λ∂r∂d(a)= p∗∗j (a)−στbja/λ
2 > 0, and∂3RHS
∂λ∂r∂d(a)= − fXbj
θjY Pσ−1j λ2
< 0.
The comparative statics for quantities q∗∗j (a) and export revenues p∗∗j (a)q∗∗j (a) follow fromthese results. They are the opposite of the price effects because quantities sold are inversely relatedto the price p∗∗j (a) via the demand schedule in equation (1). Thus, both export quantities and exportrevenues (i) decrease in response to a decrease in λ, (ii) they decrease more for domestically ownedfirms facing the higher interest rate, and (iii) this differential effect is stronger for more financiallyvulnerable firms.
42
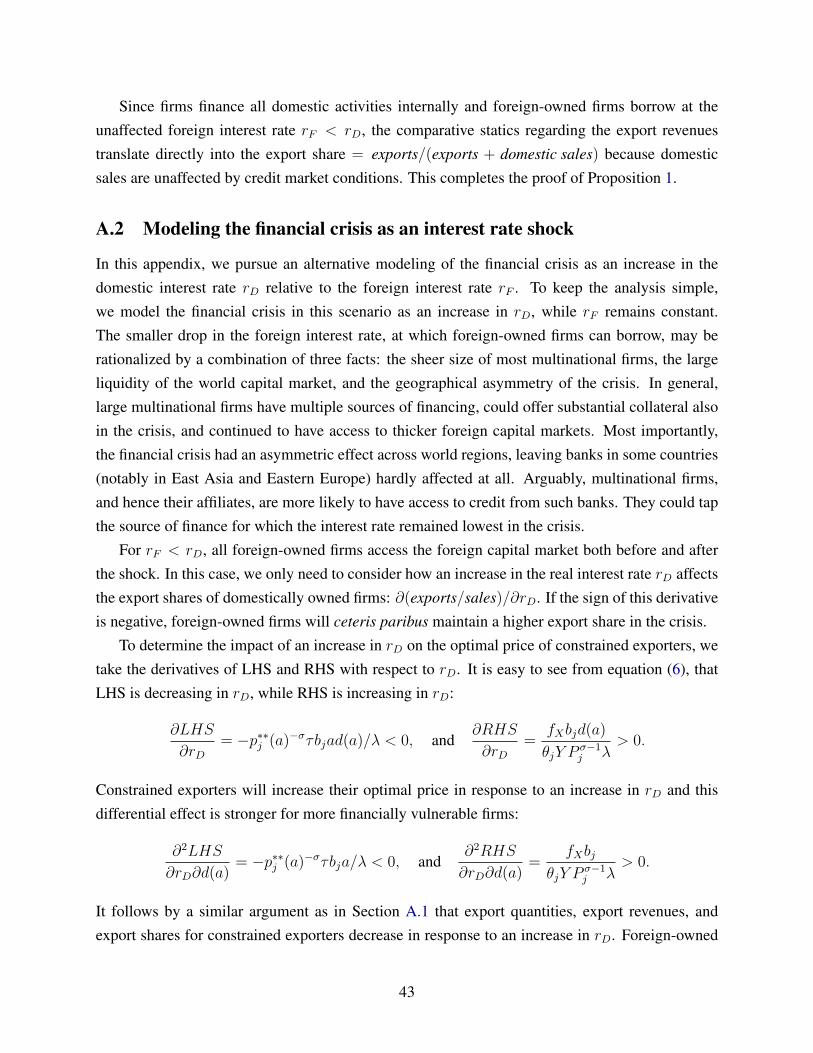
Since firms finance all domestic activities internally and foreign-owned firms borrow at theunaffected foreign interest rate rF < rD, the comparative statics regarding the export revenuestranslate directly into the export share = exports/(exports + domestic sales) because domesticsales are unaffected by credit market conditions. This completes the proof of Proposition 1.
A.2 Modeling the financial crisis as an interest rate shock
In this appendix, we pursue an alternative modeling of the financial crisis as an increase in thedomestic interest rate rD relative to the foreign interest rate rF . To keep the analysis simple,we model the financial crisis in this scenario as an increase in rD, while rF remains constant.The smaller drop in the foreign interest rate, at which foreign-owned firms can borrow, may berationalized by a combination of three facts: the sheer size of most multinational firms, the largeliquidity of the world capital market, and the geographical asymmetry of the crisis. In general,large multinational firms have multiple sources of financing, could offer substantial collateral alsoin the crisis, and continued to have access to thicker foreign capital markets. Most importantly,the financial crisis had an asymmetric effect across world regions, leaving banks in some countries(notably in East Asia and Eastern Europe) hardly affected at all. Arguably, multinational firms,and hence their affiliates, are more likely to have access to credit from such banks. They could tapthe source of finance for which the interest rate remained lowest in the crisis.
For rF < rD, all foreign-owned firms access the foreign capital market both before and afterthe shock. In this case, we only need to consider how an increase in the real interest rate rD affectsthe export shares of domestically owned firms: ∂(exports/sales)/∂rD. If the sign of this derivativeis negative, foreign-owned firms will ceteris paribus maintain a higher export share in the crisis.
To determine the impact of an increase in rD on the optimal price of constrained exporters, wetake the derivatives of LHS and RHS with respect to rD. It is easy to see from equation (6), thatLHS is decreasing in rD, while RHS is increasing in rD:
∂LHS
∂rD= −p∗∗j (a)−στbjad(a)/λ < 0, and
∂RHS
∂rD=
fXbjd(a)
θjY Pσ−1j λ
> 0.
Constrained exporters will increase their optimal price in response to an increase in rD and thisdifferential effect is stronger for more financially vulnerable firms:
∂2LHS
∂rD∂d(a)= −p∗∗j (a)−στbja/λ < 0, and
∂2RHS
∂rD∂d(a)=
fXbj
θjY Pσ−1j λ
> 0.
It follows by a similar argument as in Section A.1 that export quantities, export revenues, andexport shares for constrained exporters decrease in response to an increase in rD. Foreign-owned
43
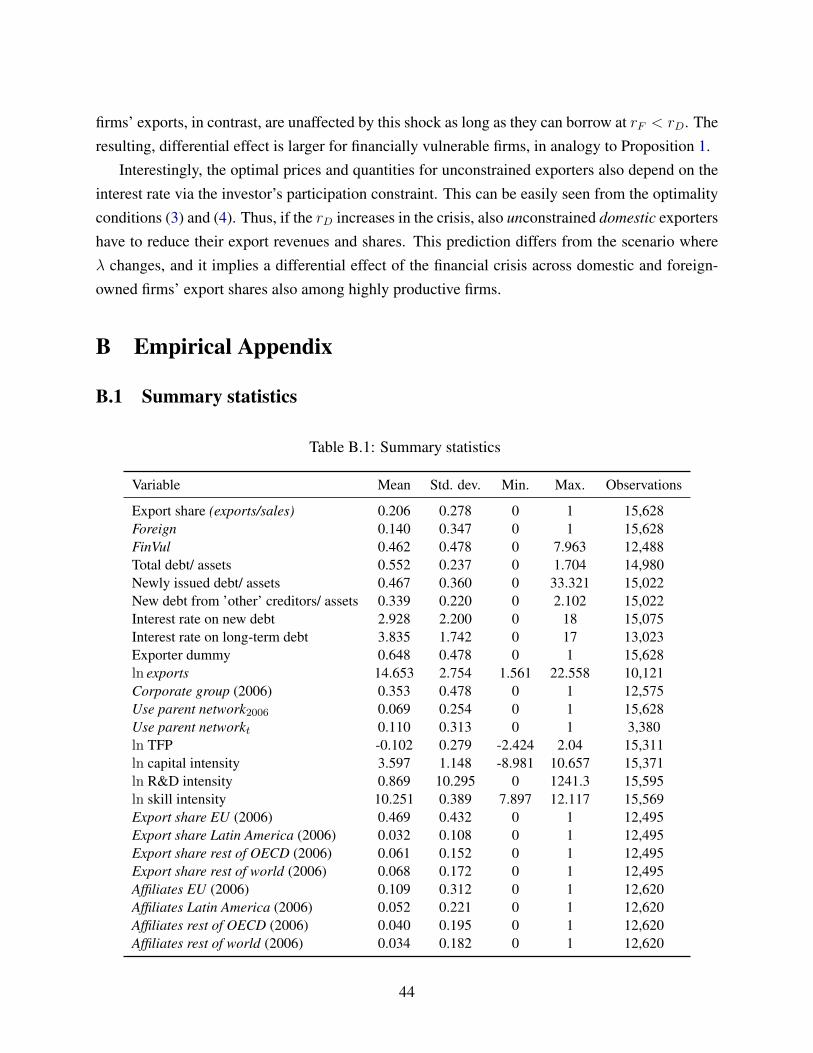
firms’ exports, in contrast, are unaffected by this shock as long as they can borrow at rF < rD. Theresulting, differential effect is larger for financially vulnerable firms, in analogy to Proposition 1.
Interestingly, the optimal prices and quantities for unconstrained exporters also depend on theinterest rate via the investor’s participation constraint. This can be easily seen from the optimalityconditions (3) and (4). Thus, if the rD increases in the crisis, also unconstrained domestic exportershave to reduce their export revenues and shares. This prediction differs from the scenario whereλ changes, and it implies a differential effect of the financial crisis across domestic and foreign-owned firms’ export shares also among highly productive firms.
B Empirical Appendix
B.1 Summary statistics
Table B.1: Summary statistics
Variable Mean Std. dev. Min. Max. Observations
Export share (exports/sales) 0.206 0.278 0 1 15,628Foreign 0.140 0.347 0 1 15,628FinVul 0.462 0.478 0 7.963 12,488Total debt/ assets 0.552 0.237 0 1.704 14,980Newly issued debt/ assets 0.467 0.360 0 33.321 15,022New debt from ’other’ creditors/ assets 0.339 0.220 0 2.102 15,022Interest rate on new debt 2.928 2.200 0 18 15,075Interest rate on long-term debt 3.835 1.742 0 17 13,023Exporter dummy 0.648 0.478 0 1 15,628ln exports 14.653 2.754 1.561 22.558 10,121Corporate group (2006) 0.353 0.478 0 1 12,575Use parent network2006 0.069 0.254 0 1 15,628Use parent networkt 0.110 0.313 0 1 3,380ln TFP -0.102 0.279 -2.424 2.04 15,311ln capital intensity 3.597 1.148 -8.981 10.657 15,371ln R&D intensity 0.869 10.295 0 1241.3 15,595ln skill intensity 10.251 0.389 7.897 12.117 15,569Export share EU (2006) 0.469 0.432 0 1 12,495Export share Latin America (2006) 0.032 0.108 0 1 12,495Export share rest of OECD (2006) 0.061 0.152 0 1 12,495Export share rest of world (2006) 0.068 0.172 0 1 12,495Affiliates EU (2006) 0.109 0.312 0 1 12,620Affiliates Latin America (2006) 0.052 0.221 0 1 12,620Affiliates rest of OECD (2006) 0.040 0.195 0 1 12,620Affiliates rest of world (2006) 0.034 0.182 0 1 12,620
44
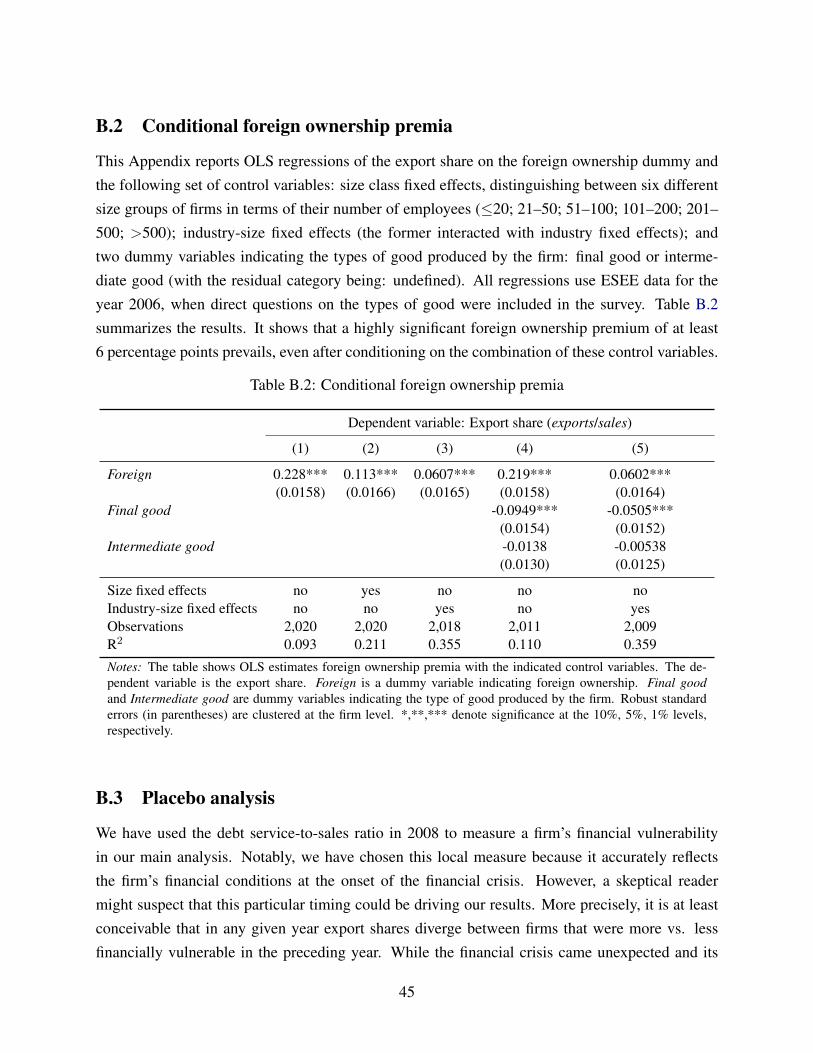
B.2 Conditional foreign ownership premia
This Appendix reports OLS regressions of the export share on the foreign ownership dummy andthe following set of control variables: size class fixed effects, distinguishing between six differentsize groups of firms in terms of their number of employees (≤20; 21–50; 51–100; 101–200; 201–500; >500); industry-size fixed effects (the former interacted with industry fixed effects); andtwo dummy variables indicating the types of good produced by the firm: final good or interme-diate good (with the residual category being: undefined). All regressions use ESEE data for theyear 2006, when direct questions on the types of good were included in the survey. Table B.2summarizes the results. It shows that a highly significant foreign ownership premium of at least6 percentage points prevails, even after conditioning on the combination of these control variables.
Table B.2: Conditional foreign ownership premia
Dependent variable: Export share (exports/sales)
(1) (2) (3) (4) (5)
Foreign 0.228*** 0.113*** 0.0607*** 0.219*** 0.0602***(0.0158) (0.0166) (0.0165) (0.0158) (0.0164)
Final good -0.0949*** -0.0505***(0.0154) (0.0152)
Intermediate good -0.0138 -0.00538(0.0130) (0.0125)
Size fixed effects no yes no no noIndustry-size fixed effects no no yes no yesObservations 2,020 2,020 2,018 2,011 2,009R2 0.093 0.211 0.355 0.110 0.359
Notes: The table shows OLS estimates foreign ownership premia with the indicated control variables. The de-pendent variable is the export share. Foreign is a dummy variable indicating foreign ownership. Final goodand Intermediate good are dummy variables indicating the type of good produced by the firm. Robust standarderrors (in parentheses) are clustered at the firm level. *,**,*** denote significance at the 10%, 5%, 1% levels,respectively.
B.3 Placebo analysis
We have used the debt service-to-sales ratio in 2008 to measure a firm’s financial vulnerabilityin our main analysis. Notably, we have chosen this local measure because it accurately reflectsthe firm’s financial conditions at the onset of the financial crisis. However, a skeptical readermight suspect that this particular timing could be driving our results. More precisely, it is at leastconceivable that in any given year export shares diverge between firms that were more vs. lessfinancially vulnerable in the preceding year. While the financial crisis came unexpected and its
45
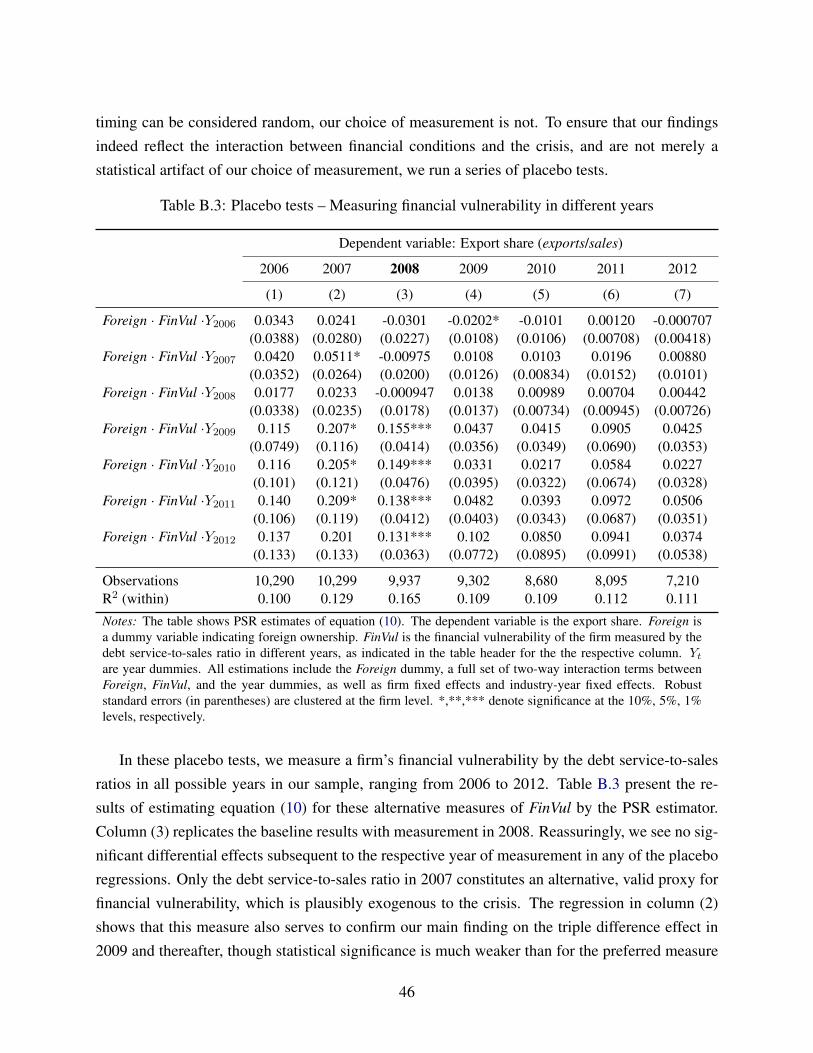
timing can be considered random, our choice of measurement is not. To ensure that our findingsindeed reflect the interaction between financial conditions and the crisis, and are not merely astatistical artifact of our choice of measurement, we run a series of placebo tests.
Table B.3: Placebo tests – Measuring financial vulnerability in different years
Dependent variable: Export share (exports/sales)
2006 2007 2008 2009 2010 2011 2012
(1) (2) (3) (4) (5) (6) (7)
Foreign · FinVul ·Y2006 0.0343 0.0241 -0.0301 -0.0202* -0.0101 0.00120 -0.000707(0.0388) (0.0280) (0.0227) (0.0108) (0.0106) (0.00708) (0.00418)
Foreign · FinVul ·Y2007 0.0420 0.0511* -0.00975 0.0108 0.0103 0.0196 0.00880(0.0352) (0.0264) (0.0200) (0.0126) (0.00834) (0.0152) (0.0101)
Foreign · FinVul ·Y2008 0.0177 0.0233 -0.000947 0.0138 0.00989 0.00704 0.00442(0.0338) (0.0235) (0.0178) (0.0137) (0.00734) (0.00945) (0.00726)
Foreign · FinVul ·Y2009 0.115 0.207* 0.155*** 0.0437 0.0415 0.0905 0.0425(0.0749) (0.116) (0.0414) (0.0356) (0.0349) (0.0690) (0.0353)
Foreign · FinVul ·Y2010 0.116 0.205* 0.149*** 0.0331 0.0217 0.0584 0.0227(0.101) (0.121) (0.0476) (0.0395) (0.0322) (0.0674) (0.0328)
Foreign · FinVul ·Y2011 0.140 0.209* 0.138*** 0.0482 0.0393 0.0972 0.0506(0.106) (0.119) (0.0412) (0.0403) (0.0343) (0.0687) (0.0351)
Foreign · FinVul ·Y2012 0.137 0.201 0.131*** 0.102 0.0850 0.0941 0.0374(0.133) (0.133) (0.0363) (0.0772) (0.0895) (0.0991) (0.0538)
Observations 10,290 10,299 9,937 9,302 8,680 8,095 7,210R2 (within) 0.100 0.129 0.165 0.109 0.109 0.112 0.111
Notes: The table shows PSR estimates of equation (10). The dependent variable is the export share. Foreign isa dummy variable indicating foreign ownership. FinVul is the financial vulnerability of the firm measured by thedebt service-to-sales ratio in different years, as indicated in the table header for the the respective column. Ytare year dummies. All estimations include the Foreign dummy, a full set of two-way interaction terms betweenForeign, FinVul, and the year dummies, as well as firm fixed effects and industry-year fixed effects. Robuststandard errors (in parentheses) are clustered at the firm level. *,**,*** denote significance at the 10%, 5%, 1%levels, respectively.
In these placebo tests, we measure a firm’s financial vulnerability by the debt service-to-salesratios in all possible years in our sample, ranging from 2006 to 2012. Table B.3 present the re-sults of estimating equation (10) for these alternative measures of FinVul by the PSR estimator.Column (3) replicates the baseline results with measurement in 2008. Reassuringly, we see no sig-nificant differential effects subsequent to the respective year of measurement in any of the placeboregressions. Only the debt service-to-sales ratio in 2007 constitutes an alternative, valid proxy forfinancial vulnerability, which is plausibly exogenous to the crisis. The regression in column (2)shows that this measure also serves to confirm our main finding on the triple difference effect in2009 and thereafter, though statistical significance is much weaker than for the preferred measure
46

from 2008. To a lesser extent, the same pattern is also visible in the point estimates for measure-ment in 2006 (column (1)). We are aware that measures of financial vulnerability based on lateryears (2010–2012) are endogenous to the crisis, hence we abstain from interpreting these regres-sions. The main insight from columns (4)–(7) is that the point estimates for the triple interactioneffects show no suspicious pattern, while they are all insignificant. These non-results dispel anyconcerns related to the timing of our measurement of financial vulnerability.
47