firm entry, firm exit, and urban biased...
TRANSCRIPT

Firm Entry, Firm Exit, and Urban‐Biased Growth
Li Yu, Robert W. Jolly, and Peter F. Orazem
Working Paper No. 09018 August 2009
IOWA STATE UNIVERSITY Department of Economics Ames, Iowa, 50011‐1070
Iowa State University does not discriminate on the basis of race, color, age, religion, national origin, sexual orientation, gender identity, sex, marital status, disability, or status as a U.S. veteran. Inquiries can be directed to the Director of Equal Opportunity and Diversity, 3680 Beardshear Hall, (515) 294‐7612.

1
FIRM ENTRY, FIRM EXIT, AND URBAN-BIASED GROWTH
LI YU, ROBERT W. JOLLY, AND PETER F. ORAZEM
Iowa State University
August 25, 2009
ABSTRACT
We introduce a taxonomy that classifies industries using three criteria: net growth in the
number of firms; the interrelationship between firm entry and firm exit; and the degree of urban-
bias in industry growth. We show that in 9 of 15 two-digit NAICS industries investigated, there
is evidence of urban bias consistent with a comparative advantage to starting a business in urban
markets. The urban advantage is due primarily to faster firm entry rates. Urban and rural firms
have similar firm exit rates, consistent with a presumption that there are equal expected profit
rates conditional on entry across markets. Urban areas grow faster because they induce faster
firm entry and not because urban firms are more likely to succeed.
Key Words: Entry – Exit Pattern, Taxonomy, Urban-Bias, Expansion, Churning, Entrepreneurship, Economic Development JEL: L26, L53 We gratefully acknowledge financial support from the Iowa State Agricultural Entrepreneurship Program. Corresponding author is Li Yu, Department of Economics, Iowa State University, Ames, IA 50011-1070, Email: [email protected] Phone: (515) 294-6042.

2
I. INTRODUCTION
Firm entry and exit rates are positively correlated. The pattern was predicted by
Jovanovic (1982) and confirmed first using data on manufacturing. Industries with high rates of
firm entry have high rates of firm exit (Dunne, et al 1988 and Cable and Schwalbach, 1991).
Figure 1(a) shows the scatter plot of entry and exit rates by aggregate industry compiled from the
U.S. Census’ Business Dynamic Database over the 1977-2005 period.1 When entry and exit
rates are equal, the entry-exit combination will coincide with the 45o line. Construction has high
rates of entry and exit while manufacturing has relatively low rates of both. Growth in the
number of construction firms nationally has occurred because the entry rate exceeds the exit rate
by a substantial amount, whereas the nearly stable number of manufacturing firms in the United
States reflects a rate of firm entry that is roughly equal to the low manufacturing firm exit rate.
These large differences in entry and exit rates across industries are attributable to industry-
specific entry barriers, the intensity of competition, and the pace of technological innovations
(Dunne, et al, 1988; Herck, 1984; Geroski, 1995; Carree and Thurik, 1996).
Less well known is that a similar positive correlation between firm entry and exit rates
can be found by geographic designation. Figure 1(b) plots the average firm entry and exit rates
by state, using the same data base and 1977 - 2005 sample period. The positive correlation
between entry and exit is even more evident than in the industry averages.2 The implication is
that growth in firm numbers in states and in industries occurs because firms enter faster than they
die. Because all combinations lie above the 45o line, all states have experienced net growth in
firm numbers. The average establishment entry rate in the US is 12.6%, nearly 2% higher than
exit rate. 1 Data source: http://www.ces.census.gov/index.php/bds/. 2 The correlation between firm entry and exit rates is 0.77 by industry and 0.94 by state, using weights to correct for industry or state size.

3
Figure 1(b) also shows another stylized fact that is the focus of our paper. We classified
states into three groups according to their degree of urbanization: low, medium and high.3 The
most urban states tend to locate at the upper right of the scatter plot while the most rural states
are found at the lower left. The simple correlation between entry rate and percent rural
population is -0.33 and the correlation between exit rate and rural population percentage is -0.38.
The apparent negative correlation between rurality and firm entry or exit could be
spurious, a result of differences in the mix of industries that locate in rural and urban areas.
However, there are many reasons to suspect that population density matters for entry or exit,
regardless of industry. Stigler (1951) argued that the size of the market allows for greater
specialization according to comparative advantage, and so urban markets would foster more
entry of specialized firms and of large firms. Glaeser (1999) argues that agglomeration improves
the sharing of knowledge which increases labor productivity in cities, raising labor productivity
and making urban areas more attractive for innovative activity. There is strong evidence that
labor productivity and wages are higher in urban than in rural areas for comparably skilled
workers (Moretti, 2004; Glaeser and Maré, 2001). Empirical evidence supports that cities foster
more patents and more product innovations (Jaffe et al, 1993; Audretsch and Feldman, 1996).
Despite these presumptions that urban firms have significant advantages in entry over
their rural counterparts, urban firms do not necessarily have comparative advantages in exit.
Some studies argued that rural firms have survival advantages due to lower costs, less
competition, and fewer barriers to growth (Acs and Malecki, 2003; Arenius and Clercq, 2005).
Empirical work on rural and urban firm exit has yielded mixed results (Reynolds, et al (1995);
Fritsch et al (2006); Falck (2007); and Plummer and Headd (2008)). In fact, a firm, upon its
3 Small states have less than 65% of urban population. Medium states have urban population proportion between 65% and 90%. Large states have more than 90% of urban population.

4
entry, will simultaneously evaluate its potential salvage value if the venture fails. Rural firms
must consider a lower salvage value of their firms due to thinner markets for capital in small
towns. The lower potential salvage value can be viewed as a potential barrier to exit (Yu et al,
2009), and barriers to exit serve as barriers to entry (Eaton and Lipsey, 1980, MacDonald, 1986).
This paper examines evidence of whether there is a geographic element to the patterns of
firm entry and exit by industry. We first propose a taxonomy that allows us to characterize
industries by whether they exhibit a geographic growth bias: meaning that the industry tends
exhibits faster net growth in urban or rural markets. The taxonomy also indicates whether the
industry is adding or losing firms overall, and whether there is a systematic correlation between
firm entry and exit rates. The taxonomy shows that of 15 two-digit industries investigated, 9 are
biased toward urban areas and the remaining 6 are geographically neutral. Rural areas do not
have an apparent comparative advantage in any sector.
We then confirm that even though industry-specific factors explain most of the variation
in firm entry and exit rates, geographic factors are also important. Importantly, though, they are
much more important for firm entry than for firm exit rates. We argue that in competitive
markets in which expected marginal profit rates are equal across urban and rural markets, exit
rates conditional on entry should be randomly distributed across markets. However, numerous
presumed advantages of locating in an urban market such as more rapid innovation or higher
labor productivity can induce a more rapid entry rate. It is the faster entry rate in urban market
rather than a differential exit rate that explains faster urban growth in the number of firms.
The next section lays the foundation for the data and measurement or entry and exit.
Section three presents the taxonomy which is then applied to the data in section four. The fifth

5
section presents the ANOVA results. The final section concludes the paper and provides policy
implications.
II. DATA SOURCES AND MEASUREMENT OF ENTRY AND EXIT RATES
The national data that we have used to illustrate the stylized patterns of firm entry and
exit are not ideal for systematic evaluation of entry-exit patterns by market size and industry.
The state- and industry-level data mask large differences within states and within industries in
the level of urbanization. If market size matters, we require more detailed firm-level data. This
study requires a detailed database which includes firm dynamics at both regional and industrial
levels. However, a national database that would permit this analysis is not currently available4.
At most, we can use this taxonomy to analyze aggregated economy in the US, but cannot
perform the analysis for specific industries.
Such detailed firm-level data have been made available using the National Establishment
Time-Series (NETS) database (Walls and Associates, 2006). The NETS database identifies each
establishment using a unique Dun and Bradstreet (D&B) DUNS ID number. The data are only
made available on a state-by-state basis, and so multiple state analysis is prohibitively expensive.
We opted to use the IOWA-NETS data base. As we will show below, the Iowa data can
replicate the stylized facts we identified with the state-level and industry-level data sets, but it
provides the additional detail needed to test for a geographic role in explaining firm entry and
exit rates.
Iowa is particularly appropriate for our purposes because Iowa’s counties are almost
identical in geographic size, and so we can view them as 99 geographic experiments in which
economic activity is taking place. The population range across the 99 counties, from under 5,000 4 The United States Small Business Administration does provide firm birth and death information at county-industry level ( http://www.sba.gov/advo/research/data.html) in 2005-2006. However, this one year shot information may generate more variation from shock than time series information.

6
in Adams County to 375,000 in Polk County, provides the range of market sizes needed to
evaluate whether there exists an urban-rural bias to the more known positive correlation in firm
entry and exit across industries.
The firm information which we exploit in our analysis includes the firm’s year of birth,
the county in which the firm conducts business, the firm’s primary industrial classification,
whether the firm is still in operation by the end of 2004, and if not, when the firm shut down. If
the year a firm was established in a county lies between 1992 and 2004, then it is treated as an
entrant. If the year a firm died in a county lies between 1992 and 2004, excluding the cases
where the firm migrated to another county inside or outside Iowa, then it is designated as an
exiting firm5.
We focus on characterizing industry structure and industry dynamics, instead of firm
entry and exit decisions or determinations. The categorization into different types of industries
relies on the eight-digit Standard Industrial Classification (SIC) codes in the dataset. Because
the US Census Bureau switched to the North American Industrial Classification System
(NAICS) in place of the SIC codes during our sample period, a firm may change industrial
classifications even if the firm’s product line does not change. For this reason, Walls and
Associates generated a table that provides a one-to-one translation between SIC codes and
NAICS codes. Using that translation, we are able to provide a consistent two-digit NAICS code
to every establishment over the full sample period. To avoid an additional problem that only a
5 Establishments which disappeared because of a merger or acquisition but did not relocate are treated as continuing establishments.

7
small subset of farms has DUNS numbers, we restrict our attention to the non-agricultural firms6.
Entry rate entryijtδ for the industry j in county i during year t is defined as
ijt
entryijtentry
ijt Nn
=δ (1)
where entryijtn is the number of firms in industry j that newly entered county i during year t and
ijtN is the total number of firms in county i in industry j at the start of year t. Similarly, the exit
rate exitijtδ for the industry j in county i during year t is defined as
ijt
exitijtexit
ijt Nn
=δ (2)
where exitijtn is the number of firms in industry j that exited county i during year t.
The period-long measure of entry (exit) rate, or the average entry (exit) rate for the
industry j in the county i from 1992 to 2004, is defined as the weighted average of these annual
entry (exit) rates. The use of the averaged rates allows us to smooth out spurious variation in
entry or exit due to short-lived or atypical local economic expansions or contractions.
Specifically,
∑
∑∑
∑=
=
=
=
=⋅= 2004
1992
2004
19922004
19922004
1992 tijt
t
entryijt
t
tijt
ijt
ijt
entryijtentry
ij
N
n
N
NN
nδ (3)
and the corresponding average exit rate is
6 We had to drop industries that had very small numbers of firms or that were absent from some counties. The excluded industries included Mining, utilities, management of companies and enterprises, and administrative and waste services.

8
∑
∑
=
== 2004
1992
2004
1992
tijt
t
exitijt
exitij
N
nδ . (4)
Equations (3) and (4) are used to illustrate the patterns of firm birth and death across counties
within an industry which will be shown in the following section.
Industry specific state level entry rate entryjΔ is aggregated from the county level entry
rates. Similar to the definition in equation (3), the state level entry rate in industry j is defined as
∑
∑
=
==Δ 2004
1992
2004
1992
tit
t
entryjt
entryj
N
n. (5)
The state exit rate in the industry j is
∑
∑
=
==Δ 2004
1992
2004
1992
tit
t
exitjt
exitj
N
n (6)
where entryjtn and exit
jtn are the total number of firms entering or exiting from Iowa during the
analyzed period t respectively.
Figure 2 illustrates the Iowa county-level equivalent of the state-level data plotted in
Figure 1(b).7 Firm entry rates are plotted against firm exit rates across Iowa counties between
1992 and 2004. Circle size is proportional to county population. Counties are defined as large
when their population is greater than 100,000; medium when their population is greater than
25,000 but fewer than 100,000. The remaining counties with population less than 25,000 are
defined as small. The mean entry rate of 8.8% exceeds the mean exit rate of 7.5%. While both 7 The entry and exit rates for each industry are reported in Appendix Table A1.

9
rates are below the averages in the US, Iowa follows the national pattern in gaining firms
through higher rates of firm entry than exit. In addition, entry and exit rates are significantly
positively correlated. The regression line suggests that on average, two firms enter for every
firm that exits, a slightly larger ration than exists for the nation as a whole. The largest counties
are found disproportionately in the upper-right quadrant, mimicking the national pattern that
larger markets experience higher rates of firm entry and exit. In all these respects, the Iowa data
replicates national trends.
III. AN INDUSTRY TAXONOMY BASED ON PATTERNS OF GROWTH
In this section we develop a taxonomy to characterize entrepreneurial activity in two digit
NAICS code industries, incorporating business location into the model. We can illustrate the
taxonomy graphically using Figure 2. Each county is characterized by a point in a three
dimensional space, indicating if its growth is rural or urban biased, if it is expanding or
contracting and if its growth type is high churning, low churning or declining. The classification
is based on the location of the county relative to two reference lines: the 45o line and a fitted
regression line from a weighted regression of entry rates on exits rates across the 99 counties.
Each industry is classified along three dimensions:
• Is growth rural or urban biased?
• Is the industry expanding or contracting?
• Is the growth high churning, low churning or declining.
Table 1 outlines the three dimensions which we will relate back to the graphical
constructs. The taxonomy will make use of the scatter plot pattern relative to the reference lines
rather than to individual observations.

10
Geographical bias: If the majority of larger counties are located above the fitted line and
smaller counties lie below the fitted line, the industry is said to be urban biased in attracting
entrepreneurs. If instead, it is the smaller counties that locate disproportionately above the fitted
line, than the industry has a rural bias. If large and small counties are randomly located about the
fitted line, the industry is said to be geographically neural or unbiased.
Expanding/Contracting: The relationship between the fitted line and the 45o line allows
us to characterize the industry as expanding or contracting. If the fitted line lies above the 45o
throughout the range of exit rates, the industry is expanding. If instead, the fitted line lies below
the 45o line in range of exit rates, the industry is contracting. In cases where the fitted line and
the 45o line intersect, the industry has balanced growth in firm numbers.
Growth type: The estimated slope from the regression of entry rates on exit rates
indicates the industry’s development dynamics. If the slope is greater than 1, higher exit rates
are associated with even larger entry rates. In this case, we define the industry to be high
churning - the net gain in number of firms results from replacing mature firms by even more new
firms. If the slope is not different from 1, the entry rate is equal to exit rate and the industry is
defined as stable. If the slope is positive but less than 1, the industry experience net growth in
firm numbers in markets that experience low exit rates, while markets with high exit rates lose
firms, a pattern we label “low churning”. If the slope is zero, we define the industry as stagnant
with entry unrelated to exit. Finally, if the slope is negative, a case we do not find in our data,
high firm exit rates are associated with lower firm entry. That pattern would suggest that the
industry is in decline.
Figure 2 shows that when we treat each county as the unit of observation, the Iowa
economy is urban biased: the larger circles tend to lie above the dashed fitted line while the vast

11
majority of counties below the fitted line have the smaller circles. The Iowa economy is also
expanding: the fitted line lies above the 45o line for the full range of observed exit rates. Finally,
the estimated slope is 2, indicating that the Iowa economy is high churning: counties with the
largest net proportional gain in firm numbers tend to have the highest exit rates. However, this
pattern will not hold for every industry, and so we turn next to applying the taxonomy to
characterize individual sectors.
IV. APPLYING THE TAXONOMY TO INDIVIDUAL INDUSTRIES
In this section, we apply the taxonomy to the patterns of entry and exit for selected two
digit industries in 99 Iowa counties. For each industry, we generated a scatter plot of entry and
exit growth rates with the two reference lines. We will discuss a representative subset of graphs
shown in Figures 3(a-d) to illustrate the taxonomic range.8
Figure 3(a) shows the scatter plots for the construction industry. Construction is
characterized by stable growth, as indicated by a regression slope (0.91) that is not significantly
different form 1.0. The sector has an expanding numbers of firms over time because the fitted
line lies everywhere above the 45o line. The average entry rate, 8.7%, exceeds the exit rate 7.1%
for a net entry rate of 1.5% per year over thirteen years. Growth is biased toward urban areas.
The larger counties tend to have faster than average entry rates, while some smaller counties
locate below the 45o line, experiencing a net loss of construction establishments.
The scatter plot for the Iowa manufacturing industry is shown in Figure 3(b). The
regression coefficient is positive but statistically below 1.0, suggesting that manufacturing is
characterized by low churning growth. Counties wit the highest exit rates will not have enough
entry to replace their lost plants. The fitted line lies above the 45o line for almost the full range
8 The full complement of graphs can be examined in Yu et al (2008).

12
of ext rates, and so manufacturing is expanding. The annual entry rate (7.1%) is slightly larger
than the annual exit rate (6.1%) over the period. There is no atypical pattern of location by
geographic size, and so manufacturing is neutral with respect to geographic location. Small
counties are found both farthest above and farthest below the fitted line.
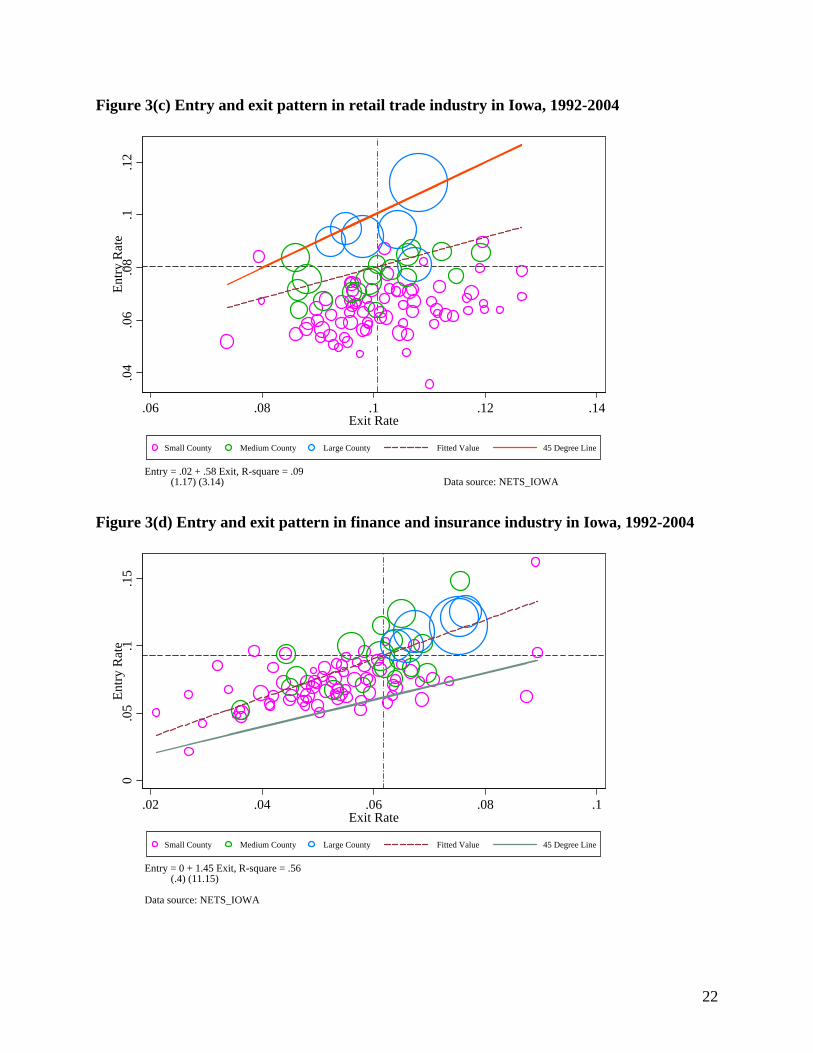
Figure 3(c) illustrates the patterns of growth for the Iowa retail trade sector. The
regression coefficient is well below 1.0 but above 0, and so the sector is low churning. The fitted
line lies everywhere below the 45o line, and so the number of establishments is contracting. .
The average state level exit rate is 10%, well above the average entry rate of 7.8%. Nearly all
counties lie below the 45o line indicating a net loss of establishments. The pattern is most
apparent for the smaller counties which also lie below the fitted line. Urban counties generally
lie above the fitted line and several are on the 45o line, bucking the general trend of declining
numbers. Of all sectors examined, the retail sector shows the clearest evidence of urban bias.
The scatter plots for Iowa’s finance and insurance industry are shown in Figure 3(d). The
regression coefficient is significantly greater than 1.0, and so this is an example of a high
churning industry. High exit rates are associated with even higher rates of new entry. The fitted
line lies above the 45o line throughout the relevant range, and so this sector is expanding: a net
gainer of financial and insurance firms. The average state level entry rate is 9.2% and the
average exit rate is 6.2%. Larger counties are all found on or above the fitted line, while the
smaller counties tend to lie below the fitted line, and so the sector also shows an urban bias.
Summary information for all two digit industries is found in Table 2 which places each
industry in its three dimensional cell as guided by the taxonomy. All regression slopes are
positive, although some are not significantly different from zero, and so we have no declining
industries. Three sectors are high churning with regression coefficients significantly larger than

13
one: information, finance and insurance and professional and technical services.9 Four sectors
have stable growth (construction, educational services, health care and other services) as
indicated by slopes not significantly different from one. Six cases have positive regression
coefficients that are significantly less than one and are characterized as low churning. Real estate
and public administration are stagnant with no discernable correlation between exit and entrance
rates.
While 9 of 15 industries have a bias toward urban counties, no sectors exhibit a rural bias.
Rural economic development efforts are best focused on the 6 sectors characterized by
geographic neutrality. Perhaps with 3-digit NAICS codes or finer, we could isolate sectors for
which rural areas have an apparent comparative advantage, but no such pattern exists at the 2-
digit level.
Most sectors have expanding numbers of firms over the sample period. Retail and
wholesale trade are contracting. Hotel/restaurant and other services had stable numbers of firms.
These patterns may be very different in other states. Again, knowledge of these patterns would
prove very useful in focusing development and recruiting efforts for specific markets.
V. HOW IMPORTANT IS PLACE VERSUS INDUSTRY IN FIRM ENTRY AND EXIT?
Thus far, we have found substantial variation in entry and exit rates across sectors. We
also have uncovered differences in the entry-exit patterns by the degree of urbanization in local
markets. It remains for us to establish whether the pattern of entry and exit rates across urban and
rural areas is just a reflection of the different mix of industries that locate in those markets, or if
the variation in firm entry and exit has a geographic as well as an industrial basis, or if firm entry
pattern is the same as exit pattern. We can evaluate this question using a two-factor Analysis of
9 We perform a one-sided t-test on the hypothesis that the slope is greater than one.

14
Variance (ANOVA) on the Iowa dataset. The analysis shown in Table 3 decomposes the
variance of entry rates, exit rates, and the difference between the two into components
explainable by industry–specific and county-specific factors. The unexplained variance reflects
factors uncorrelated with industry- or county-specific effects.
The squared variation in entry rates totals 0.756. Of this variance, 0.27 (36%) is
attributable industry-effects and 0.14 (19%) to county size. Both factors enter the model
significantly, leaving 45% unexplained. In contrast to the entry rates, exit rates are driven
largely by industry-specific factors. While industry-specific factors explain 68% of the variation,
variations across county markets explains only 4%. In other words, the explainable portion of
firm deaths is from causes related to the sector and not to the local market.10 That could give
pause to local efforts to keep firms alive in the face of economic hardship. Even if local market
downturns are transitory, a temporary local infusion of aid cannot alter the strength of the
sectoral market.
The difference between entry and exit is a measure of the pace of net growth in the
number of establishments. About two-thirds of the variation in net firm growth is attributable to
industry- specific factors while the local market explains only 8%.
Our ANOVA results help to illustrate why economic activity has tended to agglomerate
in the U.S. and in virtually all developed countries of the world. Local factors explain almost
one-fifth of the variation in entry rates across counties, but exit rates are nearly randomly
distributed across counties. As is easily seen in Figure 2, it is larger markets that foster entry.
All but one of the largest counties have larger than average entry rates (ie they locate above the
10 This is in sharp contrast to the conclusion by Falck (2007) who found that regional factors were important in explaining establishment declines. His analysis differs from ours in that his regional information was primarily at the state rather than the local level and because his analysis did not clearly decompose the variance between industry and regional factors.

15
mean entry rate), even as their exit rates are evenly divided in the upper and lower halves of the
exit rate distribution. All but 5 of the smallest counties are in the lower half of the entry rate
distribution, even as their exit rates are widely populated in both halves of the exit distribution.
This same regular pattern is repeated in Figures 3 (a, c, and d), the sectors where we see a
discernible urban bias.
The pattern of these results is consistent with the view of urban areas as “cauldrons of
creativity” (Florida, 2007, p. 159). Numerous papers have shown that urban areas foster various
types of innovative activity. Jaffe, Trajtenberg and Henderson (1993) found that patents tended
to cluster in SMSAs, consistent with models that suggest information spillovers are valuable for
growth. Similarly, Audretsch and Feldman (1996) found that the majority of new product
innovations were created in cities. Knowledge spillovers can make workers in urban areas more
productive than in rural areas (Glaeser and Maré (2001): simple proximity to concentrations of
other educated workers lowers the cost and increases the productivity of investments in
knowledge acquisition. Viewed in that light, new firm entry is another type of innovative
activity that occurs faster in urban than in rural markets.
Importantly, however, at the time of entry, competition will force the expected marginal
economic profit to be the same at zero across urban and rural areas (Moretti, 2004). Therefore,
even though urban areas will foster more innovative activity and more new entrants, there is no
greater likelihood of success conditional on entry compared to a rural area.11 Urban areas grow
faster, not because the likelihood of success conditional on entry is greater, but because the urban
areas foster more entry.
VI. CONCLUSION
11 In fact, Yu et al (2009) present evidence of a small but systematic higher probability of survival for rural firms.

16
In this paper, we find that in addition to industry fixed effects, differences between rural
and urban markets also affect net growth in firm numbers. These differences are sufficiently
systematic that they can be incorporated into a taxonomy that characterizes industries by the
relative size of their entry and exit rates, the extent of churning; and the extent of urban-bias in
net growth. We illustrate the application of the taxonomy to data on Iowa firm entry and exit by
county over a thirteen year period. Although inexpensively available data sets do not currently
allow an application of the taxonomy on nationally representative firm data, we show that our
data for Iowa are consistent with the stylized facts that can be generated using more aggregated
and nationally representative data.
The taxonomy shows that in 9 of 15 industries, entrepreneurial actives are biased toward
urban markets. None of industries grow faster in rural counties than in urban areas. Eleven out
of fifteen industries in Iowa are expanding, having a net gain in the number of firms. In 13 of 15
sectors, there is a significant positive correlation between entry and exit rates, with public
services and real estate being the only sectors where there is no apparent relationship.
We show that the source of the urban-bias is related more to higher entry rates in more
densely populated markets. If markets are competitive, the expected profit conditional on entry
should be the same in urban and rural markets. If firms are subject to random shocks to profit in
both urban and rural markets, we should not expect to see systematic differences in exit rates
across geographic markets. In fact, long-term exit rates differ systematically across sectoral
markets but not across geographic markets
We suggest that the taxonomic summaries are useful for development strategies. Policies
to foster industry expansion cannot be uniform. High churning industries such as information,
finance and insurance, and professional and technical services have the greatest growth in

17
markets that have large exit rates. While the relationship could be an accident of correlation, it is
plausible that new entrants benefit from low exit barriers which make it easier to cease
operations if the venture fails. High exit rates may also imply faster paced innovation, or the
availability of a secondary market for capital. In such markets, efforts to prevent the demise of
firms in high churning industries through tax concessions or public subsidies will be
counterproductive.
In low churning industries such as manufacturing or transportation and warehousing, the
fastest net growth in firm numbers occurs in markets with low rates of firm exit. In such
markets, public intervention to foster local firm growth using traditional firm retention and
expansion policies may work (Morse, 1990). However, even in these sectors, it may be
counterproductive to offer local subsidies to avoid the loss of a local firm. The ANOVA results
suggest that it is industry and not local market attributes that drive exits. Local subsidies will not
change prospects for the industry as a whole, and so it is not clear that short-term local subsidies
can alter a firm’s long-term survival.
Consistent with numerous theoretical and empirical studies, we find that urban areas
grow faster than rural areas, but we are able to add an additional reason: urban markets
experience faster net growth in firm numbers because they induce more entry and not because
firms have a greater chance of success in urban markets.

18
Figure 1(a) Entry and exit pattern by industries in United States, 1977-2005
AGR
MIN
CON
MAN
TCU
WHO
RETFIRESRV
.08
.1.1
2.1
4.1
6En
try R
ate
.09 .1 .11 .12 .13 .14Exit Rate
SIC industry 45 degree line
Data source: US Census Bureau
Note: Circle size reflects employment in the sector. For reference, we add a 45o line along which entry and exit rates are equal. The vertical and horizontal lines indicate the size-weighted mean exit and entry rates respectively. AGR: Agriculture, forestry, and fishing; MIN: Mining; CON: Construction; MAN: Manufacturing ; TCU: Transportation, communications, and utilties; WHO: Wholesale trade; RET: Retail trade; FIRE: Finance, insurance and real estate; SRV: Services.

19
Figure 1(b) Entry exit pattern across states in the US, 1977-2005
.1.1
2.1
4.1
6.1
8En
try R
ate
.09 .1 .11 .12 .13Exit Rate
Small State Medium State Large State Fitted Value 45 Degree Line
Entry =-0.04 + 1.57 Exit, R-square = .87 (-4.33) (17.53) Data source: US Census Bureau
Note: Small states are less than 65% urban; medium states have urban population shares between 65% and 90%; and large states are more than 90% urban. We add two other lines to assist in interpreting the entry exit patterns: an urban-population-proportion-weighted linear regression of entry rates against exit rates and the 45o line along which entry and exit rates are equal. The coefficients from the regression equation of entry rates on exit rates are shown in the lower left corner. The numbers in parentheses are the t-values of the estimated coefficients. The vertical and horizontal lines indicate the weighted mean exit and entry rates respectively.

20
Figure 2: Entry exit pattern by counties in Iowa, 1982-2004
Note: Small counties have populations below 25 thousand; medium counties have populations between 25-100 thousand; and large counties have populations above 1000. We add two other lines to assist in interpreting the entry exit patterns: an urban-population-proportion-weighted linear regression of entry rates against exit rates and the 45o line along which entry and exit rates are equal. The coefficients from the regression equation of entry rates on exit rates are shown in the lower left corner. The numbers in parentheses are the t-values of the estimated coefficients. The vertical and horizontal lines indicate the weighted mean exit and entry rates respectively.
.06
.07
.08
.09
.1
.11
Ent
ry R
ate
.06 .065 .07 .075 .08 .085 Exit Rate
Small County Medium County Large County Fitted Value 45 Degree Line
Entry = -0.06 + 2.02Exit, R-square = 0.51 (-2.54) (5.79) Data source: NETS_IOWA

21
Figure 3(a) Entry and exit pattern in construction industry in Iowa, 1992-2004 .0
4.0
6.0
8.1
.12
Entry
Rat
e
.05 .06 .07 .08 .09 .1Exit Rate
Small County Medium County Large County Fitted Value 45 Degree Line
Entry = .02 + .91 Exit, R-square = .27 (2.05) (5.98) Data source: NETS_IOWA
Figure 3(b) Entry and exit pattern in manufacturing industry in Iowa, 1992-2004
.04
.06
.08
.1.1
2En
try R
ate
.04 .06 .08 .1 .12Exit Rate
Small County Medium County Large County Fitted Value 45 Degree Line
Entry = .03 + .71 Exit, R-square = .32 (4.47) (6.78) Data source: NETS_IOWA
22
Figure 3(c) Entry and exit pattern in retail trade industry in Iowa, 1992-2004 .0
4.0
6.0
8.1
.12
Entry
Rat
e
.06 .08 .1 .12 .14Exit Rate
Small County Medium County Large County Fitted Value 45 Degree Line
Entry = .02 + .58 Exit, R-square = .09 (1.17) (3.14) Data source: NETS_IOWA
Figure 3(d) Entry and exit pattern in finance and insurance industry in Iowa, 1992-2004
0.0
5.1
.15
Entry
Rat
e
.02 .04 .06 .08 .1Exit Rate
Small County Medium County Large County Fitted Value 45 Degree Line
Entry = 0 + 1.45 Exit, R-square = .56 (.4) (11.15) Data source: NETS_IOWA

23
Table 1 Taxonomy for characterizing entrepreneurial activities in an industry
Dimensions Evidence
Geographical Bias
Urban The majority of larger counties are located above the fitted line and smaller counties lie below the fitted line.
Neutral Large and small counties are evenly located around the fitted line.
Rural Smaller counties locate disproportionately above the fitted line.
Expanding/Contracting
Expanding The fitted line lies well above the 45o line in the data range.
Balanced Counties have various entry and exit rates, evenly distributed around the 45o line.
Contracting The fitted line lies below the 45o line in the data range.
Growth type
High churning The slope of the fitted line is greater than 1.
Low churning The slope of the fitted line is positive and less than 1.
Stable The slope of the fitted line is indifferent from 1.
Stagnant The slope of the fitted line is indifferent from 0.
Declining The slope of the fitted line is negative.

24
Table 2: Characterization of industries based on analysis of firm entry - exit patterns by county in Iowa, 1992-2004
Growth Type High Churning Stable Low Churning Stagnant ExpandingContracting Rural Neutral Urban Rural Neutral Urban Rural Neutral Urban Rural Neutral Urban Contracting Wholesale;
Retail
Balanced Private service
Accommo-dation
Expanding Information; Professional services
Finance Heath Care
Construction; Education
Manufac- turing; Transporta-tion
Arts & entertain-ment
Public service
Real estate
Note: If large counties are mainly located above the regression line compared to the small counties, the industry is urban biased. On the contrary, the industry is rural biased. At the same time, if most of counties are located above the 45o line and the fitted line lies above the 45o line in the data range, the industry is expanding. If the slope of fitted line is significantly greater than one, the industry is high churning. If the slope is significant smaller than one, the industry is low churning. If the slope is significantly positive but indifferent from one, the industry is stable. If the slope is statistically indifferent from zero, the industry is stagnant. We had no negative slopes.

25
Table 3: Analysis of variance of entry, exit and their difference by location and industries
Entry Exit Difference
Industry Rural-Urban Industry
Rural-Urban Industry
Rural-Urban
Between-group sum of squares 0.270 0.141 0.597 0.034 0.764 0.097 Variance explained 0.36 0.19 0.68 0.04 0.65 0.08 F(14, 1372) 77.36*** 239.59*** 238.39*** F(98, 1372) 5.83*** 1.93*** 4.32***
Total sum of squares 0.756 0.875 1.175
R2 0.55 0.72 0.73 Note: *** indicates the significance at 1% level.

26
Appendix
Table A1: Industry description and entry exit pattern in Iowa, 1992-2004
NAICS Code Major Industry Title Entry rateb Exit rateb
23 Construction 8.68% 7.13% 31-33a Manufacturing 7.07% 6.05% 42 Wholesale trade 6.71% 7.48% 44-45a Retail trade 7.80% 10.02% 48-49a Transportation and warehousing 9.38% 6.29% 51 Information 9.01% 6.02% 52 Finance and insurance 9.22% 6.19% 53 Real estate and rental and leasing 8.84% 7.73% 54 Professional and technical services 11.08% 6.89% 61 Educational services 4.85% 3.85% 62 Health care and social assistance 9.40% 6.24% 71 Arts, entertainment, and recreation 10.07% 8.65% 72 Accommodation and food services 6.89% 7.13% 81 Other services, except public administration 8.04% 7.83% 92 Public administration 8.45% 2.39%
a: The manufacturing sector has three codes: 31, 32 and 33. We use 31 to code the manufacturing sector in graphs for convenience. Similarly, code 44 represents retail and trade sector and 48 represents the transportation and warehousing sector. b: The derivation is defined in equations (5) and (6).

27
Reference [1] Acs, Zoltan J., and Edward Malecki. Entrepreneurship in Rural America: The Big
Picture. Federal Reserve Bank of Kansas City. 2003.
[2] Arenius, Pia and Dirk De Clercq. A Network – based Approach on Opportunity
Recognition. Small Business Economics. 24. 2005.
[3] Audretsch, D.B. and Feldman, M.P. R&D Spillovers and the Geography of
Innovation and Production. American Economic Review. 86(4) 1996:253-273.
[4] Cable J., and Joachim Schwalbach. International Comparisons of Entry and Exit.
In P.A. Geroski and J. Schwalbach (eds.) Entry and Market Contestability: An
International Comparison. Cambridge: Blackwell Press: 257 -281. 1991.
[5] Carree, Martin and Roy Thurik. Entry and exit in retailing: Incentives, barriers,
displacement and replacement. Review of Industrial Organization: 11(2): 155-
172. 1996.
[6] Dumais, Guy, Glenn Ellison and Edward Glaeser. Geographic Concentration as a
Dynamic Process. The Review of Economics and Statistics 84(2): 193-204. 2002.
[7] Dunne, Mark Roberts and Larry Samuelson. Patterns of Entry and Exit in the U.S.
Manufacturing Industries. Rand Journal of Economics. 19(4): 495-515. 1988.
[8] Eaton, Crutis B. and Richard Lipsey G. Exit Barriers Are Entry Barriers: The
Durability of Capital as a Barrier to Entry. The Bell Journal of Economics 11(2):
721-729. 1980.
[9] Falck Oliver. Survival chances of start-ups, do regional conditions matters?
Applied Economics 39(16) 2007: 2039-2048.
[10] Florida, R. The Flight of the Creative Class: The New Global Competitions for
28
Talent. New York: Harper Collins. 2007.
[11] Fritsch, Michael, Udo Brixy and Oliver Falck. The effect of industry, region and
time on new business survival – a multi-dimensional analysis. Review of
Industrial Organization (28) 2006: 285-306.
[12] Geroski, P.A. What Do We Know about Entry? International Journal of
Industrial Organization 13: 321-440. 1995.
[13] Glaeser, Edward. Learning in Cities. Journal of Urban Economics 46 1999: 254-
277.
[14] Glaeser, E. L. and Mare, D.C. Cities and Skills. Journal of Labor Economics,
19(2): 316-342. 2001.
[15] Jovanovic, Boyan. Selection and Evolution of Industry. Econometrica 50: 649-
670. 1982.
[16] Jaffe, A. B., Trajtenberg, M., and Henderson, R. Geographic Localization of
Knowledge Spillovers as Evidenced by Patent Citations. The Quarterly Journal
of Economics 108 (3) 1993: 577-598.
[17] Lee, S.Y., Florida, R. and Acs, Z. J. Creativity and Entrepreneurship: a Regional
Analysis of New Firm Formation. Regional Studies 38(8). 2004.
[18] Macdonald James. Entry and Exit on the Competitive Fringe. Southern Economic
Journal 52(3): 640-652. 1986.
[19] Moretti, Enrico. Workers' Education, Spillovers and Productivity: Evidence from
Plant-Level Production Functions. American Economic Review 94(3), 2004.

29
[20] Morse, George N. The Retention and Expansion of Existing Businesses: Theory
and Practice in Business Visitation Programs. Ames, IA: Iowa State University
Press. 1990.
[21] Plummer, Lawrence and Brian Headd. Rural and Urban Establishment Births and
Deaths Using the U.S. Census Bureau’s Business Information Tracking Series.
An Office of Advocacy Working Paper. February, 2008.
[22] Reynolds, Paul, Brenda Miller and Wilbur Maki. Explaining Regional Variation
in Business Births and Deaths: U.S. 1976-88. Small Business Economics 7: 389-
407. 1995.
[23] Stigler George. The Division of Labor Is Limited by the Extent of the Market. The
Journal of Political Economy 3 1951: 185-193.
[24] Walls and Associates. National Establishment Time-Series (NETS) Database:
Database Description. 2006. Oakland, CA.
[25] Woodward, Mark. Epidemiology: Study Design and Data Analysis. Chapman &
Hall. 2009.
[26] Yu, Li Robert Jolly and Peter F. Orazem. Firm Entry and Exit in Iowa, 1992 –
2004. ISU Economics Working Paper #08031, December, 2008.
[27] Yu, Li Robert Jolly and Peter F. Orazem. Why Do Rural Firms Live Longer?
ISU Economics Working Paper #09013, July, 2009.