firearms and ammunition industry economic impact … · your home state. (see center spread.) ......
TRANSCRIPT

NSSF.ORG
Firearms and Ammunition industry Economic Impact Report
2017
Who is the National Shooting Sports Foundation?
The National Shooting Sports
Foundation (NSSF) is the
trade association for the firearms
industry. Its mission is to promote,
protect and preserve hunting and
the shooting sports. Formed in
1961, NSSF has a membership
of about 13,000 manufacturers,
distributors, firearms retailers,
shooting ranges, sportsmen’s
organizations and publishers.
For more than 200 years,
America’s firearms and ammunition
industry has made products that
have been part of our country’s
tradition of freedom, self-reliance
and enjoyment of the outdoors.
NSSF has led the way in promoting
responsible ownership of firearms.
NSSF concentrates its efforts on
measurably advancing participation
in and understanding of hunting
and the shooting sports; reaffirming
and strengthening our members’
commitment to the safe and
responsible use of their products,
and promoting a political climate
supportive of America’s traditional
firearms rights.
NSSF’s expanding government
relations program responds to the
ever-changing political environment
that threatens the lawful commerce
in our industry’s products, the
future of hunting, recreational
shooting and our firearms freedoms.
NSSF works on both state and federal
issues, along with working with
many state and federal regulatory
agencies, to protect the firearms
industry and make sure their
business interests are appropriately
represented.
This report details the
significant economic impact
the firearms and ammunition
industry has on the nation’s
and each state’s economy. The
economic growth America’s
firearms and ammunition industry
has experienced in recent years has
been nothing short of remarkable.
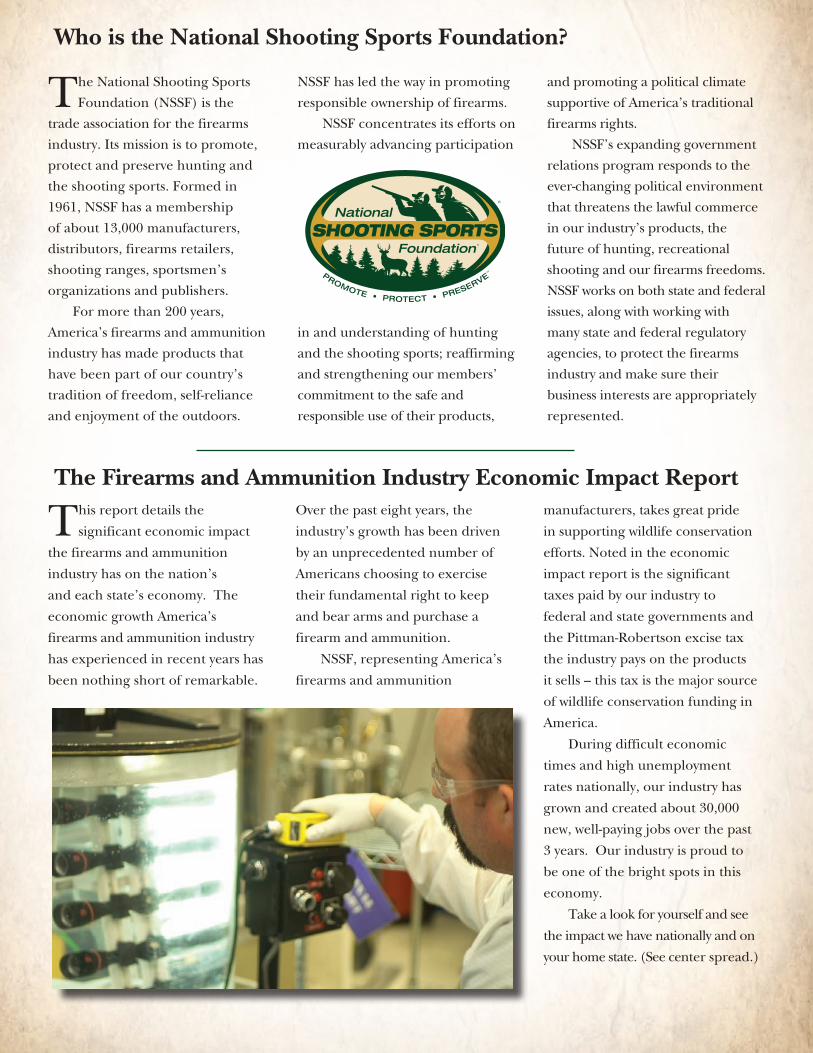
Over the past eight years, the
industry’s growth has been driven
by an unprecedented number of
Americans choosing to exercise
their fundamental right to keep
and bear arms and purchase a
firearm and ammunition.
NSSF, representing America’s
firearms and ammunition
manufacturers, takes great pride
in supporting wildlife conservation
efforts. Noted in the economic
impact report is the significant
taxes paid by our industry to
federal and state governments and
the Pittman-Robertson excise tax
the industry pays on the products
it sells – this tax is the major source
of wildlife conservation funding in
America.
During difficult economic
times and high unemployment
rates nationally, our industry has
grown and created about 30,000
new, well-paying jobs over the past
3 years. Our industry is proud to
be one of the bright spots in this
economy.
Take a look for yourself and see
the impact we have nationally and on
your home state. (See center spread.)
The Firearms and Ammunition Industry Economic Impact Report

The Firearms Industry Creates Jobs in America
United States companies that manufacture, distribute, and sell sporting firearms,ammunition and suppliers are an important part of the country’s economy. Manufacturers of firearms, ammunition, and supplies, along with companies that sell and distribute these products, provide well paying jobs in America and pay significant amounts in tax to the state and Federal governments.
1 [1] John Dunham & Associates, New York, December 2016. Direct impacts include those jobs in firearms and ammunition manufacturers, as well as companies that manufacture products such as ammunition holders and magazines, cases, decoys, game calls, holsters, hunting equipment, scopes, clay pigeons and targets. Direct impacts also include those resulting from the wholesale distribution and retailing of these products.
2 The Bureau of Labor Statistics. Available online at: www.bis.gov/lau/home.htm. Data for December-16.3 This is in addition to over $838.06 million in federal excise taxes.
Source: John Dunham and Associates, Inc.New York, New York 2016
Economic Impact of the Sporting Arms and Ammunition Industry in the United States
Direct Supplier Induced Total
Jobs (FTE) 141,500 66,614 93,009 301,123
Wages $5,847,837,400 $4,522,015,700 $4,813,571,600 $15,183,424,700
Economic Impact
$20,223,132,100 $15,525,775,600 $15,502,536,200 $51,251,443,900
The Firearms & Ammunition Industry is an Important Part of America’s EconomyCompanies in the United States that manufacture, distribute and sell firearms, ammunition and hunting equipment employ as many as 141,500 people in the country and generate an additional 159,623 jobs in supplier and ancillary industries. These include jobs in companies supplying goods and services to manufacturers, distributors and retailers, as well as those that depend on sales to workers in the firearms and ammunition industry.[1]
These are good jobs, paying an average of $50,423 in wages and benefits. And today every job is important. In fact, workers in the United States face an unemployment rate of about 5 percent. This means that there are already nearly 8 million people trying to find jobs in the nation and collecting unemployment benefits. [2]
The Economic Benefit of the Industry Spreads Throughout the CountryNot only does the manufacture and sale of firearms, ammunition, shooting and hunting supplies create good jobs in the United States but the industry also contributes to the economy as a whole. In fact, in 2016 the firearms and ammunition industry was responsible for as much as $51.3 billion in total economic activity in the country.
The broader economic impact flows throughout the economy, generating business for firms seemingly unrelated to firearms. Real people, with real jobs, working in industries as varied as banking, retail, accounting, metal working, even in printing, all depend on the firearms and ammunition industry for their livelihood.
The Country Also Benefits From the Taxes Paid By The IndustryThe firearms and ammunition industry generates sizable tax revenues. In the United States, the industry and its
Tax Impact Business Taxes Excise TaxesFederal Taxes $3,843,285,200 $838,059,600
State Taxes $2,695,451,100
Total Taxes $6,538,736,300 $838,059,600
Taxes Generated in the United States
NSSF.ORG
National Shooting Sports Foundation®

All Industries
Economic Contribution of Arms and Ammunition Industries, 2016
John Dunham and Associates: 2016
TotalJobs Wages Output Jobs Wages Output Jobs Wages Output Jobs Wages Output
Alabama 2,975 $111,493,700 $407,316,400 1,219 $70,297,000 $271,434,800 1,735 $77,289,000 $275,860,200 5,929 $259,079,700 $954,611,400 $43,697 $19,651,400Alaska 687 $21,096,800 $41,312,900 209 $12,330,100 $43,071,300 324 $17,766,700 $57,058,900 1,220 $51,193,600 $141,443,100 $41,962 $5,719,400Arizona 3,135 $138,387,700 $428,657,700 1,519 $94,418,200 $330,199,700 2,252 $112,141,300 $357,955,600 6,906 $344,947,200 $1,116,813,000 $49,949 $18,164,700Arkansas 2,764 $120,349,200 $611,615,900 1,514 $84,045,300 $338,139,400 1,828 $76,758,400 $281,437,400 6,106 $281,152,900 $1,231,192,700 $46,045 $10,397,600California 9,360 $426,066,000 $1,212,564,600 4,749 $384,549,400 $1,218,794,500 6,501 $402,388,200 $1,204,420,600 20,610 $1,213,003,600 $3,635,779,700 $58,855 $69,796,200Colorado 2,762 $100,943,700 $314,921,500 1,317 $92,907,300 $309,415,900 1,801 $97,252,200 $303,476,000 5,880 $291,103,200 $927,813,400 $49,507 $17,887,300Connecticut 2,126 $166,704,400 $657,728,200 1,100 $98,363,600 $288,204,100 1,690 $107,114,200 $299,548,200 4,916 $372,182,200 $1,245,480,500 $75,708 $6,755,800DistrictofColumbia 2 $272,900 $575,400 8 $1,195,700 $2,963,200 0 $86,300 $230,000 10 $1,554,900 $3,768,600 $155,490 $0Delaware 154 $4,584,800 $9,236,200 60 $4,527,100 $14,693,200 80 $4,555,900 $15,763,800 294 $13,667,800 $39,693,200 $46,489 $1,238,500Florida 6,551 $252,653,500 $868,155,300 3,551 $211,118,700 $775,370,400 4,748 $231,088,100 $751,359,800 14,850 $694,860,300 $2,394,885,500 $46,792 $40,547,600Georgia 3,540 $112,146,500 $443,448,800 1,651 $108,515,100 $378,273,500 2,212 $111,690,800 $365,768,300 7,403 $332,352,400 $1,187,490,600 $44,894 $21,875,900Hawaii 168 $5,227,100 $13,235,600 62 $3,203,200 $11,701,100 90 $4,603,300 $13,793,700 320 $13,033,600 $38,730,400 $40,730 $1,549,700Idaho 2,947 $127,673,700 $558,577,400 1,602 $78,939,400 $319,694,900 2,001 $80,443,100 $286,967,900 6,550 $287,056,200 $1,165,240,200 $43,825 $9,948,300Illinois 4,539 $241,728,900 $921,537,600 2,552 $195,742,900 $641,026,200 3,590 $202,132,200 $621,210,300 10,681 $639,604,000 $2,183,774,100 $59,882 $20,540,800Indiana 2,943 $78,407,700 $189,016,100 996 $57,662,300 $233,637,200 1,541 $72,996,200 $256,265,600 5,480 $209,066,200 $678,918,900 $38,151 $22,367,300Iowa 1,301 $47,652,500 $153,888,500 556 $32,189,100 $118,996,000 800 $35,646,100 $133,204,900 2,657 $115,487,700 $406,089,400 $43,465 $7,222,500Kansas 2,817 $96,220,100 $310,727,400 1,169 $68,167,000 $252,953,600 1,639 $74,985,500 $266,333,800 5,625 $239,372,600 $830,014,800 $42,555 $18,630,600Kentucky 2,095 $84,829,900 $259,260,500 851 $51,587,300 $191,064,800 1,277 $58,329,300 $198,963,800 4,223 $194,746,500 $649,289,100 $46,116 $12,525,400Louisiana 2,061 $64,020,000 $173,986,300 813 $52,756,700 $194,772,900 1,161 $54,703,800 $192,925,900 4,035 $171,480,500 $561,685,100 $42,498 $15,231,500Maine 1,396 $41,982,900 $136,402,500 523 $28,292,400 $102,742,000 795 $36,223,600 $121,732,400 2,714 $106,498,900 $360,876,900 $39,241 $9,491,700Maryland 1,444 $76,228,500 $267,391,500 644 $47,259,800 $150,592,700 953 $53,136,700 $163,168,300 3,041 $176,625,000 $581,152,500 $58,081 $7,493,000Massachusetts 2,925 $213,787,800 $1,008,458,100 1,759 $157,010,800 $434,960,100 2,432 $157,923,800 $415,768,100 7,116 $528,722,400 $1,859,186,300 $74,301 $5,440,200Michigan 4,423 $163,244,200 $436,962,600 1,839 $121,115,100 $416,456,000 2,781 $138,584,500 $448,075,800 9,043 $422,943,800 $1,301,494,400 $46,770 $31,770,400Minnesota 4,555 $273,647,900 $1,036,682,800 2,976 $225,141,300 $727,061,800 4,119 $216,268,700 $664,846,300 11,650 $715,057,900 $2,428,590,900 $61,378 $16,616,500Mississippi 2,417 $107,085,500 $459,627,500 1,260 $65,430,700 $270,190,300 1,567 $61,048,300 $233,273,900 5,244 $233,564,500 $963,091,700 $44,539 $9,178,400Missouri 5,281 $169,854,300 $535,015,800 2,217 $141,606,000 $511,650,300 3,233 $156,217,100 $526,482,400 10,731 $467,677,400 $1,573,148,500 $43,582 $32,673,200Montana 1,508 $55,915,200 $205,447,800 664 $31,315,000 $120,562,300 922 $37,644,600 $129,944,300 3,094 $124,874,800 $455,954,400 $40,360 $6,979,800Nebraska 2,001 $78,001,500 $322,799,300 928 $56,116,400 $217,787,600 1,272 $56,850,700 $209,943,800 4,201 $190,968,600 $750,530,700 $45,458 $10,614,600Nevada 1,479 $43,390,100 $146,857,300 599 $34,762,400 $121,082,100 782 $39,803,100 $129,124,600 2,860 $117,955,600 $397,064,000 $41,243 $11,432,000NewHampshire 1,671 $129,835,900 $543,969,100 946 $68,501,200 $206,507,600 1,480 $78,053,000 $221,975,200 4,097 $276,390,100 $972,451,900 $67,462 $3,757,600NewJersey 844 $46,129,700 $120,293,200 426 $36,415,000 $108,482,900 571 $35,923,600 $102,543,300 1,841 $118,468,300 $331,319,400 $64,350 $6,227,800NewMexico 579 $13,265,500 $39,818,700 204 $10,296,300 $45,016,400 296 $13,573,200 $48,407,200 1,079 $37,135,000 $133,242,300 $34,416 $4,092,900NewYork 3,580 $223,110,500 $827,156,800 1,989 $195,426,500 $533,946,900 2,451 $166,831,700 $474,660,400 8,020 $585,368,700 $1,835,764,100 $72,989 $12,424,500NorthCarolina 5,378 $208,043,300 $845,338,500 2,548 $155,923,000 $558,776,800 3,501 $168,863,700 $575,238,200 11,427 $532,830,000 $1,979,353,500 $46,629 $25,999,800NorthDakota 576 $17,594,400 $42,658,900 184 $11,250,800 $36,820,700 288 $14,541,000 $48,069,600 1,048 $43,386,200 $127,549,200 $41,399 $4,760,800Ohio 6,021 $172,157,400 $454,695,200 2,276 $151,738,700 $554,459,000 3,475 $174,280,900 $596,531,100 11,772 $498,177,000 $1,605,685,300 $42,319 $44,244,700Oklahoma 1,991 $55,098,800 $147,149,600 773 $44,776,300 $176,440,400 1,111 $51,618,500 $183,708,300 3,875 $151,493,600 $507,298,300 $39,095 $14,381,100Oregon 2,861 $181,129,600 $696,416,300 1,900 $119,354,500 $389,577,200 2,405 $115,111,700 $352,342,100 7,166 $415,595,800 $1,438,335,600 $57,996 $10,819,200Pennsylvania 6,082 $217,818,400 $658,410,600 2,538 $195,328,100 $627,086,900 3,816 $216,097,000 $655,516,700 12,436 $629,243,500 $1,941,014,200 $50,599 $36,091,300RhodeIsland 215 $18,974,400 $47,598,200 110 $7,328,200 $21,313,100 184 $9,498,300 $28,416,100 509 $35,800,900 $97,327,400 $70,336 $881,800SouthCarolina 2,472 $95,748,800 $315,960,200 1,069 $62,152,700 $228,083,900 1,473 $65,790,100 $227,518,200 5,014 $223,691,600 $771,562,300 $44,613 $14,598,000SouthDakota 1,088 $40,605,900 $172,456,300 506 $27,056,300 $100,441,200 664 $27,643,700 $103,974,900 2,258 $95,305,900 $376,872,400 $42,208 $5,300,700Tennessee 3,308 $133,552,800 $366,630,400 1,378 $89,281,400 $312,486,100 2,139 $109,079,400 $349,337,700 6,825 $331,913,600 $1,028,454,200 $48,632 $25,093,700Texas 10,931 $412,233,100 $1,259,188,400 5,069 $363,152,400 $1,289,354,300 7,070 $389,006,700 $1,279,485,500 23,070 $1,164,392,200 $3,828,028,200 $50,472 $81,806,700Utah 2,884 $96,907,500 $330,484,100 1,383 $77,033,700 $291,516,400 1,807 $82,503,800 $290,332,400 6,074 $256,445,000 $912,332,900 $42,220 $17,392,500Vermont 345 $17,952,700 $45,975,500 127 $7,353,900 $25,189,700 231 $10,556,500 $33,063,600 703 $35,863,100 $104,228,800 $51,014 $2,286,600Virginia 2,813 $92,342,800 $369,739,500 1,205 $88,450,300 $290,941,600 1,600 $86,050,700 $274,669,200 5,618 $266,843,800 $935,350,300 $47,498 $14,086,400Washington 3,286 $116,130,500 $365,187,200 1,359 $94,753,800 $329,278,100 1,893 $107,650,000 $338,464,000 6,538 $318,534,300 $1,032,929,300 $48,720 $25,955,900WestVirginia 804 $22,670,000 $69,106,200 290 $18,674,500 $74,116,800 427 $19,766,600 $69,220,900 1,521 $61,111,100 $212,443,900 $40,178 $5,478,900Wisconsin 2,635 $92,337,000 $307,863,700 1,162 $72,405,600 $259,724,900 1,642 $78,874,200 $264,974,600 5,439 $243,616,800 $832,563,200 $44,791 $15,193,900Wyoming 780 $20,601,400 $65,628,000 265 $14,797,200 $58,722,800 359 $16,585,600 $59,182,400 1,404 $51,984,200 $183,533,200 $37,026 $5,444,500Total 141,500 $5,847,837,400 $20,223,132,100 66,614 $4,522,015,700 $15,525,775,600 93,009 $4,813,571,600 $15,502,536,200 301,123 $15,183,424,700 $51,251,443,900 $50,423 $838,059,600
Direct Suppliers Induced Avg.Wages&Benefits
ExciseTaxesFederal

Economic Contribution of Arms and Ammunition Industries, 2016 State by State Economic Impact Report
TotalJobs Wages Output Jobs Wages Output Jobs Wages Output Jobs Wages Output
Alabama 2,975 $111,493,700 $407,316,400 1,219 $70,297,000 $271,434,800 1,735 $77,289,000 $275,860,200 5,929 $259,079,700 $954,611,400 $43,697 $19,651,400Alaska 687 $21,096,800 $41,312,900 209 $12,330,100 $43,071,300 324 $17,766,700 $57,058,900 1,220 $51,193,600 $141,443,100 $41,962 $5,719,400Arizona 3,135 $138,387,700 $428,657,700 1,519 $94,418,200 $330,199,700 2,252 $112,141,300 $357,955,600 6,906 $344,947,200 $1,116,813,000 $49,949 $18,164,700Arkansas 2,764 $120,349,200 $611,615,900 1,514 $84,045,300 $338,139,400 1,828 $76,758,400 $281,437,400 6,106 $281,152,900 $1,231,192,700 $46,045 $10,397,600California 9,360 $426,066,000 $1,212,564,600 4,749 $384,549,400 $1,218,794,500 6,501 $402,388,200 $1,204,420,600 20,610 $1,213,003,600 $3,635,779,700 $58,855 $69,796,200Colorado 2,762 $100,943,700 $314,921,500 1,317 $92,907,300 $309,415,900 1,801 $97,252,200 $303,476,000 5,880 $291,103,200 $927,813,400 $49,507 $17,887,300Connecticut 2,126 $166,704,400 $657,728,200 1,100 $98,363,600 $288,204,100 1,690 $107,114,200 $299,548,200 4,916 $372,182,200 $1,245,480,500 $75,708 $6,755,800DistrictofColumbia 2 $272,900 $575,400 8 $1,195,700 $2,963,200 0 $86,300 $230,000 10 $1,554,900 $3,768,600 $155,490 $0Delaware 154 $4,584,800 $9,236,200 60 $4,527,100 $14,693,200 80 $4,555,900 $15,763,800 294 $13,667,800 $39,693,200 $46,489 $1,238,500Florida 6,551 $252,653,500 $868,155,300 3,551 $211,118,700 $775,370,400 4,748 $231,088,100 $751,359,800 14,850 $694,860,300 $2,394,885,500 $46,792 $40,547,600Georgia 3,540 $112,146,500 $443,448,800 1,651 $108,515,100 $378,273,500 2,212 $111,690,800 $365,768,300 7,403 $332,352,400 $1,187,490,600 $44,894 $21,875,900Hawaii 168 $5,227,100 $13,235,600 62 $3,203,200 $11,701,100 90 $4,603,300 $13,793,700 320 $13,033,600 $38,730,400 $40,730 $1,549,700Idaho 2,947 $127,673,700 $558,577,400 1,602 $78,939,400 $319,694,900 2,001 $80,443,100 $286,967,900 6,550 $287,056,200 $1,165,240,200 $43,825 $9,948,300Illinois 4,539 $241,728,900 $921,537,600 2,552 $195,742,900 $641,026,200 3,590 $202,132,200 $621,210,300 10,681 $639,604,000 $2,183,774,100 $59,882 $20,540,800Indiana 2,943 $78,407,700 $189,016,100 996 $57,662,300 $233,637,200 1,541 $72,996,200 $256,265,600 5,480 $209,066,200 $678,918,900 $38,151 $22,367,300Iowa 1,301 $47,652,500 $153,888,500 556 $32,189,100 $118,996,000 800 $35,646,100 $133,204,900 2,657 $115,487,700 $406,089,400 $43,465 $7,222,500Kansas 2,817 $96,220,100 $310,727,400 1,169 $68,167,000 $252,953,600 1,639 $74,985,500 $266,333,800 5,625 $239,372,600 $830,014,800 $42,555 $18,630,600Kentucky 2,095 $84,829,900 $259,260,500 851 $51,587,300 $191,064,800 1,277 $58,329,300 $198,963,800 4,223 $194,746,500 $649,289,100 $46,116 $12,525,400Louisiana 2,061 $64,020,000 $173,986,300 813 $52,756,700 $194,772,900 1,161 $54,703,800 $192,925,900 4,035 $171,480,500 $561,685,100 $42,498 $15,231,500Maine 1,396 $41,982,900 $136,402,500 523 $28,292,400 $102,742,000 795 $36,223,600 $121,732,400 2,714 $106,498,900 $360,876,900 $39,241 $9,491,700Maryland 1,444 $76,228,500 $267,391,500 644 $47,259,800 $150,592,700 953 $53,136,700 $163,168,300 3,041 $176,625,000 $581,152,500 $58,081 $7,493,000Massachusetts 2,925 $213,787,800 $1,008,458,100 1,759 $157,010,800 $434,960,100 2,432 $157,923,800 $415,768,100 7,116 $528,722,400 $1,859,186,300 $74,301 $5,440,200Michigan 4,423 $163,244,200 $436,962,600 1,839 $121,115,100 $416,456,000 2,781 $138,584,500 $448,075,800 9,043 $422,943,800 $1,301,494,400 $46,770 $31,770,400Minnesota 4,555 $273,647,900 $1,036,682,800 2,976 $225,141,300 $727,061,800 4,119 $216,268,700 $664,846,300 11,650 $715,057,900 $2,428,590,900 $61,378 $16,616,500Mississippi 2,417 $107,085,500 $459,627,500 1,260 $65,430,700 $270,190,300 1,567 $61,048,300 $233,273,900 5,244 $233,564,500 $963,091,700 $44,539 $9,178,400Missouri 5,281 $169,854,300 $535,015,800 2,217 $141,606,000 $511,650,300 3,233 $156,217,100 $526,482,400 10,731 $467,677,400 $1,573,148,500 $43,582 $32,673,200Montana 1,508 $55,915,200 $205,447,800 664 $31,315,000 $120,562,300 922 $37,644,600 $129,944,300 3,094 $124,874,800 $455,954,400 $40,360 $6,979,800Nebraska 2,001 $78,001,500 $322,799,300 928 $56,116,400 $217,787,600 1,272 $56,850,700 $209,943,800 4,201 $190,968,600 $750,530,700 $45,458 $10,614,600Nevada 1,479 $43,390,100 $146,857,300 599 $34,762,400 $121,082,100 782 $39,803,100 $129,124,600 2,860 $117,955,600 $397,064,000 $41,243 $11,432,000NewHampshire 1,671 $129,835,900 $543,969,100 946 $68,501,200 $206,507,600 1,480 $78,053,000 $221,975,200 4,097 $276,390,100 $972,451,900 $67,462 $3,757,600NewJersey 844 $46,129,700 $120,293,200 426 $36,415,000 $108,482,900 571 $35,923,600 $102,543,300 1,841 $118,468,300 $331,319,400 $64,350 $6,227,800NewMexico 579 $13,265,500 $39,818,700 204 $10,296,300 $45,016,400 296 $13,573,200 $48,407,200 1,079 $37,135,000 $133,242,300 $34,416 $4,092,900NewYork 3,580 $223,110,500 $827,156,800 1,989 $195,426,500 $533,946,900 2,451 $166,831,700 $474,660,400 8,020 $585,368,700 $1,835,764,100 $72,989 $12,424,500NorthCarolina 5,378 $208,043,300 $845,338,500 2,548 $155,923,000 $558,776,800 3,501 $168,863,700 $575,238,200 11,427 $532,830,000 $1,979,353,500 $46,629 $25,999,800NorthDakota 576 $17,594,400 $42,658,900 184 $11,250,800 $36,820,700 288 $14,541,000 $48,069,600 1,048 $43,386,200 $127,549,200 $41,399 $4,760,800Ohio 6,021 $172,157,400 $454,695,200 2,276 $151,738,700 $554,459,000 3,475 $174,280,900 $596,531,100 11,772 $498,177,000 $1,605,685,300 $42,319 $44,244,700Oklahoma 1,991 $55,098,800 $147,149,600 773 $44,776,300 $176,440,400 1,111 $51,618,500 $183,708,300 3,875 $151,493,600 $507,298,300 $39,095 $14,381,100Oregon 2,861 $181,129,600 $696,416,300 1,900 $119,354,500 $389,577,200 2,405 $115,111,700 $352,342,100 7,166 $415,595,800 $1,438,335,600 $57,996 $10,819,200Pennsylvania 6,082 $217,818,400 $658,410,600 2,538 $195,328,100 $627,086,900 3,816 $216,097,000 $655,516,700 12,436 $629,243,500 $1,941,014,200 $50,599 $36,091,300RhodeIsland 215 $18,974,400 $47,598,200 110 $7,328,200 $21,313,100 184 $9,498,300 $28,416,100 509 $35,800,900 $97,327,400 $70,336 $881,800SouthCarolina 2,472 $95,748,800 $315,960,200 1,069 $62,152,700 $228,083,900 1,473 $65,790,100 $227,518,200 5,014 $223,691,600 $771,562,300 $44,613 $14,598,000SouthDakota 1,088 $40,605,900 $172,456,300 506 $27,056,300 $100,441,200 664 $27,643,700 $103,974,900 2,258 $95,305,900 $376,872,400 $42,208 $5,300,700Tennessee 3,308 $133,552,800 $366,630,400 1,378 $89,281,400 $312,486,100 2,139 $109,079,400 $349,337,700 6,825 $331,913,600 $1,028,454,200 $48,632 $25,093,700Texas 10,931 $412,233,100 $1,259,188,400 5,069 $363,152,400 $1,289,354,300 7,070 $389,006,700 $1,279,485,500 23,070 $1,164,392,200 $3,828,028,200 $50,472 $81,806,700Utah 2,884 $96,907,500 $330,484,100 1,383 $77,033,700 $291,516,400 1,807 $82,503,800 $290,332,400 6,074 $256,445,000 $912,332,900 $42,220 $17,392,500Vermont 345 $17,952,700 $45,975,500 127 $7,353,900 $25,189,700 231 $10,556,500 $33,063,600 703 $35,863,100 $104,228,800 $51,014 $2,286,600Virginia 2,813 $92,342,800 $369,739,500 1,205 $88,450,300 $290,941,600 1,600 $86,050,700 $274,669,200 5,618 $266,843,800 $935,350,300 $47,498 $14,086,400Washington 3,286 $116,130,500 $365,187,200 1,359 $94,753,800 $329,278,100 1,893 $107,650,000 $338,464,000 6,538 $318,534,300 $1,032,929,300 $48,720 $25,955,900WestVirginia 804 $22,670,000 $69,106,200 290 $18,674,500 $74,116,800 427 $19,766,600 $69,220,900 1,521 $61,111,100 $212,443,900 $40,178 $5,478,900Wisconsin 2,635 $92,337,000 $307,863,700 1,162 $72,405,600 $259,724,900 1,642 $78,874,200 $264,974,600 5,439 $243,616,800 $832,563,200 $44,791 $15,193,900Wyoming 780 $20,601,400 $65,628,000 265 $14,797,200 $58,722,800 359 $16,585,600 $59,182,400 1,404 $51,984,200 $183,533,200 $37,026 $5,444,500Total 141,500 $5,847,837,400 $20,223,132,100 66,614 $4,522,015,700 $15,525,775,600 93,009 $4,813,571,600 $15,502,536,200 301,123 $15,183,424,700 $51,251,443,900 $50,423 $838,059,600
Direct Suppliers Induced Avg.Wages&Benefits
ExciseTaxesFederal

State Rankings
Total Economic Output, dollars
Texas
California
Minnesota
Florida
Illinois
North Carolina
Pennsylvania
Massachusetts
New York
Ohio
Total Jobs, per capita
Idaho
New Hampshire
Montana
South Dakota
Wyoming
Nebraska
Minnesota
Arkansas
Maine
Utah
Growth in Jobs
Oklahoma
Hawaii
West Virginia
Delaware
New Mexico
Louisiana
Kentucky
Texas
Indiana
New Jersey
Total Jobs, number
Texas
California
Florida
Pennsylvania
Ohio
Minnesota
North Carolina
Missouri
Illinois
Michigan
Total Economic Output, per capita
New Hampshire
Idaho
Minnesota
Montana
South Dakota
Arkansas
Nebraska
Oregon
Connecticut
Mississippi
Growth in Economic Output
Oklahoma
Tennessee
New Mexico
Montana
Nevada
West Virginia
Louisiana
Hawaii
Delaware
Kentucky
Federal Excise Taxes, number
Texas
California
Ohio
Florida
Pennsylvania
Missouri
Michigan
North Carolina
Washington
Tennessee
Federal Excise Taxes, per capita
Wyoming
Alaska
Maine
Montana
Kansas
North Dakota
South Dakota
Idaho
Utah
Nebraska
Growth in Excise Taxes
Rhode Island
Vermont
Mississippi
Florida
North Carolina
Louisiana
Texas
Kentucky
South Carolina
Arkansas
Economic Output: Top Ten States
Jobs: Top Ten States
Excise Tax: Top Ten States

0
1
2
3
4
0
1
2
3
4
0
1
2
3
4
5
6
7
8
9
$352million
$454million
$460million
$864million
$702million
$713million
$838million
$1.5billion
$2.0billion
$2.5billion
$2.9billion
$3.1billion
$3.7billion
$3.8billion
$1.3billion
$1.9billion
$2.1billion
$2.3billion
$2.7billion $2.5
billion
$2.7billion
+156% +107%+138%
0
2
4
6
8
10
12
14
0
55
110
165
220
275
16
6,2
00
18
3,0
00
24
5,7
50
26
3,2
23
28
7,9
86
30
1,1
23
+81%since 2008 +137%
2008 2009 2011 2013 2014 2015 2016
2008 2009 2011 2013 2014 2015 2016 2008 2009 2011 2013 2014 2015 2016 2008 2009 2011 2013 2014 2015 2016
2008 2009 2011 2013 2014 2015 2016 2008 2009 2011 2013 2014 2015 2016
22
0,1
30
$6.4 billion
$15.2 billion
$8.2billion
$10.4 billion
$11.7 billion
$13.7billion
$14.5billion
0
10
20
30
40
50
$19.1billion
$27.8billion
$33.4billion
$37.7billion
$43.0billion
$49.3billion
$51.3billion
+168%
0
1
2
3
4
0
1
2
3
4
0
1
2
3
4
5
6
7
8
9
$352million
$454million
$460million
$864million
$702million
$713million
$838million
$1.5billion
$2.0billion
$2.5billion
$2.9billion
$3.1billion
$3.7billion
$3.8billion
$1.3billion
$1.9billion
$2.1billion
$2.3billion
$2.7billion $2.5
billion
$2.7billion
+156% +107%+138%
0
2
4
6
8
10
12
14
0
55
110
165
220
275
16
6,2
00
18
3,0
00
24
5,7
50
26
3,2
23
28
7,9
86
30
1,1
23
+81%since 2008 +137%
2008 2009 2011 2013 2014 2015 2016
2008 2009 2011 2013 2014 2015 2016 2008 2009 2011 2013 2014 2015 2016 2008 2009 2011 2013 2014 2015 2016
2008 2009 2011 2013 2014 2015 2016 2008 2009 2011 2013 2014 2015 2016
22
0,1
30
$6.4 billion
$15.2 billion
$8.2billion
$10.4 billion
$11.7 billion
$13.7billion
$14.5billion
0
10
20
30
40
50
$19.1billion
$27.8billion
$33.4billion
$37.7billion
$43.0billion
$49.3billion
$51.3billion
+168%
Jobs Wages
Taxes Generated
Economic Impact
What a growing industry looks like...

11 Mile Hill Road
Newtown, CT 06470-2359
T: 203.426.1320
F: 203.426.1087
nssf.orgItem #9101A 1/17
Promote Protect Preserve