fire severity model accuracy using short-term, …web.pdx.edu/~nauna/articles/weber.pdffire severity...
TRANSCRIPT

Fire Severity Model Accuracy Using Short-Term, Rapid Assessment versus Long-Term, Anniversary Date Assessment
Keith T. Weber1 GIS Director, Idaho State University, Pocatello, Idaho 83209-8104
Steven Seefeldt Research Agronomist, USDA-ARS, SubArctic Agricultural Research Unit, University of Alaska Fairbanks, Fairbanks, Alaska 99775
Corey MoffetResearch Rangeland Scientist, USDA-ARS, U.S. Sheep Experiment Station, Dubois, Idaho 83423
Abstract: Fires are common in rangelands, and after a century of suppression, thepotential exists for fires to burn with high intensity and severity. In addition, the abil-ity of fires to affect long-term changes in rangelands is substantial; therefore, theassessment of fire severity following a burn is critical. These assessments are typi-cally conducted following Burned Area Emergency Response team (or similar) pro-tocols; the resulting data can be utilized to plan future land uses and remediationefforts. For the purpose of supplementing these procedures and exploring fire sever-ity modeling of sagebrush steppe rangelands, we compared fire severity modelsdeveloped using (1) short-term post-fire imagery (i.e., imagery collected within 30days of the fire) with (2) long-term post-fire imagery (i.e., imagery collected on orabout the one-year anniversary date of the fire). The models were developed usingSatellite Pour l’Observation de la Terre 5 (SPOT 5) imagery as well as Shuttle RadarTopography Mission (SRTM) elevation data, as well as Classification Tree Analysis(CTA). The results indicate that while anniversary date imagery can be used toassess fire severity (overall accuracy ~90%), it is not as accurate as short-term imag-ery (overall accuracy ~97%). Furthermore, use of short-term imagery allows remedi-ation strategies to be crafted and implemented shortly after the fire. Therefore, wesuggest that rangeland fire severity is best modeled using CTA with short-termimagery and field-based fire severity observations.
INTRODUCTION
Throughout the Intermountain West, fires are a common occurrence. Historicplant communities may be adapted to fire, but the frequency and intensity of today’swildfires differ from what occurred in the past (DeBano et al., 1998; Thoren and
1Email: [email protected]
24
GIScience & Remote Sensing, 2009, 46, No. 1, p. 24–38. DOI: 10.2747/1548-1603.46.1.24Copyright © 2009 by Bellwether Publishing, Ltd. All rights reserved.
FIRE SEVERITY MODEL ACCURACY 25
Mattsson, 2002). After a period of less frequent fires due to concerted suppressionefforts, fires in the Intermountain West are becoming more frequent than suggested bythe historical record, and can be more intense in those areas where prolonged fire sup-pression has created fuel stockpiles (Pyne et al., 1996). The change in frequency canbe attributed to the conversion of sagebrush-grass communities to fire-promotingcheatgrass (Bromus tectorum L.)–dominated communities (Brooks et al., 2004). Theconsequences of these differences are manifest in various impacts on forage produc-tion, wildlife habitat, rangeland health (Pyke et al., 2002); and potential soil erosion(Pierson et al., 2001; Finley, 2006; Moffet et al., 2007).
The assessment of the effects of wildfires is important for the purpose of devel-oping or modifying existing strategies designed to minimize threats to life/propertyand prevent unacceptable degradation of natural and cultural resources (U.S. Depart-ment of Interior, 2004; Sharon Paris, pers. comm., 2007). However, because of thebroad distribution and extent of wildfires in the Intermountain West, it is logisticallydifficult if not impossible for land managers to closely evaluate each fire. For thesereasons, the application of remote sensing models that accurately and reliably classifyfire severity may be useful (Lentile et al., 2006).
A number of satellite remote sensing methods can be used to model fire severity(Garcia and Chuvieco, 2004), although most have been designed for forested eco-systems (Turner et al., 1994; White et al., 1996; Patterson and Yool, 1998; VanWagtendonk et al., 2004; Brewer et al., 2005; Epting et al., 2005). Before 1999, anNDVI-based technique used to estimate biomass loss (and hence, fire severity) wasthe most widely used fire severity modeling method (Salvador et al., 2000; Diaz-Delgado et al., 2003; Flasse et al., 2004). In 1999, the normalized burn ratio (NBR)technique was developed and has been widely applied and accepted across much ofthe Intermountain West (Key and Benson, 1999, 2006; Salvador et al., 2000).
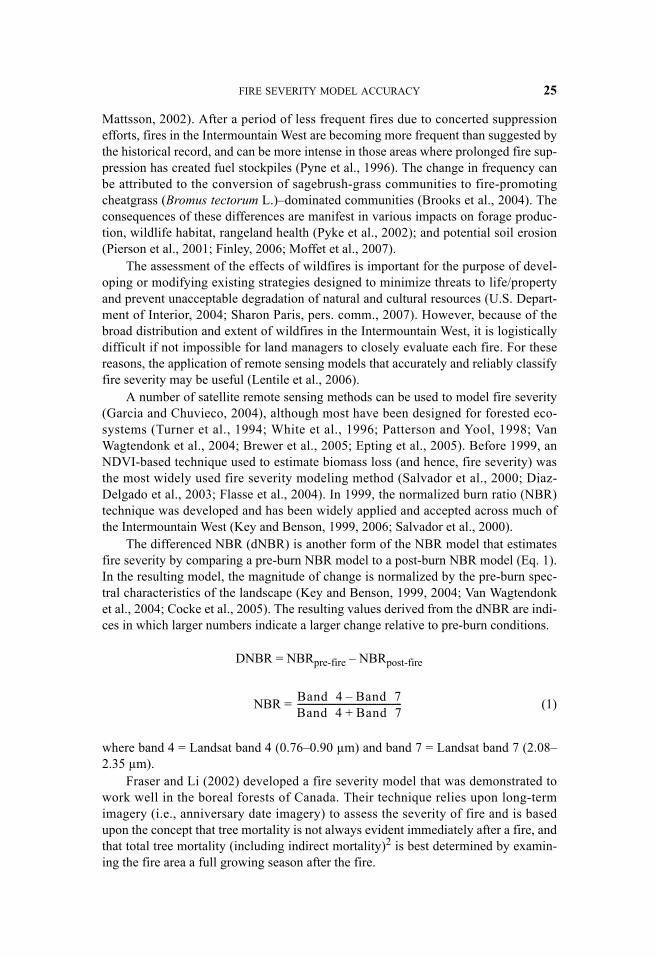
The differenced NBR (dNBR) is another form of the NBR model that estimatesfire severity by comparing a pre-burn NBR model to a post-burn NBR model (Eq. 1).In the resulting model, the magnitude of change is normalized by the pre-burn spec-tral characteristics of the landscape (Key and Benson, 1999, 2004; Van Wagtendonket al., 2004; Cocke et al., 2005). The resulting values derived from the dNBR are indi-ces in which larger numbers indicate a larger change relative to pre-burn conditions.
DNBR = NBRpre-fire – NBRpost-fire
NBR = (1)
where band 4 = Landsat band 4 (0.76–0.90 µm) and band 7 = Landsat band 7 (2.08–2.35 µm).
Fraser and Li (2002) developed a fire severity model that was demonstrated towork well in the boreal forests of Canada. Their technique relies upon long-termimagery (i.e., anniversary date imagery) to assess the severity of fire and is basedupon the concept that tree mortality is not always evident immediately after a fire, andthat total tree mortality (including indirect mortality)2 is best determined by examin-ing the fire area a full growing season after the fire.
Band 4 Band 7–Band 4 Band 7+-----------------------------------------------

26 WEBER ET AL.
Recent fire severity studies reported by Finley (2006) and Norton (2006) suggestthe fire severity modeling techniques developed for forested ecosystems are not wellsuited to sagebrush-steppe ecosystems, and research by Weber et al. (2008) has dem-onstrated the application of classification tree analysis (CTA) for fire severity model-ing of rangelands with favorable results. CTA is a non-probabilistic, non-parametricstatistical technique that is well suited to modeling skewed, non-normal data and phe-nomena (Friedl and Brodley, 1997; Breiman et al., 1998; Lawrence and Wright, 2001;Miller and Franklin, 2001). The CTA algorithms select useful spectral and ancillarydata that optimally reduce divergence in a response variable (Lawrence and Wright,2001) such as fire severity observations. CTA uses machine-learning to performbinary recursive splitting operations and ultimately yields a classification tree dia-gram that is used in producing a model of the response variable. Among the splittingalgorithms common to CTA are entropy, twoing, class probability, gain ratio, andGini. Of these, entropy, gain ratio, and Gini are available within the Idrisi softwareused in this study. The entropy algorithm tends to over-split, thereby creating anunnecessarily complex tree (Zambon, et al., 2006). The gain ratio algorithm addressesover-splitting through a normalization process, whereas the Gini algorithm attemptsto partition the most homogeneous clusters first using a measure of impurity (McKayand Campbell, 1982; Zambon et al., 2006). Additional splits are performed until nofurther segregation is possible. Based upon the results reported by Zambon (2006),the particular splitting rule selected should not pose a substantial concern; however,the Gini algorithm was found most applicable to image classification.
The goal of this study is to compare a fire severity model derived using short-term post-fire imagery with one derived from long-term (anniversary date) post-fireimagery. Specifically, we test which model better describes fire severity (the amountof fuel [e.g., vegetation and litter] removed within the fire perimeter) with respect toimproving remediation processes and lowering costs.
METHODS
Study Area
Our study focuses upon a prescribed fire at the Hitching Post pasture of the U. S.Sheep Experiment Station (USSES) near Dubois, Idaho (Fig. 1). The prescribed burnwas begun September 14, 2005 and extinguished the following day (September 15).The fire boundary encompassed 2.44 km2 within the Hitching Post pasture (112°7' W,44°19' N).3 Soils are mapped as complexes of Pyrenees (loamy-skeletal, mixed,superactive, frigid Typic Calcixerolls), Akbash (fine-loamy, mixed, superactive,frigid Calcic Pachic Argixerolls), and Maremma (fine-loamy, mixed, superactive,frigid Calcic Pachic Argixerolls ), soils on slopes less than 20 percent, but mostly 0 to12 percent (NRCS, 1995).
2Indirect mortality refers to a situation in which a tree is made susceptible to insect infestation and/ordisease due to fire.
3The Hitching Post Pasture is a 3.24 km2 fenced parcel on the USSES, ranging in elevation from 1765to 1800 m. Mean annual precipitation (1971 to 2000) at the Dubois Experiment Station (112°12' W, 44°15'N, elevation, 1661 m) is 331 mm, with 60% falling during the period April–September.

FIRE SEVERITY MODEL ACCURACY 27
Vegetation on the study site is a sagebrush-grass community dominated by moun-tain big sagebrush (Artemisa tridentata ssp. vaseyana [Rydb.] Beetle) and threetipsagebrush (A. tripartita Rydb.). Subdominant shrub species include yellow rabbit-brush (Chrysothamnus viscidiflorus [Hook.] Nutt.), antelope bitterbrush (Purshia tri-dentata [Pursh] DC.), and spineless horsebrush (Tetradymia canescens DC.). Thereare a few small patches of the exotic forbs spotted knapweed (Centaurea stoebe L.ssp. micranthos [Gugler] Hayek) and leafy spurge (Euphorbia esula L.), as well astrace amounts (<1% of overall plant cover) of the exotic annual cheatgrass. Lupine(Lupinus argenteus Pursh) is the most plentiful forb on the study site, and the gramin-oids present are bluebunch wheatgrass (Pseudoroegneria spicata [Pursh] A. Löve ssp.spicata), thickspike wheatgrass (Elymus lanceolatus [Scribn. & J.G. Sm.] Gould ssp.lanceolatus), and plains reedgrass (Calamagrostis montanensis Scribn. ex Vasey).
Fig. 1. Location of USDA ARS (U.S. Department of Agriculture, Agricultural ResearchService) Sheep Experiment Station and site of the prescribed fire used in this study.
28 WEBER ET AL.
Over the past decade, management of this pasture has featured light, short-dura-tion grazing with sheep and horses in spring and/or fall. The pasture was not grazedduring 2.5-year period prior to the prescribed burn described above.
Field Sampling
Starting one week after the prescribed burn, we visited 277 randomly selectedsample areas (60 × 60 m) to assess fire severity. We located these sample areas on theground by navigating to the preselected area with a GPS receiver using real-time posi-tioning. These positions were later (post-process) differentially corrected to achieve ahorizontal positional accuracy of <1 m (Serr et al., 2006). Although subjective, a fireseverity rating (0 = unburned, no vegetation change; 1 = little vegetation/fuel burned;2 = most of the vegetation burned; and 3 = burned (all vegetation considered com-pletely burned) was assigned to each area visited, following methods modified fromthe combined work of U.S. Forest Service field methods (Bobbe et al., 2001), U.S.Park Service field methods (Switky, 2003), and Key and Benson’s (1999, 2004) com-posite burn index (CBI). Groups one (n = 13) and two (n = 57) were later combined,as the 13 areas assigned to group one were insufficient for validation.
Some aspects of fire severity can be quantified, but classification of generalseverity has proven difficult. Classification of burn or fire severity, based on post-fireappearances of litter and soil (Ryan and Noste 1983), is useful in placing severitywithin broadly defined, discrete classes, ranging from low to high. Hungerford (1996)developed a general burn severity classification for forest environments that relatesburn severity to soil resource response and has three classes: low, moderate, and high.In rangeland ecosystems, however, the medium- and high-severity classes describedby Hungerford merge, because there is not a large woody component and deep dufflayer whose response to burning would differentiate the classes. Therefore, we optedfor a simple classification of low or high severity, and as a result, three classesremained: 0 (unburned), 1 (low fire severity), and 2 (high fire severity). It was not anobjective of this study to differentiate burned from unburned areas with remote sens-ing/image processing techniques, and for this reason all unburned sample areas (n =9) were omitted from subsequent processing.
Image Processing
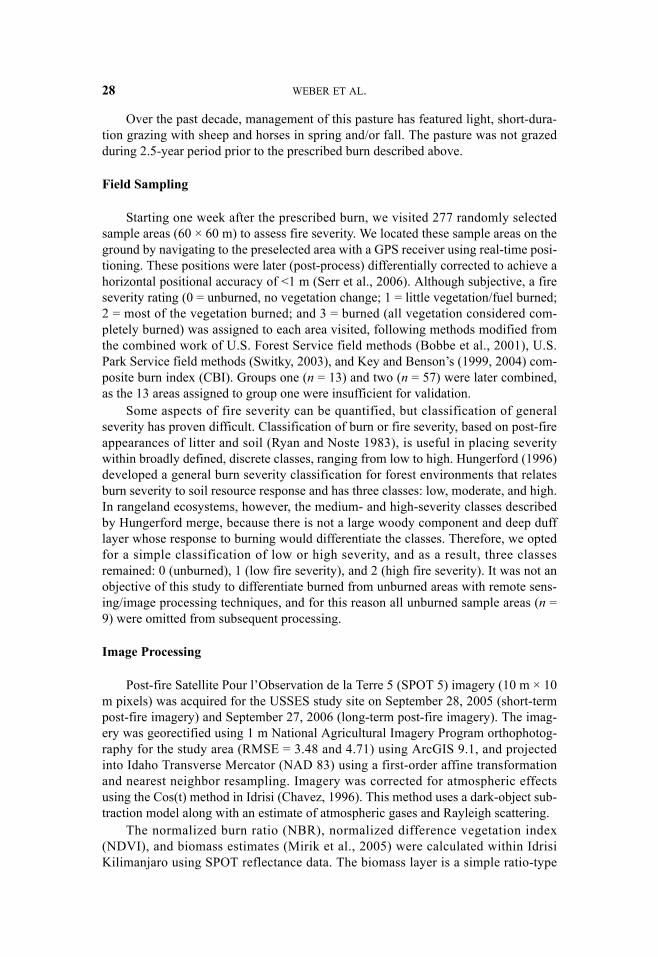
Post-fire Satellite Pour l’Observation de la Terre 5 (SPOT 5) imagery (10 m × 10m pixels) was acquired for the USSES study site on September 28, 2005 (short-termpost-fire imagery) and September 27, 2006 (long-term post-fire imagery). The imag-ery was georectified using 1 m National Agricultural Imagery Program orthophotog-raphy for the study area (RMSE = 3.48 and 4.71) using ArcGIS 9.1, and projectedinto Idaho Transverse Mercator (NAD 83) using a first-order affine transformationand nearest neighbor resampling. Imagery was corrected for atmospheric effectsusing the Cos(t) method in Idrisi (Chavez, 1996). This method uses a dark-object sub-traction model along with an estimate of atmospheric gases and Rayleigh scattering.
The normalized burn ratio (NBR), normalized difference vegetation index(NDVI), and biomass estimates (Mirik et al., 2005) were calculated within IdrisiKilimanjaro using SPOT reflectance data. The biomass layer is a simple ratio-type
FIRE SEVERITY MODEL ACCURACY 29
vegetation index, in which reflectance values from the short-wave infrared region(band) are divided by reflectance values from the green band. While Mirik et al.(2005) demonstrated a strong empirical relationship (R2 = 0.87) between this indexand total rangeland biomass, the relationship of the biomass index and actual range-land biomass was not performed as part of this study.
Topography layers (elevation, slope, and aspect) were assembled for use withinthe CTA process (Elumnoh and Shrestha, 2000), as these variables can be key deter-minants of vegetation patterns and subsequently fire severity, especially in areas ofsteep terrain. Elevation data were acquired from the shuttle radar topography mission(SRTM) and resampled to 10 m to match the spatial resolution of the SPOT 5 imag-ery. Slope and aspect models were derived from these elevation data using IdrisiKilimanjaro.
We rasterized the polygon shapefiles describing the fire perimeters and used theshapefiles as a mask for all raster data. Field observations were similarly masked andonly those points falling inside the fire perimeter were used in the CTA. Masking wasundertaken to help facilitate classification by prudently applying ancillary knowledgeto better inform the classifier—a well-accepted technique referred to as “cluster bust-ing” (Jensen, 1996; Hunter, 2004). CTA was performed using the Gini splitting algo-rithm (Zambon et al., 2006) with five input images. The datasets containednear-infrared (NIR), NDVI, NBR, and biomass band-ratios, along with the slopelayer. These layers were selected based upon performance results from previous workreported in Weber et al. (2008).
In order to absorb georegistration error within the SPOT imagery (RMSE = 3.48and 4.71) and ensure that correct and representative pixels were included in the analy-sis, all sample areas were buffered by 5 m (Weber, 2006). The resulting layers wererasterized using ArcGIS 9.1 and subset into training and validation sites. A total of385 training site pixels and 207 validation site pixels were created as a result. We per-formed CTA using these data with Idrisi Kilimanjaro.
The resulting fire severity models were compared using a full cross-classifica-tion/cross tabulation procedure in Idrisi. In addition, the Kappa Index of Agreementwas used to describe how well each model result differed from a purely chance classi-fication (Titus et al., 1984; Rosenfield and Fitzpatrick-Lins, 1986; Cartensen, 1987).
RESULTS AND DISCUSSION
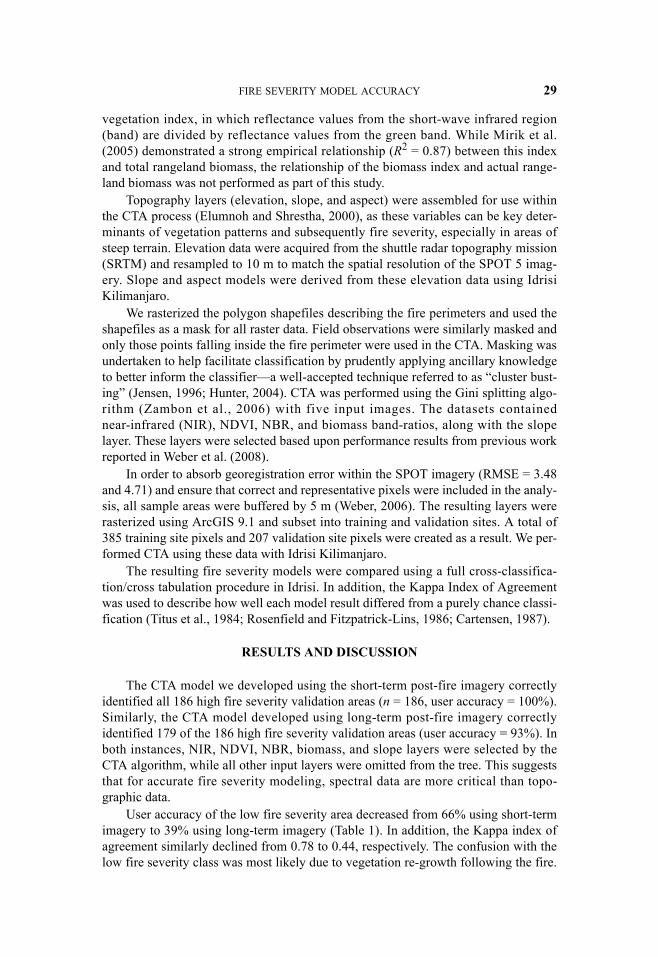
The CTA model we developed using the short-term post-fire imagery correctlyidentified all 186 high fire severity validation areas (n = 186, user accuracy = 100%).Similarly, the CTA model developed using long-term post-fire imagery correctlyidentified 179 of the 186 high fire severity validation areas (user accuracy = 93%). Inboth instances, NIR, NDVI, NBR, biomass, and slope layers were selected by theCTA algorithm, while all other input layers were omitted from the tree. This suggeststhat for accurate fire severity modeling, spectral data are more critical than topo-graphic data.
User accuracy of the low fire severity area decreased from 66% using short-termimagery to 39% using long-term imagery (Table 1). In addition, the Kappa index ofagreement similarly declined from 0.78 to 0.44, respectively. The confusion with thelow fire severity class was most likely due to vegetation re-growth following the fire.
30 WEBER ET AL.
Field observations made during the summer of 2006 (n = 233) recorded over 100sample points with 16–25% cover of grasses. In addition, nearly 100 sample pointswere recorded having 6–15% shrub cover, the majority of which was rabbitbrush(Chrysothamnus spp.) that established following the fire. Yet another factor affectingground cover at the USSES was the presence of a large amount of forbs, primarilylupine. Ninety-six of 233 sample points had forb cover estimates (i.e., lupine)between 16 and 25%.
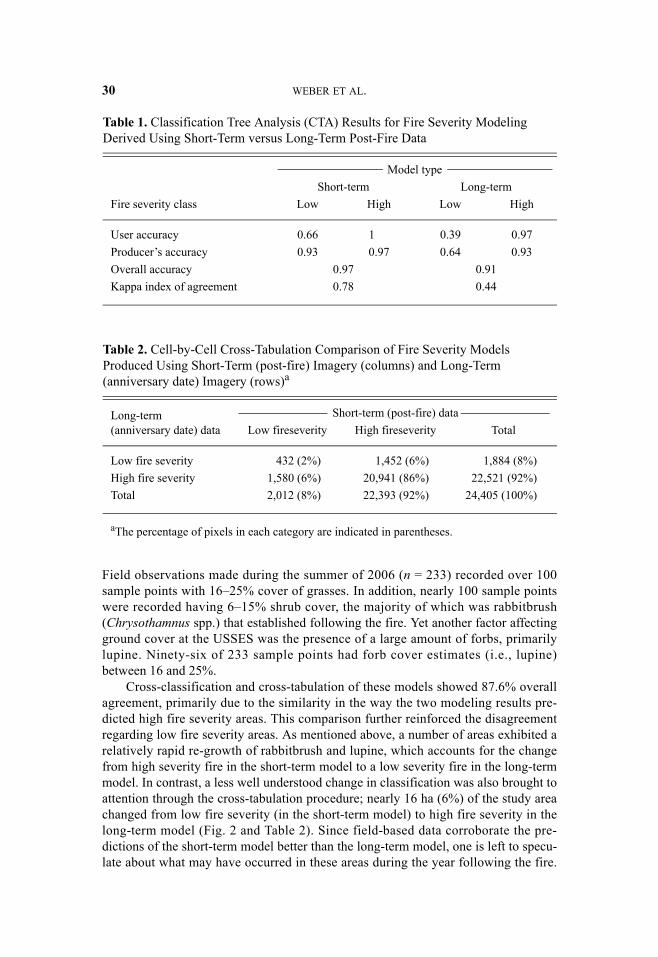
Cross-classification and cross-tabulation of these models showed 87.6% overallagreement, primarily due to the similarity in the way the two modeling results pre-dicted high fire severity areas. This comparison further reinforced the disagreementregarding low fire severity areas. As mentioned above, a number of areas exhibited arelatively rapid re-growth of rabbitbrush and lupine, which accounts for the changefrom high severity fire in the short-term model to a low severity fire in the long-termmodel. In contrast, a less well understood change in classification was also brought toattention through the cross-tabulation procedure; nearly 16 ha (6%) of the study areachanged from low fire severity (in the short-term model) to high fire severity in thelong-term model (Fig. 2 and Table 2). Since field-based data corroborate the pre-dictions of the short-term model better than the long-term model, one is left to specu-late about what may have occurred in these areas during the year following the fire.
Table 1. Classification Tree Analysis (CTA) Results for Fire Severity Modeling Derived Using Short-Term versus Long-Term Post-Fire Data
Model typeShort-term Long-term
Fire severity class Low High Low High
User accuracy 0.66 1 0.39 0.97Producer’s accuracy 0.93 0.97 0.64 0.93Overall accuracy 0.97 0.91Kappa index of agreement 0.78 0.44
Table 2. Cell-by-Cell Cross-Tabulation Comparison of Fire Severity Models Produced Using Short-Term (post-fire) Imagery (columns) and Long-Term (anniversary date) Imagery (rows)a
Long-term(anniversary date) data
Short-term (post-fire) data Low fireseverity High fireseverity Total
Low fire severity 432 (2%) 1,452 (6%) 1,884 (8%)High fire severity 1,580 (6%) 20,941 (86%) 22,521 (92%)Total 2,012 (8%) 22,393 (92%) 24,405 (100%)
aThe percentage of pixels in each category are indicated in parentheses.

FIRE SEVERITY MODEL ACCURACY 31
Analysis of 2006 field data and photo points offer a few possible explanations: Whilethe mean bare ground cover class recorded in all areas considered low fire severity inthe short-term model was 16–25% (n = 16), the mean shrub cover class in areas inagreement for low fire severity was 6–15%, whereas those areas in disagreement forlow fire severity had a mean shrub cover of 1–5%. This may indicate that some of theareas within the perimeter of the fire recovered more slowly (which could be as muchattributable to environmental factors as to the severity of the fire), although it must beremembered that this speculation is based upon only 16 field observations. Furtherpost-fire sampling should be conducted to monitor the recovery of these areas anddetermine if any real differences truly exist.
Based on the comparison of accuracies, Kappa statistic, and overall agreementbetween the modeling results, it seems clear that performing a fire severity assess-ment one year after a fire in sagebrush steppe rangelands yields little benefit for theland manager. While most high fire severity areas remain clearly distinguishable (fur-ther corroborating the accuracy of the short-term fire severity model) even one yearpost-fire, the benefit of having an accurate fire severity model to plan remediationefforts shortly after a fire offers numerous distinct advantages for land managers, suchas starting remediation before winter while developing plans and collecting resourcesduring the winter for early spring restoration activities.
Fig. 2. Cross-tabulation between short-term (post-fire imagery) and long-term (anniversarydate imagery) fire severity models.

32 WEBER ET AL.
Assessment of Error and Bias
Models developed using CTA were able to classify high fire severity areas withgood user accuracy (~100%).4 However, achieving satisfactory results appears to be afunction of adequate sample size for each class considered (low fire severity or high
4See Figure 3 for a step-by-step approach and cartographic model of this technique.
Fig. 3. Cartographic model of the process followed to produce a fire severity model usingclassification tree analysis at the U.S. Sheep Experimental Station study site.

FIRE SEVERITY MODEL ACCURACY 33
fire severity). Initially, it may appear that a disproportionately large number of valida-tion sites were used in high fire severity areas (n = 193, 92%; Table 1). However, asfire severity is primarily a function of the fire’s behavior—which is closely tied tofactors such as the amount and type of fuels and the weather during the fire (Pyne etal., 1996)—the proportion of high fire severity sites (used for both modeling and vali-dation) agreed well with field observations in which 92% of the study area wasrecorded as high severity (Fig. 4). Indeed, when the proportions of the random sam-pling locations were compared with proportions of fire severity areas, the resultsappear equitably distributed.
Fig. 4. Relative proportions of fire severity.

34 WEBER ET AL.
Management Implications
Land managers who are tasked with assessing fire severity in rangelands anddeveloping remediation plans within a short time of fire control cannot rely on fieldinspection to provide adequate coverage, especially for large fires. The use of easilyobtained SPOT 5 satellite imagery, soon after the fire, combined with a moderateamount of field sampling will result in an accurate delineation of high severity burnareas where remediation efforts will need to be focused. The cost of obtaining theimagery will be recouped by the savings from reduced field time and the speed withwhich remediation plans of improved quality and accuracy can be developed.
CONCLUSIONS
Vegetation management in western rangelands following fire events should bebased on pre-fire vegetation, post-fire weather conditions, soils, available resources(such as equipment, personnel, and seeds), as well as fire severity. Land managers,due to the large size and distribution of western fires, are confronted with an almostimpossible task in attempting to ascertain fire severity within a time frame suitable forthe preparation of remediation plans. However, by developing GIS layers that com-bine information on vegetation, climate, soils, and fire severity, researchers can facili-tate the creation of predictive models for more effective development of remediationplans. The present paper has focused on the mapping of fire severity, which can beused as one of the layers within a GIS-based remediation and decision support model.Researchers using readily available post-fire SPOT 5 imagery can delineate highseverity burn areas accurately, rapidly, and inexpensively.
ACKNOWLEDGMENTS
The authors and Idaho State University would like to acknowledge the IdahoDelegation for their assistance in obtaining the grant that supported this work fundedthrough the National Aeronautic and Space Administration (NASA) Goddard SpaceFlight Center (NNG05GB05G). In addition, we would like to acknowledge the assis-tance of Jill Norton, Jamen Underwood, and Penny Gneiting for their field data col-lection efforts and research in rangeland fire severity modeling, the statisticalconsultation of Teri Peterson, and the assistance of Sharon Paris.
REFERENCES
Bobbe, T., Finco, M. V., Quayle, B., and K. Lannon, 2001, Field Measurements forthe Training and Validation of Burn Severity Maps from Spaceborne, RemotelySensed Imagery, Salt Lake City, UT: USDA Forest Service, Remote SensingApplications Center, Final Project Report, Joint Fire Science Program-2001-2,project # 01B-2-1-01, 15 p. [http://www.fs.fed.us/eng/rsac/baer/final_report_01B-2-1-01.pdf], visted April 2007.
Breiman, L., Friedman, J. H., Olshen, R. A., and C. J. Stone, 1998, Classification andRegression Trees, Boca Raton, FL: CRC press, 358 p.

FIRE SEVERITY MODEL ACCURACY 35
Brewer, C. K., Winne, J. C., Redmond, R. L., Opitz, D. W., and M. V. Mangrich,2005, “Classifying and mapping wildfire severity: A comparison of methods,”Photogrammetric Engineering and Remote Sensing, 71(11), 1311–1320.
Brooks M. L., D’Antonio, C. M., Richardson, D. M., Grace, J. B., Keeley, J. E.,DiTomaso, J. M., Hobbs, R. J., Pellant, M., and D. Pyke, 2004, “Effects of AlienPlants on Fire Regimes,” Bioscience, 54(7):677–688.
Carstensen, L. W., 1987, “A Measure of Similarity for Cellular Maps,” The AmericanCartographer, 14(4):345–358.
Chavez, P. S., 1996, “Image-Based Atmospheric Corrections—Revisited andImproved,” Photogrammetric Engineering and Remote Sensing, 62(9):1025–1036.
Cocke, A. E., Fule, P. Z., and J. E. Crouse, 2005, “Comparison of Burn SeverityAssessments Using Differenced Normalized Burn Ratio and Ground Data,”International Journal of Wildland Fire, 14:189–98.
DeBano, L. F., Neary, D. G., and P. F. Pfolliott, 1998, Fire’s Effects on Ecosystems,New York, NY: John Wiley and Sons, 333 p.
Diaz-Delgado, R., Lloret, F., and X. Pons, 2003, “Influence of Fire Severity on PlantRegeneration by Means of Remote Sensing Imagery,” International Journal ofRemote Sensing, 24(8):1751–1763.
Epting, J., Verbyla, D., and B. Sorbel, 2005, “Evaluation of Remotely Sensed Indicesfor Assessing Burn Severity in Interior Alaska using Landsat TM and ETM+,”Remote Sensing of Environment, 96:328–339.
Elumnoh, A. and R. P. Shrestha, 2000, “Application of DEM Data to Landsat ImageClassification: Evaluation in a Tropical Wet-Dry Landscape in Thailand,” Photo-grammetric Engineering and Remote Sensing, 66(3):297–304.
Flasse, S., Trigg, S., Ceccato, P., Perryman, A., Hudak, A., Thompson, M., Brockett,B., Dramé, M., Ntabeni, T., Frost, P., Landmann, T., and J. le Roux, 2004,“Remote Sensing of Vegetation Fires and Its Contribution to a Fire ManagementInformation System,” in Wildfire Management Handbook for Sub-Sahara Africa,Goldammer, J. G. and C. de Ronde (Eds.), The Hague, Netherlands: SPBPublishing, 158–211.
Finley, C. D., 2006, Field Evaluation and Hyperspectral Imagery Analysis of Fire-Induced Water Repellent Soils and Burn Severity in Southern Idaho Rangelands,Pocatello, ID: Idaho State University, 237 p. [http://giscenter.isu.edu/Research/techpg/nasa_tlcc/to_pdf/cfthesis.pdf], visited April 2007.
Fraser, R. H. and Z. Li, 2002, “Estimating Fire Related Parameters in Boreal ForestUsing SPOT Vegetation Imagery,” Remote Sensing of Environment, 82:95–110.
Friedl, M. A. and C. E. Brodley, 1997, “Decision Tree Classification of Land Coverfrom Remotely Sensed Data,” Remote Sensing of Environment, 61(3):399–409.
Garcia, M. and E. Chuvieco, 2004, “Assessment of the Potential of SAC-C/MMRSImagery for Mapping Burned Areas in Spain,” Remote Sensing of Environment,92:414–423.
Hungerford, R. D. 1996, Soils, Marana, AZ: USDA Forest Service, NationalAdvanced Resource Technology Center, Fire in Ecosystem Management Notes,Unit II-I.

36 WEBER ET AL.
Hunter, B., 2004, Overview of Methodology for Remote Sensing/GIS Analysis ofLakes Lewisville and Grapevine Shoreline Management Project, Denton, TX:University of North Texas.
Jensen, J. R. 1996, Introductory Digital Image Processing, Englewood Cliffs, NJ:Prentice Hall.
Key, C. H. and N. C. Benson, 1999, “The Normalized Burn Ratio (NBR): A LandsatTM Radiometric Index of Burn Severity,” [http://www.nrmsc.usgs.gov/research/ndbr.htm], visited April 2007.
Key, C. H. and N. C. Benson, 2004, Remote Sensing Measure of Severity: The Nor-malized Burn Ratio, FIREMON Landscape Assessment (LA) V4, Sampling andAnalysis Methods, Ft. Collins, CO: USFS Rocky Mountain Research Station.
Key, C. H. and N. C. Benson, 2006, Landscape Assessment (LA) Sampling and Anal-ysis Methods, Washington, DC: USDA Forest Service General Technical ReportRMRS-GTR-164-CD, 55 p.
Lawrence, R. L. and A. Wright, 2001, “Rule-Based Classification Systems UsingClassification and Regression Tree (CART) Analysis,” Photogrammetric Engi-neering and Remote Sensing, 67(10):1137–1142.
Lentile, L. B., Holden, Z. A., Smith, A. M. S., Falkowski, M. J., Hudak, A. T., Mor-gan, P., Lewis, S. A., Gessler, P. E., and N. C. Benson, 2006, “Remote SensingTechniques to Assess Active Fire Characteristics and Post-Fire Effects,” Inter-national Journal of Wildland Fire, 15(3):319–345.
McKay, R. J. and N. A. Campbell, 1982, “Variable Selection Techniques in Discrimi-nant Analysis II: Allocation,” British Journal of Mathematical and StatisticalPsychology, 35:30–41.
Miller, J. and J. Franklin, 2001, “Modeling the Distribution of Four Vegetation Alli-ances Using Generalized Linear Models and Classification Trees with SpatialDependence,” Ecological Modeling, 157:227–247.
Mirik, M., Norland, J. E., Crabtree, R. L., and M. E. Biondini, 2005, “HyperspectralOne-Meter-Resolution Remote Sensing in Yellowstone National Park, Wyoming:II. Biomass,” Rangeland Ecology and Management, 58(5):459–465.
Moffet, C. A., Pierson, F. B., Robichaud, P. R., Spaeth, K. E., and S. P. Hardegree,2007, “Modeling Soil Erosion on Steep Sagebrush Rangeland Before and AfterPrescribed Fire,” Catena, 71:218–228.
NRCS (Natural Resources Conservation Service), 1995, Soil Investigation of Agricul-ture Research Service, United States Sheep Experiment Station HeadquartersRange, Rexburg, ID: US Department of Agriculture, NRCS, 133 p.
Nelson, S. and K. T. Weber, 2008, “Evaluation of Alternative Simple Band Ratios,” inFinal Report: Impact of Temporal Landcover Changes in Southeastern IdahoRangelands (NNG05B-5G), K. T. Weber (Ed.), Pocatello, ID: Idaho StateUniversity, 255–260.
Norton, J., 2006, The Use of Remote Sensing Indices to Determine Wildland BurnSeverity in Semiarid Sagebrush Steppe Rangelands Using Landsat ETM+ andSPOT 5, Pocatello, ID: Idaho State University, 111 p. [http://giscenter.isu.edu/Research/techpg/nasa_tlcc/to_pdf/jnthesis.pdf"http://giscenter.isu.edu/Research/techpg/nasa_tlcc/to_pdf/jnthesis.pdf], visited April 2007.
FIRE SEVERITY MODEL ACCURACY 37
Patterson, M. W. and S. R. Yool, 1998, “Mapping Fire-Induced Vegetation MortalityUsing Landsat Thematic Mapper Data: A Comparison of Linear TransformationTechniques,” Remote Sensing of Environment, 65:132–142.
Pierson, F. B., Robichaud, P. R., and K. E. Spaeth, 2001, “Spatial and TemporalEffects of Wildfire on the Hydrology of a Steep Rangeland Watershed,” Hydro-logical Processes, 15:2905–2916.
Pyke, D. A., Herrick, J. E., Shaver, P., and M. Pellant, 2002, “Rangeland Health Attri-butes and Indicators for Qualitative Assessment,” Journal of Range Manage-ment, 55:584–597.
Pyne, S. J., Andrews, P. L., and R. D. Laven, 1996, Introduction to Wildland Fire,New York, NY: John Wiley and Sons, 769 p.
Qi, J., Chehbouni, A., Huete, A. R., Kerr, Y. H., and S. Sorooshian, 1994, “A Modi-fied Soil-Adjusted Vegetation Index,” Remote Sensing of Environment, 48:119–126.
Rosenfield, G. H., and K. Fitzpatrick-Lins, 1986, “A Coefficient of Agreement as aMeasure of Thematic Classification Accuracy,” Photogrammetric Engineeringand Remote Sensing, 52(2):223–227.
Ryan, K. C. and N. V. Noste, 1983, “Evaluating Prescribed Fires,” in Proceedings,Symposium and Workshop on Wilderness Fire, Lotan, J. E., Kilgore, B. M.,Fischer, W. C., and R. W. Mutch (Tech. Coords.), Ogden, UT: U.S. Departmentof Agriculture, Forest Service, Intermountain Research Station, General Techni-cal Report INT-182, 230–238.
Salvador, R., Valeriano, J., Pons, X., and R. Diaz-Delgado, 2000, “A Semi-automaticMethodology to Detect Fire Scars in Shrubs and Evergreen Forests with LandsatMSS Time Series,” International Journal of Remote Sensing, 21:655–671.
Schmidt, H. and A. Kanielli, 2001, “Sensitivity of Vegetation Indices to SubstrateBrightness in Hyper-Arid Environment: The Makhtesh Ramon Crater (Israel)Case Study,” International Journal of Remote Sensing, 22:3503–3520.
Serr, K., Windholz, T. K., and K. T. Weber, 2006, “Comparing GPS Receivers: AField Study,” URISA Journal, 18(2):19–24.
Switky, K. R., 2003, Fire Monitoring Handbook, Boise, ID: National Park ServiceFire Management Program Center, National Interagency Fire Center, 274 p.
Thoren, F. and D. Mattsson, 2002, “Historic Wildfire Research in SoutheasternIdaho” [http://giscenter.isu.edu/research/techpg/blm_fire/historic/wildfire_report.pdf], visited April 2007.
Titus, K., Mosher, J. A., and B. K. Williams, 1984, “Chance-Corrected Classificationfor Use in Discriminant Analysis: Ecological Applications,” American MidlandNaturalist, 111:1–7.
Turner, M. G., Hargrove, W. W., Gardner, R. H., and Romme, W. H., 1994, “Effects ofFire on Landscape Heterogeneity in Yellowstone National Park, Wyoming,”Journal of Vegetation Science, 5: 731–742.
U.S. Department of the Interior, 2004, Departmental Manual, Part 620 Chapter 3,Burned Area Emergency Stabilization and Rehabilitation (620DM3). Washing-ton, DC: U.S. Department of the Interior, 16 p.
Van Wagtendonk, J. W., Root, R. R., and C. H. Key, 2004, “Comparison of AVIRISand Landsat ETM+ Detection Capabilities for Burn Severity,” Remote Sensing ofEnvironment, 92:397–408.

38 WEBER ET AL.
Weber, K. T., 2006, “Challenges of Integrating Geospatial Technologies into Range-land Research and Management,” Rangeland Ecology and Management,59(1):38–43.
Weber, K. T., Seefeldt, S. S., Norton, J., and C. Finley, 2008, “Fire Severity Modelingof Sagebrush-Steppe Rangelands in Southeastern Idaho,” GIScience and RemoteSensing, 45(1):68–82.
White, J. D., Ryan, K. C., Key, C. H., and S. W. Running, 1996, “Remote Sensing ofForest Fire Severity and Vegetation Recovery,” International Journal of Wild-land Fire, 6:125–36.
Zambon, M., Lawrence, R., Bunn, A., and S. Powell, 2006, “Effect of AlternativeSplitting Rules on Image Processing Using Classification Tree Analysis,” Photo-grammetric Engineering and Remote Sensing, 72(1):25–30.