fire-sale fdi - nyupages.stern.nyu.edu/~sternfin/vacharya/public_html/acharya_shin... · fdi around...
TRANSCRIPT
Fire-Sale FDI1
Viral Acharya2
London Business School, NYU-Stern,
CEPR and NBER
Hyun Song Shin3
Princeton University
Tanju Yorulmazer4
Federal Reserve Bank of New York
This Draft: May 2009
1The views expressed here are those of the authors and do not necessarily represent the views ofthe Federal Reserve Bank of New York or the Federal Reserve System. A part of this project wascompleted when Viral Acharya was visiting Stanford-GSB. We are grateful to Mark Aguiar, BernardDumas, Douglas Gale, Mariassunta Gianetti, Stefan Gissler, Linda Goldberg, Gita Gopinath, PeterBlair Henry, Jean Imbs, Jose Scheinkman, Eric van Wincoop, and participants of the 2007 NBERInternational Macroeconomics workshop, the 2008 Annual Meeting of the American Finance Associ-ation, the 2008 Meeting of the European Finance Association, and the seminar at Sabancı Universityfor useful suggestions. We thank Yili Zhang for excellent research assistance. All errors remain ourown.
2Contact: Department of Finance, Stern School of Business, New York University, 44 West 4St., Room 9-84, New York, NY - 10012, USA. Tel: +1 212 998 0354, Fax: +1 212 995 4256, e–mail:[email protected]. Acharya is also a Research Affiliate of the Centre for Economic PolicyResearch (CEPR).
3Contact: Princeton University, Bendheim Center for Finance, 26 Prospect Avenue, Princeton,NJ 08540-5296, USA. Tel: +1 609 258 4467, Fax: +1 609 258 0771, E–mail: [email protected].
4Contact: Federal Reserve Bank of New York, 33 Liberty Street, New York, NY 10045, USA.Tel: +1 212 720 6887, Fax: +1 212 720 8363, E–mail: [email protected]
Fire-Sale FDI
Abstract
Financial crises are often accompanied by an outflow of foreign portfolio investment and
an inflow of foreign direct investment (FDI). We provide an agency-theoretic framework that
explains this phenomenon. We show that during crises, agency problems affecting domestic
firms are exacerbated, and, in turn, external financing constrained. Transfer of control in
the form of direct ownership of failed firms’ assets by alternate users can circumvent agency
problems, but during crises, efficient owners (e.g. other domestic firms) face similar financing
constraints. The result is a transfer of ownership to foreign firms, including inefficient ones,
at fire-sale prices. Such fire-sale FDI is associated with a flipping of acquired firms back to
domestic owners once the crisis abates. These features of fire-sale FDI find empirical support.
J.E.L. Classification: G21, G28, G32, E58, D61
Keywords: Capital flight, FDI flows, financial crises, foreign takeovers, flipping.
1 Introduction
One characteristic feature of capital flows during some financial crises is the contrast between
capital outflows associated with portfolio investments, and the simultaneous inflows in the
form of foreign direct investment (FDI). Even as foreign investors and creditors run for cover
as the crisis unfolds, there is an accompanying surge in direct inward investment where foreign
investors take over firms in the crisis-stricken country.
Consider Table 1 which reports the correlation between FDI and foreign portfolio invest-
ment (FPI) over the period 1980-2005 for the countries hit by the Asian financial crisis. In
particular, it presents the correlation between FDI and FPI (and also FDI and only the debt
component of FPI) for the non-crisis years of 1980-1995 and 2001-2005, and for the crisis
years of 1996-2000. The pattern is striking. With the exception of Indonesia, there is a
significant reversal in the sign of correlation between FDI and FPI: In non-crisis years, the
two are positively correlated (and weakly negatively so for Malaysia in the case of FPI Debt),
but in crisis years, they are strongly negatively correlated.1 This pattern is further illustrated
in Figures 1 and 2 for South Korea and Philippines, respectively. Figures 1a and 2a plot the
time-series of FDI and FPI flows for the two countries during 1990-2005. The sharp rise in
FDI around 1996-1998 is markedly coincident with the steep drop in FPI. Figures 1b and 2b
graphically illustrate the reversal of correlation between FDI and FPI Debt. The message
is clear: The crisis and the non-crisis years behave as though there is a regime shift in the
relationship between FDI and FPI.
A recent paper by Aguiar and Gopinath (2005) also documents evidence for inflow of such
FDI using data on mergers and acquisitions for Asian countries that underwent the 1997 Asian
financial crisis. Krugman (1998), in an earlier piece, shows that a similar, though probably
less marked, boom in inward direct investment took place in Latin America, especially in
Mexico during 1995 and also for Argentina. His primary conclusion is that surging foreign
direct investment resulting from fire sales has been an empirical regularity during recent
financial crises.
While a positive correlation between FDI and FPI is consistent with intuitive priors, for
example, due to commonality between domestic and foreign shocks or strategic complemen-
1In spite of the fact that we have a limited time-series (there are only five annual data points for the crisisperiod), several of the correlation coefficients are statistically different (at at least 10% level of confidence)between the non-crisis and crisis years. This is the case for FDI and FPI correlation for Thailand, Philippinesand Korea (for the last two, this is also the case for FDI and FPI Debt correlation). Individually, the non-crisis period’s FDI and FPI correlation is significantly positive at 1% level for all countries except Malaysia,and the same holds for FDI and FPI debt correlation except for Thailand and Malaysia; in contrast, the crisisperiod’s FDI and FPI debt correlation is significantly negative at 5% level for all countries except Thailandand Indonesia.
1
tarity between FDI and FPI2, the divergent behavior of FDI and FPI shown above poses a
puzzle for economists. On the surface, a drying up of foreign portfolio flows seems to indicate
a lack of confidence in the economy of the crisis-stricken country. If so, then the same lack of
confidence should also be exhibited with regard to FDI flows. The fact that FDI flows surge
in the midst of an outflow of portfolio investments strongly suggests a qualitative difference
between portfolio flows and FDI flows.
Our paper outlines a theoretical framework that proposes an explanation of this empirical
regularity, explaining why during a crisis, adversely affected firms become financially con-
strained and engage in fire sales that transfer control of assets to foreign firms, potentially
even inefficient ones. In particular, the framework generates the following combination of
empirical implications:
• During a financial crisis, FDI flows surge even as portfolio flows reverse, in contrast to
the positive juxtaposition of the two observed during normal times.
• FDI inflows during crisis times are associated with foreigners acquiring controlling
stakes. FDI inflows during normal times are associated with smaller stakes, not neces-
sarily granting control.
• Finally, and most distinctively, FDI acquisitions made during crisis times are subse-
quently “flipped” by the foreign acquirer - that is, re-sold quickly - to domestic buyers
once financial conditions improve in the crisis-stricken country. In contrast, there is
no systematic evidence of flipping of FDI acquisitions made during normal times. This
difference between normal times and crises arises because acquisitions in normal times
do not feature fire-sale discounts and are thus unlikely to be made by inefficient foreign
or out-of-industry acquirers.
Using data on FPI and FDI flows and mergers and acquisitions for countries that un-
derwent the Asian financial crisis of 1997-1998, we verify that all of the above empirical
implications are borne out in the data. The result on flipping is perhaps the most significant
finding relative to the existing literature. Our paper presents a rather different perspective
as compared to the well-known paper by Aguiar and Gopinath (2005), who propose a model
where foreign acquirers have an advantage in both financing and technology, whereby foreign-
ers have the financial resources to acquire domestic assets and also superior technology to run
these assets efficiently. The flipping result suggests that this cannot be the full story, and we
need something else to explain the subsequent flipping if foreigners were the natural holders
of the assets. In our model, some foreigners have comparative advantage in financing but not
in technology, and hence, have incentives to sell assets back to efficient owners once the crisis
2See, for example, Pfeffer (2008).
2
abates. This flipping result is not only an empirical curiosity. It goes to the heart of the
policy debates and normative issues associated with the welfare consequences of FDI during
crisis times. Therefore, we view the theoretical modeling as being essential for the proper
understanding of such welfare questions. A more detailed description of our theoretical and
empirical work follows.
Formally, we consider a two-period model with a measure 1 of domestic firms, foreign
investors, and a regulator. Two central assumptions drive our results: (i) domestic firms are
more efficient users of domestic assets than foreigners as long as domestic firms take good
projects (we relax this assumption in Section 4.3 and allow for differential efficiency among
foreigners, where some foreigners are more efficient than the domestic firms); and (ii) there
is a possibility of moral hazard in that domestic firm owners derive private benefits from bad
projects; hence, domestic owners take good projects only if they retain a large enough share
of future profits.
Domestic firms have two risky investment opportunities with maturity of one period, one
at t = 0 and one at t = 1. Domestic firms start with one unit of capital, which they use to
undertake the risky investment at t = 0. The entire capital of the firms with the low return
from the first-period investment is wiped out. Due to moral hazard, firms can pledge only
a fraction of their expected return from the second investment. When the prospects for the
second investment is favorable, expected return is high and the failed firms can generate the
needed funds, even if they can pledge only a fraction due to moral hazard. However, for
weaker prospects, even though the second investment can be a positive NPV project, the
amount that can be pledged may not be enough to generate the one unit of capital needed to
undertake the second period project. In that case, a failed firm cannot undertake the second
period investment and is put up for sale. In other words, when the agency problem is severe,
firms with adverse first-period shock are rendered as financially constrained, and a transfer
of control is necessary for their second period investment to be feasible.
We assume that there is a common (say, macroeconomic) component to returns on risky
investments of domestic firms that is persistent over time. The implication is that there
is a ‘crisis” when the macroeconomic shock is sufficiently adverse since a large number of
domestic firms are affected by the shock, investors revise downward the prospects of future
investment or upward the attendant agency problems, and hence, affected firms cannot raise
required financing even for profitable investments.3 These firms must engage in asset sales
that transfer control of their assets to alternative buyers. Surviving firms, if any, and foreign
investors purchase failed firms’ assets. Surviving domestic firms use some of the return from
the first investment to undertake their own second period investment, but potentially are left
3A similar effect could arise if a negative shock to domestic firms is coincident with stress in global capitalmarkets.
3
with spare liquidity. Hence, they rely less on external financing and agency problems are
mitigated when there is transfer of control of failed firms’ assets. The spare liquidity and the
external finance surviving firms can raise against the second period investment constitute the
total liquidity they can use for asset purchases. The external finance constitutes (in general,
at least partly) the economy’s FPI.
Up to a critical proportion of failures, surviving firms’ total liquidity is enough to pur-
chase all failed firms’ assets at the “fundamental” price: surviving firms compete for these
assets and the price stays at the fundamental price. Beyond this critical proportion of fail-
ures, additional assets cannot be absorbed by the available liquidity of surviving firms at
the fundamental price. Thus, the market-clearing price declines with further failures. For
sufficiently large proportion of failures, the price of failed firms’ assets falls sufficiently low so
that even inefficient outsiders (foreigners) find it profitable to acquire domestic assets, giving
rise to fire-sale FDI.
As the proportion of failures increases, the proportion of surviving firms decreases. This,
in turn, results in the total borrowing capacity of the domestic economy, and thus the FPI,
to decrease. Furthermore, as the proportion of failures increase, the domestic assets acquired
by foreign investors increase, resulting in an increase in fire-sale FDI. Hence, during crisis
periods, we see the seemingly puzzling negative correlation between FDI and FPI.
We consider two extensions of our benchmark model. First, we assume that the outsiders
(the foreigners) also have limited funds. In this case, once the proportion of failures is
sufficiently large, even the total liquidity of surviving firms and foreigners is not enough
to clear the market for asset sales at the threshold value of foreigners. Thus, there is a
further decline in the market-clearing price as the proportion of failures increases. Since
purchasing assets at such prices becomes profitable for foreigners, in equilibrium they need
to be compensated also for purchasing shares of surviving firms. As a result, the share price
of surviving firms falls below their fundamental value and surviving firms have to suffer some
discount when they issue shares, that is, surviving firms can raise equity financing only at
discounts. Furthermore, when the foreign capital that can enter the domestic economy is low,
the discount in the capital market can be so high that surviving firms cannot generate the
needed funds to undertake the second period investments. This, in turn, leads to a complete
breakdown of the capital market or drying up of FPI, and the domestic economy experiences
a structural break where foreign funds enter the domestic economy only through FDI.
Second, we extend the model to allow for efficient foreigners. In particular, some foreigners
can be more efficient than domestic firms but they may not be able to enter the domestic
market due to barriers to entry. Hence, in the presence of barriers to entry, crisis can allow
efficient foreigners to enter, which may be beneficial for crisis-stricken countries. However,
for severe crises, the price may fall so low that even inefficient foreigners may enter.
4
As emphasized already, our distinctive contribution is in developing empirical implications.
There are three important empirical implications of our model. First, as explained above,
FDI flows surge precisely when there is an outflow of portfolio capital. This pattern was
illustrated in Figures 1 and 2 for South Korea and Philippines, respectively, and will be
discussed further in the text.
Second, the FDI inflows during financial crises should be associated with the acquisition
of stakes that grant control, rather than simply acquisition of cash-flow stakes. There is
ample evidence supporting this hypothesis. The unabridged version of Acharya, Shin and
Yorulmazer (2007) studies the M&A activity in the financial sector in the countries hit by
the Asian crisis during the period 1996-2000. They show (in their Table 2) that the crisis
year of 1998 witnessed greater foreign acquisitions, but crucially, unlike non-crisis years, these
acquisitions represented stakes of greater than 50 percent, and often the entire 100 percent. In
contrast, the stakes during non-crisis years were far smaller and almost always lower than 50
percent. Additional evidence from UN (1999), Chari, Ouimet and Tesar (2004), and Aguiar
and Gopinath (2005) is discussed in Section 5. Finally, and perhaps most distinctively
compared to the previous literature, our theory predicts the “flipping” of assets acquired at
fire sales once the crisis abates and prices rebound.
Using the SDC Platinum data on mergers and acquisitions, Figure 3A provides succinct
evidence for such flipping during the South East Asian crisis (also see Figure 3B). It defines a
“flip” as the subsequent sale (2001 onwards) of an acquisition that occurred during the crisis
period (1996-2000). Employing the standard definition of FDI as corresponding to a purchase
of at least 10% of the target, the figure plots the cumulative percentage of flipped deals in
each class as a function of the number of years since the acquisition in the crisis period.4
There is clear evidence of greater flipping for targets acquired by foreign firms compared to
those acquired by domestic firms during the crisis. While domestic firms in our model do not
have a reason to flip the deals acquired during crisis, their flipping rate serves as a control
for the “natural” rate of flipping of deals acquired during crisis.
For example, in Figure 3, we observe that foreign deals are flipped more often than
domestic deals starting from year one, and the gap between the two only widens as more
time elapses, especially after the fourth year. By ten years since acquisition, 10.07% of
foreign deals get flipped as compared to 5.75% of domestic deals. We provide more detailed,
difference-of-difference style, evidence in the paper that such flipping is not observed for the
period of 1991-1995 preceding the crisis (Figure 4A), and observed only for foreign acquisitions
during the crisis period of 1996-2000 (Figure 4B). Furthermore, this differential result holds
only for nations embroiled in the South East Asian crisis but not for other nations in the
4The convention for distinguishing between FPI and FDI is whether the ownership stake is above or belowthe 10% threshold, where a stake higher (lower) than 10% is classified as FDI (FPI).
5
region. We establish these results non-parametrically as well as in probit estimates of the
likelihood of flipping.
We conclude the paper by illustrating that our theoretical framework also holds the poten-
tial to address welfare questions concerning the desirability of foreign takeovers. In particular,
the role of foreign capital in the overall resolution policy following a crisis has been a key
thread in the policy discussions. We present some normative implications in this regard. Be-
fore proceeding to the main text, we would like to stress two points. First, that our paper
is an attempt to specifically model and explain fire-sale FDI. There is clearly FDI during
non-crisis periods. We believe that its determinants are not related to assets being available
at steep discounts. Differentiating the FDI determinants in non-crises and crises periods,
formally and econometrically, is potentially an interesting topic for further research.
Second, we believe that our model finds ready application to the credit crisis of 2007/8
in the United States and Europe. The banking sector has been systemically affected and
financial investors have “flown away”, making it difficult for banks to raise capital. Not sur-
prisingly, banks have raised capital at steep discounts and at least 15% of this capital-raising
has been from the sovereign wealth funds from Asia. Since sovereign wealth funds have until
now been passive investors, their investments in banks are perhaps also best characterized
as fire-sale FDI. Interestingly, they are also investing in more experienced investors such as
private equity funds, and co-investing in deals where these funds invest. Indeed, recognizing
the usefulness of entry of such experienced investors, regulations in the United States have
been relaxed to make it easier for private equity to invest in banking companies.5 The entry
of these experts funded by passive foreign investors is entirely consistent with our model’s
primary message that during distress, a firm may have to give up control in order to be able
to raise external finance, and that industry-wide distress leads to fire sales, giving incentives
to outsiders to enter and buy or take control of assets.
The remainder of the paper is structured as follows. Sections 2 and 3 present the theo-
retical model and its analysis. Section 4 presents extensions of the benchmark model. Before
turning to normative analysis, in Section 5, we present in detail existing and new evidence
supporting the three key implications of our model. Section 6 provides an analysis of resolu-
tion of financial crises and Section 7 concludes. Proofs not contained in the text are contained
in the Appendix.
5See the article “Fed Eases Private-Equity Rule” by Steven Sloan in American Banker, 23 September2008.
6
2 Model
The timeline of our benchmark model is outlined in Figure 5. We have an economy with
three dates, indexed by t ∈ {0, 1, 2}. We have a domestic economy with a measure 1 of
ex-ante identical firms. Firms are risk-neutral and have the objective of maximizing the sum
of expected profit over time. Firms have a unit of endowment at date t = 0 and nothing else
at other dates.
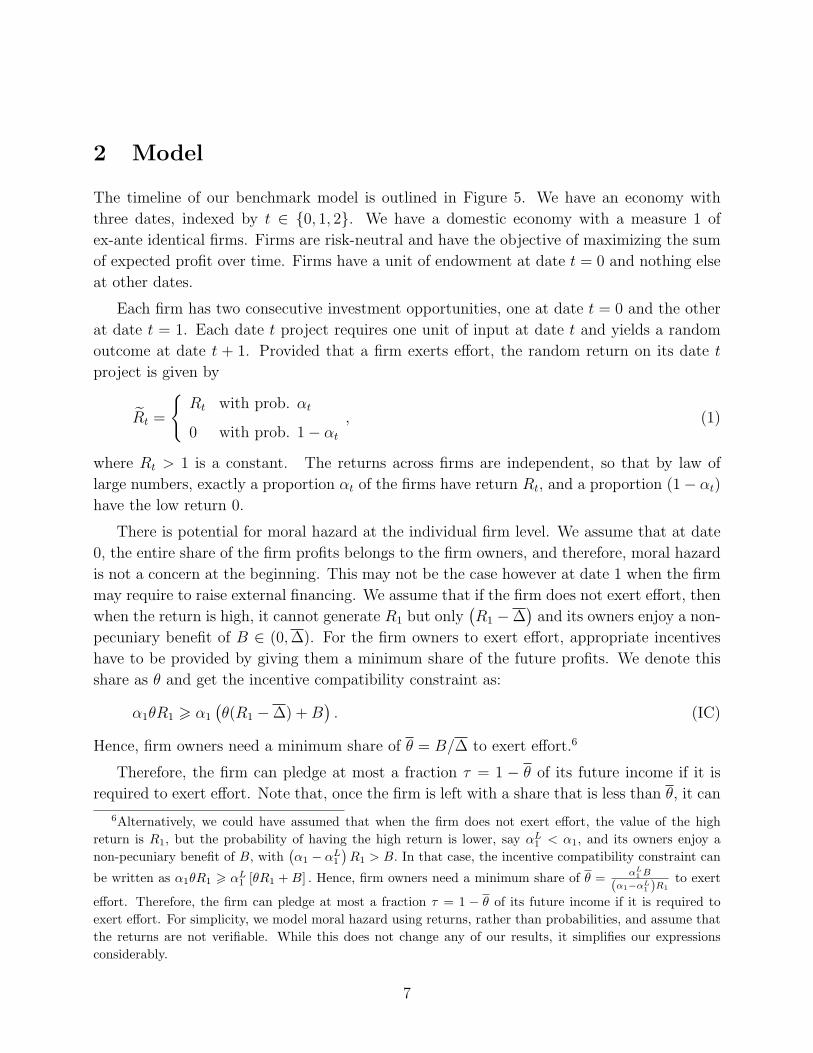
Each firm has two consecutive investment opportunities, one at date t = 0 and the other
at date t = 1. Each date t project requires one unit of input at date t and yields a random
outcome at date t + 1. Provided that a firm exerts effort, the random return on its date t
project is given by
R̃t =
{Rt with prob. αt
0 with prob. 1− αt, (1)
where Rt > 1 is a constant. The returns across firms are independent, so that by law of
large numbers, exactly a proportion αt of the firms have return Rt, and a proportion (1− αt)have the low return 0.
There is potential for moral hazard at the individual firm level. We assume that at date
0, the entire share of the firm profits belongs to the firm owners, and therefore, moral hazard
is not a concern at the beginning. This may not be the case however at date 1 when the firm
may require to raise external financing. We assume that if the firm does not exert effort, then
when the return is high, it cannot generate R1 but only(R1 −∆
)and its owners enjoy a non-
pecuniary benefit of B ∈ (0,∆). For the firm owners to exert effort, appropriate incentives
have to be provided by giving them a minimum share of the future profits. We denote this
share as θ and get the incentive compatibility constraint as:
α1θR1 > α1
(θ(R1 −∆) +B
). (IC)
Hence, firm owners need a minimum share of θ = B/∆ to exert effort.6
Therefore, the firm can pledge at most a fraction τ = 1 − θ of its future income if it is
required to exert effort. Note that, once the firm is left with a share that is less than θ, it can
6Alternatively, we could have assumed that when the firm does not exert effort, the value of the highreturn is R1, but the probability of having the high return is lower, say αL1 < α1, and its owners enjoy anon-pecuniary benefit of B, with
(α1 − αL1
)R1 > B. In that case, the incentive compatibility constraint can
be written as α1θR1 > αL1 [θR1 +B] . Hence, firm owners need a minimum share of θ = αL1 B
(α1−αL1 )R1
to exert
effort. Therefore, the firm can pledge at most a fraction τ = 1 − θ of its future income if it is required toexert effort. For simplicity, we model moral hazard using returns, rather than probabilities, and assume thatthe returns are not verifiable. While this does not change any of our results, it simplifies our expressionsconsiderably.
7
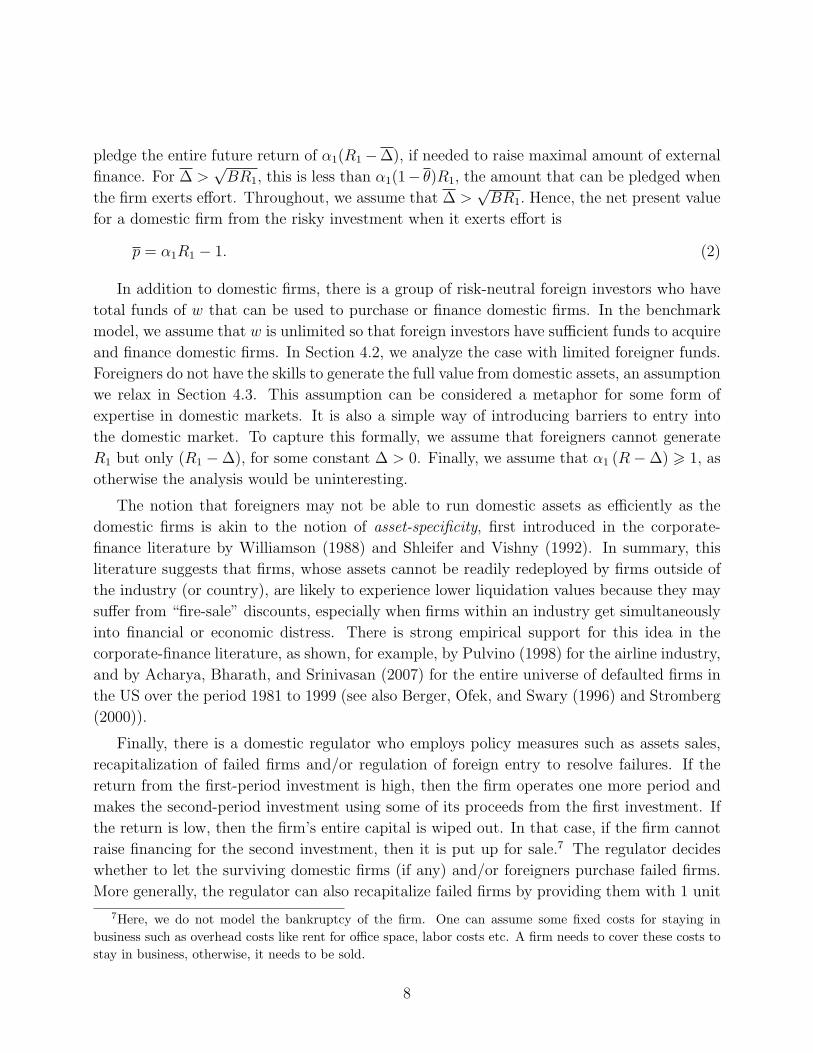
pledge the entire future return of α1(R1−∆), if needed to raise maximal amount of external
finance. For ∆ >√BR1, this is less than α1(1− θ)R1, the amount that can be pledged when
the firm exerts effort. Throughout, we assume that ∆ >√BR1. Hence, the net present value
for a domestic firm from the risky investment when it exerts effort is
p = α1R1 − 1. (2)
In addition to domestic firms, there is a group of risk-neutral foreign investors who have
total funds of w that can be used to purchase or finance domestic firms. In the benchmark
model, we assume that w is unlimited so that foreign investors have sufficient funds to acquire
and finance domestic firms. In Section 4.2, we analyze the case with limited foreigner funds.
Foreigners do not have the skills to generate the full value from domestic assets, an assumption
we relax in Section 4.3. This assumption can be considered a metaphor for some form of
expertise in domestic markets. It is also a simple way of introducing barriers to entry into
the domestic market. To capture this formally, we assume that foreigners cannot generate
R1 but only (R1 −∆), for some constant ∆ > 0. Finally, we assume that α1 (R−∆) > 1, as
otherwise the analysis would be uninteresting.
The notion that foreigners may not be able to run domestic assets as efficiently as the
domestic firms is akin to the notion of asset-specificity, first introduced in the corporate-
finance literature by Williamson (1988) and Shleifer and Vishny (1992). In summary, this
literature suggests that firms, whose assets cannot be readily redeployed by firms outside of
the industry (or country), are likely to experience lower liquidation values because they may
suffer from “fire-sale” discounts, especially when firms within an industry get simultaneously
into financial or economic distress. There is strong empirical support for this idea in the
corporate-finance literature, as shown, for example, by Pulvino (1998) for the airline industry,
and by Acharya, Bharath, and Srinivasan (2007) for the entire universe of defaulted firms in
the US over the period 1981 to 1999 (see also Berger, Ofek, and Swary (1996) and Stromberg
(2000)).
Finally, there is a domestic regulator who employs policy measures such as assets sales,
recapitalization of failed firms and/or regulation of foreign entry to resolve failures. If the
return from the first-period investment is high, then the firm operates one more period and
makes the second-period investment using some of its proceeds from the first investment. If
the return is low, then the firm’s entire capital is wiped out. In that case, if the firm cannot
raise financing for the second investment, then it is put up for sale.7 The regulator decides
whether to let the surviving domestic firms (if any) and/or foreigners purchase failed firms.
More generally, the regulator can also recapitalize failed firms by providing them with 1 unit
7Here, we do not model the bankruptcy of the firm. One can assume some fixed costs for staying inbusiness such as overhead costs like rent for office space, labor costs etc. A firm needs to cover these costs tostay in business, otherwise, it needs to be sold.
8
of funds to undertake the second-period investment at t = 1, a possibility that we postpone
until Section 6.
Domestic firms that had the high return from the first period investment are potential
acquirers of failed firms’ assets. Because of moral hazard, the surviving domestic firms cannot
pledge all their future income, but only a fraction τ. Hence, the total resources available to a
surviving domestic firm at date 1 to purchase failed firm assets is
` = (R0 − 1) + τq, (3)
where q = α1R1 is the expected return from the second period investment. The firm has R0
from the first period investment but needs to set aside the cost of investment of 1, and can
raise τq units of funds from outside investors.8
3 Analysis
We analyze the model proceeding backwards from the second period to the first period.
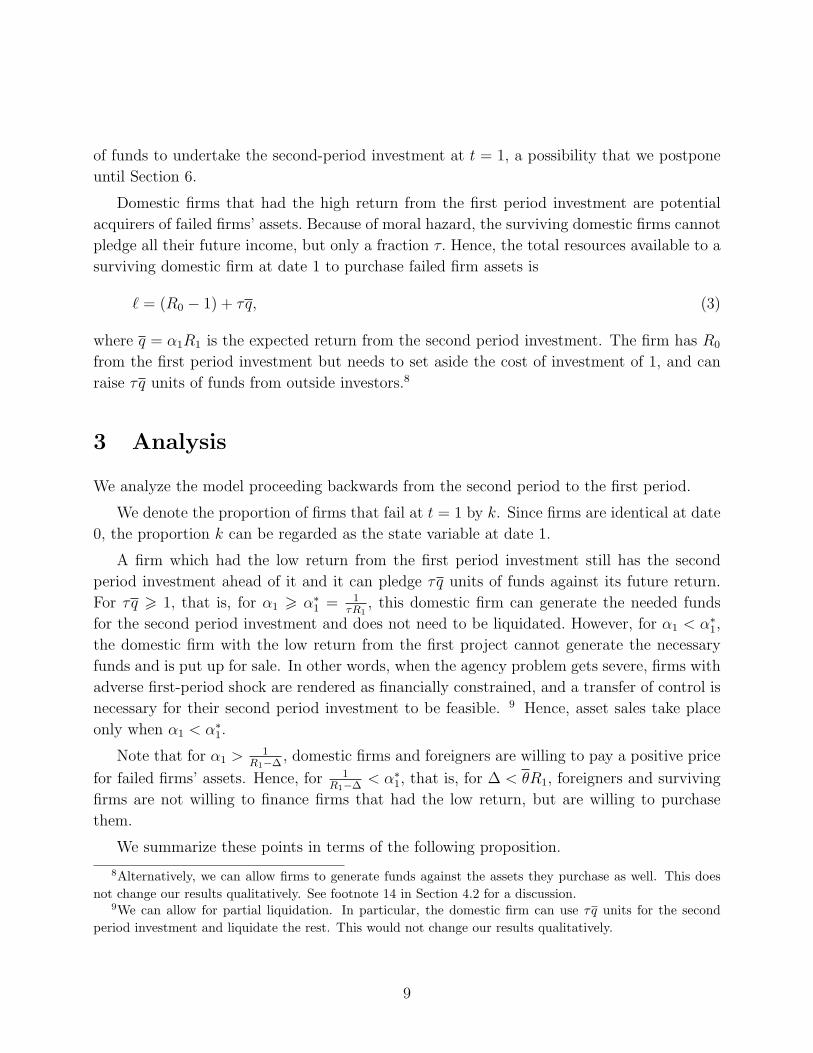
We denote the proportion of firms that fail at t = 1 by k. Since firms are identical at date
0, the proportion k can be regarded as the state variable at date 1.
A firm which had the low return from the first period investment still has the second
period investment ahead of it and it can pledge τq units of funds against its future return.
For τq > 1, that is, for α1 > α∗1 = 1τR1
, this domestic firm can generate the needed funds
for the second period investment and does not need to be liquidated. However, for α1 < α∗1,
the domestic firm with the low return from the first project cannot generate the necessary
funds and is put up for sale. In other words, when the agency problem gets severe, firms with
adverse first-period shock are rendered as financially constrained, and a transfer of control is
necessary for their second period investment to be feasible. 9 Hence, asset sales take place
only when α1 < α∗1.
Note that for α1 >1
R1−∆, domestic firms and foreigners are willing to pay a positive price
for failed firms’ assets. Hence, for 1R1−∆
< α∗1, that is, for ∆ < θR1, foreigners and surviving
firms are not willing to finance firms that had the low return, but are willing to purchase
them.
We summarize these points in terms of the following proposition.
8Alternatively, we can allow firms to generate funds against the assets they purchase as well. This doesnot change our results qualitatively. See footnote 14 in Section 4.2 for a discussion.
9We can allow for partial liquidation. In particular, the domestic firm can use τq units for the secondperiod investment and liquidate the rest. This would not change our results qualitatively.
9
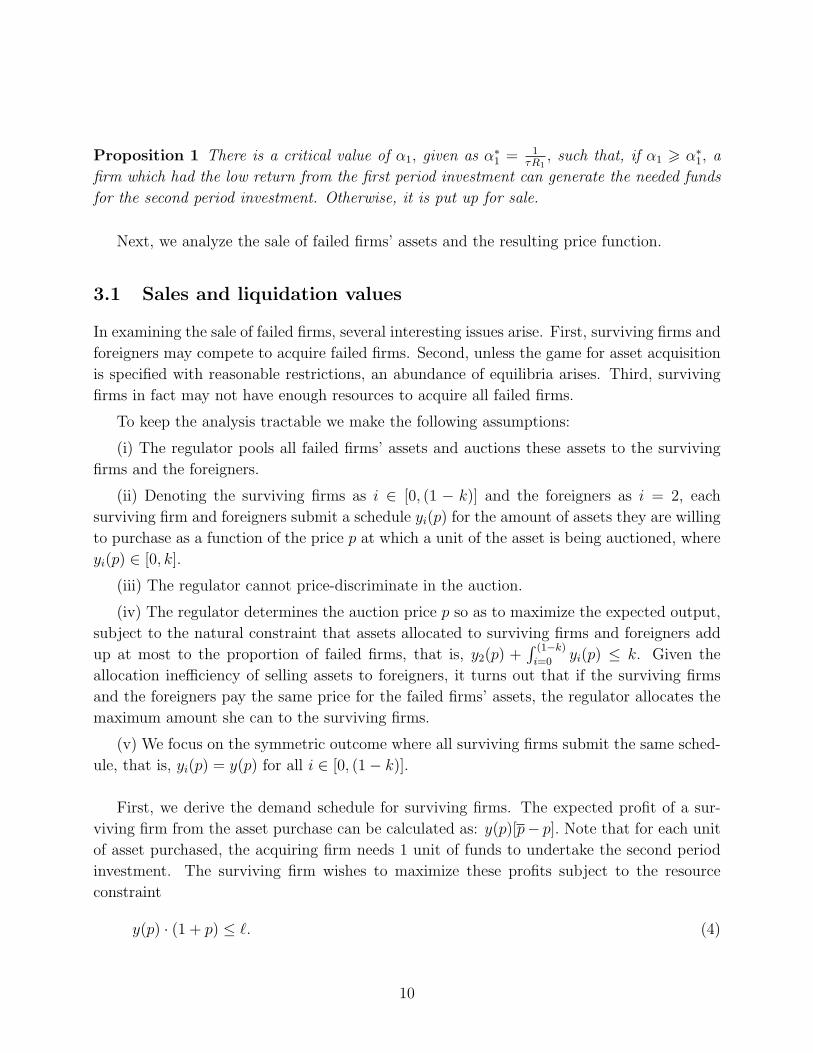
Proposition 1 There is a critical value of α1, given as α∗1 = 1τR1
, such that, if α1 > α∗1, a
firm which had the low return from the first period investment can generate the needed funds
for the second period investment. Otherwise, it is put up for sale.
Next, we analyze the sale of failed firms’ assets and the resulting price function.
3.1 Sales and liquidation values
In examining the sale of failed firms, several interesting issues arise. First, surviving firms and
foreigners may compete to acquire failed firms. Second, unless the game for asset acquisition
is specified with reasonable restrictions, an abundance of equilibria arises. Third, surviving
firms in fact may not have enough resources to acquire all failed firms.
To keep the analysis tractable we make the following assumptions:
(i) The regulator pools all failed firms’ assets and auctions these assets to the surviving
firms and the foreigners.
(ii) Denoting the surviving firms as i ∈ [0, (1 − k)] and the foreigners as i = 2, each
surviving firm and foreigners submit a schedule yi(p) for the amount of assets they are willing
to purchase as a function of the price p at which a unit of the asset is being auctioned, where
yi(p) ∈ [0, k].
(iii) The regulator cannot price-discriminate in the auction.
(iv) The regulator determines the auction price p so as to maximize the expected output,
subject to the natural constraint that assets allocated to surviving firms and foreigners add
up at most to the proportion of failed firms, that is, y2(p) +∫ (1−k)
i=0yi(p) ≤ k. Given the
allocation inefficiency of selling assets to foreigners, it turns out that if the surviving firms
and the foreigners pay the same price for the failed firms’ assets, the regulator allocates the
maximum amount she can to the surviving firms.
(v) We focus on the symmetric outcome where all surviving firms submit the same sched-
ule, that is, yi(p) = y(p) for all i ∈ [0, (1− k)].
First, we derive the demand schedule for surviving firms. The expected profit of a sur-
viving firm from the asset purchase can be calculated as: y(p)[p− p]. Note that for each unit
of asset purchased, the acquiring firm needs 1 unit of funds to undertake the second period
investment. The surviving firm wishes to maximize these profits subject to the resource
constraint
y(p) · (1 + p) ≤ `. (4)
10
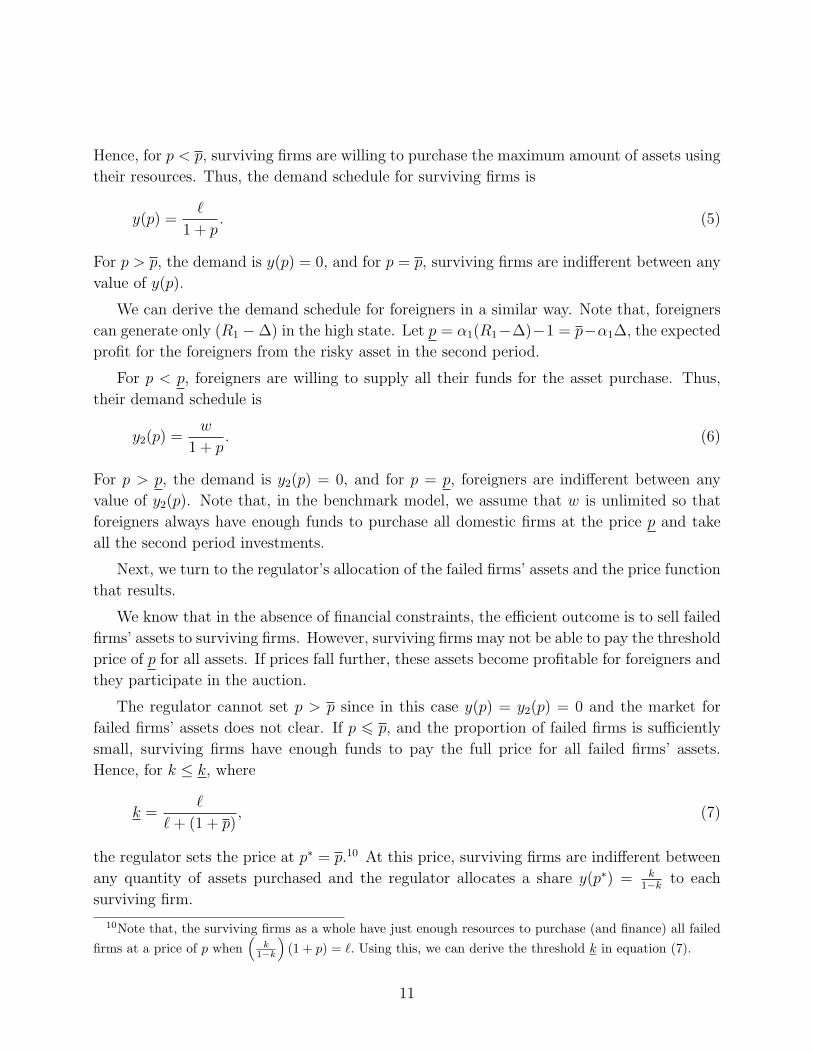
Hence, for p < p, surviving firms are willing to purchase the maximum amount of assets using
their resources. Thus, the demand schedule for surviving firms is
y(p) =`
1 + p. (5)
For p > p, the demand is y(p) = 0, and for p = p, surviving firms are indifferent between any
value of y(p).
We can derive the demand schedule for foreigners in a similar way. Note that, foreigners
can generate only (R1 −∆) in the high state. Let p = α1(R1−∆)−1 = p−α1∆, the expected
profit for the foreigners from the risky asset in the second period.
For p < p, foreigners are willing to supply all their funds for the asset purchase. Thus,
their demand schedule is
y2(p) =w
1 + p. (6)
For p > p, the demand is y2(p) = 0, and for p = p, foreigners are indifferent between any
value of y2(p). Note that, in the benchmark model, we assume that w is unlimited so that
foreigners always have enough funds to purchase all domestic firms at the price p and take
all the second period investments.
Next, we turn to the regulator’s allocation of the failed firms’ assets and the price function
that results.
We know that in the absence of financial constraints, the efficient outcome is to sell failed
firms’ assets to surviving firms. However, surviving firms may not be able to pay the threshold
price of p for all assets. If prices fall further, these assets become profitable for foreigners and
they participate in the auction.
The regulator cannot set p > p since in this case y(p) = y2(p) = 0 and the market for
failed firms’ assets does not clear. If p 6 p, and the proportion of failed firms is sufficiently
small, surviving firms have enough funds to pay the full price for all failed firms’ assets.
Hence, for k ≤ k, where
k =`
`+ (1 + p), (7)
the regulator sets the price at p∗ = p.10 At this price, surviving firms are indifferent between
any quantity of assets purchased and the regulator allocates a share y(p∗) = k1−k to each
surviving firm.
10Note that, the surviving firms as a whole have just enough resources to purchase (and finance) all failedfirms at a price of p when
(k
1−k
)(1 + p) = `. Using this, we can derive the threshold k in equation (7).
11
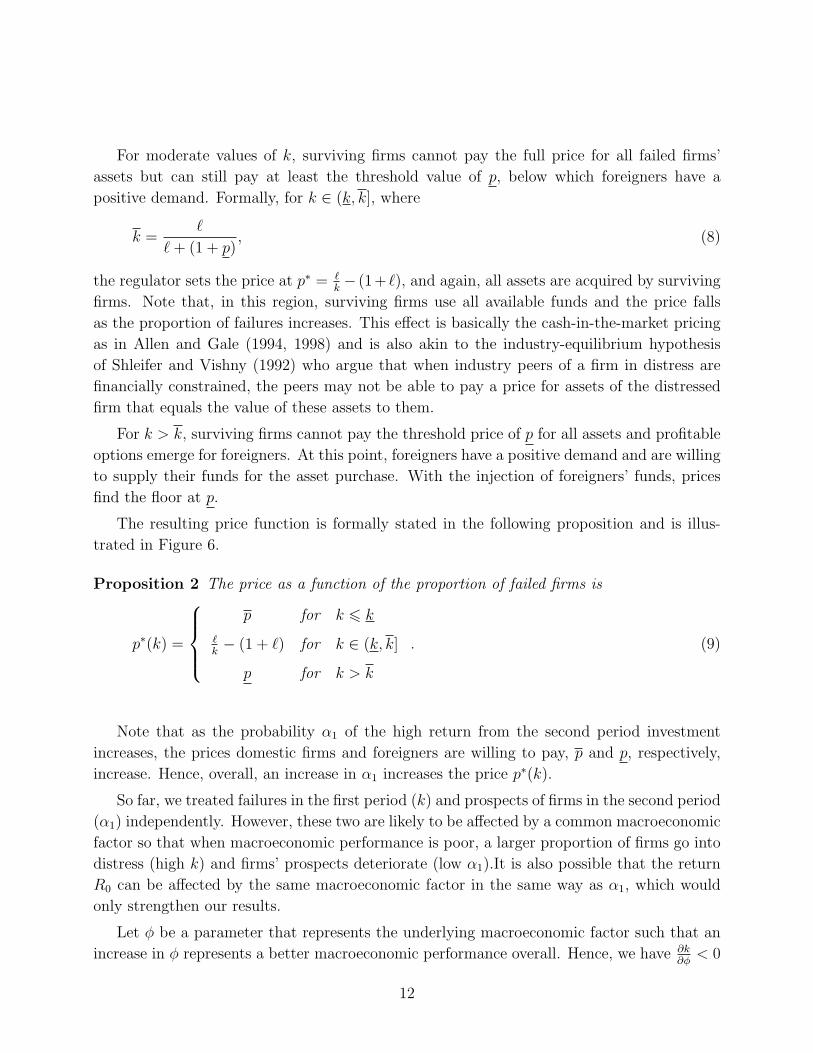
For moderate values of k, surviving firms cannot pay the full price for all failed firms’
assets but can still pay at least the threshold value of p, below which foreigners have a
positive demand. Formally, for k ∈ (k, k], where
k =`
`+ (1 + p), (8)
the regulator sets the price at p∗ = `k− (1 + `), and again, all assets are acquired by surviving
firms. Note that, in this region, surviving firms use all available funds and the price falls
as the proportion of failures increases. This effect is basically the cash-in-the-market pricing
as in Allen and Gale (1994, 1998) and is also akin to the industry-equilibrium hypothesis
of Shleifer and Vishny (1992) who argue that when industry peers of a firm in distress are
financially constrained, the peers may not be able to pay a price for assets of the distressed
firm that equals the value of these assets to them.
For k > k, surviving firms cannot pay the threshold price of p for all assets and profitable
options emerge for foreigners. At this point, foreigners have a positive demand and are willing
to supply their funds for the asset purchase. With the injection of foreigners’ funds, prices
find the floor at p.
The resulting price function is formally stated in the following proposition and is illus-
trated in Figure 6.
Proposition 2 The price as a function of the proportion of failed firms is
p∗(k) =
p for k 6 k
`k− (1 + `) for k ∈ (k, k]
p for k > k
. (9)
Note that as the probability α1 of the high return from the second period investment
increases, the prices domestic firms and foreigners are willing to pay, p and p, respectively,
increase. Hence, overall, an increase in α1 increases the price p∗(k).
So far, we treated failures in the first period (k) and prospects of firms in the second period
(α1) independently. However, these two are likely to be affected by a common macroeconomic
factor so that when macroeconomic performance is poor, a larger proportion of firms go into
distress (high k) and firms’ prospects deteriorate (low α1).It is also possible that the return
R0 can be affected by the same macroeconomic factor in the same way as α1, which would
only strengthen our results.
Let φ be a parameter that represents the underlying macroeconomic factor such that an
increase in φ represents a better macroeconomic performance overall. Hence, we have ∂k∂φ< 0
12
and ∂α1
∂φ> 0. Then intuitively, as the macroeconomy worsens (low φ), the price of assets falls
because of two separate reasons. First, the prospects for the second period project worsen
(low α1) so that the fundamental value p of the assets falls. Second, the proportion of failures
(k) increases when the economy is weak, and for high enough proportion of failures, there is
cash-in-the-market prices due to lack of liquidity in domestic markets.
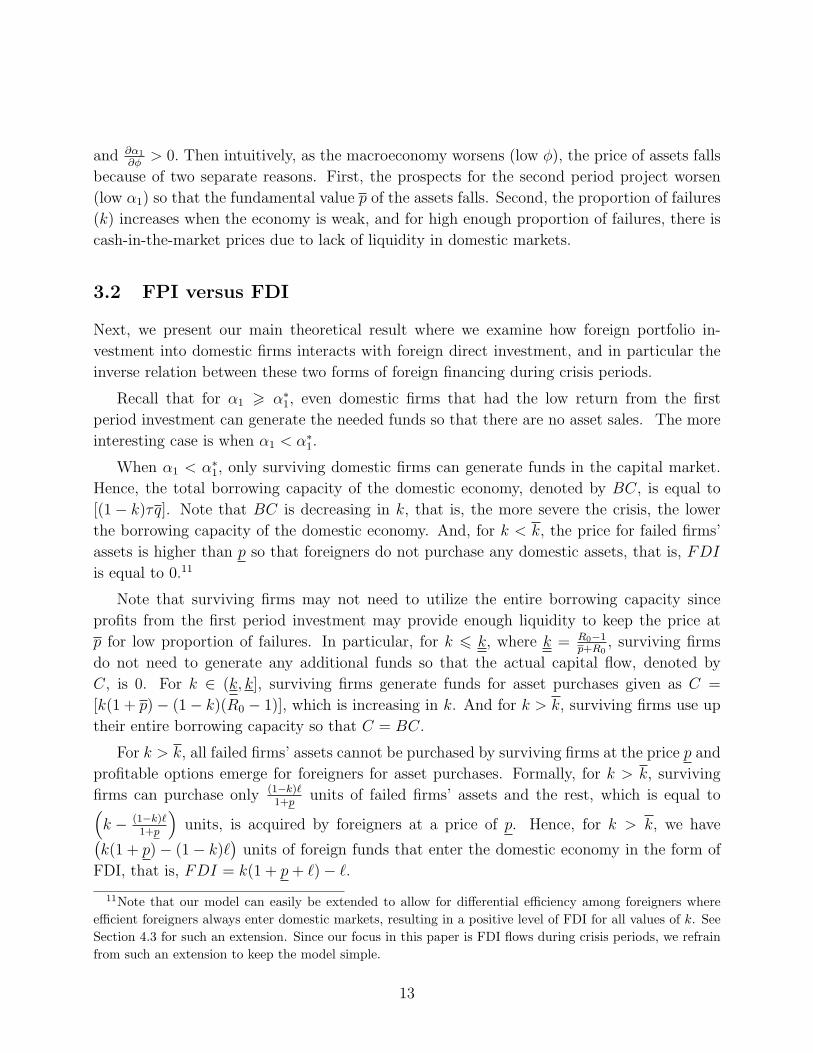
3.2 FPI versus FDI
Next, we present our main theoretical result where we examine how foreign portfolio in-
vestment into domestic firms interacts with foreign direct investment, and in particular the
inverse relation between these two forms of foreign financing during crisis periods.
Recall that for α1 > α∗1, even domestic firms that had the low return from the first
period investment can generate the needed funds so that there are no asset sales. The more
interesting case is when α1 < α∗1.
When α1 < α∗1, only surviving domestic firms can generate funds in the capital market.
Hence, the total borrowing capacity of the domestic economy, denoted by BC, is equal to
[(1− k)τq]. Note that BC is decreasing in k, that is, the more severe the crisis, the lower
the borrowing capacity of the domestic economy. And, for k < k, the price for failed firms’
assets is higher than p so that foreigners do not purchase any domestic assets, that is, FDI
is equal to 0.11
Note that surviving firms may not need to utilize the entire borrowing capacity since
profits from the first period investment may provide enough liquidity to keep the price at
p for low proportion of failures. In particular, for k 6 k, where k = R0−1p+R0
, surviving firms
do not need to generate any additional funds so that the actual capital flow, denoted by
C, is 0. For k ∈ (k, k], surviving firms generate funds for asset purchases given as C =
[k(1 + p)− (1− k)(R0 − 1)], which is increasing in k. And for k > k, surviving firms use up
their entire borrowing capacity so that C = BC.
For k > k, all failed firms’ assets cannot be purchased by surviving firms at the price p and
profitable options emerge for foreigners for asset purchases. Formally, for k > k, surviving
firms can purchase only (1−k)`1+p
units of failed firms’ assets and the rest, which is equal to(k − (1−k)`
1+p
)units, is acquired by foreigners at a price of p. Hence, for k > k, we have(
k(1 + p)− (1− k)`)
units of foreign funds that enter the domestic economy in the form of
FDI, that is, FDI = k(1 + p+ `)− `.11Note that our model can easily be extended to allow for differential efficiency among foreigners where
efficient foreigners always enter domestic markets, resulting in a positive level of FDI for all values of k. SeeSection 4.3 for such an extension. Since our focus in this paper is FDI flows during crisis periods, we refrainfrom such an extension to keep the model simple.
13
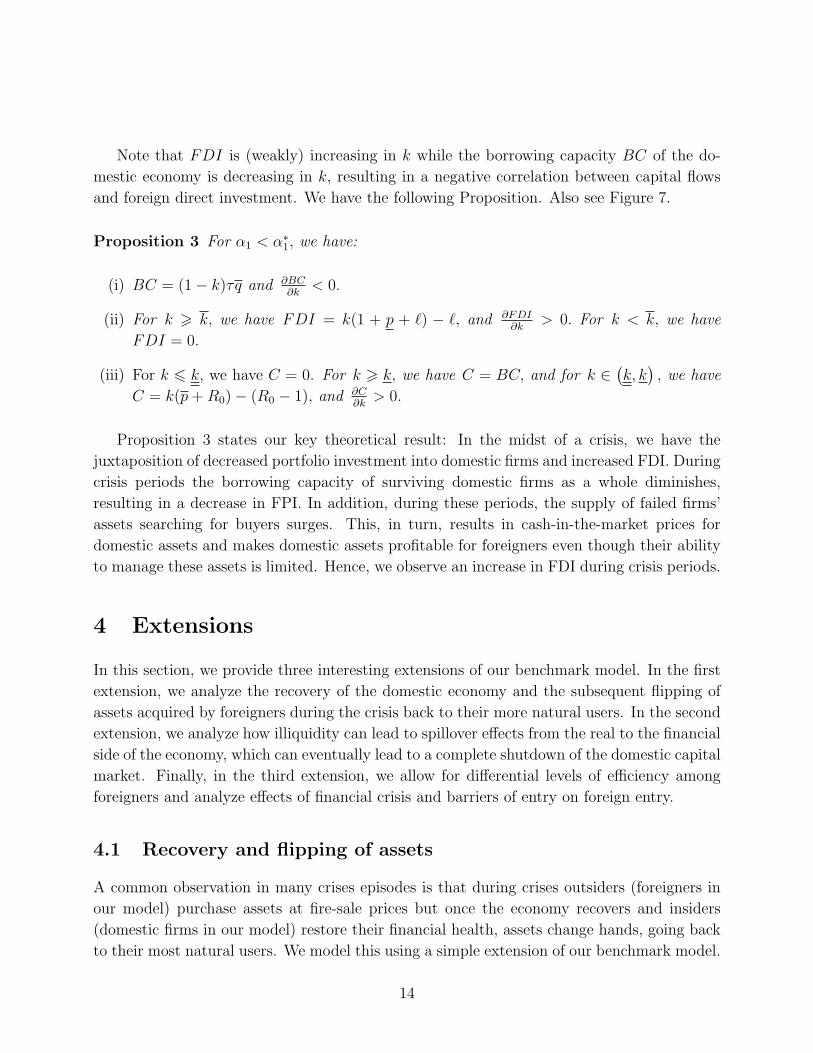
Note that FDI is (weakly) increasing in k while the borrowing capacity BC of the do-
mestic economy is decreasing in k, resulting in a negative correlation between capital flows
and foreign direct investment. We have the following Proposition. Also see Figure 7.
Proposition 3 For α1 < α∗1, we have:
(i) BC = (1− k)τq and ∂BC∂k
< 0.
(ii) For k > k, we have FDI = k(1 + p + `) − `, and ∂FDI∂k
> 0. For k < k, we have
FDI = 0.
(iii) For k 6 k, we have C = 0. For k > k, we have C = BC, and for k ∈(k, k), we have
C = k(p+R0)− (R0 − 1), and ∂C∂k> 0.
Proposition 3 states our key theoretical result: In the midst of a crisis, we have the
juxtaposition of decreased portfolio investment into domestic firms and increased FDI. During
crisis periods the borrowing capacity of surviving domestic firms as a whole diminishes,
resulting in a decrease in FPI. In addition, during these periods, the supply of failed firms’
assets searching for buyers surges. This, in turn, results in cash-in-the-market prices for
domestic assets and makes domestic assets profitable for foreigners even though their ability
to manage these assets is limited. Hence, we observe an increase in FDI during crisis periods.
4 Extensions
In this section, we provide three interesting extensions of our benchmark model. In the first
extension, we analyze the recovery of the domestic economy and the subsequent flipping of
assets acquired by foreigners during the crisis back to their more natural users. In the second
extension, we analyze how illiquidity can lead to spillover effects from the real to the financial
side of the economy, which can eventually lead to a complete shutdown of the domestic capital
market. Finally, in the third extension, we allow for differential levels of efficiency among
foreigners and analyze effects of financial crisis and barriers of entry on foreign entry.
4.1 Recovery and flipping of assets
A common observation in many crises episodes is that during crises outsiders (foreigners in
our model) purchase assets at fire-sale prices but once the economy recovers and insiders
(domestic firms in our model) restore their financial health, assets change hands, going back
to their most natural users. We model this using a simple extension of our benchmark model.
14
Suppose that we have a third period, that is, we have date t = 3. Firms can take a risky
investment at t = 2, similar to the two investments in the benchmark model. In particular,
firms invest one unit in a risky technology at t = 2, where the return is realized at t = 3.
The random return from these investments is denoted by R̃2, where R̃2 ∈ {0, R2}, and α2 is
the probability of the high return from the investment at date 2. Foreigners cannot generate
R2 in the high state but only (R2 −∆2) .12 Hence, insiders are willing to pay a price of
p2 = (α2R2 − 1) , whereas outsiders value these assets at p2
= α2(R2 −∆2)− 1.
Suppose that a proportion σ of assets were purchased by outsiders at t = 1. Hence,
insiders manage a proportion (1− σ) of assets. Also, suppose that a fraction k1 of insiders
have the low return from their investment taken at t = 1. An insider that had the high return
has funds of `1 = [(R1 − 1) + τα2R2] to be used for asset purchase. If a high proportion of
insiders have the high return, then insiders have enough funds to pay the full price of p2 for
failed firms as well as the firms that have been acquired by outsiders at t = 1, and assets
change hands back to the efficient users. In particular, for k1 6 k1, where
k1 =`1 − σ(`1 + 1 + p2)
(1− σ)(`1 + 1 + p2), (10)
insiders purchase all failed firms and also buy back the assets that have been purchased by
outsiders, at the fundamental price p2. This is associated with a full recovery from the crisis.
Note that,∂k1
∂σ< 0 so that full recovery is more difficult after a severe crisis.
For moderate values of k1, surviving firms cannot pay the full price for all failed firms’
and outsiders’ assets but can still pay at least the threshold value of p2. So, for k ∈ (k1, k1],
where
k1 =`1 − σ(`1 + 1 + p
2)
(1− σ)(`1 + 1 + p2), (11)
the regulator sets the price at p∗2 =(
(1−σ)(1−k1)`1(1−σ)k1+σ
− 1)
, and again, all assets are acquired by
insiders.13
4.2 Illiquidity and capital market breakdown
So far, we have examined the case where foreigners have unlimited funds so that they can
purchase all domestic firms at the price p and will still have enough funds to finance all second
12Note that outsiders have operated these assets for one period so thay may learn how to run these assetsefficiently. Therefore, we allow for ∆2, possibly ∆2 < ∆.
13For sligthly higher values of k1, insiders can buy back only a fraction of the assets, that is, the recovery ispartial. For higher values of k1, more assets may be sold to outsiders, resulting in a deepening of the crises.
15
period projects. We relax this assumption and allow for limited funds for foreigners, that is,
w ∈(1, 1 + p
). This allows us to examine the relationship between the cost of capital and
illiquidity spillover between the asset and equity markets of domestic firms.
When foreigner funds are limited, we have a fourth region for k > k, where k > k, and
k =(R0 − 1) + w
p+R0
, (12)
so that even with the injection of foreigners’ funds, the price cannot be sustained at p and is
again strictly decreasing in k (see Figure 8).
The intuition for why this fourth region arises is as follows. When the proportion of failures
is large, because of aggregate shortage of liquidity, that is, shortage of liquidity within the
surviving domestic firms and the foreigners, the price of assets falls below the threshold value
of foreigners, p. Since purchasing assets at such prices becomes profitable for foreigners,
in equilibrium they need to be compensated for purchasing shares of surviving firms. As a
result, the share price of surviving firms falls below their fundamental value q. The aggregate
shortage of liquidity affects not only the price of failed firms’ assets but also the price of
shares of surviving firms.
To put this argument more formally, recall that in the benchmark model with unlimited
foreigners’ funds, surviving firms issue τ units of shares at a price q to generate funds of
τq from foreigners. However, with limited foreigners’ funds, for k > k, the price for failed
firms’ assets falls below p so that even foreigners can make positive profits by purchasing and
running these assets. As a result, for k > k, foreigners would not be willing to pay the full
price of q for a share of a surviving firm and surviving firms have to suffer some discount
when they issue shares which leads to an increase in the cost of capital resulting from lack of
liquidity. Below, we analyze this formally.
Let s be the proportion of shares issued by a surviving firm. Because of moral hazard we
have: s 6 τ .14 If a surviving firm issues s unit of shares at the price q and purchases m units
of assets at the price p, it makes an expected profit of [m (p− p)− s (q − q)] .Note that in any equilibrium, q cannot exceed q. Thus, we have q 6 q, and surviving
firms issue equity just enough for the asset purchase, not more. Using this, we can state a
14We can also allow firms to generate funds against the assets they acquire, which does not change any ofour results qualitatively. In that case, the analysis is as follows. A surviving firm has R0 units of funds fromthe first investment. If this firm purchases m units of assets, it can pledge a total of [(1 +m)τq] units offunds, where q is the price per unit of share issued. The firm needs [1 + (1 + p)m] units for the asset purchaseand the financing of its own as well as the purchased projects. Hence, we have the financial constraint of thefirm as R0 + (1 + m)τq > 1 + (1 + p)m. Thus, the firm can purchase at most m∗ = `
1+p−τq units of failedfirms’ assets at the price p.
16
surviving firm’s maximization problem as:
maxm,s
m (p− p)− s (q − q) (13)
s.t. s · q +R0 − 1 > mp (14)
s 6 τ. (15)
For q 6 (1 + p) , surviving firms cannot make positive profits by issuing equity to purchase
assets. Thus, when q 6 1 + p, we have s = 0 and m = R0−1p. When q > 1 + p, surviving firms
make positive profits from asset purchase using the funds they generate by issuing equity.
Hence, they would like to issue as much equity as possible, that is, s = τ.
We can state foreigners’ maximization problem in a similar way:
maxx,y
x(p− p
)+ y (q − q)
s.t. xp+ yq 6 w (16)
where x and y represent the proportion of assets and the proportion of shares in surviving
firms purchased by foreigners, respectively.
When the share price of surviving firms, q, is relatively low compared to the price of failed
firms’ assets, p, foreigners prefer to purchase shares of surviving firms. However, if p becomes
low compared to q, then foreigners may prefer to acquire the assets themselves.
When p > p, foreigners do not want to purchase failed firms’ assets and x(q, p) = 0. When
p < p, foreigners choose x to maximize:
x(p− p
)+
(w − xpq
)(q − q) (17)
= x
(p− pq
q
)+ w
(q
q− 1
). (18)
Thus, if p < p and p q > q p, then foreigners use all their funds for the asset purchase, that
is x = wp. When p < p and p q < q p, foreigners use all their funds for the equity purchase,
that is y =(wq
), and when p q = q p, foreigners are indifferent between the equity and the
asset purchase.
In equilibrium, demand for shares of surviving firms and assets of failed firms should equal
their supply. Hence, we have the market clearing conditions:
(1− k)s = y(q, p) (equity market) (19)
(1− k)m+ x(q, p) = k (asset market) (20)
17
We focus on the outcome where the participation of foreigners in the equity market is max-
imum, which results in the maximum price for assets. However, even in this case, we show
that for a large proportion of failures, the share price of surviving firms falls below their
fundamental value. Furthermore, for low values of foreigners’ funds, during severe crises, the
capital market completely breaks down.
The price functions for failed firms’ assets (p∗(k)) and for shares of surviving firms (q∗(k))
are formally stated in the following proposition and are illustrated in Figure 8.15
Proposition 4 For limited foreigners’ funds, in equilibrium, we have:
p∗(k) =
p for k 6 k
`
k− (1 + `) for k ∈ (k, k]
p for k ∈ (k, k]
(R0−1)+wk
−R0 for k > k
(21)
and
q∗(k) =
q for k 6 k
µp∗(k) for k > k and w > w∗
µp∗(k) for k ∈ (k, k∗] and w < w∗
Market breaks down for k > k∗ and w < w∗
, (22)
where µ =q
p, w∗ =
q
q − p, and k∗ =
(q − p
)(R0 − 1 + w)
p+(q − p
)R0
.
As Proposition 4 shows, when the proportion of failures is large, cash-in-the-market pricing
creates profitable options for foreigners for asset purchases. Hence, in equilibrium, share
price of surviving firms falls below their fundamental value q to compensate foreigners for
purchasing shares. In other words, surviving firms can raise equity financing only at discounts.
Thus, limited funds within the whole system affects not only the price of failed firms’ assets
but also the price of shares of surviving firms. Furthermore, the discount surviving firms
need to suffer in issuing equity is higher when the crisis is more severe (high k).
When foreigners’ wealth is low (w < w∗), the price for failed firms’ assets falls sufficiently.
This, in turn, leads to high discounts in the capital market and for k > k∗, the discount
is so high that surviving firms cannot generate the needed funds by issuing shares, that is,
15Proposition 4 states the results for the case w > τq. Similar results hold for w < τq.
18
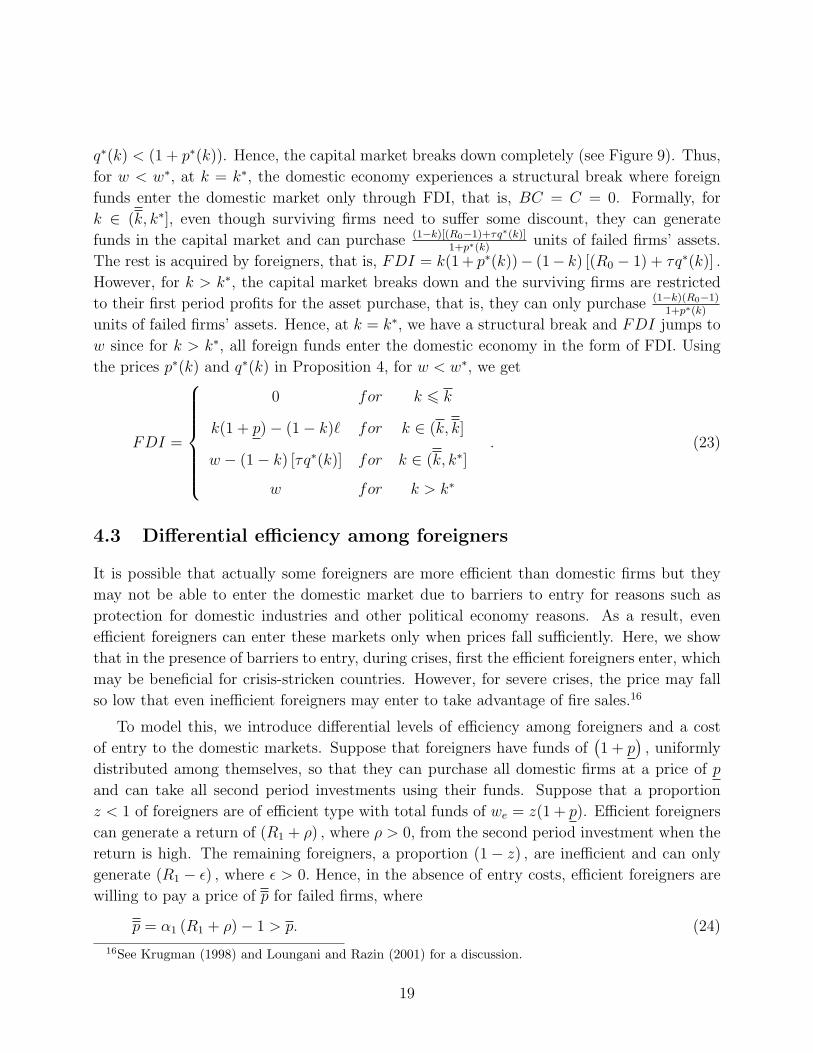
q∗(k) < (1 + p∗(k)). Hence, the capital market breaks down completely (see Figure 9). Thus,
for w < w∗, at k = k∗, the domestic economy experiences a structural break where foreign
funds enter the domestic market only through FDI, that is, BC = C = 0. Formally, for
k ∈ (k, k∗], even though surviving firms need to suffer some discount, they can generate
funds in the capital market and can purchase (1−k)[(R0−1)+τq∗(k)]1+p∗(k)
units of failed firms’ assets.
The rest is acquired by foreigners, that is, FDI = k(1 + p∗(k))− (1− k) [(R0 − 1) + τq∗(k)] .
However, for k > k∗, the capital market breaks down and the surviving firms are restricted
to their first period profits for the asset purchase, that is, they can only purchase (1−k)(R0−1)1+p∗(k)
units of failed firms’ assets. Hence, at k = k∗, we have a structural break and FDI jumps to
w since for k > k∗, all foreign funds enter the domestic economy in the form of FDI. Using
the prices p∗(k) and q∗(k) in Proposition 4, for w < w∗, we get
FDI =
0 for k 6 k
k(1 + p)− (1− k)` for k ∈ (k, k]
w − (1− k) [τq∗(k)] for k ∈ (k, k∗]
w for k > k∗
. (23)
4.3 Differential efficiency among foreigners
It is possible that actually some foreigners are more efficient than domestic firms but they
may not be able to enter the domestic market due to barriers to entry for reasons such as
protection for domestic industries and other political economy reasons. As a result, even
efficient foreigners can enter these markets only when prices fall sufficiently. Here, we show
that in the presence of barriers to entry, during crises, first the efficient foreigners enter, which
may be beneficial for crisis-stricken countries. However, for severe crises, the price may fall
so low that even inefficient foreigners may enter to take advantage of fire sales.16
To model this, we introduce differential levels of efficiency among foreigners and a cost
of entry to the domestic markets. Suppose that foreigners have funds of(1 + p
), uniformly
distributed among themselves, so that they can purchase all domestic firms at a price of p
and can take all second period investments using their funds. Suppose that a proportion
z < 1 of foreigners are of efficient type with total funds of we = z(1 + p). Efficient foreigners
can generate a return of (R1 + ρ) , where ρ > 0, from the second period investment when the
return is high. The remaining foreigners, a proportion (1− z) , are inefficient and can only
generate (R1 − ε) , where ε > 0. Hence, in the absence of entry costs, efficient foreigners are
willing to pay a price of p for failed firms, where
p = α1 (R1 + ρ)− 1 > p. (24)
16See Krugman (1998) and Loungani and Razin (2001) for a discussion.
19
Suppose that there is a cost of entry to the domestic market, where foreigners incur a cost
of γ per unit of domestic asset acquired, with γ > p− p. Hence, even efficient foreigners can
enter only when prices fall below the price p̃ = p− γ.
To keep the notation simple and aligned with the benchmark model, we assume that
p = (α1 (R1 − ε)− 1)− γ, (25)
so that inefficient foreigners enter the domestic market only when price is below p.
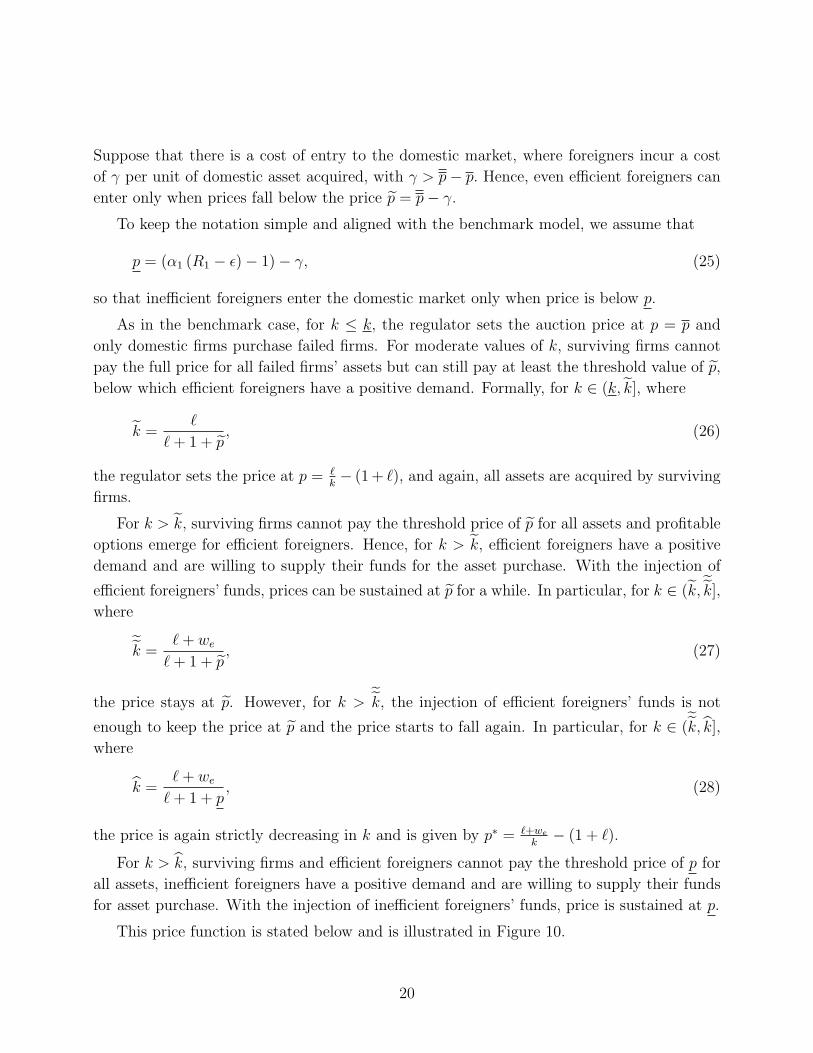
As in the benchmark case, for k ≤ k, the regulator sets the auction price at p = p and
only domestic firms purchase failed firms. For moderate values of k, surviving firms cannot
pay the full price for all failed firms’ assets but can still pay at least the threshold value of p̃,
below which efficient foreigners have a positive demand. Formally, for k ∈ (k, k̃], where
k̃ =`
`+ 1 + p̃, (26)
the regulator sets the price at p = `k− (1 + `), and again, all assets are acquired by surviving
firms.
For k > k̃, surviving firms cannot pay the threshold price of p̃ for all assets and profitable
options emerge for efficient foreigners. Hence, for k > k̃, efficient foreigners have a positive
demand and are willing to supply their funds for the asset purchase. With the injection of
efficient foreigners’ funds, prices can be sustained at p̃ for a while. In particular, for k ∈ (k̃,˜̃k],
where
˜̃k =
`+ we`+ 1 + p̃
, (27)
the price stays at p̃. However, for k >˜̃k, the injection of efficient foreigners’ funds is not
enough to keep the price at p̃ and the price starts to fall again. In particular, for k ∈ (˜̃k, k̂],
where
k̂ =`+ we`+ 1 + p
, (28)
the price is again strictly decreasing in k and is given by p∗ = `+we
k− (1 + `).
For k > k̂, surviving firms and efficient foreigners cannot pay the threshold price of p for
all assets, inefficient foreigners have a positive demand and are willing to supply their funds
for asset purchase. With the injection of inefficient foreigners’ funds, price is sustained at p.
This price function is stated below and is illustrated in Figure 10.
20
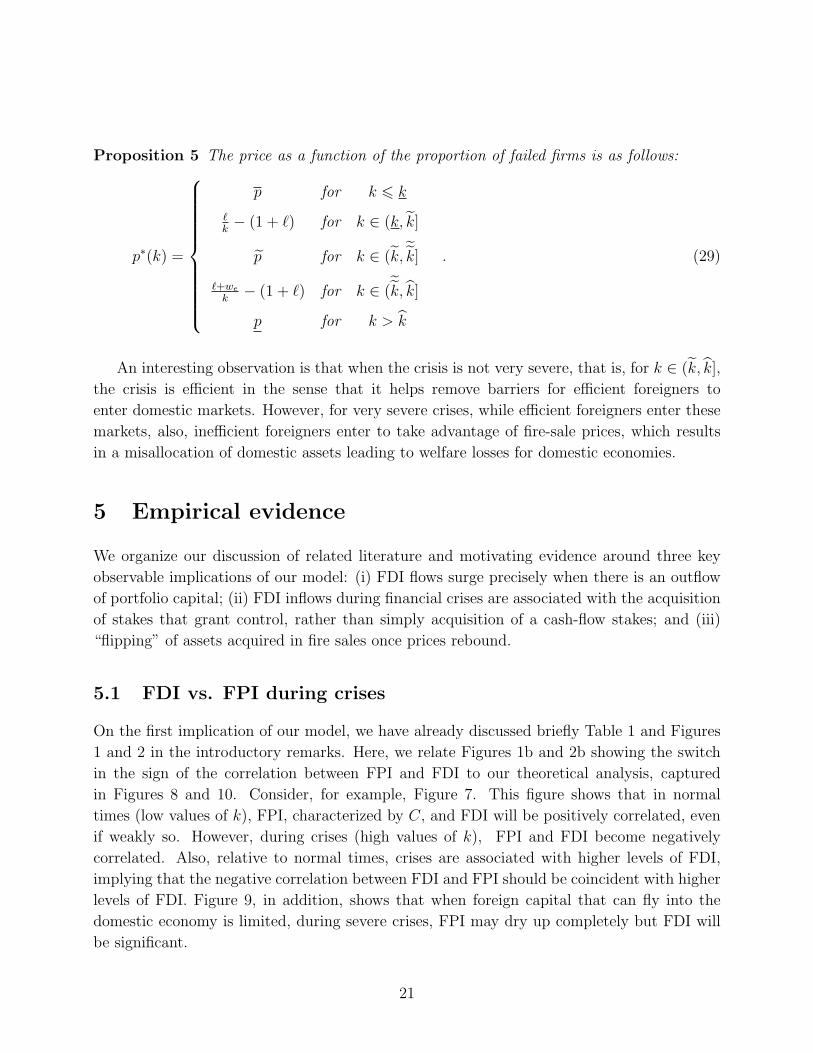
Proposition 5 The price as a function of the proportion of failed firms is as follows:
p∗(k) =
p for k 6 k
`k− (1 + `) for k ∈ (k, k̃]
p̃ for k ∈ (k̃,˜̃k]
`+we
k− (1 + `) for k ∈ (
˜̃k, k̂]
p for k > k̂
. (29)
An interesting observation is that when the crisis is not very severe, that is, for k ∈ (k̃, k̂],
the crisis is efficient in the sense that it helps remove barriers for efficient foreigners to
enter domestic markets. However, for very severe crises, while efficient foreigners enter these
markets, also, inefficient foreigners enter to take advantage of fire-sale prices, which results
in a misallocation of domestic assets leading to welfare losses for domestic economies.
5 Empirical evidence
We organize our discussion of related literature and motivating evidence around three key
observable implications of our model: (i) FDI flows surge precisely when there is an outflow
of portfolio capital; (ii) FDI inflows during financial crises are associated with the acquisition
of stakes that grant control, rather than simply acquisition of a cash-flow stakes; and (iii)
“flipping” of assets acquired in fire sales once prices rebound.
5.1 FDI vs. FPI during crises
On the first implication of our model, we have already discussed briefly Table 1 and Figures
1 and 2 in the introductory remarks. Here, we relate Figures 1b and 2b showing the switch
in the sign of the correlation between FPI and FDI to our theoretical analysis, captured
in Figures 8 and 10. Consider, for example, Figure 7. This figure shows that in normal
times (low values of k), FPI, characterized by C, and FDI will be positively correlated, even
if weakly so. However, during crises (high values of k), FPI and FDI become negatively
correlated. Also, relative to normal times, crises are associated with higher levels of FDI,
implying that the negative correlation between FDI and FPI should be coincident with higher
levels of FDI. Figure 9, in addition, shows that when foreign capital that can fly into the
domestic economy is limited, during severe crises, FPI may dry up completely but FDI will
be significant.
21
Figures 1b and 2b showing the correlation between FPI and FDI for South Korea and
Philippines, respectively, capture these patterns. There is not only a switching of the sign
of the correlation between normal and crisis periods, but more of the crises data points
correspond to higher levels of FDI.
In existing empirical evidence, Krugman (1998) argues that the Asian financial crisis,
marked by massive flight of short-term capital and large-scale sell-offs of foreign equity hold-
ings, has at the same time been accompanied by a wave of inward direct investment. While
this inward investment to some extent reflected policy changes towards foreign ownership,
it also reflected the perception of multinational firms that they could buy Asian companies
at fire-sale prices.17 Krugman shows that a similar, though probably less marked, boom in
inward direct investment took place in Latin America, especially in Mexico during 1995 and
also for Argentina. His primary conclusion is that surging foreign direct investment resulting
from fire sales has been an empirical regularity during recent financial crises.
A report prepared for the United Nations Conference on Trade and Development in Oc-
tober 1999 (UN (1999) from here on) provides further evidence for Krugman’s observations.
The report shows that inflows into South Korea showed a big increase in 1998, five-fold com-
pared to its average performance during the first half of the decade, followed by Thailand
with an almost four-fold jump to $7 billion over the same period (Box 1 on page 15 of the
report). The report also says that when compared with foreign bank lending and foreign
portfolio equity investment before and during the financial crisis, FDI flows into the crisis-
stricken Asian countries had been remarkably resilient and FDI had been flowing into a wide
range of industries in these countries. In Thailand, the only country for which systematic
data by industry are available, significant FDI flows to financial institutions (which were
about 10 times higher in 1997 than in 1996, and continued at a similar level in 1998) reflected
significant buy-outs by foreign firms. The report argues that one of the main reasons for the
resilience of FDI is that transnational corporations were taking advantage of cheaper asset
prices in the crisis-stricken countries.
17Krugman’s article provides interesting headlines from newspapers that talk about foreign entry due tofire-sale prices in crisis-stricken countries: “Korean companies are looking ripe to foreign buyers” (NewYork Times, Dec 27, 1997), “Some U.S. companies see fire sale in South Korea”(Los Angeles Times, Jan25, 1998), “Some companies jump into Asia’s fire sale with both feet” (Chicago Tribune, Jan 18, 1998),“While some count their losses in Asia, Coca-Cola’s chairman sees opportunity” (Wall Street Journal, Feb6, 1998). Krugman provides further anectodal evidence for the fact that these sales were wide-spread acrossall industries, such as some related news about General Motors considering buying stakes in South Koreanmanufacturers of both automobiles and parts; Ford planning to increase its stake in Kia Motors; Seoul Bankand Korea First Bank being auctioned off to foreign bidders; Procter & Gamble purchasing a majority shareof Ssanyong Paper Co., a producer of sanitary napkins, diapers, and kitchen towels; and Royal Dutch Shellnegotiating to buy Hanwha Group’s oil refining company, the group that had already sold its half of a jointventure in chemicals to the German company BASF.
22
In a recent study, Aguiar and Gopinath (2005) provide a systematic empirical counterpart
to the hypothesis raised by Krugman (1998). Given the importance of their findings for our
paper, we describe them in detail. Overall, Aguiar and Gopinath show that the stability of
FDI inflows into emerging markets during crisis years contrasts with the sharp reversals in
portfolio flows and bank lending. In particular, investment flows into Asia following the crisis
of late 1990s and Mexico following the crisis in 1995 were suggestive of foreign firms taking
advantage of low prices of real assets. They also document evidence that the high FDI flows
into the crisis-stricken Asian countries had many of the features of fire-sales: median offer
price to book ratios were substantially lower for cash-strapped firms’ purchase, especially in
1998 when national players had low liquidity, resulting in a boost in mergers and acquisitions
(M&As) involving foreign players.
Specifically, they use a firm-level dataset to show that the number of foreign M&As in East
Asia increased by 91% between 1996 and the crisis year of 1998 while domestic M&As declined
by 27% over the same period. In regard to the price paid for an acquired firm, the median
ratio of offer price to book value declined from 3.5 in 1996 to 1.3 in 1998. They also find that
firm liquidity (proxied by cash flow or sales) played a significant and sizeable role in explaining
both the increase in foreign acquisitions and the decline in the price of acquisitions during the
crisis: While during non-crisis years high cash flow for a firm was weakly associated with the
likelihood of its acquisition, in 1998 additional cash implied a lower probability of acquisition.
Furthermore, in support of the hypothesis that cash-strapped firms sold at a steeper discount
during the crisis, their cross-sectional regressions find that an additional dollar of cash in a
firm had a larger impact on sale price in 1998 than in other years. In fact, the elasticity
of price-to-book with respect to cash flow is roughly 0.7 in 1998 while negligible during the
other years of the sample. Given that liquidity shocks are typically thought to be short-lived,
they argue this is further support for the fire-sale hypothesis, raised by Krugman.18
5.2 Majority stakes
The second implication of our model is that as opposed to portfolio investments, FDI inflows
during financial crises are associated with the acquisition of stakes that grant control, rather
than simply acquisition of cash-flow stakes. The unabridged version of Acharya, Shin and
18Our conclusions would be further strengthened if the exchange rate of a country is also hit by the financialcrisis. This is because the dollar price of the target firm will fall as the price of the target firm falls in localcurrency terms and also as the exchange rate moves in favor of the foreign acquirers paying dollars. Indeed,the exchange rate effect on FDI has been observed for the FDI flows into the United States. Froot and Stein(1991) show that FDI flows into the U.S. are negatively correlated with the value of the US dollar, whileFPI in the same period is positively correlated with the value of the US dollar (though insignificant). Theexchange rate movements associated with the Asian financial crisis were much sharper, and so we may expectthe exchange rate effects to have been significant.
23
Yorulmazer (2007) provides evidence in support of this by studying the M&A activity in the
financial sector in the South East Asian countries during the period of 1996-2000. Like Aguiar
and Gopinath (2005), they show (in their Table 2) that the crisis year of 1998 witnessed greater
foreign acquisitions, but crucially that unlike non-crisis years, these acquisitions represented
stakes of greater than 50 percent, and often the entire 100 percent. In contrast, the stakes
during non-crisis years were far smaller and almost always lower than 50 percent.19
Chari, Ouimet and Tesar (2004) investigate shareholder value gains from developed-
market acquisitions of emerging-market targets and show that acquirer returns increase when
the cost of capital, proxied by sovereign bond spreads, increases, which is a common feature
of financial crises. While they show that including a dummy for whether the acquirer had
the majority control after the acquisition renders the coefficient on the spread insignificant,
it should be noted that it is more likely that the developed-market acquirers can get the ma-
jority control during crisis periods, as evidence provided by Acharya, Shin and Yorulmazer
(2007) and Aguiar and Gopinath (2005) suggests. Hence, combined with the evidence of
Acharya, Shin and Yorulmazer (2007) and Aguiar and Gopinath (2005), we can interpret
their findings as further evidence for our results.
This ownership with control view of FDI has also been taken by some recent studies
analyzing the relative advantages of FDI and foreign portfolio investments (FPI) from the
investors’ viewpoint.20 Goldstein and Razin (2006), for example, build a theoretical model
where FDI investors take both ownership and control positions in the domestic firms and,
hence, are in effect the managers of the firms under their control. Thus, when they invest
directly through FDI, investors get more information about the fundamentals of the invest-
ment, and thereby can manage the project more efficiently, compared to their counterparts
who invest indirectly through FPI. However, this generates a lemon’s problem in that when
direct investors try to sell the investment before maturity, a low resale price results due to
asymmetric information between the owner and the potential buyers. Hence, investors with
high expected liquidity needs who may experience a greater extent of forced sales are more
likely to choose less control, that is, they would prefer FPI over FDI. They also show that
an increase in transparency between owners and managers, that is, an increase in corporate
governance standards, improves the efficiency of portfolio investments and thus attracts more
FPI.21 Our overall focus is different from their analysis in that we are concerned with the
negative correlation of FPI and FDI (especially) during crisis, rather than on the overall
19Also, UN (1999) shows that cross-border majority M&As in Asia increased by 28 percent in value in1998.
20For an introduction to this issue, see Albuquerque (2003).21In a related paper, Goldstein, Razin and Tong (2007) empirically test the prediction of the theoretical
model that source countries with higher probability of aggregate liquidity crises export relatively more FPIand less FDI, using data from 140 source countries for the period 1990-2004. They show that liquidity shockshave strong effects on the composition of foreign investment.
24
composition of foreign investment.
5.3 Flipping
We now turn to perhaps the most distinctive prediction of our theory as compared to the
previous literature on FDI - namely that assets acquired during a crisis are subsequently
re-sold, or “flipped”, once the crisis abates and prices rebound to the reservation price of
the high-value owner of the assets. We provide evidence of such flipping from data on the
purchase and re-sale of firms associated with the Asian financial crisis.
From the SDC Platinum database on mergers and acquisitions, we compiled the list of
firms from countries that underwent the Asian financial crisis. We examined firms that were
first sold during the five-year period from 1996 to 2000, which were then subsequently re-sold
to a second acquirer. Our search yielded 272 such firms which changed hands twice or more
after 1996. The industry classification of these target firms at the time of first acquisition is
given in Table 2.
Figure 3A provides a summary graph for succinct evidence for such flipping in the after-
math of the Asian financial crisis. To be precise, it defines a “flip” as the subsequent sale
(2001 onwards) for an acquisition that occurred during the crisis period (1996-2000). We
employ the standard definition of a controlling acquisition as corresponding to a purchase
of at least 10% of the target, but also a variant which requires the controlling acquisition
to be at least 25% of the target. The identity of the first acquirer during the crisis period
is then used to classify all acquisitions into Domestic acquisitions and Foreign acquisitions.
The figure plots the cumulative percentage of flipped deals in each class as a function of the
number of years since the acquisition in the crisis period.
There is clear evidence of greater flipping for targets acquired by foreign firms during the
crisis period. In Figure 3A, we observe that foreign deals are flipped more often than domestic
deals starting from year one, and the gap between the two only widens as more time elapses,
especially after the fourth year. By ten years since acquisition, 10.07% of foreign deals get
flipped as compared to 5.75% of domestic deals.
Figure 3B presents the evidence on flipping in a slightly different way. It plots the
incidence of flipping within the 1996 - 2000 period as well as those re-sales that happened
from 2001 onwards. The plots are again sub-divided into those cases where the acquirer’s
stake exceeded 10% from those cases where the acquirer’s stake exceeded 25%. The evidence
of Figure 3A appears overall robust in Figure 3B, that is, robust to whether re-sales within
the crisis period are considered as flips or not.
To provide convincing evidence that more deals are flipped by foreign acquirers than by
domestic acquirers during a financial crisis, we show that the flipping pattern is not present in
25
non-crisis periods. To this end, we collected data on deals that occurred during the pre-crisis
period of 1991-1995 from SDC Platinum and repeated our flipping analysis. We find that
foreign acquirers did not flip more often than domestic acquirers during 1991-1995. Figures
4A and 4B are counterparts of Figures 3A and 3B, and they show that the percentage of
domestic flip is actually slightly higher than that of foreign flip. This finding is the opposite
of that found during the 1996-2000 period, supporting the model’s prediction that foreign
buyers flip more often during the crisis period (when assets are available at fire-sale prices).
As a further robustness check, we divided our sample into deals from Asian countries that
suffered severely from the Asian financial crisis (Indonesia, Malaysia, Philippines, Thailand,
South Korea) and deals from other South East Asian countries that were not as severely
affected by the crisis. Our goal is to show that our main findings are driven by deals from
countries that suffered severely from the crisis. Figures 12A and 12B support this conjecture.
Figure 11A shows that, for the severe crisis countries, 10.68% of foreign deals are flipped,
much higher compared to the 5.47% of domestic firms that are flipped. Note that this flipping-
rate difference is slightly higher than that of the overall sample. On the contrary, Figure 11B
shows that, for the mild crisis countries, flipping rates are not different between foreign and
domestic acquirers. Finally, Figure 12A and 12B replicate Figure 11A and 11B with the
1991-1995 (pre-crisis) sample period. Just as in the overall sample, we find that in neither
the high-crisis nor non-crisis nations, foreign acquirers flipped more than domestic acquirers
during 1991-1995.
A few descriptive statistics about the flipped deals are interesting and consistent with
the mechanism outlined in our theory. First, on average as well as based on medians, the
flip involves a sale of at least as much as the original acquisition of the target, and generally
25% greater, for both domestic and foreign flips. Second, conditional on there being a flip,
over 70% of the flips by foreign acquirers involve sales to domestic acquirers (Tables 3A and
3B). Specifically, in our sample, out of 93 flips where the first (during the crises) acquirer
is a foreign firm, in 66 cases the second acquirer is a non-foreign firm, that is, a domestic
firm. In contrast, out of 157 flips where the first acquirer is a domestic firm, only 27 cases
get flipped to a foreign firm (17.2% of the flips by domestic acquirers). Third, the result on
greater flipping by foreign acquirers during crisis is also robust to employing a majority stake
of 50% being employed as the threshold for identifying controlling acquisitions.
These descriptive figures and tables provided preliminary evidence that foreign buyers
flipped more than domestic buyers during Asian financial crisis. From an econometric stand-
point, the question is whether this difference is statistically significant. We run the following
probit regression on South East Asian acquisitions made during 1996-2000:
Pr[Flipi = 1] = f(Foreigni) + ei. (30)
The above equation represents the probability of flipping of a deal as a function of whether
26
its acquirer is foreign or domestic: Flipi equals one if the deal is eventually flipped and equals
zero if the deal is not flipped; Foreigni is a dummy variable that equals one if the acquirer
is from South East Asia and equals zero otherwise.
Table 4 column (1) presents the estimation results. The standard errors are clustered by
the interaction of the target nation and year of acquisition. We observe that the estimation
coefficient of Foreigni is 0.259 and is highly significant. This indicates that the flipping rate
of foreign buyers is statistically significantly higher than that of domestic buyers. When
we repeat the estimation for the sample of deals from the Asian nations that suffered most
severely from the crisis (Indonesia, Malaysia, Philippines, Thailand, South Korea), we find
stronger results. Table 4 column (2) shows that the estimation coefficient of Foreigni is 0.303
for this high-crisis sample.
To substantiate the earlier evidence that foreign firms flipping more is a phenomenon
restricted to the financial crisis period, we modify the test as follows:
Pr[Flipi = 1] = f(Y eari + Foreigni + Foreigni ∗ Crisisi) + ei. (31)
We estimate this equation by including all deals completed from 1991 to 2000. For each
deal, Crisisi equals one if it took place in 1996-2000 and equals zero if it took place in 1991-
1995. The Crisisi variable is then interacted with Foreigni. Y eari is a time-fixed effect,
added to control for the year of acquisition. Table 4 column (3) reports the estimation result.
The standard errors are again clustered by the interaction of the target nation and year of
acquisition. We observe that the estimation coefficients of Foreigni and Foreigni ∗ Crisisiare 0.250 and 0.346 respectively, both statistically significant. The positive direction of
Foreigni ∗ Crisisi indicates that, compared to in 1991-1995, foreign buyers flipped more
than domestic buyers in 1996-2000 and this increase was significant. When we repeat the
estimation for the sample of deals from the Asian nations that suffered most severely from
the crisis, we find similar results (Table 4 column (4)). Finally, we repeat the estimation by
adding a country fixed effect to control for the target’s nation. Again, Table 4 column (5)
shows that the results are very close to that in column (3).
Overall, raw descriptive evidence as well as econometric evidence is supportive that flip-
ping of acquisitions made by foreign firms during a financial crisis is a robust economic
phenomenon. Anecdotal evidence from foreign takeovers in the banking sector reinforces
these points. In South Korea, the activities of foreign private equity firms in the Korean
banking sector has been a contentious issue. Lone Star Funds, a Dallas-based buyout com-
pany, paid $1.4 billion in October 2003 for 50.5 percent of the Korea Exchange Bank (KEB).
In January 2006, Lone Star announced plans to sell its controlling stake in KEB, the value of
which has more than tripled since to about $4.9 billion. An article in the International Herald
Tribune (January 13, 2006)22 argues that KEB shares surged to a six-year high as a recovery
22International Herald Tribune, January 13, 2006, “Lone Star to sell its stake in Korea Exchange Bank”.
27
in consumer spending spurred economic growth and lenders cleaned up bad loans, and that
rising stock markets in Asia offered buyout firms an opportunity to exit investments.23 The
article also quotes Vincent Chan, a Hong Kong-based managing director at Jafco, a publicly
traded Japanese venture capital firm: “It’s a good time to sell if the price is right. Private
equity funds like this seek to exit whenever the market is good.”Another newspaper article
in the Financial Times (April 5, 2007)24 reports Lone Star Funds’ plans to sell Kukdong En-
gineering & Construction and Star Lease, two South Korean companies. The article quotes
John Grayken, chairman of Lone Star: “As the companies have been turned around, it is
now time for them to be taken to the next level by a more strategic buyer. This is a normal
step in the investment cycle of a private equity fund.”
Another interesting episode is with the experience of Newbridge Capital, a US private
equity group that paid the Korean government $480m for the 49 percent shares of the Korea
First Bank, South Korea’s eighth-largest bank. An article in the Financial Times (January 9,
2005)25 reveals that the private equity group agreed to sell its shares to Standard Chartered
for an offer valuing the bank at about $3.3bn in cash. Newbridge Capital is reported to
have made a nearly three-fold return on its initial investment.26 In a similar episode, the
consortium of Carlyle Group, a Washington D.C. based global private equity investment
firm, and J.P. Morgan Chase sold 36.6 percent of KorAm Bank, South Korea’s sixth-largest
bank, to Citigroup Inc. in cash in February 2004 for a deal that valued the bank at $2.73
billion. The consortium of Carlyle and J.P. Morgan Chase has been reported to have made
a return of 2.3 times its original KorAm investment of $430 million in 2000.
During the ongoing sub-prime crisis too, two New York private equity firms, J.C. Flowers
& Co. and Cerberus Capital Management, both with long track records for snapping up
troubled banks around the world, were potential bidders for Northern Rock, the fifth-largest
mortgage lender in the UK that experienced bank runs in September 2007.27 While such
anecdotal evidence cannot be fully conclusive, when combined with our empirical evidence
from the SDC database, they reinforce the main message of our paper and highlight the
importance of financial distress as a determinant of FDI.
23The same article points out that Lone Star had sold stakes in golf courses, a bank and a credit cardcompany in Japan in the preceding four months.
24Financial Times, April 5, 2007, “Lone Star looks at sale of S. Korean companies”.25Financial Times, January 9, 2005: “Standard Chartered to acquire Korea First Bank for $3.3bn”.26Newbridge also exercised its rights to require the South Korean government, which controls the remaining
51 percent, to sell its shares as part of the same deal.27See, for instance, Wall Street Journal, October 4, 2007: “U.S. firms circle Northern Rock”. The article
says that: “A deal, like many distressed sales of banks, would mean they invest some money to prop up thebank, and when the market returns to normal levels, they could profit from selling the bank again.”
28
6 Resolution
We conclude our analysis with an examination of the welfare issues associated with regulatory
intervention in the form of re-capitalization of failed domestic firms during the resolution stage
of financial crisis.28
To summarize the result from the previous analysis, for α1 < α∗1 domestic firms with
the low return cannot generate the needed funds and they are put up for sale. In this case,
when the proportion of failures is sufficiently small, k ≤ k, all failed firms are purchased by
surviving domestic firms. Since this allocation entails no welfare losses, the regulator does
not have any incentive to intervene. In contrast, for k > k, some of these assets are purchased
by foreigners who are not the most efficient users. Hence, it may be optimal to recapitalize
some of the domestic firms to prevent misallocation of domestic assets. In particular, the
regulator compares the misallocation cost resulting from sales to foreigners with the cost of
recapitalizing the failed firms. The regulator recapitalizes failed firms as long as the marginal
cost of recapitalization is less than the misallocation cost of (α1∆).29
We proceed to analyze the regulator’s decision by making the following assumption: The
government incurs a fiscal cost of f(a) when it injects a units of funds into these firms, with
f(0) = 0. We assume this cost function is strictly increasing and convex: f ′ > 0 and f ′′ > 0.30
If the government decides not to recapitalize a failed firm, the firm is sold at the market-
clearing price. Thus, when the regulator recapitalizes b of the k failed firms, the fiscal cost
incurred is f(b). The crucial difference between recapitalization and sales is that recapital-
ization entails an opportunity cost to the regulator in fiscal terms.
The government’s objective is to maximize the total expected output of the economy net
of any recapitalization or liquidation costs. The government does not intervene when k 6 k.
28In practice, the role of the governments in the resolution of financial crises has been significant. Examplesinclude the establishment of institutions such as Resolution Trust Corporation (RTC) in the U.S. followingthe Savings and Loans crisis, the Bank Support Authority (BSA) in Sweden following the 1992 financial crisis,and the Korea Asset Management Company (KAMCO) following the Asian crisis of 1997.
29In this section, we only model the fiscal costs of intervention. There is also a question of incentives for theincumbent management. If the government takes ownership of the failed firm, the existing management maynot have incentives to exert effort. Thus, the optimal resolution strategy should also include the incentivecosts created by government ownership. A detailed analysis that involves these incentive costs is availablefrom the authors.
30The provision of immediate funds to recapitalize firms entails fiscal costs for the regulator (assumed to beexogeneous to the model). These fiscal costs can be linked to a variety of sources: (i) distortionary effects oftax increases required to fund recapitalizations; and, (ii) the likely effect of huge government deficits on thecountry’s exchange rate, manifested in the fact that banking crises and currency crises have often occurredas “twins” in many countries (especially, in emerging market countries). Ultimately, the fiscal cost we havein mind is one of immediacy: Government expenditures and inflows during the regular course of events aresmooth, relative to the potentially rapid growth of liabilities during crisis periods.
29
For k > k, the government’s problem is to choose b to maximize:31
E(Π(b)) = α1R1 − f(b)−(k − (1− k)`
(1 + p)− b)α1∆, (32)
where[(k − (1−k)`
(1+p)− b)α1∆
]is the misallocation cost resulting from sales to foreigners. The
first order condition for the government’s problem is:
f ′(b) = α1∆. (33)
Since the marginal cost f ′(b) is increasing in b, there is an upper bound, denoted by b, up to
which recapitalization costs are smaller than misallocation costs. Formally, b is obtained as
b = g (α1∆) , (34)
where g is the inverse of f ′. Since the maximum proportion of firms that can be acquired by
the surviving domestic firms is[(1− k)
(`
1+p
)], the regulator recapitalizes b∗(k) firms, where
b∗(k) = min{b,(k − (1− k)
(`
1+p
))}. (35)
We summarize the optimal resolution policy, which bears similarity to the normative
analysis of optimal resolution of bank failures in Acharya and Yorulmazer (2008):
Proposition 6 For α1 > α∗1, the regulator does not intervene. For α1 < α∗1, the optimal
policy is as follows:
(i) When k 6 k, surviving domestic firms purchase all failed firms and the regulator does
not intervene.
(ii) When k > k, the regulator recapitalizes b∗(k) of the k failed firms, where b∗(k) is
given by (35).
7 Concluding Remarks
Our theoretical framework focuses attention on the key difference between portfolio capital
flows and FDI in terms of their implications for control. This leads to important implications
for our understanding of financial flows. For instance, a key prediction of our model is that
the FDI inflows that happen during financial crises should be associated with the acquisition
31Note that the return Rt is decreasing in the share β the regulator takes in a recapitalized firm. Hence,the regulator does not take any share in the recapitalized firms.
30
of stakes that grant control, rather than simply being acquisition of cash-flow stakes. The
theoretical framework also highlights the negative relationship between capital flows and FDI:
FDI flows take over precisely when portfolio flows dry up.
After the Asian financial crisis, the evils of short-term debt financing were much decried,
and stable FDI financing was held up as the model for how development can be financed. Our
results suggest that the prescription to use FDI as a matter of course has limited usefulness
as a general policy dictum. Ironically, it is only when matters are very bad that FDI really
comes into its own and the latter is in fact a manifestation of deteriorating fundamentals.
The role of such foreign takeovers has generated much controversy in policy circles as well
as in the media. Our paper is a small step in trying to come to grips with the underlying
economics, and in the process, documenting the interesting finding that foreign acquisitions
are flipped back quickly to domestic firms when crisis abates and fundamentals improve.
Finally, the key messages of our model find more general application, for example, to
the ongoing sub-prime crisis where banks have struggled to raise external finance, except at
significant dilution costs, and been forced to sell large stakes to experienced investors such
as private equity funds or passive, outside investors such as sovereign wealth funds. On the
one hand, our model helps understand these flows – that agency problems in distress prevent
arm’s length investors from providing much finance, but that transfer of significant control
could get around these agency costs. On the other hand, by modeling the critical factors that
determine efficiency of such flows, namely the extent of fire-sale discounts and the expertise
of buyers relative to distressed insiders, our model offers a framework to analyze normative
issues. For example, what are the welfare implications of the relaxation of restrictions in the
United States on private equity investments in banking companies? We hope to apply our
model to such other contexts in future work.
References
Acharya, Viral, Sreedhar Bharath and Anand Srinivasan, 2007, Does Industry-wide Distress
Affect Defaulted Firms? - Evidence from Creditor Recoveries, Journal of Financial
Economics, 85(3): 787-821.
Acharya, Viral, and Tanju Yorulmazer, 2008, Cash-in-the-market Pricing and Optimal Res-
olution of Bank Failures, Review of Financial Studies, 21, 2705-2742.
Acharya, Viral, Hyun Song Shin and Tanju Yorulmazer, 2007, Fire Sales, Foreign Entry and
Bank Liquidity, Working paper, London Business School.
31
Aguiar, Mark, and Gita Gopinath, 2005, Fire-Sale FDI and Liquidity Crises, The Review of
Economics and Statistics, 87(3): 439-542.
Albuquerque, Rui, 2003, The Composition of International Capital Flows: Risk Sharing
Through Foreign Direct Investment, Journal of International Economics, 61: 353-83.
Allen, Franklin, and Douglas Gale, 1994, Liquidity Preference, Market Participation and
Asset Price Volatility, American Economic Review, 84: 933–955.
Allen, Franklin, and Douglas Gale, 1998, Optimal Financial Crises, Journal of Finance, 53:
1245–1284.
Berger, Philip, Eli Ofek and Itzhak Swary, 1996, Investor Valuation of the Abandonment
Option, Journal of Financial Economics, 42: 257–287.
Chari, Anusha, Paige Ouimet and Linda Tesar, 2004, Acquirer Gains in Emerging Markets,
Working paper, University of Michigan.
Froot, Kenneth A. and Jeremy C. Stein, 1991, Exchange Rates and Foreign Direct Invest-
ment: An Imperfect Capital Markets Approach, The Quarterly Journal of Economics,
106(4): 1191-1217.
Goldstein, Itay and Assaf Razin, 2006, An Information-based Trade off Between Foreign Di-
rect Investment and Foreign Portfolio Investment, Journal of International Economics,
70: 271-95.
Goldstein, Itay, Assaf Razin and Hui Tong, 2007, Systemic Liquidity and the Composition
of Foreign Investment: Theory and Empirical Evidence, Mimeo.
Hart, Oliver, and John Moore, 1994, A Theory of Debt Based on the Inalienability of Human
Capital, Quarterly Journal of Economics, 109(4): 841–879.
Holmstrom, Bengt, and Jean Tirole, 1998, Private and Public Supply of Liquidity, Journal
of Political Economy, 106(1): 1–40.
Krugman, Paul, 1998, Fire-sale FDI, available at
http://web.mit.edu/krugman/www/FIRESALE.htm.
Loungani, Prakash, and Assaf Razin, 2001, How Beneficial Is Foreign Direct Investment for
Developing Countries?, Finance and Development, IMF, Vol. 38, No. 2.
http://www.imf.org/external/pubs/ft/fandd/2001/06/loungani.htm.
32
Pfeffer, Barbara, 2008, FDI and FPI – Strategic Complements?, Working Paper, Department
of Economics, Universitat Siegen.
Pulvino, Todd C., 1998, Do Asset Fire Sales Exist: An Empirical Investigation of Commer-
cial Aircraft Sale Transactions, Journal of Finance, 53: 939-978.
Shleifer, Andrei, and Robert Vishny, 1992, Liquidation values and debt capacity: A market
equilibrium approach, Journal of Finance, 47: 1343-1366.
Stromberg, Per, 2000, Conflicts of Interest and Market Illiquidity in Bankruptcy Auctions:
Theory and Tests, Journal of Finance, 55: 2641–2692.
UN, 1999, Report on Trends in FDI, United Nations Conference on Trade and Develop-
ment, Commission on Investment, Technology and Related Financial Issues, Geneva,
4-8 October. http://www.unctad.org/en/docs/c2d21.pdf.
Williamson, Oliver E., 1988, Corporate Finance and Corporate Governance, Journal of
Finance, 43: 567–592.
Appendix
Proof of Proposition 4:
The steps of the proof are organized in a way that lays down the results for different
regions of the proportion (k) of failed firms.
Note that because of moral hazard, maximum units of equity that can be issued by a
surviving firm is τ . Thus, for w > τq, the funds within the foreigners is sufficient to keep the
share price q(k) at q, had they decided to use their funds for the purchase of these shares.
(1) For k 6 k, liquidity within the surviving firms and the liquidity they can raise by
issuing shares to foreigners is sufficient to sustain the price for the failed firms’ assets at p,
that is, (1− k)` > k(1 + p).
Since p∗(k) = p > p, we have x = 0 and m =(
k1−k
). Each surviving firm issues enough
equity, at q(k) = q, to purchase(
k1−k
)units of failed firms’ assets at p∗(k) = p. Thus, we have
(R0 − 1) + sq =
(k
1− k
)(1 + p) , which gives us:
s =
(k (p+R0)− (R0 − 1)
(1− k) q
)and y =
(k (p+R0)− (R0 − 1)
q
).
33
(2) For k < k 6 k, liquidity within the surviving firms and the liquidity they can raise
through equity issuance from foreigners is sufficient to sustain p∗(k) at least at p, that is,
(1− k)` > k(1 + p).
Since p∗(k) > p, we have x = 0 and m =(
k1−k
). Each surviving firm issues enough equity,
at q(k) = q, to purchase(
k1−k
)units of failed firms’ assets at p∗(k) =
(`k− (1 + `)
), that is,
(R0 − 1) + sq =
(k
1− k
)(1 + p∗(k)), which gives us
s = τ and y = (1− k)τ.
(3) For k < k 6 k, liquidity within the surviving firms and the liquidity they can raise
through equity issuance from foreigners plus the liquidity left with the foreigners (since w >
τq), which add up to [(1− k)R0 + w], is sufficient to sustain p∗(k) at least at p. Each surviving
firm issues the maximum possible equity, at q(k) = q, which gives us s = τ and y = (1− k)τ.
Note that each surviving firm can acquire m =(
`1+p
)units of failed firms’ assets and the
rest is acquired by foreigners, that is, x =(k − (1−k)`
1+p
).
(4) For k > k, total liquidity within the surviving firms and the liquidity they can raise
through equity issuance from foreigners plus any liquidity left with foreigners is no longer
sufficient to sustain p∗(k) at p. Since p∗(k) < p, foreigners may prefer to participate in the
market for failed firms’ assets.
If p∗(k) < p and p q(k) > q p∗(k), then foreigners use all their funds for the asset purchase,
that is x =(
wp∗(k)
).
If p∗(k) < p and p q(k) < q p∗(k), then foreigners use all their funds for the equity
purchase, that is y =(
wq(k)
), and if p q(k) = q p∗(k), foreigners are indifferent between the
purchase of surviving firms’ shares and the failed firms’ assets.
Now, let µ =(qp
). Whether foreigners buy shares of the surviving firms or the assets of
the failed firms, their entire funds w eventually end up in the asset market. Hence, for k > k,
the price for failed firms’ assets is given as:
p∗(k) =
((1− k)(R0 − 1) + w
k
)− 1. (36)
If the price q(k) of a share is higher then µp∗(k), then foreigners are better off buying the
assets of failed firms, rather than buying shares of the surviving firms, that is, y = 0 and
x =(
wp∗(k)
). Hence, we cannot have an equilibrium where q(k) > µp∗(k) and y = 0.
34
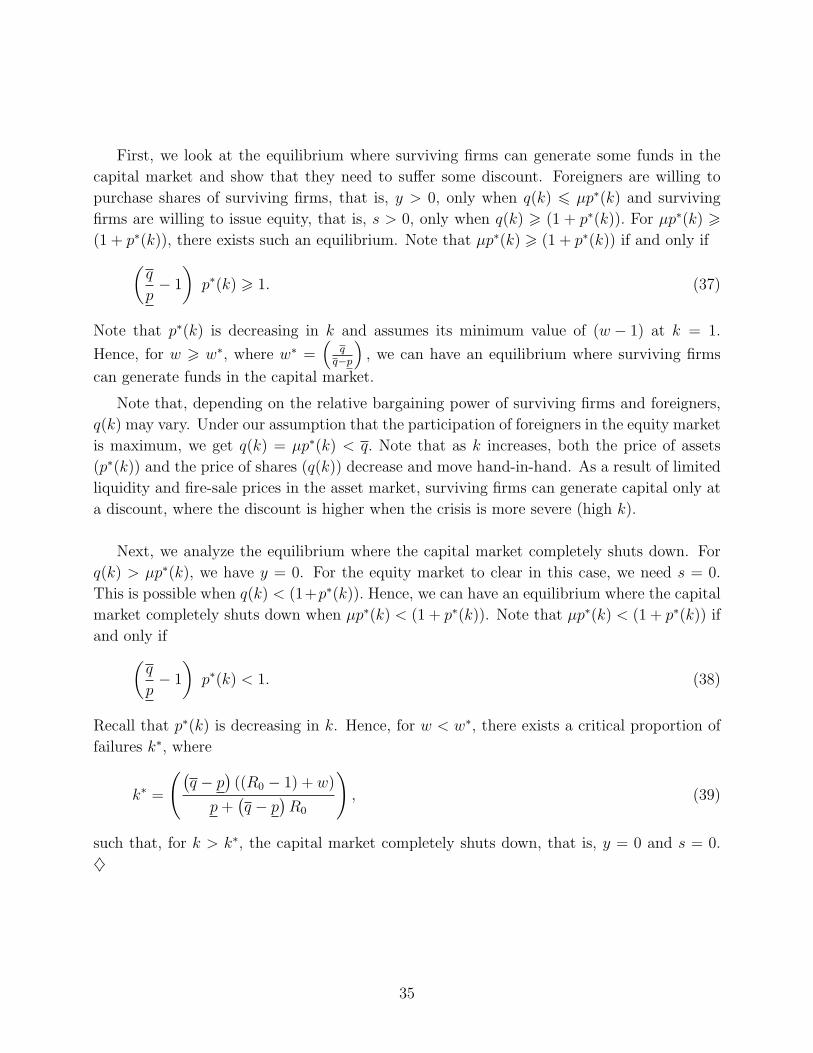
First, we look at the equilibrium where surviving firms can generate some funds in the
capital market and show that they need to suffer some discount. Foreigners are willing to
purchase shares of surviving firms, that is, y > 0, only when q(k) 6 µp∗(k) and surviving
firms are willing to issue equity, that is, s > 0, only when q(k) > (1 + p∗(k)). For µp∗(k) >(1 + p∗(k)), there exists such an equilibrium. Note that µp∗(k) > (1 + p∗(k)) if and only if(
q
p− 1
)p∗(k) > 1. (37)
Note that p∗(k) is decreasing in k and assumes its minimum value of (w − 1) at k = 1.
Hence, for w > w∗, where w∗ =(
qq−p
), we can have an equilibrium where surviving firms
can generate funds in the capital market.
Note that, depending on the relative bargaining power of surviving firms and foreigners,
q(k) may vary. Under our assumption that the participation of foreigners in the equity market
is maximum, we get q(k) = µp∗(k) < q. Note that as k increases, both the price of assets
(p∗(k)) and the price of shares (q(k)) decrease and move hand-in-hand. As a result of limited
liquidity and fire-sale prices in the asset market, surviving firms can generate capital only at
a discount, where the discount is higher when the crisis is more severe (high k).
Next, we analyze the equilibrium where the capital market completely shuts down. For
q(k) > µp∗(k), we have y = 0. For the equity market to clear in this case, we need s = 0.
This is possible when q(k) < (1+p∗(k)). Hence, we can have an equilibrium where the capital
market completely shuts down when µp∗(k) < (1 + p∗(k)). Note that µp∗(k) < (1 + p∗(k)) if
and only if(q
p− 1
)p∗(k) < 1. (38)
Recall that p∗(k) is decreasing in k. Hence, for w < w∗, there exists a critical proportion of
failures k∗, where
k∗ =
((q − p
)((R0 − 1) + w)
p+(q − p
)R0
), (39)
such that, for k > k∗, the capital market completely shuts down, that is, y = 0 and s = 0.
♦
35
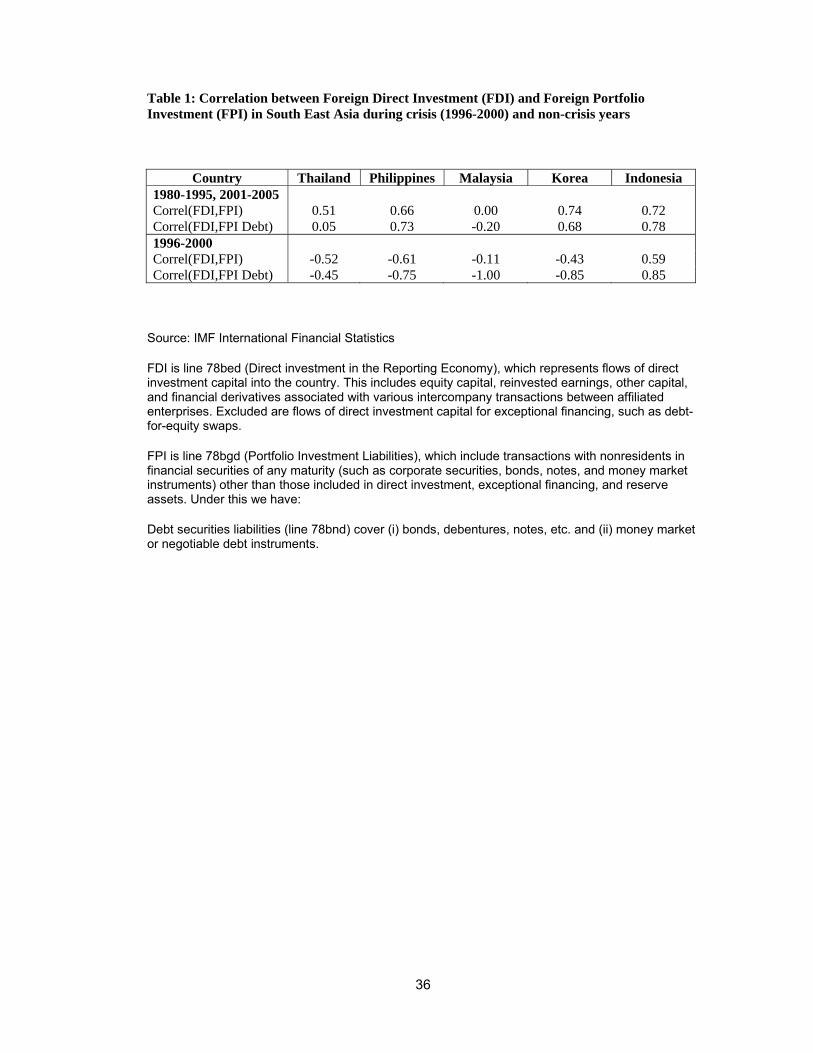
36
Table 1: Correlation between Foreign Direct Investment (FDI) and Foreign Portfolio Investment (FPI) in South East Asia during crisis (1996-2000) and non-crisis years
Country Thailand Philippines Malaysia Korea Indonesia 1980-1995, 2001-2005 Correl(FDI,FPI) 0.51 0.66 0.00 0.74 0.72 Correl(FDI,FPI Debt) 0.05 0.73 -0.20 0.68 0.78 1996-2000 Correl(FDI,FPI) -0.52 -0.61 -0.11 -0.43 0.59 Correl(FDI,FPI Debt) -0.45 -0.75 -1.00 -0.85 0.85
Source: IMF International Financial Statistics FDI is line 78bed (Direct investment in the Reporting Economy), which represents flows of direct investment capital into the country. This includes equity capital, reinvested earnings, other capital, and financial derivatives associated with various intercompany transactions between affiliated enterprises. Excluded are flows of direct investment capital for exceptional financing, such as debt-for-equity swaps. FPI is line 78bgd (Portfolio Investment Liabilities), which include transactions with nonresidents in financial securities of any maturity (such as corporate securities, bonds, notes, and money market instruments) other than those included in direct investment, exceptional financing, and reserve assets. Under this we have: Debt securities liabilities (line 78bnd) cover (i) bonds, debentures, notes, etc. and (ii) money market or negotiable debt instruments.
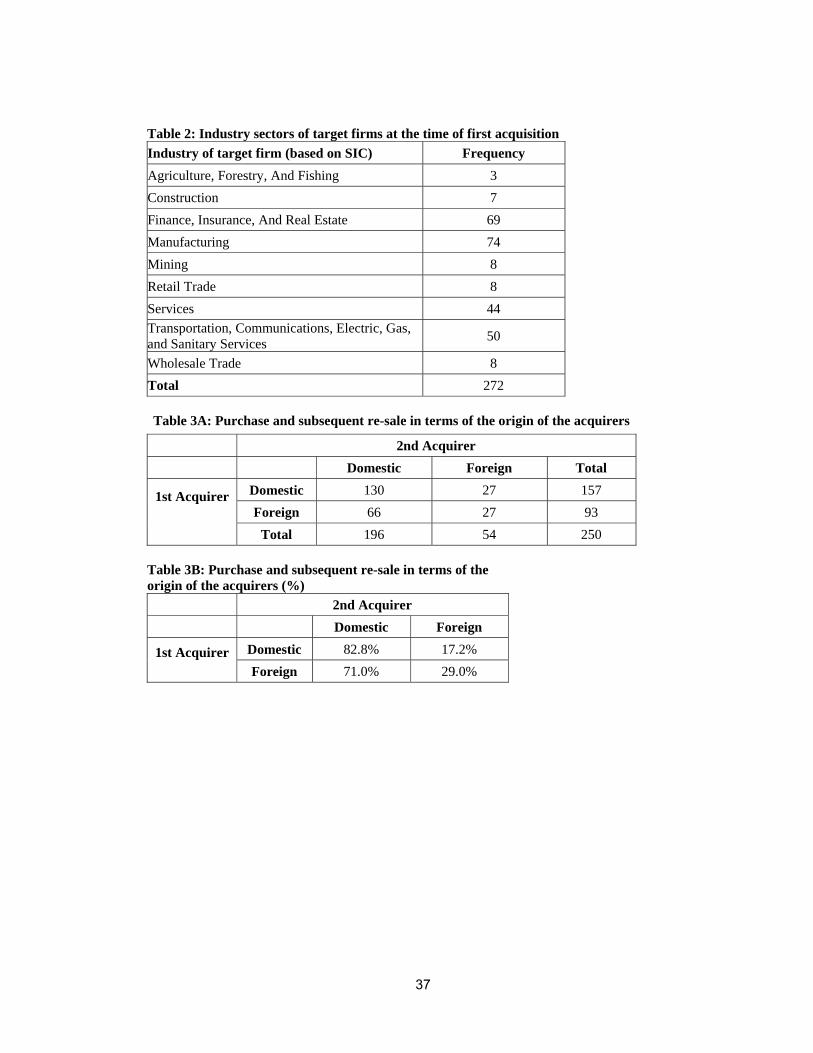
37
Table 2: Industry sectors of target firms at the time of first acquisition
Industry of target firm (based on SIC) Frequency
Agriculture, Forestry, And Fishing 3
Construction 7
Finance, Insurance, And Real Estate 69
Manufacturing 74
Mining 8
Retail Trade 8
Services 44
Transportation, Communications, Electric, Gas, and Sanitary Services
50
Wholesale Trade 8
Total 272
Table 3A: Purchase and subsequent re-sale in terms of the origin of the acquirers
2nd Acquirer
Domestic Foreign Total
1st Acquirer
Domestic 130 27 157
Foreign 66 27 93
Total 196 54 250
Table 3B: Purchase and subsequent re-sale in terms of the origin of the acquirers (%)
2nd Acquirer
Domestic Foreign
1st Acquirer
Domestic 82.8% 17.2%
Foreign 71.0% 29.0%
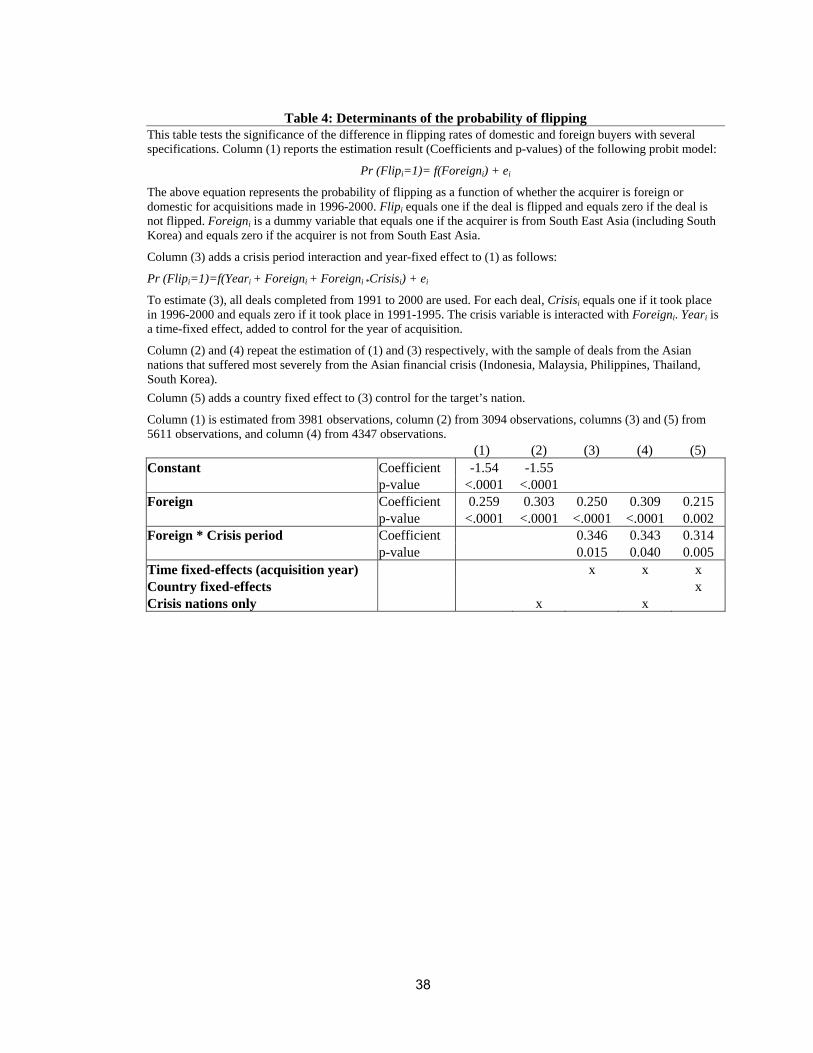
38
Table 4: Determinants of the probability of flipping This table tests the significance of the difference in flipping rates of domestic and foreign buyers with several specifications. Column (1) reports the estimation result (Coefficients and p-values) of the following probit model:
Pr (Flipi=1)= f(Foreigni) + ei
The above equation represents the probability of flipping as a function of whether the acquirer is foreign or domestic for acquisitions made in 1996-2000. Flipi equals one if the deal is flipped and equals zero if the deal is not flipped. Foreigni is a dummy variable that equals one if the acquirer is from South East Asia (including South Korea) and equals zero if the acquirer is not from South East Asia.
Column (3) adds a crisis period interaction and year-fixed effect to (1) as follows:
Pr (Flipi=1)=f(Yeari + Foreigni + Foreigni *Crisisi) + ei
To estimate (3), all deals completed from 1991 to 2000 are used. For each deal, Crisisi equals one if it took place in 1996-2000 and equals zero if it took place in 1991-1995. The crisis variable is interacted with Foreigni. Yeari is a time-fixed effect, added to control for the year of acquisition.
Column (2) and (4) repeat the estimation of (1) and (3) respectively, with the sample of deals from the Asian nations that suffered most severely from the Asian financial crisis (Indonesia, Malaysia, Philippines, Thailand, South Korea).
Column (5) adds a country fixed effect to (3) control for the target’s nation.
Column (1) is estimated from 3981 observations, column (2) from 3094 observations, columns (3) and (5) from 5611 observations, and column (4) from 4347 observations. (1) (2) (3) (4) (5) Constant Coefficient -1.54 -1.55 p-value <.0001 <.0001 Foreign Coefficient 0.259 0.303 0.250 0.309 0.215 p-value <.0001 <.0001 <.0001 <.0001 0.002 Foreign * Crisis period Coefficient 0.346 0.343 0.314 p-value 0.015 0.040 0.005 Time fixed-effects (acquisition year) x x x Country fixed-effects x Crisis nations only x x
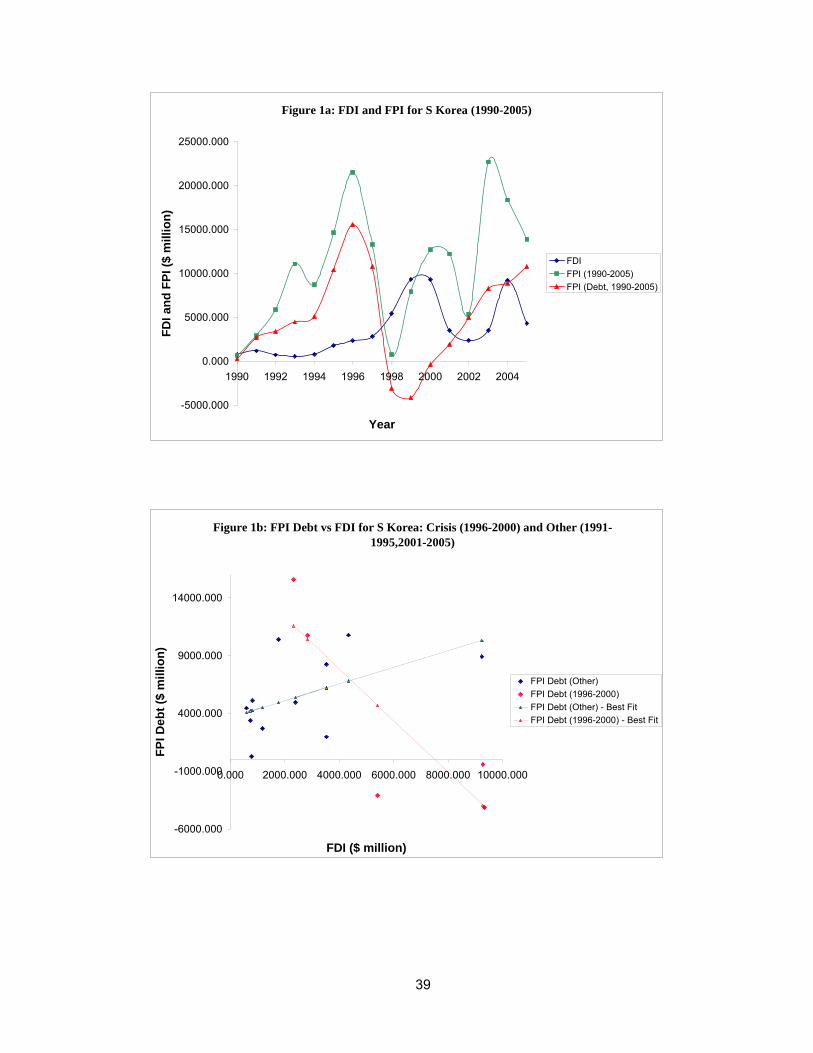
39
Figure 1a: FDI and FPI for S Korea (1990-2005)
-5000.000
0.000
5000.000
10000.000
15000.000
20000.000
25000.000
1990 1992 1994 1996 1998 2000 2002 2004
Year
FD
I an
d F
PI
($ m
illio
n)
FDI
FPI (1990-2005)
FPI (Debt, 1990-2005)
Figure 1b: FPI Debt vs FDI for S Korea: Crisis (1996-2000) and Other (1991-1995,2001-2005)
-6000.000
-1000.000
4000.000
9000.000
14000.000
0.000 2000.000 4000.000 6000.000 8000.000 10000.000
FDI ($ million)
FP
I De
bt
($ m
illio
n)
FPI Debt (Other)
FPI Debt (1996-2000)
FPI Debt (Other) - Best Fit
FPI Debt (1996-2000) - Best Fit
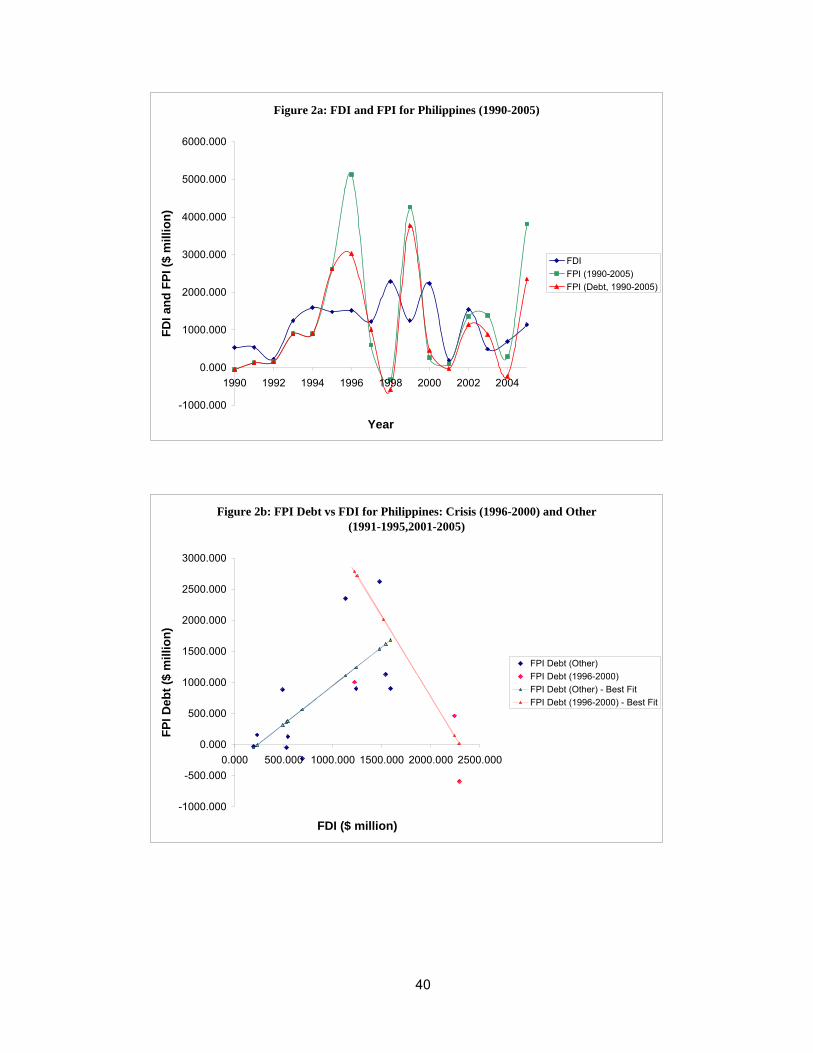
40
Figure 2a: FDI and FPI for Philippines (1990-2005)
-1000.000
0.000
1000.000
2000.000
3000.000
4000.000
5000.000
6000.000
1990 1992 1994 1996 1998 2000 2002 2004
Year
FD
I an
d F
PI
($ m
illio
n)
FDI
FPI (1990-2005)
FPI (Debt, 1990-2005)
Figure 2b: FPI Debt vs FDI for Philippines: Crisis (1996-2000) and Other (1991-1995,2001-2005)
-1000.000
-500.000
0.000
500.000
1000.000
1500.000
2000.000
2500.000
3000.000
0.000 500.000 1000.000 1500.000 2000.000 2500.000
FDI ($ million)
FP
I D
ebt
($ m
illio
n)
FPI Debt (Other)
FPI Debt (1996-2000)
FPI Debt (Other) - Best Fit
FPI Debt (1996-2000) - Best Fit
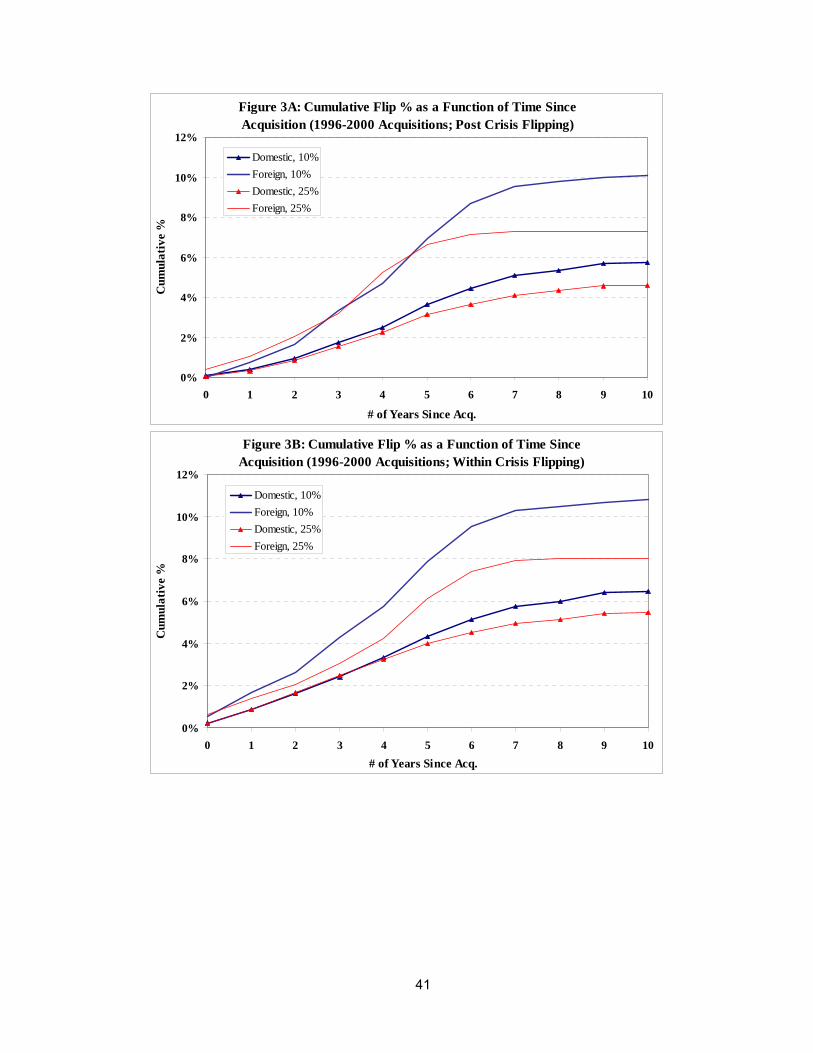
41
Figure 3A: Cumulative Flip % as a Function of Time Since Acquisition (1996-2000 Acquisitions; Post Crisis Flipping)
0%
2%
4%
6%
8%
10%
12%
0 1 2 3 4 5 6 7 8 9 10
# of Years Since Acq.
Cum
ulat
ive
%Domestic, 10%
Foreign, 10%
Domestic, 25%
Foreign, 25%
Figure 3B: Cumulative Flip % as a Function of Time Since Acquisition (1996-2000 Acquisitions; Within Crisis Flipping)
0%
2%
4%
6%
8%
10%
12%
0 1 2 3 4 5 6 7 8 9 10
# of Years Since Acq.
Cum
ulat
ive
%
Domestic, 10%
Foreign, 10%
Domestic, 25%
Foreign, 25%
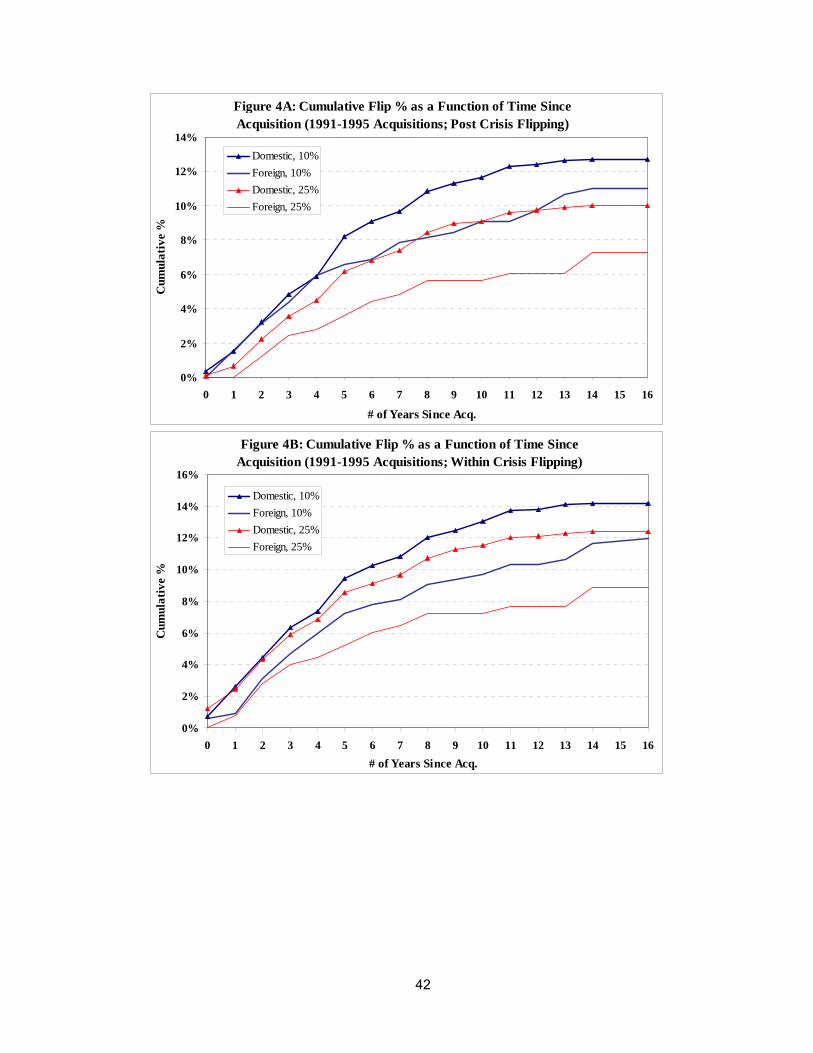
42
Figure 4A: Cumulative Flip % as a Function of Time Since Acquisition (1991-1995 Acquisitions; Post Crisis Flipping)
0%
2%
4%
6%
8%
10%
12%
14%
0 1 2 3 4 5 6 7 8 9 10 11 12 13 14 15 16
# of Years Since Acq.
Cum
ulat
ive
%Domestic, 10%
Foreign, 10%
Domestic, 25%
Foreign, 25%
Figure 4B: Cumulative Flip % as a Function of Time Since Acquisition (1991-1995 Acquisitions; Within Crisis Flipping)
0%
2%
4%
6%
8%
10%
12%
14%
16%
0 1 2 3 4 5 6 7 8 9 10 11 12 13 14 15 16
# of Years Since Acq.
Cum
ulat
ive
%
Domestic, 10%
Foreign, 10%
Domestic, 25%
Foreign, 25%
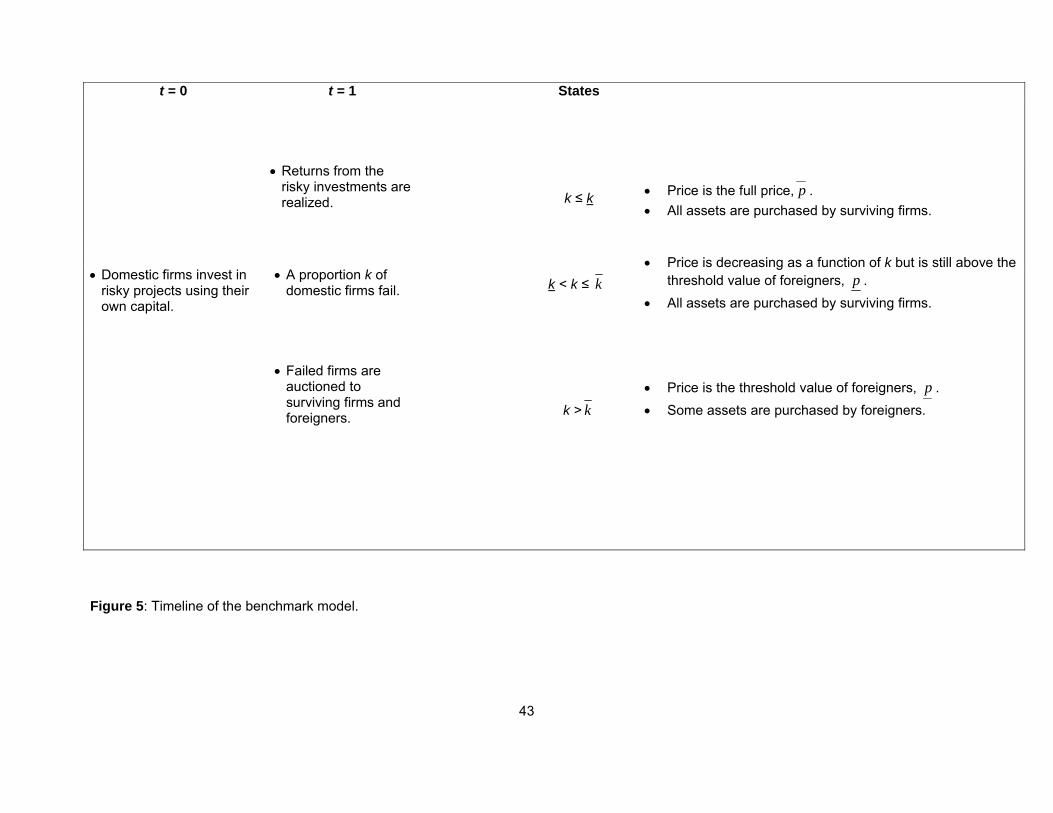
43
Figure 5: Timeline of the benchmark model.
t = 0 t = 1 States
Returns from the risky investments are realized. k ≤ k
Price is the full price, p .
All assets are purchased by surviving firms.
k < k ≤ k
Price is decreasing as a function of k but is still above the
threshold value of foreigners, p .
All assets are purchased by surviving firms.
Domestic firms invest in
risky projects using their own capital.
A proportion k of domestic firms fail.
Failed firms are
auctioned to surviving firms and foreigners.
k > k
Price is the threshold value of foreigners, p .
Some assets are purchased by foreigners.
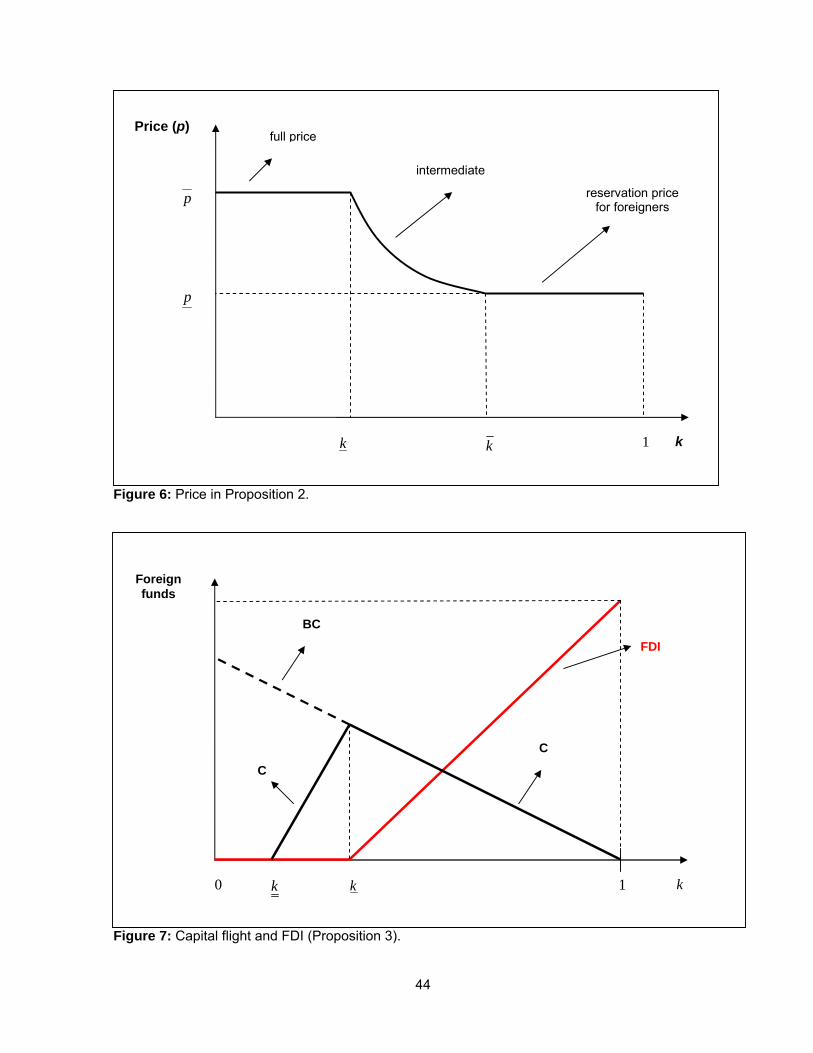
44
Figure 6: Price in Proposition 2.
Figure 7: Capital flight and FDI (Proposition 3).
p
p
k
Price (p)
k k 1
full price
intermediate
reservation price for foreigners
0 k 1 k
FDI
BC
C
C
Foreign funds
k
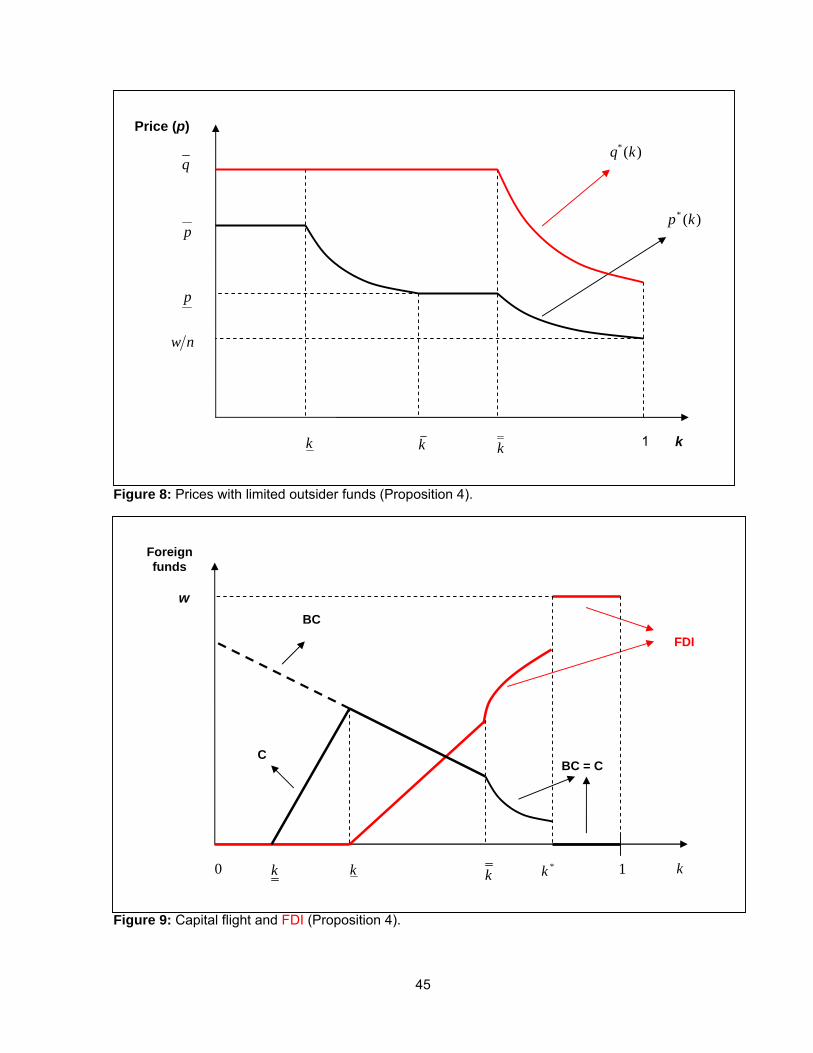
45
Figure 8: Prices with limited outsider funds (Proposition 4).
Figure 9: Capital flight and FDI (Proposition 4).
p
p
k
Price (p)
k1
nw
k
*( )q k
)(* kp
k
q
0 k 1 k
FDI
BC
BC = C C
*k
w
Foreign funds
k k
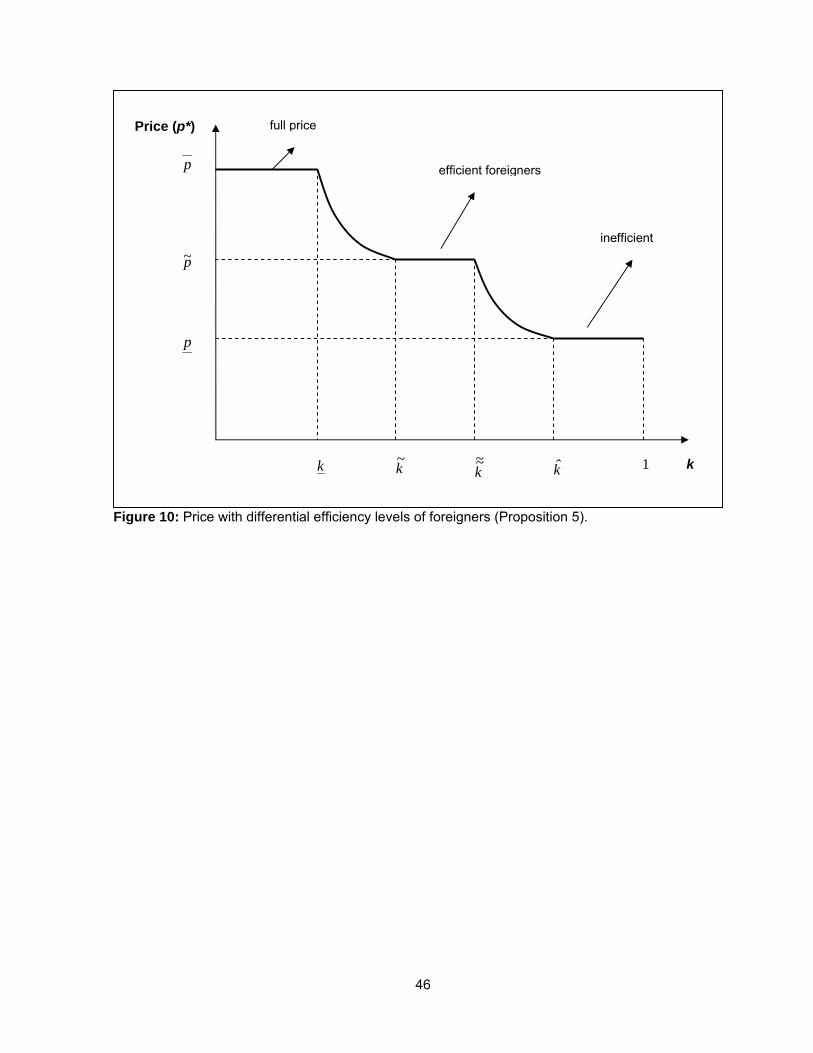
46
Figure 10: Price with differential efficiency levels of foreigners (Proposition 5).
p
p
k
Price (p*)
kk~~
1
full price
efficient foreigners
inefficient
p~
k~
k̂
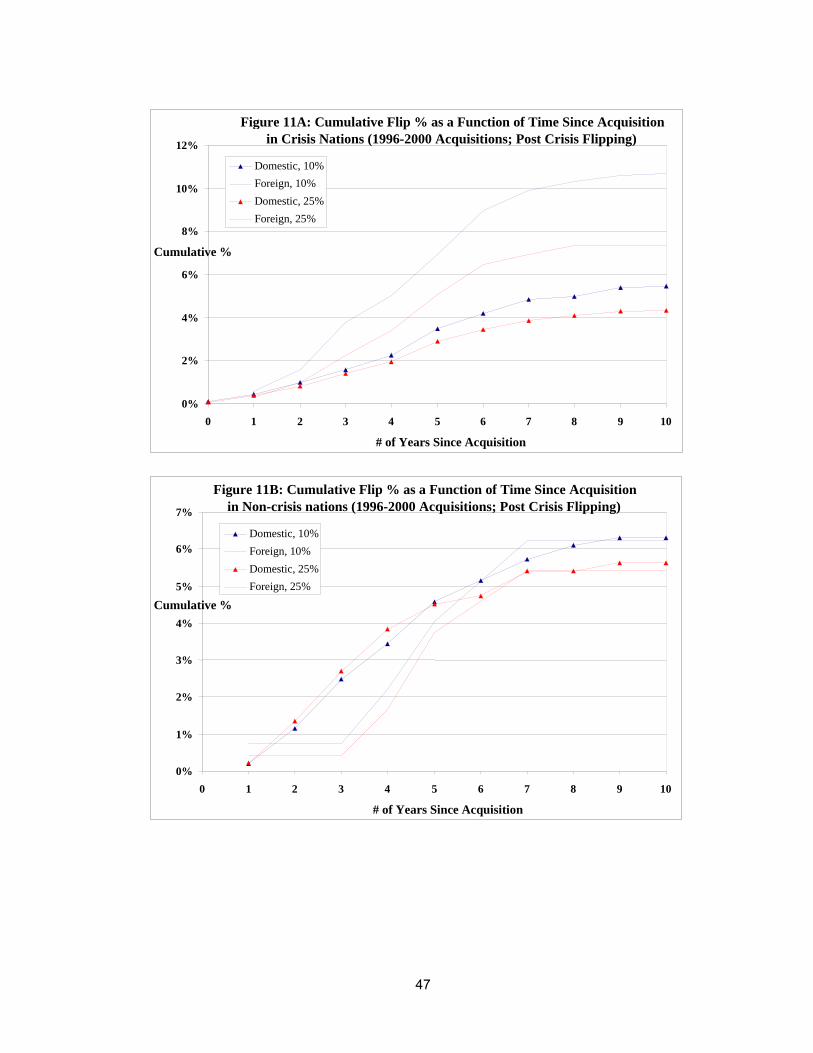
47
Figure 11A: Cumulative Flip % as a Function of Time Since Acquisition in Crisis Nations (1996-2000 Acquisitions; Post Crisis Flipping)
0%
2%
4%
6%
8%
10%
12%
0 1 2 3 4 5 6 7 8 9 10
# of Years Since Acquisition
Cumulative %
Domestic, 10%
Foreign, 10%
Domestic, 25%
Foreign, 25%
Figure 11B: Cumulative Flip % as a Function of Time Since Acquisition in Non-crisis nations (1996-2000 Acquisitions; Post Crisis Flipping)
0%
1%
2%
3%
4%
5%
6%
7%
0 1 2 3 4 5 6 7 8 9 10
# of Years Since Acquisition
Cumulative %
Domestic, 10%
Foreign, 10%
Domestic, 25%
Foreign, 25%
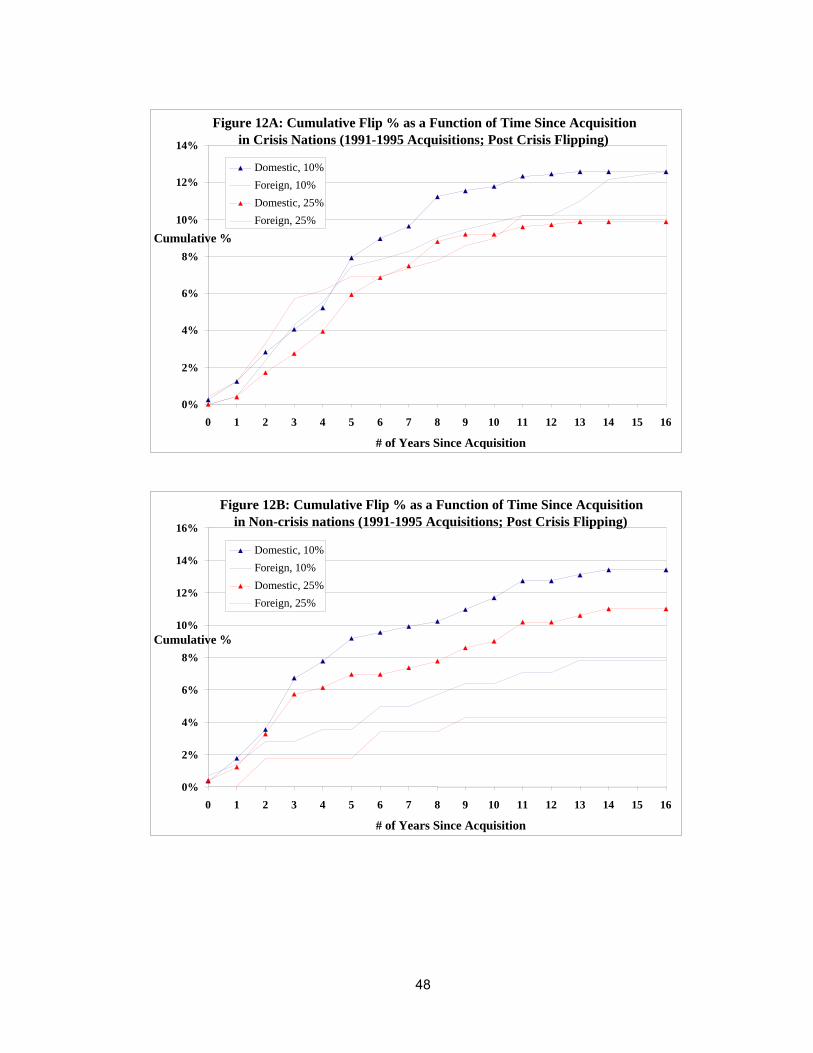
48
Figure 12A: Cumulative Flip % as a Function of Time Since Acquisition in Crisis Nations (1991-1995 Acquisitions; Post Crisis Flipping)
0%
2%
4%
6%
8%
10%
12%
14%
0 1 2 3 4 5 6 7 8 9 10 11 12 13 14 15 16
# of Years Since Acquisition
Cumulative %
Domestic, 10%
Foreign, 10%
Domestic, 25%
Foreign, 25%
Figure 12B: Cumulative Flip % as a Function of Time Since Acquisition in Non-crisis nations (1991-1995 Acquisitions; Post Crisis Flipping)
0%
2%
4%
6%
8%
10%
12%
14%
16%
0 1 2 3 4 5 6 7 8 9 10 11 12 13 14 15 16
# of Years Since Acquisition
Cumulative %
Domestic, 10%
Foreign, 10%
Domestic, 25%
Foreign, 25%