fire, deforestation and land tenure in the north … fire, deforestation and land tenure in the...
TRANSCRIPT
1
Fire, Deforestation and Land Tenure in the North-Eastern Fringes of Bukit
Barisan Selatan National Park, Lampung S. SuyantoS. Suyanto11
1. Background
Fires devastated large areas of Indonesia in 1994 and in 1997/1998. In 1997 and 1998,
according to the Bappenas/ADB report (1999), the burnt area covered 9.5 million ha,
and occurred mostly in Sumatra and Kalimantan. The official burnt areas estimate in
1994 was 5.11 million ha2. In both 1997/1998 and 1994, fires produced smoke that
caused air pollution, poor visibility, and severe health problems in Indonesia and the
neighboring countries of Singapore and Malaysia.
The major causes of fire in Indonesia during the El Niño fire years in 1997/1998 and
1994 are still unclear. Reports of causes of fires include pointing the finger of blame at
actors who deliberately set fires such as small-scale farmers and large-scale estates and
the amount of land burned and impacts on vegetation and ecosystems are subject to
continuing debate. In 1994, the Indonesian government blamed s lash-and-burn activity
by smallholders as the major cause of fire, and estimated it accounted for more than
90% of total area burned. Environmental NGOs, however, blamed activities by forest
concessionaires and plantation owners as the major causes of fires. In contrast, taking
advantage of data obtained from fire hot spot information and satellite imagery, all
institutions including government agencies believe that plantation owners large scale of
pulpwood and oil palm plantation were the major cause of fire in 1997 and 1998 in
many parts of Indonesia.
In order to provide precise information to policy makers, it is important to understand
the underlying causes of fires. Thus, policy makers can set appropriate and effective
1 International Centre for Research in Agroforestry (ICRAF) Southeast Asian Regional Research Programme 2 A more detailed account at fire history in Indonesia can be found in Dennis (1998)

2
policies to manage fire and smoke problems based on soundly researched information,
rather than on assumptions.
CIFOR, ICRAF, and the US-Forest Service are studying the underlying causes and
impacts of land and forest fires in Indonesia. The main questions to be addressed in this
project are why, what, who, where, and how much burned. This study will apply three
levels of spatial analysis: island-wide, province, and site level. In this project, we use a
combination of remote sensing/GIS techniques and social-economic research to provide
the answer.
We conducted eight studies at the site-specific level analysis in Sumatra and
Kalimantan. The first site, Sekincau, is located in the mountainous area of western
Lampung. It represents a case study of the dynamics of fire in a National Park area and
villages on the fringe of that National Park. In this site, land tenure conflicts arise
between farmers and the National Park managers. We focus on understanding a
relationship between fire, deforestation and land tenure. As population pressure has
increased, pressures to convert natural forest to non-forest uses have also increased.
The population of Lampung has increased dramatically since the 1970s. The population
of Lampung in 1971 was 2.8 million people and population density was 78 person per
km2. In 1997, the population of Lampung was 6.9 million people (almost 2.5 times
1971) and population density was 209 person per km2 (increasing by almost 2.7 times).
According to RePPProt (1988), 50% of migrants who went to Sumatra since the
beginning of the 20 th Century settled in Lampung. As the population increased, forest
cover in Lampung has declined. Forest cover in Lampung in 1982 was only 18%
(Fraser 1998).
In this study, we examined the hypotheses of the causes of fires developed by Tomich et
al (1998). According to the authors, there are three sources of fire: fire as a tool to clear
land; fire that accidentally gets out of control; and fire as a weapon in social conflict.
In Indonesia, the conversion of natural forest to agricultural uses has often utilized fire
in land clearing. Smallholders and large-scale plantation managers prefer to use slash-
and-burn methods in land clearing because it is cheap and easy (Tomich et al. 1998).
Fire used as a tool in land clearing contributes to the smoke and fire problem.

3
Although fires do not always came from conversion of natural forest (deforestation), the
phenomena of deforestation have increased with increasing land development pressures.
Therefore, we can suspect that fire a symptom of deforestation.
We believe that there is a relationship between land tenure conflicts and fire. Tomich et
al. (1998) pointed out that fires were started deliberately as a weapon in social conflicts.
There are many conflicts arising between smallholders and large companies resulting
from insecure land tenure and from land allocation policies. The allocation of land for
large companies is often determined without recognizing the existence or rights of local
people who already cultivate that land with no security of tenure. Both large companies
and smallholders use fire in a hope of resolving the conflict.
2. Methodology
We conducted the study into two stages. In the first stage, we used participatory
mapping and group interviews to collect general information about the histories of
villages (Talang), village characteristics and village sketch maps (Figure 1). The data
we obtained using this approach is largely qualitative. We invited formal and informal
leaders of villages to attend a number of meetings. Following that we conducted rapid
rural appraisals with some of our key informants, and revised our sketch maps through
visiting the village areas. We also interviewed Bukit Barisan Selatan National Park
officers, as well as Forestry and Estate Crop officers in Lampung.
Since the quantitative data obtained through this approach provide very rough estimates,
the next step was to conduct an extensive community survey at sub-Talang or sub-
hamlet unit. We interviewed formal and informal leaders in all sub-hamlet or sub-
Talang. We listed all the households in each sub -Talang and obtained information about
demography, migration and land ownership for each household. We also inquired about
slash-and-burn practices and fires in 1997/1998 in these group interviews.

4
Figure 1. Participatory Mapping
3. Study Site
For our study site, we selected register 46B Gunung Sekincau, located in the
northeastern part of Bukit Barisan Selatan National Park (Figure 2). According to the
official data, the area of register 46B is 28,900 ha. The forest, however, has been
converted to coffee gardens. Gintings et al. (1999) estimated that the natural forest in
this park is about 34% of total area. Population pressure surrounding the park is very
high. These are a lot of communities located on the edge or inside the park (Figure 3
and Figure 4). These communities are expanding rapidly in times recent. These
communities are not comprised of indigenous people. Most of them are migrants who
came from other parts of Lampung and from Java. There are two types of communities:
permanent and temporary migrants. Temporary migrants are defines people who stay in
the village for a short time and live permanently in other areas. The temporary
migrants stay in this village just for growing coffee. They usually stay in these villages
only during the harvesting time between June and August. The temporary migrants
came from different parts of Lampung and from Java.
We conducted a community survey of 19 communities/sub-Talang (in 5 big Talang)
located in the western part of register 46 B. We focused our work in the western part of
register 46 B because fires occurred in this area in 1997/1998. According to official

5
data, fires damaged 100 ha of forest in this area. We found this estimation of burned
areas to be an under estimate.
Originally; these Talang comprise temporary housing near coffee gardens. Some of
these Talangs, however, have been developing into a village. In the administrative
areas, each of these Talangs must be part of the administrative village (desa ) that
mostly located along the main road. However, there is no rule that Talang should be
part of the closed village. Therefore, many Talangs are not part of contiguous spatial
units with their home villages.
Because of complexity of the areas of the village, we do not use villages as the unit for
the analysis. We use Talang and sub-Talang as the unit of analysis. Our total sample
size consists of 19 sub-Talang, and 84% of the total sample unit are located inside the
National Park and 16% are located outside or on the border of the National Park.
Figure 2. Location of Study Site

6
Figure 3. Sketch Map of the Study Site
Figure 4. New Migration in National Park

7
4. General Description
Table 1 provides in information about the study site. Talang A is located on the
boundary of the park of Gunung Sekincau Register 46b with an elevation of 800 m
above sea level. Talang A is the administrative center for this site and located on a
flatter area than the others. Talang A is divided into 3 RT (administrative
neighborhoods). This Talang is the nearest to the main road. It is about 6 km from the
start of asphalt road. Accessibility from the main road/sub-district center to Talang A is
good, with public transportation by minibus (4 vehicles operating) and motorcycle or
ojek (26 motorcycle).
Talang B, Talang C, Talang D are located inside the National Park. These Talang are
located in hilly areas or sloping plains, at an elevation of 900-1050 m. The roads to
these Talang are unpaved with difficult access. The only public transportation available
is “ a Jeep Hardtop” that is predominantly used for transporting coffee. During rain this
jeep hardtop cannot pass this road, so residents must walk around 1-2 hour to reach
these Talang (see Figure 5).
Table 1. Site Characteristics
Talang
Number of Sub-Talang
Elevation
Distance to Main Road (km)
Location in the Park
Site S: Talang A Talang B Talang C Talang D Talang E
3 1 2 6 7
800 900 950 1,050 1,100
6 7 10 11-30 12-37
Border Inside Inside Inside Inside
This site has only one elementary school (located in Talang A). Other services such as a market and health center are located in the main street of Way Tenong, the sub-district center. A weekly market is held in Way-Tenong sub-district every Thursday.
Talang E is located farthest from the main road and closest to the natural forest. More
land is available in this Talang than in other Talang. The elevation is 1,100 m. Talang
E includes 7 sub-Talang. One Sub-Talang is the administrative center, with an
elementary school and a weekly market. The distance from the center Talang to the
main road is 12 km. The other 6 Talang are located around the center Talang with the
distance to the main road of between 15 and 37 km (Figure 5).

8
Figure 5. Sketch Map of Sidomakmur
4.1.1 Figure 6. Sketch Map of Talang E
Figure 6. Sketch Map of Talang E

9
5. Demography and Migration
No official population statistics are available for this site. However, Table 2 shows
demographic characteristics based on our extensive community survey. At present, the
total number of households is 697 and the total population is 2,599, consisting of 49%
male and 51% female. More than 60% of the population live in Talang E and Talang D,
where land is still relatively abundant and close to the natural forest. The population in
Talang A is also quite large (23% total). Talang A has housing, a school and public
services. The lowest population is in Talang B. Talang B, however, is very near to
Talang A. Therefore, many of Talang A people own coffee gardens in Talang B.
The education level of household heads is generally (more than 86%) below or equal to
6-year schooling. The education level in Talang A and E is slightly higher than in other
Talangs. Almost all households work in the agriculture sector, with most engaged in
growing coffee. We found that less than 13% of households worked in the non-
agriculture sector, such as trade, teaching, driving, house construction and others. The
ethnic majority (between 83%-91%) in Talang A, Talang B and Talang C are Javanese
and a small proportion of others are Sundanese and Semendo. On the other hand,
Talang D and Talang E live in an ethnically mixed community. The major ethic groups
are Semendo (18-38 %), Javanese (35-40%) and Sundanese (23-26%) (Table 3).
Table 2. Demography Characteristics
Population
% of HH who hold > 6 years schooling
% of HH working in
Talang
Number of House holds Male Female Total % Agricult
ural Non-Agricultural.
SiteS: Talang A Talang B Talang C Talang D Talang E
697 157 41 71 126 302
1,282 228 96 132 243 583
1,317 309 76 131 244 557
2,599 597 172 263 487 1,140
14 15 5 0 4 23
99 99 100 100 100 97
13 14 14 0 2 20

10
Table 3. Percentage of households by Ethnic
Ethnic (%) Talang Number of Households (HH) Javanese Sundanese Semendo Others
Site S: Talang A Talang B Talang C Talang D Talang E
697 157 41 71 126 302
58 87 83 91 35 40
16 4 8 4 26 23
17 6 10 4 38 18
9 3 0 0 1 29
Demographic trends in our study site are heavily influence by migration from Java.
They migrated to our study site because of difficult living conditions elsewhere and
when the pioneer from their family was successfully established through growing
coffee, the relatives or friends migrated to the area (See Box 1).
Table 4 shows the percentage of households by the year of their arrival in the village.
This table shows a relationship between year of arrival and distance traveled in
kilometers. A majority of migrants came to the nearest Talang in later years and came
to the farthest Talang in more recent years. This finding is consistent with the analytical
transect developed by group participatory meeting and the survey and determined the
distribution of coffee gardens by age of trees reported in the previous section. We also
found that the age of household heads in Talang D and E were relatively younger than
in others Talang (Table 5). This indicates that the migration occurred when the migrant
was young, generally below the age of 30 years.
Table 4. Percentage of households by the year of arrival time in the village
Year of the arrival time in the village Sites 5.1.1 Number of Households
70-80 81-85 86-90 91-95 >95
Site S: Talang A Talang B Talang C Talang D Talang E
697 157 41 71 126 302
17 49 15 17 3 6
10 6 44 24 10 4
27 17 15 30 43 27
27 18 10 23 35 32
19 10 17 7 9 31

11
Table 5. Percentage of households by Age of Households Head
Age of Household Head Sites Number of Households 20-30 31-40 41-50 51-60 > 60
Site S: Talang A- Talang B Talang C Talang D Talang E
697 157 41 71 126 302
36 28 27 39 42 39
41 48 49 34 39 38
14 9 20 16 13 16
8 13 2 11 6 6
1 3 2 0 0 1
5.1.1 Box 1. In-depth interview with Mr. W: A story of the successful
migrant.
Mr. W is an example of a successful spontaneous migrant in Talang A. He is 42 years old and married. He has one son and two daughters. He was born in Purwodadi, Central Java. In 1973, when he was 16 year old, he joined his parents who migrated to Way-Abung 2 in Central Lampung. Five months after they arrived in Lampung, his father passed away. The life of this family became very difficult and poor. They did not have any piece of land. Mr. W worked as agricultural labor. Before his father died, his father advised him that he should go to the forest to get a better life. In 1979, Mr. W came to Talang A. He said he only brought 1000 rupiah and ten-kg rice. He began his life work as coffee garden laborer. In 1981, he opened up about one ha of secondary forest. In the first year, he planted coffee inter-cropped with rice. He grew rice only one season. In 1982, he got married to a Javanese woman. One year later, Mr. W purchased one hectare of young coffee garden (3 year old). He paid with one ton of coffee. He said that his life became better because he had his own house and happy family. In 1985, he bought motorcycle. He also invited his relative from Way-Abung to come to Talang A. The relative worked as a laborer in his garden until finally the relative owned their land. In 1991, he purchased another one hectare of coffee garden (5 year old) for 2 million rupiah. In 1994, the price of coffee increased and reached 5,000 rupiah per kg. At that time, the production of coffee was also high. He made a lot of money. He invested his money in buying two ha of wet rice field and one ha of upland field in Way-Abung. I asked him why did you buy land in far areas from his home. He replied, profoundly, that we should be smart and wise, as an aphorism he said “ sedia payung sebelum hujan (preparing umbrella before raining)”. In other word, he realizes that because his coffee garden is located in the . It is possible that someday the government will remove all coffee gardens from the park. With the insecure tenure, he invested some money in a safer place. During the fire period in 1997, he acknowledged that fires only destroyed forest areas. Fire did not occur in his coffee garden or within its neighborhood. In 1998, while people much of Indonesia suffered because of the economic crisis, residents in Sekincau site, including Mr. W got gained from the increase in coffee prices. The coffee price at farm level during harvesting time in June to August 1998 was 13.3 to 15.8 thousand rupiah or an increase of around 4 times over the previous year. At that time, the production of coffee was also very high. There are many stories that farmers bough many expensive goods such as motorcycles, electronic goods and appliances. Mr. W was no exception for he bought a car.

12
6. History of the Study Site
For many year the Semendo people who migrated from South Sumatra have practiced
shifting cultivation in West Lampung. The Semendo people started migrating in 1876
and again between 1920 and 1930. Many villages in West Lampung were established by
the Semendo (Sevin 1989). The inheritance system of the Semendo people, whereby
land is inherited by the eldest daughter stimulated the other children to look for new
land elsewhere. It was customary for the Semendo people to open the forest using
slash-and-burn techniques. During the first two years after clearing, they planted upland
rice.
Coffee is intercropped with rice during the first year. Coffee is harvested from the third
to the seventh year. After seven years, they fallow the land and move to open up forest
in other areas. Besides the declining soil fertility, the main reasons they practiced
shifting cultivation (planting coffee and rice) was because they needed to plant rice to
fulfill their food consumption needs. The practice of shifting cultivation by Semendo
people in the study site at present, however, has now become a more permanent
agricultural system, due to increasing population and reduced land availability.
According to one old Semendo respondent who came to Sukananti village in 1938,
chiefs of the Semendo people allocated the areas in Talang A for growing only upland
rice using shifting cultivation. They did not allow the planting of coffee in this area.
They thought this area was appropriate for growing rice because it is flat, fertility is
high and it is close to houses. By 1977, however, the soil fertility had declined and they
left this area. Land cover in 1977 was largely Imperata sp dominated grassland in the
flat areas at low elevation, and bush and secondary forest in the middle elevation and
natural forest at the higher elevations (See Figure 7).
Mr. M, a Semendo person, who came to the Talang A in 1977, claimed this area
(Talang A and Talang B) under his authority. He was a very strong leader and
respected by all people in this area. He married a Javanese woman and welcomed
Javanese people to come and to build the community in this area.
Mr. M organized the land use of this area. The area in Talang A is allocated for housing

13
and public services. He divided the land into 1,250 square meter lots per household for
housing. Some Javanese came to this area and obtained the land for housing and for
agricultural production from Mr. M. They obtained 1,250 m2 land for housing by
paying Mr. M. Rp. 50,000. Mr. M would also permit them to use uncultivated land for
growing coffee. The price of the uncultivated land, however, depended on the kindness
of Mr. M. If they did not have money, they often worked as agricultural laborers for
Semendo people. Some of these people got land as wages for their work.
In 1983, the military village development program (ABRI masuk desa ) built an unsealed
road. The establishment of this road was very important in the development of this site,
since it made the area more attractive for new migrants. Along with on increase in the
price of coffee in 1985, the numbers of households and coffee garden in this site also
increased.
Although from 1982 to 1985, new migrants came to this area, there were also some
households who deported because of uncertainty over land tenure. Since 1982, the area
of register 46B was designated as part of Bukit Barisan Selatan National Park. There
was a rumor that the government would prohibit agriculture activities in this site.
Although land tenure security was uncertain, the high incentives for growing coffee
continued to attract people to the area and the forest inside the park was logged, burned
and planted with coffee. In 1994, the government paved the road. This was taken by
local people as evidence of increased land tenure security. By 1995, the number of
households in this site had increased.
Illegal logging using chainsaws has increased since 1995. It was reported by our
respondent that three rich residents own 25 chainsaws. The illegal logging activities are
supported illegally by the military, police and government officers. In 1997, fires
occurred in October destroying around 500 ha of natural forest (qualitative estimate by
farmers). The fires are reported to have started from Talang E and spread to the eastern
part. In 1999, farmers have continued to expand their coffee garden in the burned areas
and areas that had been illegally logged and burned.

14
Figure 7 Transect of Study Site

15
7. Fires and Causes of Fires
During the El Niño year of 1997, official figures state that fires in Lampung burned
21,311 ha of forest areas (kawasan hutan) (See Table 6). In terms of total area, the
largest fires occurred in the National Park, followed by the Production Forest and the
logged Protection Forest. In terms of proportion, however, the highest proportion of
burnt areas occurred in Production Forest (4.5 %), following by National Park (2.1%)
and Protection Forest (1.4 %). (Kanwil Kehutanan Lampung/Forest Administration for
Lampung). It is important to note that not all forest categories are covered by trees.
Therefore, we can hypothesize that not all fires occurred in forested areas, or destroyed
the forest cover.
Fires in 1997 commenced in April. From April to June, the total area of forest burned
was only around 1,000 ha in Lampung. The total forest area burned increased to 4,635
ha in August. The largest forest fires occurred in September and the forest area burned
reached 8,027 ha, double that of the previous month. In October, the area of forest land
burned declined to around 4,000 ha and by November was down to 2,500 ha.
According to Kepala Dinas Perkebunan-Lampung ( Chief of Plantation Administration
for Lampung), more fires occurred on forest area land than in plantation areas. Official
data until October 1997 shows that fire in plantation areas was only 4,644 ha (Table 7).
Fire particularly affected large-scale plantations (67%). On the other hand, fires only
damaged 25% of non-project smallholder plantations and 8% of project-smallholder
plantations. In large scale-plantations, fire destroyed oil palm plantation (41%) and
sugarcane plantation (40%). In non-project smallholder, fire occurred in sugarcane
(66%) and coffee (23%). While in smalholder projects, all fires took place in rubber
plantation.
In our study site, fire occurred in October 1997 and destroyed 100 ha of natural forest
(official data). Our respondents, however, estimated that forest fires actually burned
around 500 ha. This estimation is based on their observation and involvement in fire
fighting. During that time, people from around the park walked for 1.5 to 2 hours and
cut the vegetation along 3 km of the forest to form a fire break to reduce the spread of
the fire to smallholder gardens.

16
Fire first occurred in areas near Talang E and Talang D. Then, it spread to the eastern
part of Sekincau (Figure 5). Forestry officers blamed the fire on slash-and-burn
methods used for land clearing by farmers around the forest. The likelihood of fire fro m
land clearing by farmers escaping to forest during an El Niño year is high because the
areas of young coffee garden are located closed to the forest areas burned by fire. We
did not find any evidence that fires spread out to farmer’s garden. This suggest that
community base fire management systems are evident. The communal (adat) law has
applied a system involving penalties that are imposed on farmers who mismanage fire
and destroy to their neighbor’s field. On the other hand, there are no incentives for
farmers to control fire from spreading to natural forest. In fact, farmers gain from the
forest fire. They will more easily be able to establish coffee garden in the forest areas
after the fire.
Farmers, however, denied that their activity in land clearing was a cause of fire.
Farmers argued that they are very careful in managing fire. Most of our respondents
believed that the forest fires in our site occurred as result of accidents. They blamed the
activities of illegal loggers who make campfires and discard cigarette butts as the main
cause of the forest fires.
Farmers traditionally used fire in land clearing. We used data of distribution of coffee
areas by different age of trees in estimating area burned for land clearing purposed.
The burned areas in 1997-1998 covered 310 ha. Around 77% of the total land are
cleared areas in 1997-1998 was located in Talang E. This evidence suggests two
things. Firstly, it seems there is strong relationship between fires and deforestation in
this site. The establishment of coffee garden (using fire in land clearing) is very high in
the areas which natural forest are still relatively more abundant. Second, it is most
likely that fire spread from land clearing activities to natural forest because the location
of the burned forest areas are closed to young coffee gardens and the first source of fire
came from Talang E.
We can conclude that there are two types of fire in Sekincau: controlled and
uncontrolled fire. Controlled fires come from the activities of smallholder in land
clearing. Uncontrolled fires occurred in natural forest that could be come both from the
spread of fire from land clearing and from illegal logging activities.

17
Table 6. Forest Fires areas in Lampung Period 29 April to 21 November 1997
Forest Classification Total Areas (Ha) Forest Fire areas (Ha)
% of Forest Fire
National Park Protection Forest Production Forest Total
470,005 313,856 151,587 935,428
10,048 4,463 6,800 21,311
2.14 1.42 4.49 2.28
Note: Not all forest classification is covered by forest trees. Source: Kanwil Kehutanan Lampung (Forest Administration for Lampung)
Table 7. Fires on Plantation Areas in Lampung 1997
Type of Tree Plantation (% of fire areas) Fires Areas (Ha)
Oil Palm Sugarcane Coffee Rubber Others Small-scale plantation: Non-Project Smallhoder Project Smallholder Large-Scale Plantation Total
1,530 (33) 1,167 (25) 363 (8) 3,114 (67) 4,644
1 1 0 41 28
51 66 0 40 44
17 23 0 0 6
29 6 100 2 11
2 3 0 16 11
Analysis from Dinas Perkebunan Lampung Data
8. Deforestation
To better understand the relationship between fire and deforestation, this section
outlines the causes of deforestation in Lampung. According to the head of Dinas
Kehutanan Lampung (Forestry Administration), the total forest land area in Lampung is
1,083,749 ha or 32% of the entire areas of Lampung Province. The condition of the
forest, however, has been degraded in most areas and much of the forest land is without
forest cover. He noted that the destruction of forest reached 62 % in Protection Forest,
41 % in National Parks and 76 % in Production Forest (Koridor newspaper, edition
14/Th 1/1-7 July 1999).
The development of coffee gardens, along with the increasing migration and illegal
logging activities are the main causes of deforestation in the National Park, in the study
site. We define the term deforestation as the situation where natural forest cover has

18
been converted to another land use classification3. The farmers in our site argue that
they do not directly open the natural forest for growing coffee. Most of them cultivated
the bushy land or Imperata sp grassland or secondary forest that had already been
cultivated under a shifting cultivation system by the indigenous Semendo people. In
more recent years, however, non-Semendo people also developed coffee gardens by
direct conversion of natural forest. There is a tendency, however, for farmers who
opened natural forest to shift the responsibility to Semendo people. The second source
of the coffee land are areas of forest previously of illegal logged illegally. Recently,
they also cultivated in the areas of burned natural forest. They argue that this land is
empty land or bushy land and it is not natural forest anymore. Therefore, they cultivate
that land for coffee. Whatever the justification, in fact most of the natural forest within
the National Park has already been logged and converted to coffee gardens and the rate
of deforestation in this site is very high (Figure 8).
Figure 8 Mosaic of coffee garden and new opened land
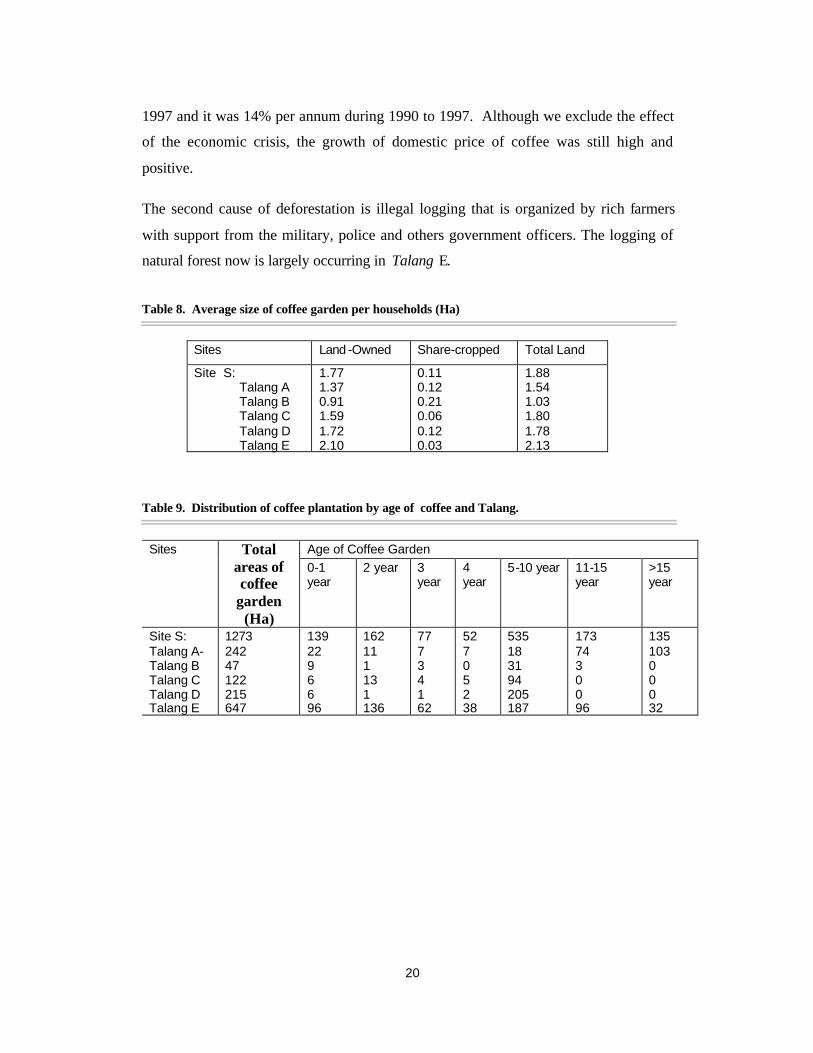
Based on extensive a community survey, we found that the mean area of ownership of
coffee gardens per household is 1.77 ha and the mean ownership and cultivated area or
coffee gardens per household is 1.88 ha (See Table 8). The mean ownership and
cultivated area of coffee gardens per households in Talang E is higher than in others
3 Sunderlin and Resosudarmo (1996) suggested to use the term of deforestation that is proposed by FAO (1996). Deforestation define as a land use changed from natural forest to others land use classification.

19
Talang. This indicates that land in Talang E is more abundant than land in others
Talang.
The distribution of the areas of coffee garden is shown in Table 9. The total area of
coffee garden (1,273 ha), owned by farmers is Talang A (19%), Talang B (4%), Talang
C (9%), Talang D (17%) and Talang E (51%). The age of coffee garden on the site is
relatively young. 75% of the total coffee gardens have ages below 10 years and only
11% of coffee areas are more than 15 years old. The oldest coffee gardens are located
largely in Talang A and the youngest coffee gardens are located largely in Talang E.
Coffee gardens between the ages 5 and 10 years are located largely in Talang B, C and
D. This evidence suggest that the oldest coffee gardens are mostly located in the
Talang that are nearest to main road and youngest coffee garden mostly located in the
Talangs that are farthest to main road. This result is expected, because it is more costly
and, so less profitable to cultivate plots furthered from the market, as argued by
Angelsen (1996). Moreover, the effect of distance to main road in our study seems
consistent with the finding of Chomitz and Gray (1994). Using Belize data, Chomitz
and Gray found a significant positive effect of development of rural road on
deforestation.
In 1998-99, the area of new coffee gardens developed was 139 ha. Most of the
plantings were located in areas that were burned in the previous year. It should be noted
that most of these former burned areas were claimed by farmers. If farmers slash the
border of the areas and plant “andong” trees as a border sign, then the local societies
recognize their use rights to this land. Farmers have already claimed much of the
previously burned land. Accurate data, however, are difficult to obtain since this area is
clearly located in the National Park, and the state does not recognize these informal
claims.
Profitability of coffee attracts people to establish coffee garden. The real domestic price
of coffee fluctuated during 1977 to 1998 (Table 10). It is estimated, however, during
that period the real domestic price of coffee increased by 11% per annum. During 1990
to 1998 (more recent years), the real domestic price of coffee increased by 25% per
annum. To avoid the effect of economic crisis, we exclude the year 1998 in our
estimation. The growth of real domestic coffee price was 6% per annum during 1977 to
20
1997 and it was 14% per annum during 1990 to 1997. Although we exclude the effect
of the economic crisis, the growth of domestic price of coffee was still high and
positive.
The second cause of deforestation is illegal logging that is organized by rich farmers
with support from the military, police and others government officers. The logging of
natural forest now is largely occurring in Talang E.
Table 8. Average size of coffee garden per households (Ha)
Sites Land -Owned Share-cropped Total Land
Site S: Talang A Talang B Talang C Talang D Talang E
1.77 1.37 0.91 1.59 1.72 2.10
0.11 0.12 0.21 0.06 0.12 0.03
1.88 1.54 1.03 1.80 1.78 2.13
Table 9. Distribution of coffee plantation by age of coffee and Talang.
Age of Coffee Garden Sites Total areas of coffee
garden (Ha)
0-1 year
2 year 3 year
4 year
5-10 year 11-15 year
>15 year
Site S: Talang A- Talang B Talang C Talang D Talang E
1273 242 47 122 215 647
139 22 9 6 6 96
162 11 1 13 1 136
77 7 3 4 1 62
52 7 0 5 2 38
535 18 31 94 205 187
173 74 3 0 0 96
135 103 0 0 0 32

21
Table 10. Coffee bean price at farm gate in Lampung
Coffee price Year Consumer Price Index 1998=100
Nominal real
% change
1977 10,39 1.210 11.646
1978 11,23 725 6.455 -45
1979 13,06 1.164 8.915 38
1980 15,41 1.100 7.139 -20
1981 17,30 585 3.381 -53
1982 18,92 558 2.949 -13
1983 21,17 905 4.276 45
1984 23,38 1.051 4.496 5
1985 24,50 1.198 4.890 9
1986 25,90 2.706 10.446 114
1987 28,33 2.119 7.481 -28
1988 30,61 1.643 5.368 -28
1989 32,57 1.435 4.406 -18
1990 35,10 1.400 3.989 -9
1991 38,40 1.397 3.638 -9
1992 41,31 1.333 3.227 -11
1993 45,28 1.522 3.361 4
1994 49,14 4.225 8.598 156
1995 53,77 4.360 8.108 -6
1996 58,09 2.275 3.916 -52
1997 61,93 3.276 5.290 35
1998 100,00 11.410 11.410 116
1977-1998 11
1977-1997 6
1990-1998 25
Average annual growth
1990-1997 14
Source: Dinas Perkebunan-Lampung Barat) (1999) (Plantation Administration for West Lampung Distric)

22
9. Land Tenure
The land tenure security in this site is weak because most of the coffee gardens are
located inside the National Park. The settlers realize that their land could be taken back
by government at any time. Inspection of this area by park officers, is very weak. It is a
public secret that the illegal logger or farmer who c lears forest can collude with the park
officers, avoiding official sanctions for these illegal activities. According to the Head of
Lampung's Forestry Unit, coffee farmers have paid about 20% of coffee production to
certain officials from various government offices, including officials from the provincial
forestry unit (Observer, 16 Aug 1999) in order to enable their activities to continue.
In fact, private land tenure in the park is gradually becoming more secure. Farmers feel
that the government will not take their land because of the development of their
community including the development of roads and other public services. The feeling
of the security of land tenure has increased since the reformation period (mid -1998 to
the present) in Indonesia.
Although none of this informally held “private” land has a government title, local
society recognizes the land rights of local populations. Transferring of land rights
through informal sale of land and share cropping are commonly practiced. The value of
the land has been increasing sharply. In 1985, the price of 1,250 m2 of land for housing
was only Rp.50,000. The price of this type of land increased to 2 million rupiah in
1995 and 5 million in 1999. Similar to this, the uncultivated land price in 1985 was Rp.
250,000 per hectare. The price of this type of land has increased to Rp.500,000 in 1995
and 1 million rupiah in 1999. This evidence indicates that people have confidence that
security of land tenure has increased on this site.
Tenancy under sharecropping of coffee gardens is also commonly practiced. A new
young migrant initially works as a tenant under a share tenancy system. Under this
system, all output and input is shared equally between informal property owner and
tenant.
Although security of land tenure has been increasing, it is still not fully secure, creating
conditions for extraction of profit from the West Lampung coffee fields and around

23
Bukit Barisan National Park, for reinvestment elsewhere. We found evidence that
farmers who got surplus from coffee cultivation invested their money outside the
village. Some of them bought rice fields in Central Lampung, bought palm oil fields in
Pesisir Lampung Selatan and built houses in Java.
10. Conclusion
Fires in 1997/1998 in Sekincau site can be categorized as controlled fires and wild
(accidental) fires. Controlled fires came from the activity of land clearing for the
establishment of coffee gardens by smallholders. The underlying causes of fire in
Sekincau relate to deforestation, migration, and land tenure. There are two sources of
deforestation: establishment of coffee gardens by smallholders and illegal logging
activities. The establishment of coffee garden greatly increased with the increase in
migration and profitability of coffee production. The feeling of the security of informal
land tenure in the park has increased in recent years, thus attracting more migration to
the site. Approximately half of the migrants are temporary migrants who extract profit
from the coffee fields inside Bukit Barisan National Park.
During drought period, such as El Niño, fire from land clearing and illegal-logging
activities easily spreads to natural forest and become uncontrolled forest fires. The
amount of land burned and impacts of uncontrolled fires are much greater than
controlled fires started by smallholders.
11. Acknowledgments
This research was supported by USFS. We thank Erlina Rusli, Fauzia and Joko from
local NGO for their excellent field work assistance. We would like to thank Grahame
Applegate, Ronna Dennis and Judith Meyer for providing insightful comment and
edited the manuscript. We also like to thank Thomas Tomich and Bruno Verbist for
helpful comments. The usual disclaimer applies.

24
12. References
Angelsen, A. 1996. “Deforestation: Population or Market Driven? Different Approaches in Modeling of Agricultural Expansion.” Paper presented at the CIFOR and UNU/WIDER workshop on Theories and Modeling of Tropical Deforestation, Bogor, Indonesia, 20-23 January
BAPPENAS/ADB Report. 1999. “Causes, Extent and Cost of the 1997/98 Fires in Indonesia: Summary of Phase 1.” Asian Development Bank TA 2999-INO July 98-March 1999.
Chomitz, K.M and D.A. Gray. 1994. Road, Land, Markets and Deforestation: A Spatial Model of Land Use in Belize. Mimeo, The World Bank.
Dennis, R,. 1999. A Review of Fires Projects in Indonesia (1982-1998). Center for International Forestry Research.
FAO. 1996. “Forest Resources Assessment 1990: Survey of Tropical Forest Cover and Study of Change Processes.” FAO Forestry Paper 130. Food and Agriculture Organization of the United Nations, Rome.
Fraser, A.I. 1998. “Social, Economic and Political Aspects of Forest Clearance and Land-Use Planning in Indonesia.” In Human Activities and The Tropical Rainforest, B.K. Malonoey (eds.). Netherlands: Kluwer Academic Publisher.
Gintings, A.N., M. Sirait, S.Budidarsono, S. Abdoellah., Y. Mogea, Mulyono, I. Tjitrajaya, B. Riyanto and Amrulah.. 1999. Laporan Penelitian Budidaya Tanaman Kopi di dalam Kawasan Hutan dan Pengaruhnya Terhadap Fungsi Hutan di Propinsi Daerah Tingkat I Lampung. Departemen Kehutanan dan Perkebunan.
RePPProT. 1988. Regional and Physical Planning for Transmigration (RePPProT). London and Jakarta, Land Resources Department ODNRI, Overseas Development Administrator & Departemen Transmigrasi
Sevin, O. 1989. “History and Population”. In: Pain, M. (eds). Transmigration and Spontaneous Migration in Indonesia: Propinsi Lampung. Orstom-Departemen Transmigrasi.
Sunderlin. W.D. and I.A.P Resosudarmo. 1996. “Rates and Causes of Deforestation in Indonesia: Towards a Resolution of the Ambiguities.” Occasional Paper no. 9. Bogor, Indonesia: Center for International Forestry Research.
Tomich, T.P., AM. Fagi, H de Foresta, G Michion, D Murdiyarso, F Stolle and M van Noorwijk. 1998. Indonesia’s Fires: Smoke as a Problem, Smoke as a Symptom. Agroforestry Today, 10 (1): 4 - 7.