finra 2014 year in review and annual financial report · finra 2014 year in review and annual...
TRANSCRIPT

FINRA 2014 Year in Review and Annual Financial Report

1 Letter from the Chairman and Chief Executive Officer
13 Table of Contents

FINRA2014YearinReviewandAnnualFinancialReport 1
Transforming Regulation
In 2014, FINRA celebrated 75 years of regulating the U.S. securities markets. While our mission to protect investors and keep the markets fair has remained the same throughout the years, we continue to seek and embrace innovative methods that help us meet our mandate.
Whileourmissiontoprotectinvestorsandkeepthemarketsfairhasremainedthesamethroughouttheyears,wecontinuetoseekandembraceinnovativemethodsthathelpusmeetourmandate.
Today, FINRA is continuing to transform regulation through technology, and is enhancing our regulatory approach with a greater emphasis on data collection and analysis. Our goal is to implement effective technology solutions that support our oversight programs to protect investors and maintain market integrity. Specifically, FINRA is applying technology to sharpen the focus of our firm examinations and surveillance, and promote more holistic and effective market surveillance while opening up markets to greater transparency. In 2014, FINRA took significant steps that furthered our goals in each of these areas.
Sharpening the Focus of Our Examinations
In my letter to you last year, I described our technology investments to build sophisticated surveillance systems and process large amounts of data. Since then, we have made significant strides to further transform our regulatory program to be more risk-based and data-driven.
For example, last year we enhanced our examination platform and refreshed the technology to provide greater efficiency in our firm oversight. In the fall of 2014, following the rollout of this new platform, we asked firms for their perceptions of the new process. Firms noted significant improvements in the efficiency and effectiveness of FINRA examinations. They noted improved communications between FINRA and their firms, and also told us that their cycle exams were more efficient, more likely to focus on risks that were most meaningful to firms of their size and the duration of the on-site visit shorter.
FROM THE CHAIRMAN AND CEO
Richard G. KetchumChairmanandChiefExecutiveOfficer

2 FINRA2014YearinReviewandAnnualFinancialReport
In consultation with the industry, we are working to further enhance our capability to use data and analytics to better understand trends and product concentrations that are potentially harmful to investors, as well as suspicious activities that we might not identify through our current examination programs. To support these efforts, early this year, we created the Office of Advanced Data Analytics to improve how we parse and act on the data we currently gather from firms. Working closely with departments across FINRA, the office will define opportunities to use the data we gather, while increasing our regulatory efficiency.
Weareworkingtofurtherenhanceourcapabilitytousedataandanalyticstobetterunderstandtrendsandproductconcentrationsthatarepotentiallyharmfultoinvestors.
In addition to these technology initiatives, we have enhanced our examination program through increased focus on emerging issues, especially in areas where there are no current rule requirements. As a result, we have published additional guidance on effective industry practices that promote better investor protection and that firms can use to bolster controls and compliance procedures.
For example, last year we launched a targeted exam to explore cybersecurity, and in February of this year, we published a report to highlight effective practices that firms should consider to strengthen their cybersecurity programs. Given the increasing frequency and sophistication of cyberattacks, we will continue to assess the adequacy of firms’ cybersecurity programs.
We followed the publication of the cybersecurity report with the release of a study on senior investors. The National Senior Investor Initiative Report, published jointly with the Securities and Exchange Commission (SEC) in March 2015, includes observations and practices identified in examinations that focused on how firms conduct business with senior investors. Our goal in publishing the report is to help broker-dealers assess, develop, and refine their policies and procedures for investors preparing for, and entering, retirement. In addition, in April 2015, FINRA launched a securities helpline for senior investors—a toll-free number where seniors can get assistance from FINRA on concerns with brokerage accounts and investments.
In 2014, we also completed a number of examinations focused on liquidity risk management practices; and, this year, we expect to provide additional guidance to firms highlighting effective practices to manage funding and liquidity in times of market stress. Where appropriate, we plan to continue publishing studies and reports to promote effective industry practices, without necessarily moving forward with additional rulemaking.

FINRA2014YearinReviewandAnnualFinancialReport 3
Promoting Unified and Effective Surveillance of the Markets
We continued to enhance the technology that powers our market surveillance program. Specifically, we implemented cloud computing solutions to improve data storage and operating efficiencies for our Order Audit Trail System (OATSTM) and other market surveillance systems. Cloud solutions offer significant financial and operational benefits, such as allowing our analysts to more quickly analyze the vast amounts of market data that FINRA collects each day.
Lastyear,wealsosignificantlyincreasedourcross-marketsurveillancecapabilitiesbystrengtheningourabilitytotracktradingacrossmarketsandproducts.
Last year, we also significantly increased our cross-market surveillance capabilities by strengthening our ability to track trading across markets and products. In December, we signed an agreement with the Chicago Board Options Exchange (CBOE) to provide market surveillance, financial surveillance, examination, investigation, enforcement and other services to the CBOE and C2, the CBOE’s fully electronic options exchange. As part of this agreement, the Options Regulatory Surveillance Authority (ORSA) also became part of FINRA’s Insider Trading Surveillance program.
Cross-market options surveillance
Cross-market surveillance of U.S.-listed
equities markets
75%
25%
99%
FINRA Coverage
Surveillance of the Markets

4 FINRA2014YearinReviewandAnnualFinancialReport
With this agreement, along with an expansion of the services we provide to the International Securities Exchange to include cross-market options surveillance, FINRA now conducts cross-market options surveillance for approximately 75 percent of the options market. In addition, FINRA is now conducting insider trading surveillance for all listed equities and options in the United States.
In addition, we reached a significant milestone in our cross-market equity surveillance program. We completed the integration of the two equity exchanges operated by BATS Global Markets, Inc. into our cross-market equity surveillance program in November 2014. As a result, the program covers 99 percent of the listed equities markets. Every day, FINRA analyzes more than 30 billion market events. Our surveillance program includes a suite of 29 cross-market surveillance patterns that address more than 50 threat scenarios, including layering, spoofing, marking the close, wash sales, and other manipulative and distortive conduct.
Together, the expansion of our surveillance programs across different markets and securities significantly increases our ability to identify instances where a market participant engages in potentially abusive conduct on multiple markets in an attempt to avoid detection. Our cross-market surveillance patterns allow us to track orders from their inception, as they move through markets and are either cancelled, replaced or executed. This is particularly important since some market participants are increasingly dispersing their activity across trading venues in an effort to mask improper trading schemes. More than
50 percent of our trading alerts involve conduct occurring on more than one market, and more than 45 percent of our cross-market alerts involve two or more market participants.
Theexpansionofoursurveillanceprogramsacrossdifferentmarketsandsecuritiessignificantlyincreasesourabilitytoidentifyinstanceswhereamarketparticipantengagesinpotentiallyabusiveconductonmultiplemarketsinanattempttoavoiddetection.
The technology behind this increasingly overarching surveillance allows us to be aggressive about finding improper conduct, such as manipulative activity. Last year, FINRA successfully brought a manipulation case on behalf of our options exchange clients against a firm and an individual for executing bursts of equity trades that artificially moved the options market. Specifically, the trader bought and sold equities to manipulate the prices of the overlying options, which allowed the firm and trader to purchase or sell the options at more favorable prices. FINRA also found that the firm, and the supervisor, failed to establish, maintain and enforce supervisory procedures designed to detect the manipulative activity. This case represents a landmark in efforts to discipline cross-product manipulations.

FINRA2014YearinReviewandAnnualFinancialReport 5
Enhancing the Integrity and Transparency of the Markets
Working in partnership with the SEC, FINRA took steps in 2014 to address concerns about market structure and help strengthen the integrity of our markets.
WorkinginpartnershipwiththeSEC,FINRAtookstepsin2014toaddressconcernsaboutmarketstructureandhelpstrengthentheintegrityofourmarkets.
In June, FINRA began publishing reports of alternative trading systems (ATS) volume on a stock-by-stock basis, giving the public an opportunity to see the total shares traded each week by security in each ATS, or “dark pool.” Providing a clear view of the level of trading activity on ATSs increases market transparency, thereby enhancing investor confidence.
We also proposed additional steps to improve FINRA’s oversight of algorithmic trading activity. In the area of equity trading, we focused our rulemaking efforts on automated trading activities, including high frequency trading (HFT), with three primary objectives: to enhance our ability to monitor automated trading, including the type and quality of information and data FINRA receives; to provide market participants and investors more transparency into trading activities; and to ensure that firms engaged in automated trading activities and their employees are properly trained, educated and accountable for their activities.
3,500employeesdedicatedtomarketintegrityandinvestoreducation
17officesacrosstheU.S.
Morethan700fraudcasesreferredforprosecutionin2014
30 billiononaverage—andupto50billion—transactionsprocessedeveryday
FINRAusesitstechnologytolookatnearly
99 percent oftradinginU.S.equitiesmarkets.
636,707brokersunderFINRA’ssupervision
FINRA BY THE NUMBERS

6 FINRA2014YearinReviewandAnnualFinancialReport
FINRA’s proposals call for ATSs to provide more in-depth quoting information for regulatory surveillance; tighter restrictions around allowable clock drift to better ensure proper sequencing of events; greater transparency of volume executed away from stock exchanges; registration requirements for persons involved in the design, development and significant modification of trading algorithms; and more granular audit trail information.
Given the risks that arise when firms use poorly programmed algorithmic trading strategies, FINRA thinks it is appropriate to require associated persons primarily responsible for the design, development or significant modification of algorithmic trading strategies, or those supervising or directing such activities, to meet the same minimum competency standards for knowledge of securities regulations that individual traders must meet. In March of 2015, we published a Regulatory Notice seeking comment on a proposal to establish a registration requirement for these individuals. We also published another Regulatory Notice in March 2015 reminding firms of their existing supervisory obligations with regard to the development and deployment of algorithmic trading strategies.
In addition to the equity market initiatives, FINRA’s Board approved proposals to enhance transparency and execution quality in the fixed income markets. We proposed a rule to require that additional pricing information be provided to customers on their trade confirmations in corporate and agency debt securities. Putting additional pricing information in the hands of customers will better enable them to evaluate the cost and quality of the services
firms provide and encourage communications between firms and their customers about their fixed income transactions.
To inform FINRA’s regulation of and strengthen our ability to conduct surveillance of fixed income trading, FINRA also proposed requiring ATSs to report to FINRA quotation information for corporate and agency debt securities. This rule proposal would be a first step toward providing FINRA with better insight into the scope and accessibility of pre-trade transparency in the fixed income markets.
Enforcing the Rules
FINRA remains committed to ensuring that investors have confidence in the market. Taking swift enforcement action when we find wrongdoing and seeking restitution for harmed investors are two examples of how we are working to build and maintain investor confidence. In 2014, FINRA brought 1,397 disciplinary actions against registered individuals and firms, and levied $132.6 million in fines. We expelled 18 firms from the securities industry, suspended five firms and 705 registered persons, and barred 481 registered persons from associating with FINRA-regulated firms. In addition, we ordered $32.3 million in restitution to harmed investors.
Often, conflicts of interest are a contributing factor to many FINRA enforcement actions. For example, in December 2014, FINRA sanctioned 10 firms for allowing their equity research analysts to solicit investment banking business and for offering favorable research coverage in connection with a planned initial

FINRA2014YearinReviewandAnnualFinancialReport 7
public offering. The settlement is evidence of our commitment to policing the boundaries between research and investment banking to ensure that research is not improperly influenced for the sake of generating capital-markets business.
Takingswiftenforcementactionwhenwefindwrongdoingandseekingrestitutionforharmedinvestorsaretwoexamplesofhowweareworkingtobuildandmaintaininvestorconfidence.
In a separate case, we sanctioned a firm $15 million for failing to adequately supervise communications between its equity research analysts and its clients and its sales and trading staff, and for permitting one of its analysts to participate indirectly in two road shows promoting IPOs to investors.
In addition to the disciplinary actions FINRA takes against firms we oversee, we also refer cases that fall outside our jurisdiction to the SEC or other regulators or law enforcement agencies. In 2014, FINRA’s Office of Fraud Detection and Market Intelligence (OFDMI) referred more than 700 matters involving potential fraudulent conduct—including insider trading, pump-and-dump schemes and Ponzi schemes—to the SEC and other federal or state law enforcement agencies. For example, in February 2014, the SEC charged a senior managing director at a New York-based investment banking firm with improperly using material nonpublic information he obtained through his work to place trades in online brokerage accounts of his father and a friend. In total, the insider trading scheme generated more than $950,000 in illicit profits. Parallel criminal securities fraud charges were filed to which the investment banker pled guilty in April 2014. He is currently serving a 30-month prison sentence. The SEC and criminal cases stemmed, in part, from a referral to the SEC by OFDMI.
Enhancing the Effectiveness and Efficiency of Our Rules
We continue to assess our rules to strengthen them where appropriate. In April 2014, we initiated the retrospective rule review process by issuing two Regulatory Notices requesting comment on FINRA’s communications with the public rules, and the gifts, gratuities and non-cash compensation rules. In addition to the viewpoints we received during the comment process and through subsequent interviews with subject-matter experts, FINRA collected additional information about firms’ experiences with the two rule sets through anonymous surveys.
In December 2014, FINRA staff published reports describing what they have learned about these rules in the course of the feedback and comment process. The reports recommend that FINRA explore a combination of updated guidance and rule modifications and administrative measures to enhance the rules. This year, we plan to take steps to address the recommendations. For example, in May 2015, we proposed revisions to the filing requirements pertaining to retail communications and to refine the scope of disclosures required.
In March of this year, we launched a review of the membership rules, including the new member and continuing member application processes (MAP rules). We believe the complex MAP rules may benefit from a comprehensive assessment.
Transparency Initiatives
FINRA continuously works to improve the accuracy and totality of information that investors receive. For example, with respect to BrokerCheck®, we proposed—and the SEC approved—a rule change to require background checks on applicants for registration, including first-time applications as well as transfers. This change will enhance the accuracy and completeness of the information contained in an applicant’s Form U4—and ultimately the accuracy of information in FINRA’s Central Registration Depository (CRD®), from which the information in BrokerCheck is derived.
8 FINRA2014YearinReviewandAnnualFinancialReport
In addition, FINRA began a search of available public records for financial disclosures that may not have been reported, and for criminal disclosures that may not have been reported by registered individuals who have not been fingerprinted within the last five years. We expect to conclude this process by this summer. Once these searches are completed, FINRA will conduct periodic reviews of public records to ascertain the accuracy and completeness of the information available to investors, regulators and firms.
FINRA also expanded public access to transaction information on fixed income securities reported to our Trade Reporting and Compliance Engine® (TRACE®) system, which captures real-time transaction data for eligible fixed income securities. In June 2014, we began disseminating Rule 144A transactions in TRACE-eligible securities for those asset types currently subject to dissemination; and in June 2015, we began real-time dissemination of transactions in asset-backed securities.
Continuing to shed light on opaque areas of the fixed income market remains a top priority for us, and we have proposed expanding the dissemination of additional categories of fixed income products. In December 2014, the Board approved a proposal to amend TRACE rules to provide for public dissemination of transaction information in additional securitized products. Earlier this year, we proposed a further expansion of the list of securitized products that are subject to public trade dissemination to include all remaining types of securitized products: collateralized mortgage obligations, commercial mortgage-backed securities and collateralized debt obligations.
Investor Education Initiatives
FINRA is committed to ensuring that investors have the knowledge and resources to capably navigate markets and make informed choices regarding firms, brokers and products. In February 2015, FINRA’s Board agreed to direct a portion of enforcement fines collected in 2014 to the FINRA Investor Education Foundation, approving a $50 million contribution that will provide continuing support for the Foundation’s innovative research and education efforts. In 2015, the Foundation successfully completed the spend-down of the $55 million it received through the Global Research Analyst Settlement as required by the 2005 District Court overseeing the settlement.
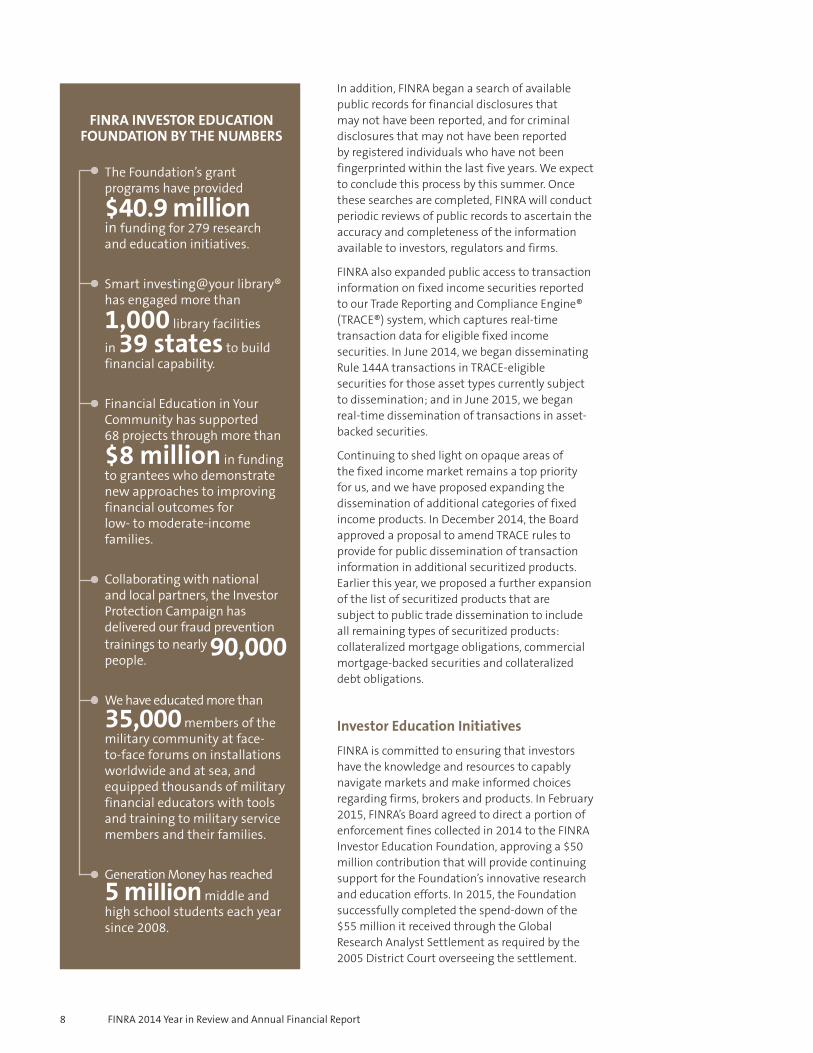
TheFoundation’sgrantprogramshaveprovided
$40.9 millioninfundingfor279researchandeducationinitiatives.
Smartinvesting@yourlibrary®hasengagedmorethan
1,000libraryfacilities
in39 statestobuildfinancialcapability.
FinancialEducationinYourCommunityhassupported68projectsthroughmorethan
$8 millioninfundingtogranteeswhodemonstratenewapproachestoimprovingfinancialoutcomesforlow-tomoderate-incomefamilies.
Collaboratingwithnationalandlocalpartners,theInvestorProtectionCampaignhasdeliveredourfraudpreventiontrainingstonearly90,000 people.
Wehaveeducatedmorethan
35,000membersofthemilitarycommunityatface-to-faceforumsoninstallationsworldwideandatsea,andequippedthousandsofmilitaryfinancialeducatorswithtoolsandtrainingtomilitaryservicemembersandtheirfamilies.
GenerationMoneyhasreached
5 million middleandhighschoolstudentseachyearsince2008.
FINRA INVESTOR EDUCATION FOUNDATION BY THE NUMBERS

FINRA2014YearinReviewandAnnualFinancialReport 9
Richard G. KetchumChairmanandChiefExecutiveOfficer
Throughout 2014, the Foundation expanded its distribution of innovative financial education material, including a new documentary for public television. In October 2014, the Foundation’s hour-long documentary—Thinking Money: The Psychology Behind Our Best and Worst Financial Decisions—was released to public television stations nationwide. Through December 31, the program achieved 184 airings on public television stations in 66 television markets, including seven of the nation’s top 10 media markets. The documentary focuses on pitfalls in consumer financial decision-making and offers practical takeaways for overcoming these pitfalls.
The Foundation also launched a workplace financial education training program, Financial Capability@Work, and in October 2014, sponsored the first training program in Burlington, Vermont. The program was hosted in partnership with the United Way of Chittenden County, one of the Foundation’s most innovative and successful grantees focusing on workplace financial education. The training experience was designed to empower nonprofit leaders to establish similar workplace financial education programs.
Financials
Financially, 2014 was a strong year for FINRA due primarily to an increase in revenue and our continued efforts to control costs. In light of FINRA’s strong operating revenue for 2014, FINRA distributed a $20 million discretionary rebate to firms, and for the second consecutive year, all active firms in good standing received a $1,200 rebate to offset their minimum Gross Income Assessment fee. Firms also received a rebate based on their prorated share of regulatory fees paid into FINRA, including the Gross Income Assessment, Branch Office Assessment, Trading Activity Fee and Personnel Assessment.
Examples of our efforts to control costs include lowering compensation expense as a result of FINRA’s 2013 Voluntary Retirement Program, while keeping occupancy and general and administrative expenses relatively flat year over year. A more detailed view of our 2014 financials can be found on the following pages.
Looking Ahead
For more than 75 years, FINRA has been vigilant in our oversight of the U.S. securities markets, and we are committed to maintaining our legacy as an effective and efficient regulator. We recognize that continuing to invest in leading-edge regulatory technology and data analysis capabilities is essential to our success. We are excited about the opportunity to transform the way we regulate the securities industry, and protect investors and uphold the integrity of U.S. capital markets.

10 FINRA2014YearinReviewandAnnualFinancialReport
01Susan Wolburgh JenahFormer President and CEOInvestment Industry RegulatoryOrganization of CanadaToronto, ON
02Kevin CarrenoInternational Assets Advisory, LLCOrlando, FL
03Joshua S. LevineRetiredNew York, NY
04Gregory J. FlemingMorgan Stanley Smith BarneyPurchase, NY
05W. Dennis FergusonCapital Investment GroupBoca Raton, FL
06Joel SeligmanUniversity of RochesterRochester, NY
07Robert W. ScullyRetiredNew York, NY
08William H. HeymanThe Travelers Companies, Inc.Saint Paul, MN
09John J. BrennanThe Vanguard Group, Inc.Malvern, PA
10Shelly LazarusOgilvy & MatherNew York, NY
11Carol Anthony (John) DavidsonRetiredPrinceton, NJ
12ChairmanRichard G. KetchumChief Executive OfficerFINRAWashington, DC
01
02 03
04
05 06
07
08
09
10
11
12
FINRA’S 2014 BOARD OF GOVERNORS

FINRA2014YearinReviewandAnnualFinancialReport 11
13Richard S. PechterRetiredNew York, NY
14Elisse B. WalterRetiredBethesda, MD
15Luis M. ViceiraHarvard Business SchoolBoston, MA
16John W. SchmidlinRetiredNew York, NY
17Brigitte C. MadrianHarvard Kennedy School of GovernmentCambridge, MA
18Mark CresapCresap, Inc.Radnor, PA
19Seth H. WaughDeutsche Bank AmericasNew York, NY
20Leslie SeidmanFormer ChairmanFinancial Accounting Standards BoardWestport, CT
21James D. WeddleEdward JonesSt. Louis, MO
22Robert KeenanSt. Bernard Financial ServicesRussellville, AR
23Mark S. CasadyLPL FinancialBoston, MA
13
14
16
15
1718
20
19 2122
23

12 FINRA2014YearinReviewandAnnualFinancialReport
Photo Index
1 Jonathan S. Sokobin, Chief Economist and Senior Vice President; Richard G. Ketchum, Chairman and Chief Executive Officer; Todd T. Diganci, Executive Vice President and Chief Financial Officer
2 Susan F. Axelrod, Executive Vice President, Regulatory Operations; Robert L.D. Colby, Chief Legal Officer
3 Marcia E. Asquith, Senior Vice President and Corporate Secretary; Thomas Gira, Executive Vice President, Market Regulation; Gregory Ahern, Executive Vice President, Corporate Communications and Government Relations; Tracy Johnson, Senior Vice President, Human Resources
4 Carlo V. di Florio, Chief Risk Officer & Head of Strategy; Thomas Gira, Executive Vice President, Market Regulation; Derek W. Linden, Executive Vice President, Registration and Disclosure; Jonathan S. Sokobin, Chief Economist and Senior Vice President; Duer Meehan, Vice President, Office of Market Regulation
5 Steve A. Joachim, Executive Vice President, Transparency Services
6 Susan F. Axelrod, Executive Vice President, Regulatory Operations; Robert L.D. Colby, Chief Legal Officer
© Martin H. Simon, 2015

ˆ200Gkw!qakG&5rRW†Š 200Gkw!qakG&5rRW
927550 FIN 13FINRAANNUAL REPORT
29-Jun-2015 13:46 ESTCLN PSWDC
RR Donnelley ProFile SER ausbt0cm 23*PMT 1C
NC8600AM01280311.6.19
Contents
Management Report on Financial Operations 14
Management Report on Internal Control Over Financial Reporting 24
Audit Committee Report 25
Investment Committee Report 27
Management Compensation Committee Report 29
Report of Independent Registered Public Accounting Firm on Internal Control Over Financial Reporting 33
Report of Independent Registered Public Accounting Firm 34
FINRA 2014 Consolidated Financial Statements:
Consolidated Balance Sheets 35
Consolidated Statements of Operations 37
Consolidated Statements of Comprehensive Income (Loss) 38
Consolidated Statements of Changes in Equity 39
Consolidated Statements of Cash Flows 40
Notes to Consolidated Financial Statements 42
FINRA Board of Governors 66
FINRA Officers 66
FINRA Corporate Offices 67
FINRA District Offices 67
FINRA Market Regulation Regional Offices 68
FINRA Dispute Resolution Regional Offices 68
FINRA 2014 Year in Review and Annual Financial Report 13

ˆ200Gkw!qaj@zinDW~Š 200Gkw!qaj@zinDW~
927550 FIN 14FINRAANNUAL REPORT
25-Jun-2015 10:35 ESTCLN PSWDC
RR Donnelley ProFile SER pf_rend 20*PMT 1C
SERP64RS1611.6.19
Management Report on Financial Operations
OVERVIEW
The Financial Industry Regulatory Authority, Inc.® (FINRA®) is the largest independent regulator of securities firms doingbusiness with the public in the United States. Our core mission is to pursue investor protection and market integrity, andwe carry it out by overseeing virtually every aspect of the securities industry. As of December 31, 2014, FINRA oversawnearly 4,100 brokerage firms, approximately 161,600 branch offices and about 636,700 registered securitiesrepresentatives.
We regulate the activities of the U.S. securities industry and perform market regulation pursuant to our own statutoryresponsibility and under contract for the New York Stock Exchange LLC (NYSE), NYSE Arca, Inc. (NYSE Arca), NYSE MKT LLC(NYSE MKT), the NASDAQ OMX Group, Inc. (NASDAQ), NASDAQ OMX BX, Inc. (Boston), NASDAQ OMX PHLX LLC(Philadelphia), BATS Global Markets, Inc. (BZX and BYZ), the Direct Edge exchanges (EDGA and EDGX), the InternationalSecurities Exchange and other exchanges. On December 19, 2014, FINRA signed an agreement with the Chicago BoardOptions Exchange and the C2 Options Exchange (CBOE and C2) to provide regulatory services to these exchanges startingJanuary 1, 2015. We also regulate the over-the-counter (OTC) securities markets for listed and unlisted equities and theOTC markets for corporate bonds, asset-backed instruments, certain government agency instruments, municipal securitiesand other fixed income instruments. Our regulatory functions include onsite examinations of securities firms, continuousautomated surveillance of markets and disciplinary actions against firms and registered representatives.
We provide arbitration and mediation services to assist in the resolution of monetary and business disputes between andamong investors, securities firms and registered representatives. We also provide dispute resolution services for severalexchanges through contractual agreements, thereby offering consistent procedures and the uniformity of a single forumfor the resolution of securities industry-related disputes.
We provide technology-driven registration, testing and continuing education, and other regulatory services, as well asessential operations and support services to firms, other self-regulatory organizations, the Securities ExchangeCommission (SEC), the North American Securities Administrators Association, state regulators, the investing public, theConference of State Bank Supervisors and its wholly-owned subsidiary, the State Regulatory Registry LLC. We developedand continue to enhance BrokerCheck®, a free tool that helps investors research the professional backgrounds of currentand former FINRA-registered brokerage firms and brokers, as well as investment adviser firms and representatives.
We are committed to ensuring that investors and market participants have access to trade information so they can moreeffectively access securities prices and valuations through the management and operation of FINRA’s OTC markettransparency facilities. These facilities include the Trade Reporting and Compliance Engine® (TRACE®) for fixed incomesecurities, the OTC Reporting FacilityTM (ORFTM) for equity securities not listed on an exchange and Trade ReportingFacilities® (TRFs®), operated in partnership with NYSE and NASDAQ, for OTC trading in equity securities that are listed onan exchange. In this capacity, we provide the public and professionals with timely quotes and trade information for equityand debt securities.
The FINRA Investor Education Foundation® (the Foundation), a consolidated subsidiary of FINRA, provides underservedAmericans with the knowledge, skills and tools necessary for financial success throughout life. The Foundation supportsinnovative research and educational projects aimed at segments of the investing public who could benefit from additionalresources.
With approximately 3,500 employees, we are the first line of defense for investors — working in communities all acrossthe nation. Not only do we examine broker-dealers for compliance with our own rules; we also examine them forcompliance with federal securities laws and rules of the Municipal Securities Rulemaking Board. We continue to enhanceour risk-based regulatory program leveraging data analytics and the use of a new platform which supports ourexamination responsibilities.
14 FINRA 2014 Year in Review and Annual Financial Report

ˆ200Gkw!qaj@zjwW@OŠ 200Gkw!qaj@zjwW@O
927550 FIN 15FINRAANNUAL REPORT
25-Jun-2015 10:35 ESTCLN PSWDC
RR Donnelley ProFile SER pf_rend 23*PMT 1C
SERP64RS1611.6.19
Management Report on Financial Operations (continued)
FINRA’s market surveillance systems process approximately 30 billion market events each day to closely monitor tradingactivity in equity, options and fixed income markets in the United States. With the completed integration of BATS GlobalMarkets, Inc. in November 2014, our cross-market surveillance program covers 99 percent of U.S.-listed equities markets.As a result of the regulatory services agreement with CBOE and C2, we now conduct certain cross-market optionssurveillance for about 75 percent of the options market. As noted in FINRA Chairman and CEO Rick Ketchum’s letter (theCEO letter), this expansion of our surveillance programs across different markets and products increases our ability toidentify instances where a market participant engages in potentially abusive conduct on multiple markets in an attemptto avoid detection. We also conduct market surveillance for corporate bonds, asset-backed instruments, certaingovernment agency issues, municipal securities and other fixed income instruments.
We also remain vigilant in our efforts to swiftly take action against fraud and misconduct. In 2014, we referred more than700 potential fraud and insider trading cases to the SEC and other federal agencies for litigation and/or prosecution. Weshare information with other regulators to enable them to take actions that prevent further harm to investors.
In 2014, FINRA brought 1,397 disciplinary actions against registered individuals and firms. As part of those disciplinaryactions, we levied 645 fines totaling more than $132 million and ordered restitution of more than $32 million to harmedinvestors. While the number of monetary sanctions declined 14.5 percent from 2013, the dollar amount of the fines morethan doubled, due in part to the fines highlighted in the CEO letter.
This Management Report should be read in connection with the consolidated financial statements and accompanyingnotes included elsewhere in this Annual Financial Report. The 2014 consolidated financial statements reflect the activitiesof FINRA and its consolidated subsidiaries, collectively referred to as “we,” “our,” “us,” “FINRA” or the “Company”throughout this Management Report. As of and for the years ended December 31, 2014 and 2013, FINRA’s primaryconsolidated subsidiaries are FINRA Regulation, Inc., FINRA Dispute Resolution, Inc. and the Foundation.
Our consolidated financial statements are prepared in conformity with U.S. generally accepted accounting principles. Weare required to adopt accounting principles and make estimates and judgments to develop amounts reported in theconsolidated financial statements and accompanying notes.
Our significant accounting policies are described in Note 2, “Summary of Significant Accounting Policies,” Note 5, “FairValue Measurement,” and Note 7, “Employee Benefit Liabilities,” to the consolidated financial statements.
SUMMARY OF OPERATIONS
The following table provides a summary of our operations for the two years ended December 31, 2014.Years Ended December 31,
2014 2013
(in millions)Net revenues $ 996.6 $ 900.7
Total expenses (964.8) (998.9)
Interest and dividend income 26.0 24.8
Operating income (loss) 57.8 (73.4)
Net realized and unrealized investment gains 34.6 2.4
Equity earnings from other investments 37.8 73.6
Other (1.2) (0.9)
Net income $ 129.0 $ 1.7
FINRA 2014 Year in Review and Annual Financial Report 15

ˆ200Gkw!qaj@zlS5@yŠ 200Gkw!qaj@zlS5@y
927550 FIN 16FINRAANNUAL REPORT
25-Jun-2015 10:35 ESTCLN PSWDC
RR Donnelley ProFile SER pf_rend 18*PMT 1C
SERP64RS1611.6.19
Management Report on Financial Operations (continued)
Net revenues grew 10.6 percent driven mainly by an increase in fines. Expenses declined 3.4 percent, due in part to thereduction in headcount associated with our 2013 Voluntary Retirement Program (VRP), as discussed below. Unrealizedgains related to our trading portfolio increased year over year, driven by robust bond market returns. Equity earnings,while down compared to last year, were positive and in line with benchmarks. All of these factors contributed to netincome of $129.0 million for 2014.
On October 7, 2013, FINRA announced the implementation of a VRP. The VRP was designed for those employees who wereretirement-eligible (minimum age of 55) and when combined with years of service, reached a minimum combined age/years of service of 65 as of January 31, 2014. The VRP included provisions for benefits in the form of severance payments;medical, dental and vision benefits; outplacement services; eligibility and payout for various bonus programs; andadditional service credits for the FINRA pension plan or contributions to the defined contribution component of thesavings plan, as applicable. A total of 176 FINRA employees participated in the VRP. We followed the accounting guidancerelated to pension plan special termination benefits and severance benefits provided under the VRP.
16 FINRA 2014 Year in Review and Annual Financial Report

ˆ200Gkw!qaj@zmbPWWŠ200Gkw!qaj@zmbPWW
927550 FIN 17FINRAANNUAL REPORT
25-Jun-2015 10:35 ESTCLN PSWDC
RR Donnelley ProFile SER pf_rend 26*PMT 4C
SERP64RS1611.6.19
g58o68-3.0
Management Report on Financial Operations (continued)
BALANCE SHEET
Our focus is to ensure a strong balance sheet, so that we are financially positioned to respond to the regulatory needs ofinvestors in today’s continually evolving markets. To that effect, our balance sheet remains strong, with net assets ofapproximately $1.5 billion and $1.4 billion as of December 31, 2014 and 2013. FINRA’s working capital was $856.6 millionas of December 31, 2014, and $633.1 million as of December 31, 2013. Our working capital and cash ratios were 2.32 and2.06 as of December 31, 2014, compared to 1.96 and 1.73 as of December 31, 2013. The increase in FINRA’s cash ratio wasdriven by an increase in fines and SEC fees received year over year. The increases in FINRA’s working capital and workingcapital ratio were driven by the increase in fines and SEC fees stated above, as well as the transfer of $100.0 million fromour broadly diversified multi-asset fund (classified as a long-term asset) to help establish our income-oriented equityportfolio (classified as a current asset).
Assets
FINRA had total assets of approximately $2.4 billion and$2.3 billion as of December 31, 2014 and 2013, includingtotal cash and investments (as defined below) ofapproximately $2.1 billion and $2.0 billion as ofDecember 31, 2014 and 2013. FINRA’s total assetsincreased $128.5 million or 5.7 percent in 2014 primarilydue to increases in cash and investments and receivables,offset by decreases in property and equipment and otherassets.
Cash and investments: FINRA’s investment portfolio wascreated to support FINRA in fulfilling its mission to protectinvestors and maintain market integrity by providingFINRA with supplemental financial resources. FINRA’sinvestment policy strives to preserve principal, in realterms, while seeking to earn a long-term rate of returncommensurate with the degree of risk deemedappropriate for FINRA assets. This is accomplishedthrough a low volatility asset allocation.
Cash and investments (cash, cash equivalents andtrading, available-for-sale and other investments,including investments receivable), represent the largestportion of FINRA’s total assets, approximately 87 percentas of December 31, 2014. Our primary market risk relatesto our investment portfolio. Our investments areimpacted by fluctuations in the securities markets andinterest rates, as well as other financial and nonfinancialrisks.
In 2014, the increase in cash and investments wasprimarily driven by investment portfolio returns of 5.8
percent and increases in fines and SEC fees received yearover year, offset by our pension plan contribution.
As of December 31, 2014, our portfolio exposures were asfollows: bonds and cash, 47 percent; equities, 34 percent;alternatives, 11 percent; and real assets, 8 percent.
Our investment portfolio is highly liquid, with 57 percentavailable in 30 days or less as of December 31, 2014.
Receivables: Receivables, net of an allowance foruncollectible accounts, increased primarily as a result ofan increase in the dollar amount of fines assessed in 2014
versus 2013 and an approximate 27 percent SEC fee rateincrease from December 31, 2013, to December 31, 2014.
ASSETS BY TYPE AS OF DECEMBER 31, 2014
Cash and investments,
87%
Property andequipment,
5%
Receivables,6%
Other assets,2%
Assets as of December 31, 2014 and 2013:2014 2013
(in millions)Cash and investments $2,076.2 $1,954.1
Receivables 139.4 107.0
Property and equipment 115.1 132.1
Other assets 54.4 63.4
Total assets $2,385.1 $2,256.6
FINRA 2014 Year in Review and Annual Financial Report 17
ˆ200Gkw!qaj@znke@FŠ 200Gkw!qaj@znke@F
927550 FIN 18FINRAANNUAL REPORT
25-Jun-2015 10:35 ESTCLN PSWDC
RR Donnelley ProFile SER pf_rend 22*PMT 1C
SERP64RS1611.6.19
Management Report on Financial Operations (continued)
Assets (continued)
Property and equipment: Property and equipment, net ofaccumulated depreciation and amortization, decreased asa result of depreciation.
Other assets: Other assets, which consist primarily ofprepaid expenses, intangible assets, accrued interestrelated to our investments and the Foundation’srestricted cash, decreased as a result of the Foundation’scontinued use of restricted cash to fund investoreducation projects.
18 FINRA 2014 Year in Review and Annual Financial Report

ˆ200Gkw!qaj@zpDG@ÆŠ200Gkw!qaj@zpDG@˘
927550 FIN 19FINRAANNUAL REPORT
25-Jun-2015 10:35 ESTCLN PSWDC
RR Donnelley ProFile SER pf_rend 23*PMT 4C
SERP64RS1611.6.19
g03u71-3.0
Management Report on Financial Operations (continued)
Liabilities
FINRA’s total liabilities increased $66.9 million or 7.9
percent, as increases in pension and other postretirementliabilities, SEC fee payable and other liabilities werepartially offset by decreases in accrued personnel andbenefit costs, investments payable and deferred liabilities.
Pension and other postretirement: Pension and otherpostretirement benefit costs represent a significantliability to FINRA in terms of both the assumptions usedto estimate the liability and its portion of FINRA’s totalliabilities, 25 percent as of December 31, 2014.
In calculating the liability and expense related to ourpension and other postretirement plans, we use severalstatistical and other factors, which attempt to anticipatefuture events. Key factors include assumptions about theexpected rates of return on plan assets and the discountrate as determined by FINRA, within certain guidelines, aswell as assumptions regarding future salary increases,mortality, turnover, retirement ages and the medicalexpense trend rate. We consider market conditions,including changes in investment returns and interestrates, in making these assumptions. The discount rateused in the calculations is developed using a compositeyield curve analysis based on a portfolio of high quality,non-callable marketable bonds.
The decrease in our pension plan discount rate from 5
percent as of December 31, 2013, to 4.2 percent as ofDecember 31, 2014, was the primary reason for the increasein pension and other postretirement liabilities (current andlong-term), and the corresponding decrease in equityrelated to our pension and other postretirement plans.
The actuarial assumptions that we use in determiningpension and other postretirement liabilities and expensesmay differ materially from actual results due to changingmarket and economic conditions, as well as earlywithdrawals by terminating plan participants. While webelieve that the assumptions used are appropriate,differences in actual experience or changes inassumptions may materially affect our financial positionor results of operations. A 25 basis-point increase(decrease) in the discount rate assumption as of
December 31, 2014, would cause the pension projectedbenefit obligation to decrease (increase) by approximately$18.7 million. A 25 basis-point increase (decrease) in thediscount rate assumption as of December 31, 2013, wouldhave caused the 2014 pension net periodic benefit cost todecrease (increase) by approximately $2.0 million. Relatedto other postretirement liabilities and expenses, a 25
basis-point increase (decrease) in the discount rateassumption would not have a material impact on theprojected benefit obligation or net periodic benefit cost.
The pension plan’s funding policy is to fund at least 100
percent of the pension plan’s funding target liability asset forth by the Internal Revenue Service. We contributed$35.0 million to the pension plan in 2014.
As of December 31, 2014, our pension plan portfolioexposures were as follows: equities, 46 percent; bondsand cash, 43 percent; and alternatives, 11 percent.
LIABILITIES BY TYPE AS OF DECEMBER 31, 2014
Pension andother postretirement,
25%
Accruedpersonnel andbenefit costs,
19%
Investmentspayable,
10%
SEC fee payable,19%
Deferred liabilities,9%
Other liabilities,18%
Liabilities as of December 31, 2014 and 2013:2014 2013
(in millions)Accrued personnel and benefit costs $175.5 $182.1
SEC fee payable 173.8 116.8
Investments payable 87.1 151.5
Deferred liabilities 72.5 78.1
Pension and other postretirement 8.2 9.8
Other current 130.4 121.4
Total current liabilities 647.5 659.7
Pension and other postretirement 215.8 136.6
Deferred liabilities 12.6 17.2
Other long-term 34.8 30.3
Total liabilities $910.7 $843.8
FINRA 2014 Year in Review and Annual Financial Report 19
ˆ200Gkw!qaj@zqny@ÁŠ200Gkw!qaj@zqny@`
927550 FIN 20FINRAANNUAL REPORT
25-Jun-2015 10:35 ESTCLN PSWDC
RR Donnelley ProFile SER pf_rend 19*PMT 1C
SERP64RS1611.6.19
Management Report on Financial Operations (continued)
Liabilities (continued)
Pension and other postretirement (continued): Since2011, FINRA has offered a defined contributioncomponent to the savings plan to all new hires, in lieu ofthe pension plan. Also included in this plan are pensionplan participants who elected to participate in the definedcontribution component instead of the pension planduring 2011. As of December 31, 2014, approximately 37
percent of FINRA’s employees participated in the definedcontribution component to the savings plan, which, in thelong-term, will limit our exposure to market fluctuationsas funding is based on age, years of service and basecompensation.
Accrued personnel and benefit costs: Accrued personneland benefit costs decreased primarily due to severancepayments made to VRP participants during 2014.
SEC fee payable: Our SEC fee payable increased due to arate increase from $17.40 to $22.10 per million dollars intransactions.
Investments payable: Investments payable relate tosecurity trades and other investment redemptions orpurchases executed on or prior to the balance sheet date,but not yet settled, as we follow trade-date accounting.Year-end balances fluctuate based on the timing andamount of pending investment activity.
Deferred liabilities: Deferred liabilities decreased due tothe recognition of deferred contribution revenueattributable to the Foundation’s use of restricted funds,which are recognized as grant payments are made orexpenses are incurred against those funds.
Other liabilities: Other liabilities consist primarily ofaccounts payable and accrued expenses; CentralRegistration Depository (CRD®) system balances;Investment Adviser Registration Depository (IARDTM)program surplus; and deferred rental concessions. Otherliabilities increased primarily due to an increase infunding of CRD account balances.
20 FINRA 2014 Year in Review and Annual Financial Report

ˆ200Gkw!qaj@zrZn@zŠ 200Gkw!qaj@zrZn@z
927550 FIN 21FINRAANNUAL REPORT
25-Jun-2015 10:35 ESTCLN PSWDC
RR Donnelley ProFile SER pf_rend 22*PMT 4C
SERP64RS1611.6.19
g35q37-3.0
Management Report on Financial Operations (continued)
STATEMENT OF OPERATIONS
Revenues
Overall, revenues for 2014 increased $95.9 million or 10.6
percent compared to 2013, due primarily to increases inregulatory, user, transparency services and fine revenues,which were partially offset by a decrease in contractservices revenues.
Regulatory revenue: Regulatory revenue, including theTrading Activity Fee (TAF), Gross Income Assessment,Personnel Assessment and Branch Office Assessment, isFINRA’s primary source of revenue, representing 43
percent of revenues in 2014. These revenues are used tofund FINRA’s regulatory activities, including examinationsand surveillance; financial monitoring; and FINRA’spolicymaking, rulemaking and enforcement activities.Increased trading volumes from 2013 to 2014 led to anincrease in TAF, which drove the rise in regulatory revenuefor the year.
User revenue: An increase in corporate financing fees,driven by an increase in the number of filings year overyear, drove the increase in user revenue.
Contract services revenue: Contract services revenuerelated to the mortgage licensing system decreased dueto the client-requested reduction of the developmentteam in an effort to reduce expenses, the absorption oftraining functions by the client, as well as outsourcing thecall center support function to anothervendor. Additionally, mortgage exam volume declinedyear over year, as expected, due to the introduction ofuniform state content as part of the National exam in lieuof unique state exams, as well as reaching a steady-statefor the National exam.
Transparency services revenue: Transparency servicesrevenue increased due to an active participant joiningFINRA’s Alternative Display Facility® (ADF®) in February2014. There were no ADF active participants in 2013. TheADF is a quotation collection and trade reporting facilitythat provides ADF market participants the ability tosubmit quotations and report transactions in NationalMarket System stocks for distribution to the public andfor creating the regulatory audit trail that serves as afoundation for regulation.
Dispute resolution revenue: Dispute resolution revenueconsists of fees earned during the arbitration andmediation processes. Dispute resolution revenueremained relatively flat year over year.
Other revenue: Other revenue represents the recognitionof deferred contribution revenue attributable to theFoundation’s use of funds received from the GlobalResearch Analyst Settlement, which is recognized as grantpayments are made or expenses are incurred againstthose funds. Other revenue was flat year over year.
Fines: While the number of monetary sanctions decreased14.5 percent from 754 in 2013 to 645 in 2014, the averagefine increased from approximately $80,100 in 2013 toapproximately $205,600 in 2014. The use of fine monies islimited to capital expenditures and regulatory projects,such as our migration of market regulation to a cloud-based platform and enhancements to our risk-basedsurveillance and examination programs, which arereported to and approved by our Board of Governors.
REVENUES BY TYPE–2014
Regulatoryrevenue,
43%
User revenue,22%
Contractservices revenue,
10%
Fines, 13%
Transparency services revenue,7%
Dispute resolution revenue, 4% Other revenue, 1%
Components of total revenue in 2014 and 2013:2014 2013
(in millions)Regulatory revenue $428.1 $414.6
User revenue 216.3 206.4
Contract services revenue 104.7 115.2
Transparency services revenue 67.9 58.4
Dispute resolution revenue 37.5 36.2
Other revenue 9.5 9.6
Total operating revenue 864.0 840.4
Fines 132.6 60.4
Activity assessment (net) — (0.1)
Total revenue $996.6 $900.7
FINRA 2014 Year in Review and Annual Financial Report 21
ˆ200Gkw!qaj@zsh$WhŠ 200Gkw!qaj@zsh$Wh
927550 FIN 22FINRAANNUAL REPORT
25-Jun-2015 10:35 ESTCLN PSWDC
RR Donnelley ProFile SER pf_rend 21*PMT 4C
SERP64RS1611.6.19
g16q42-3.0
Management Report on Financial Operations (continued)
Expenses
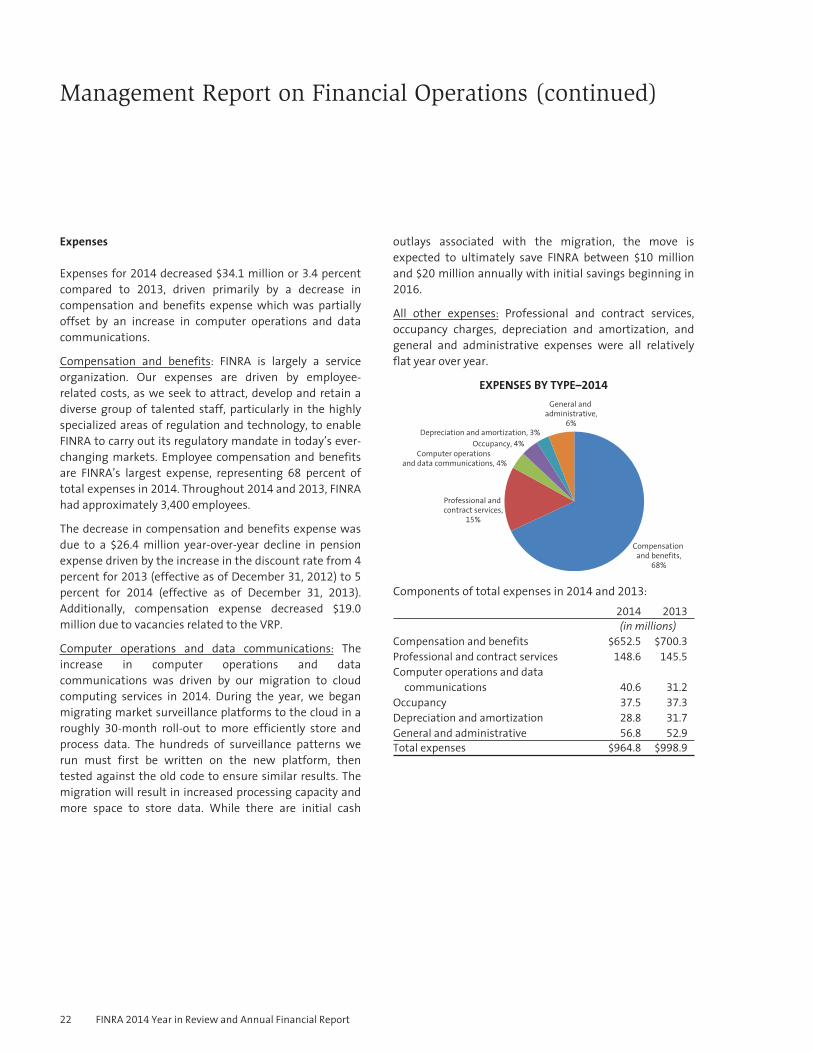
Expenses for 2014 decreased $34.1 million or 3.4 percentcompared to 2013, driven primarily by a decrease incompensation and benefits expense which was partiallyoffset by an increase in computer operations and datacommunications.
Compensation and benefits: FINRA is largely a serviceorganization. Our expenses are driven by employee-related costs, as we seek to attract, develop and retain adiverse group of talented staff, particularly in the highlyspecialized areas of regulation and technology, to enableFINRA to carry out its regulatory mandate in today’s ever-changing markets. Employee compensation and benefitsare FINRA’s largest expense, representing 68 percent oftotal expenses in 2014. Throughout 2014 and 2013, FINRAhad approximately 3,400 employees.
The decrease in compensation and benefits expense wasdue to a $26.4 million year-over-year decline in pensionexpense driven by the increase in the discount rate from 4
percent for 2013 (effective as of December 31, 2012) to 5
percent for 2014 (effective as of December 31, 2013).Additionally, compensation expense decreased $19.0
million due to vacancies related to the VRP.
Computer operations and data communications: Theincrease in computer operations and datacommunications was driven by our migration to cloudcomputing services in 2014. During the year, we beganmigrating market surveillance platforms to the cloud in aroughly 30-month roll-out to more efficiently store andprocess data. The hundreds of surveillance patterns werun must first be written on the new platform, thentested against the old code to ensure similar results. Themigration will result in increased processing capacity andmore space to store data. While there are initial cash
outlays associated with the migration, the move isexpected to ultimately save FINRA between $10 millionand $20 million annually with initial savings beginning in2016.
All other expenses: Professional and contract services,occupancy charges, depreciation and amortization, andgeneral and administrative expenses were all relativelyflat year over year.
EXPENSES BY TYPE–2014
Compensation and benefits,
68%
Professional and contract services,
15%
Occupancy, 4%
Depreciation and amortization, 3%
Computer operations and data communications, 4%
General and administrative,
6%
Components of total expenses in 2014 and 2013:2014 2013
(in millions)Compensation and benefits $652.5 $700.3
Professional and contract services 148.6 145.5
Computer operations and datacommunications 40.6 31.2
Occupancy 37.5 37.3
Depreciation and amortization 28.8 31.7
General and administrative 56.8 52.9
Total expenses $964.8 $998.9
22 FINRA 2014 Year in Review and Annual Financial Report

ˆ200Gkw!qaj@ztrD@<Š200Gkw!qaj@ztrD@<
927550 FIN 23FINRAANNUAL REPORT
25-Jun-2015 10:35 ESTCLN PSWDC
RR Donnelley ProFile SER pf_rend 21*PMT 1C
SERP64RS1611.6.19
Management Report on Financial Operations (continued)
Investment Income and Other Expense
Traditionally, FINRA has relied on investment returns toprovide financial resources to supplement operatingresults. Portfolio returns were relatively flat year overyear, at 5.8 percent and 5.7 percent in 2014 and 2013.
Interest and dividend income: Investment interest anddividend income was relatively flat year over year.
Net realized and unrealized investment gains: Theincrease in net realized and unrealized investment gainsin 2014 was primarily driven by the performance of ourfixed income portfolio.
Equity earnings from other investments: While theperformance of our broadly diversified multi-asset fundwas down from last year, the returns were positive and inline with benchmarks.
Other expense: Other expense represents income taxeson unrelated business income earned primarily frommortgage licensing services and certain external clientexams.
Components of investment income and other expense in2014 and 2013:
2014 2013
(in millions)Interest and dividend income $26.0 $24.8
Net realized and unrealized investmentgains 34.6 2.4
Equity earnings from other investments 37.8 73.6
Other expense (1.2) (0.9)
Total investment income and otherexpense $97.2 $99.9
CONCLUSION
As noted in the CEO letter, 2014 was a strong yearfinancially for FINRA as increases in revenues werecoupled with cost savings driven by pension-related costsand the VRP. We are continually evaluating cost-savingsinitiatives and reviewing our fee structure to ensure ourstrong financial position without compromising ourregulatory mission.
Management believes that we have sufficient liquidityand working capital to meet current and future operatingrequirements, from our continued investment ininnovative technology, such as cloud computing, to thecontinued enhancement of our risk-based regulatoryprogram and continued expansion of surveillancecoverage across markets and products. We will continueto monitor the changing economic conditions andevaluate their potential impact on our organization.
FINRA 2014 Year in Review and Annual Financial Report 23

ˆ200Gkw!qaj@zu!XWzŠ 200Gkw!qaj@zu!XWz
927550 FIN 24FINRAANNUAL REPORT
25-Jun-2015 10:35 ESTCLN PSWDC
RR Donnelley ProFile SER pf_rend 25*PMT 1C
SERP64RS1611.6.19
ketchum_rick-1.0diganci_todd-1.0
Management Report on Internal Control Over Financial Reporting
FINRA management is responsible for the preparation and integrity of the consolidated financial statements appearing inour annual report. The consolidated financial statements were prepared in conformity with U.S. generally acceptedaccounting principles (U.S. GAAP) and include amounts based on management’s estimates and judgments. FINRAmanagement is also responsible for establishing and maintaining adequate internal control over financial reporting andfor the assessment of the effectiveness of internal control over financial reporting. Internal control over financial reportingis a process designed by management to provide reasonable assurance regarding the reliability of financial reporting andthe preparation of financial statements in accordance with U.S. GAAP.
FINRA maintains a system of internal control that is designed to provide reasonable assurance as to the fair and reliablepreparation and presentation of the consolidated financial statements, as well as to safeguard assets from unauthorizeduse or disposition that could have a material effect on the consolidated financial statements. FINRA’s internal control overfinancial reporting includes written policies and procedures that 1) pertain to the maintenance of records that, inreasonable detail, accurately and fairly reflect the transactions and dispositions of FINRA’s assets; 2) provide reasonableassurance that transactions are recorded as necessary to permit preparation of consolidated financial statements inaccordance with U.S. GAAP, and that receipts and expenditures of FINRA are being made only in accordance withauthorizations of FINRA’s management and governors; and 3) provide reasonable assurance regarding prevention ortimely detection of unauthorized acquisition, use or disposition of FINRA’s assets that could have a material effect on theconsolidated financial statements.
Because of its inherent limitations, internal control over financial reporting may not prevent or detect misstatements dueto error or fraud, including the possibility of the circumvention or overriding of controls. Projections of any evaluation ofeffectiveness to future periods are subject to the risk that controls may become inadequate because of changes inconditions, or that the degree of compliance with the policies or procedures may deteriorate.
Under the supervision of the Chairman and Chief Executive Officer and the Chief Financial Officer, FINRA’s managementassessed the effectiveness of FINRA’s internal control over financial reporting as of December 31, 2014. In making thisassessment, management used the criteria set forth by the Committee of Sponsoring Organizations of the TreadwayCommission in Internal Control — Integrated Framework (2013 framework). This evaluation included reviews of thedocumentation of controls, evaluations of the design effectiveness of controls, tests of the operating effectiveness ofcontrols and a conclusion on management’s evaluation. Based on this assessment, we assert that FINRA maintainedeffective internal control over financial reporting as of December 31, 2014.
FINRA’s consolidated financial statements included in this annual report have been audited by Ernst & Young LLP (EY), anindependent registered public accounting firm. EY has also issued an attestation report on FINRA’s internal control overfinancial reporting as of December 31, 2014.
June 29, 2015
Richard G. KetchumChairman and Chief Executive Officer
Todd T. DiganciExecutive Vice President and Chief Financial Officer
24 FINRA 2014 Year in Review and Annual Financial Report

ˆ200Gkw!qakGTCHa@"Š 200Gkw!qakGTCHa@"
927550 FIN 25FINRAANNUAL REPORT
29-Jun-2015 10:36 ESTCLN PSWDC
RR Donnelley ProFile SER lehml0cm 29*PMT 1C
NC8600AC071793211.6.19
Audit Committee Report
The Audit Committee of the Board of Governors (Board) assists the Board in fulfilling its responsibility for Board oversightof the quality and integrity of the accounting, auditing and financial reporting practices of FINRA in accordance with theCharter adopted by the Board.
Each member of the Audit Committee is an independent director as defined by the Securities and Exchange Commission’s(SEC) Rule 10A-3 under The Securities Exchange Act of 1934, Listing Standards Relating to Audit Committees. In addition,the Audit Committee and Board have determined that John Davidson and Leslie F. Seidman are audit committee financialexperts, as defined by the SEC. The Charter gives the Audit Committee responsibility for monitoring the independence of theindependent auditor and recommending the appointment of the independent auditor for approval by the Board. It makesclear that the independent auditor is accountable to the Audit Committee and the Board, as representatives of the membersand the public. In addition, the Charter and the By-Laws of FINRA make the Chief Audit Executive directly responsible to theAudit Committee. In all respects, the Charter complies with standards applicable to publicly-owned companies. (The Charterfor the FINRA Audit Committee is available at: http://www.finra.org/about/audit-committee-charter.)
During 2014, the Audit Committee met seven times.
In discharging its oversight responsibility, the Audit Committee reviewed the assessments of audit risk and the audit plansof both the independent and internal auditors. The Audit Committee also discussed with management, the internalauditors, and the independent auditor the quality and adequacy of FINRA’s internal controls and the internal auditorganization, responsibilities, budget and staffing.
The Audit Committee obtained a written statement from the independent auditor, Ernst & Young LLP (EY), describing allrelationships with FINRA. The Audit Committee discussed those relationships and was satisfied that none of therelationships were incompatible with the auditor’s independence. The Audit Committee has reviewed and approved allservices performed by EY for FINRA and the associated fees before initiation of each engagement. We have summarizedsuch services and fees in the following table:
Independent Registered Public Accountant (IRPA) Fees
FINRA2014 2013
Audit services (1) $1,052,675 $1,003,200
Audit-related services (2) 289,800 247,800
Tax services (3) 142,922 235,000
All other services (4) 35,000 —
Total $1,520,397 $1,486,000
(1) For 2014 and 2013, audit services represent the consolidated financial statement audit and the attestation on internalcontrol.
(2) Audit and attest services provided to FINRA and subsidiaries. 2014 includes one incremental audit of a subsidiary.
(3) Tax services represent fees related to tax return preparation and review services in connection with the 2014 and 2013 Form990s and related Form 990-Ts, as well as tax compliance, advice and planning.
(4) All other services represent the IRPA’s advisory services related to compliance with Federal Acquisition Regulations.
The Audit Committee discussed and reviewed with the independent auditor all communications required under the rulesadopted by the Public Company Accounting Oversight Board (PCAOB). Further, the Committee has reviewed and discussedwith management and EY, with and without management present, the consolidated audited financial statements as of
FINRA 2014 Year in Review and Annual Financial Report 25

ˆ200Gkw!qaj@zx$qW?Š200Gkw!qaj@zx$qW?
927550 FIN 26FINRAANNUAL REPORT
25-Jun-2015 10:35 ESTCLN PSWDC
RR Donnelley ProFile SER pf_rend 22*PMT 1C
SERP64RS1611.6.19
Audit Committee Report (continued)
December 31, 2014; management’s assessment of the effectiveness of FINRA’s internal control over financial reporting;and EY’s report on the consolidated financial statements and on FINRA’s internal control over financial reporting. Based onthose discussions, the Audit Committee recommended to the Board that FINRA’s audited consolidated financialstatements and related reports on internal control be included in the Annual Report for the year ended December 31,
2014.
Members of the Audit Committee:
Carol Anthony (John) Davidson, ChairW. Dennis FergusonJohn W. SchmidlinRobert ScullyLeslie F. Seidman
June 29, 2015
26 FINRA 2014 Year in Review and Annual Financial Report

ˆ200Gkw!qaj@zz6&@TŠ200Gkw!qaj@zz6&@T
927550 FIN 27FINRAANNUAL REPORT
25-Jun-2015 10:36 ESTCLN PSWDC
RR Donnelley ProFile SER pf_rend 23*PMT 1C
SERP64RS1611.6.19
Investment Committee ReportYear Ended December 31, 2014
The FINRA investment portfolio* was created to support FINRA in fulfilling its mission to protect investors and maintainmarket integrity by providing FINRA with supplemental financial resources. FINRA’s investment policy strives to preserveprincipal, in real terms, while seeking to earn a long-term rate of return commensurate with the degree of risk deemedappropriate for FINRA assets by the Board of Governors (Board). Distributions from the portfolio are subject to priorapproval by the Board.
FINRA’s portfolio earned 5.8 percent in 2014, including returns from its cash operating fund. Overall, 2014 was a mixedyear for diversified portfolios. It was a strong year for U.S. equities and bonds, with most major U.S. equity indices hittingnew highs during the year and bond markets posting robust returns, defying expectations. Meanwhile, non-U.S. equitieswere down for the year, and a precipitous fall in oil prices pushed the commodity sector down, with the BloombergCommodity Index losing 17 percent. The chart below shows investment results for FINRA and for several common marketbenchmarks. As of December 31, 2014, FINRA’s investment portfolio, including cash, totaled approximately $1.7 billion.Portfolio liquidity remains strong, with $980 million, or 57 percent, available in 30 days or less as of December 31, 2014.
Annualized Returns2014 3-Year 5-Year Inception (1)
FINRA 5.8% 6.2% 4.9% 3.6%
U.S. Consumer Price Index 0.8% 1.3% 1.7% 2.2%
Barclays U.S. Aggregate 6.0% 2.7% 4.4% 4.7%
MSCI ACWI (2) 4.7% 14.7% 9.7% 7.4%
(1) Since inception as of 1/1/04.(2) The MSCI All Country World Index is a broad, investable index designed to measure the performance of global equity
markets.
The FINRA Board is responsible for FINRA’s investments and approved the charter that guides the FINRA InvestmentCommittee. The Investment Committee, which is composed of members of the Board and other investment professionals,advises the Board and provides guidance in determining the appropriate policy, guidelines and allocation for FINRA’sinvestments. The FINRA Investment Office is responsible for management of the investments within the framework of theinvestment policy. FINRA engages investment consultants to support the Investment Office as needed. The InvestmentCommittee met four times during 2014.
FINRA operates under a low volatility strategy with the objective of creating a lower-risk portfolio than a traditional 60
percent stock/40 percent bond allocation. FINRA’s limited-partnership agreement with HighVista II Limited Partnership, abroadly diversified multi-asset fund managed by HighVista Strategies LLC, uses risk-controlled strategies to obtain marketand non-correlated exposures. FINRA’s fixed income portfolio is a diversified, high-quality investment-grade portfoliomanaged by Wellington Management Company, LLP (Wellington). Wellington also manages a low-cost, income-orientedequity portfolio for FINRA to further diversify the overall portfolio and reduce interest rate risk. With this policy, FINRAcontinues to maintain a broadly diversified investment portfolio, representing a wide range of assets and asset classes, inorder to attain acceptable levels of risk and return. The Investment Committee reviews the policy annually andrecommends changes subject to approval by the Board.
* For the purposes of this Investment Committee report, FINRA’s investment portfolio includes investments net of their relatedreceivables and payables on the consolidated balance sheet, and excludes the Foundation’s investments and Section 31 feesreceived but not yet remitted to the SEC.
FINRA 2014 Year in Review and Annual Financial Report 27

ˆ200Gkw!qaj@z!JHWUŠ 200Gkw!qaj@z!JHWU
927550 FIN 28FINRAANNUAL REPORT
25-Jun-2015 10:36 ESTCLN PSWDC
RR Donnelley ProFile SER pf_rend 25*PMT 4C
SERP64RS1611.6.19
g62c76-1.0
Investment Committee Report (continued)
The chart below shows portfolio exposures as of December 31, 2014. Market exposures are 47 percent bonds/cash and 34
percent equities. Alternatives, at 11 percent, consist of non-correlated exposures. Real assets, at eight percent, compriseinvestments in real estate, commodities and Treasury Inflation-Protected Securities (TIPS).
Exposures as of December 31, 2014
Bonds / Cash47%
Equities 34%
Real Assets 8%
Alternatives 11%
FINRA has an Investments Conflicts of Interest policy that establishes the standards governing the separation ofinvestment activities and decisions from FINRA’s regulatory operations. As stated in the policy, FINRA’s investmentstrategy limits the direct ownership of investment assets to debt and equity securities, treasury futures and shares inprivate investment funds not affiliated with a broker-dealer. Within the portion of the portfolio containing debt andequity securities directly owned by FINRA, all securities within the banking and brokerage sectors are held in a blind trust,in order to prohibit any knowledge of or participation in the making of such investments by any FINRA regulatorypersonnel, and to avoid any appearance of a conflict of interest with FINRA’s responsibilities.
All implementation decisions within the portfolio are made by third-party providers, and with respect to internal activities,the oversight and management of the portfolio is performed by the Investment Committee and limited to essential staffonly — defined as the CEO, CFO, Investment Office, Corporate General Counsel, Corporate Secretary, Internal Audit andFINRA subject-matter experts assisting the internal auditors and the independent auditor in the performance of auditresponsibilities with respect to the FINRA investment portfolio. With those exceptions, no individual in any examination orenforcement arm of the organization has any knowledge of the securities within our investment portfolio.
Members of the Investment Committee:
John J. Brennan, ChairRichard J. FlanneryWilliam H. HeymanRichard S. PechterRichard C. RomanoLuis M. Viceira
June 29, 2015
28 FINRA 2014 Year in Review and Annual Financial Report

ˆ200Gkw!qaj@z@TZ@vŠ200Gkw!qaj@z@TZ@v
927550 FIN 29FINRAANNUAL REPORT
25-Jun-2015 10:36 ESTCLN PSWDC
RR Donnelley ProFile SER pf_rendSTART PAGE
22*PMT 1C
SERP64RS1611.6.19
Management Compensation Committee ReportYear Ended December 31, 2014
FINRA Compensation Philosophy
FINRA’s compensation philosophy is a pay-for-performance model that seeks to achieve pay levels in line with thecompetitive market while meeting the objectives of attracting, developing and retaining high-performing individuals whoare capable of achieving our mission, and to provide rewards commensurate with individual contributions and FINRA’soverall performance. This philosophy applies to employees at all levels within the organization.
Benchmarking
FINRA strives to be competitive with the external market when establishing starting pay rates, annual incentives andsalary structures. A number of external sources are leveraged to compile market data to establish these structures. FINRAuses specific position survey data to evaluate skill sets and benchmarks the compensation paid to internal talent todetermine whether compensation is comparable to the price that those skills would command on the open market.Ultimately, in assessing how to price staff positions, FINRA places an emphasis foremost on the demands andcompetitiveness of each job to ensure that FINRA is paying equitably for skills, expertise and performance level within theoverall context of remaining comparable to the market.
Defining the relevant employment market for competitive compensation benchmarking purposes is a significantchallenge for FINRA due to the scarcity of natural comparisons, the uniqueness of functions performed, the need forspecialized expertise in financial services and securities law and a constantly changing environment under heightenedscrutiny.
As part of its compensation philosophy, FINRA has determined that its competitive compensation positioning for allemployees should be considered against a broad section of financial services and capital market companies, as this sectoris the most likely from which FINRA will recruit talent, and that would recruit talent away from the Company. FINRA alsobenchmarks against general industry positions and law departments for jobs that are not unique to the financial servicesindustry. FINRA recognizes that it does not provide fully competitive opportunities, particularly in the equity/long-termincentive area, when compared to certain global investment and securities firms. As a result, benchmarking for keyexecutives will follow the same philosophy but with ranges geared to offset the lack of long-term incentives.
Executive Compensation
The Management Compensation Committee (the Committee), which is composed of solely public members of the Boardof Governors (Board), is responsible for approving salary levels and incentive compensation ranges for top-level executives.The Committee determines the incentive compensation awards based on actual performance. In determining salary andincentive compensation, management and the Committee consider operational, strategic and financial factors in additionto individual performance. The salary and incentive compensation recommendations for the CEO are reviewed andapproved by the Board annually. The Committee met six times during 2014.
FINRA 2014 Year in Review and Annual Financial Report 29

ˆ200Gkw!qaj@z#@8@TŠ200Gkw!qaj@z#@8@T
927550 FIN 30FINRAANNUAL REPORT
25-Jun-2015 10:36 ESTCLN PSWDC
RR Donnelley ProFile SER pf_rend 20*PMT 1C
SERP64RS1611.6.19
Management Compensation Committee Report (continued)
The Committee has the sole right and responsibility to hire and terminate a compensation consultant. In 2014, as in pastyears, the Committee engaged Mercer, Inc. (Mercer), an independent third-party compensation consultant, to prepare acompensation study, which included objective analysis of current compensation levels and benchmarking usinginformation from a comparable segment of the market for key executives. To ensure the independence of Mercer:
▪ throughout the year, Mercer reported directly and exclusively to the Committee;▪ no Mercer employee is hired by FINRA;▪ Mercer provides no significant services, other than compensation consulting services, to FINRA*;▪ any interaction between Mercer and FINRA executive management is limited to discussions on behalf of the
Committee and information that is presented to the Committee for approval; and▪ fees paid to Mercer for compensation consulting services are reasonable and in line with industry standards.
In determining a benchmarking strategy for key executives, financial services organizations (broker-dealers, investmentbanks, Federal Reserve banks, commercial banks, insurance companies, exchanges and regulators) were determined to bethe most relevant group for comparison purposes. The Committee and Mercer engaged in substantial research andconsideration of the functions and operations of several potential comparisons as well as general competitive conditions.Ultimately, the Committee approved a benchmarking process for key executives that focused on the following sources:
▪ Public comparison group comprised of a blend of financial services organizations engaged in brokerage orother related banking activities.
▪ Public exchanges and regulators.▪ Financial services industry survey data.
The Committee will routinely review the aforementioned sources in determining annual salary and incentivecompensation.
*Mercer is a wholly owned subsidiary of Marsh & McLennan Companies, a global professional services firm, as is MarshUSA (Marsh), both of which provide financial and professional insurance brokerage services to FINRA. Fees paid to Marshfor these services are reasonable and in line with industry standards. Through an affinity program with FINRA, Mercer isavailable to provide FINRA members with insurance products at the option of the FINRA member. FINRA receives a royaltyfee from Mercer for products sold to FINRA members, which is used to support the FINRA Investor Education Foundation(the Foundation) to assist the Foundation’s mission of providing underserved Americans with the knowledge, skills andtools necessary for financial success throughout life. Royalty fees of $1.3 million and $1.4 million were received and used tosupport the Foundation during 2014 and 2013.
The Committee does not believe that the relationships with Mercer and Marsh present any independence issues for FINRA.
30 FINRA 2014 Year in Review and Annual Financial Report

ˆ200Gkw!qaj@z%4SWaŠ 200Gkw!qaj@z%4SWa
927550 FIN 31FINRAANNUAL REPORT
25-Jun-2015 10:36 ESTCLN PSWDC
RR Donnelley ProFile SER pf_rend 26*PMT 1C
SERP64RS1611.6.19
Management Compensation Committee Report (continued)
Summary Compensation Table
The following table presents actual 2014 and 2013 compensation data in the year paid (all amounts are in dollars). The2015 salary information represents the base annual salary at which the top ten executives as of June 29, 2015, arecompensated. It does not represent 2015 year-to-date earnings. The 2015 incentive compensation amounts represent theactual payment in February 2015 based on 2014 performance. Other amounts, including deferred compensation and otherbenefits, are not presented for 2015 as these accumulate over the course of the year and final amounts are notdetermined until year-end. For the compensation details related to the full list of statutory officers and key employees, seeFINRA’s 2014 Form 990 tax returns.
Name and principal position Salary (1)
Incentivecompensation (2)
Deferredcompensation (3)
Otherbenefits (4) Total
Richard Ketchum 2015 1,000,000 1,500,000 * * 2,500,000
Chairman and Chief Executive Officer 2014 1,000,000 1,500,000 361,408 32,420 2,893,828
2013 1,000,000 1,250,000 335,772 37,984 2,623,756
Todd Diganci 2015 550,000 700,000 * * 1,250,000
EVP and Chief Financial Officer 2014 544,231 680,000 40,686 23,852 1,288,769
2013 500,000 680,000 38,339 24,049 1,242,388
Steven Randich 2015 500,000 565,000 * * 1,065,000
EVP and Chief Information Officer 2014 500,000 525,000 141,002 36,111 1,202,113
2013 394,231 — 102,950 17,644 514,825
Robert Colby 2015 500,000 525,000 * * 1,025,000
EVP and Chief Legal Officer 2014 500,000 510,000 139,355 18,511 1,167,866
2013 500,000 300,000 126,553 21,867 948,420
Susan Axelrod 2015 450,000 500,000 * * 950,000
EVP, Regulatory Operations 2014 447,115 475,000 128,527 45,088 1,095,730
2013 391,923 425,000 156,590 39,680 1,013,193
J. Bradley Bennett 2015 435,000 490,000 * * 925,000
EVP, Enforcement 2014 435,000 490,000 122,758 8,938 1,056,696
2013 435,000 450,000 165,466 13,759 1,064,225
Thomas Gira 2015 425,000 500,000 * * 925,000
EVP, Market Regulation 2014 422,115 475,000 81,964 39,654 1,018,733
2013 400,000 455,000 77,193 29,705 961,898
Steven Joachim 2015 400,000 475,000 * * 875,000
EVP, Transparency Services 2014 396,538 450,000 64,761 47,426 958,725
2013 370,000 485,000 62,544 37,962 955,506
F. Gregory Ahern 2015 400,000 410,000 * * 810,000
EVP, Corporate Communications and 2014 400,000 400,000 122,916 35,474 958,390
Government Relations 2013 400,000 100,000 98,154 110,993 709,147
Cameron Funkhouser 2015 375,000 420,000 * * 795,000
EVP, Office of Fraud Detection 2014 372,115 390,000 70,337 27,409 859,861
and Market Intelligence 2013 348,269 340,000 681,111 29,410 1,398,790
* 2015 deferred compensation and other benefits cannot be fully determined until the end of the calendar year, and aretherefore not included in the above table. The 2013 compensation for Mr. Randich represents a partial year of employment.
FINRA 2014 Year in Review and Annual Financial Report 31
ˆ200Gkw!qaj@z%vFWiŠ 200Gkw!qaj@z%vFWi
927550 FIN 32FINRAANNUAL REPORT
25-Jun-2015 10:36 ESTCLN PSWDC
RR Donnelley ProFile SER pf_rend 27*PMT 1C
SERP64RS1611.6.19
Management Compensation Committee Report (continued)
1 Salary is paid bi-weekly, one week in arrears. 2015 salary information represents the executives’ current base annual rate ofpay as of June 29, 2015.
2 Incentive compensation is paid after the close of the calendar year based on the prior year’s performance. Payments arereflected in the table above in the year paid, consistent with FINRA’s reporting in its Form 990 tax returns. Thus, the amountpresented in 2015 was paid in February 2015, based on 2014 performance.
3 Deferred compensation includes earnings and accruals in supplemental executive retirement plans, which are not availableto all employees. Mr. Diganci, Mr. Gira, Mr. Joachim and Mr. Funkhouser participate in FINRA’s supplemental defined benefitretirement plan, which is now closed to new participants. The remaining listed executives are participants in thesupplemental defined contribution retirement plan. Deferred compensation also includes employer-funded 401(k) matchingcontributions and the accrual of benefits in FINRA’s employee retirement plans. The 401(k) and retirement plans aregenerally available to all employees.
4 Other benefits include taxable and non-taxable benefits such as employer paid health, life and disability insurance, whichare generally available to all employees. They also include parking, travel subsidies, tax gross-ups and other miscellaneousfringe benefits.
Components of Compensation
Direct Compensation
▪ Base salaries consist of job grade structures to provide for appropriate flexibility in hiring and retention. Actualsalaries are based on job content, individual performance and relevant experience levels, and may fall above orbelow competitive levels.
▪ Incentive compensation is an additional “at-risk” compensation that is performance-based and determined inrelation to individual achievements and FINRA’s overall performance. The size of the actual award varies basedon goal achievement, performance, grade level and degree of responsibility within the organization. Ifawarded, it is paid as a lump sum in the following year.
Indirect Compensation
▪ Supplemental retirement benefits are provided for top executives and are either defined benefit or definedcontribution based on employment start date. These plans are non-qualified and are based on salary, officerlevel, and depending on officer level a portion of incentive compensation.
▪ Employee and family health, life and other insurance, pension and 401(k) deferral and matching programs,health club subsidies and other benefits are generally available to all employees. Additionally, certainexecutives receive miscellaneous taxable fringe benefits that may include parking, travel subsidies and similarminor items.
Members of the Management Compensation Committee:
William H. Heyman, ChairCarol Anthony (John) DavidsonShelly LazarusJoel Seligman
June 29, 2015
32 FINRA 2014 Year in Review and Annual Financial Report

ˆ200Gkw!qakGsF2BW(Š200Gkw!qakGsF2BW(
927550 FIN 33FINRAANNUAL REPORT
29-Jun-2015 12:23 ESTCLN PSWDC
RR Donnelley ProFile SER tshif0cmSTART PAGE
27*PMT 1C
NC8600AC69161011.6.19
g09a84-1.0
Report of Independent Registered Public Accounting Firmon Internal Control Over Financial Reporting
Board of Governors of
Financial Industry Regulatory Authority, Inc.
We have audited the Financial Industry Regulatory Authority, Inc.’s (FINRA) internal control over financial reporting as ofDecember 31, 2014, based on criteria established in Internal Control–Integrated Framework issued by the Committee ofSponsoring Organizations of the Treadway Commission (2013 framework) (the COSO criteria). FINRA’s management isresponsible for maintaining effective internal control over financial reporting, and for its assessment of the effectivenessof internal control over financial reporting included in the accompanying Management Report on Internal Control OverFinancial Reporting. Our responsibility is to express an opinion on the company’s internal control over financial reportingbased on our audit.
We conducted our audit in accordance with the standards of the Public Company Accounting Oversight Board (UnitedStates). Those standards require that we plan and perform the audit to obtain reasonable assurance about whethereffective internal control over financial reporting was maintained in all material respects. Our audit included obtaining anunderstanding of internal control over financial reporting, assessing the risk that a material weakness exists, testing andevaluating the design and operating effectiveness of internal control based on the assessed risk, and performing suchother procedures as we considered necessary in the circumstances. We believe that our audit provides a reasonable basisfor our opinion.
A company’s internal control over financial reporting is a process designed to provide reasonable assurance regarding thereliability of financial reporting and the preparation of financial statements for external purposes in accordance withgenerally accepted accounting principles. A company’s internal control over financial reporting includes those policies andprocedures that (1) pertain to the maintenance of records that, in reasonable detail, accurately and fairly reflect thetransactions and dispositions of the assets of the company; (2) provide reasonable assurance that transactions arerecorded as necessary to permit preparation of financial statements in accordance with generally accepted accountingprinciples, and that receipts and expenditures of the company are being made only in accordance with authorizations ofmanagement and governors of the company; and (3) provide reasonable assurance regarding prevention or timelydetection of unauthorized acquisition, use, or disposition of the company’s assets that could have a material effect on thefinancial statements.
Because of its inherent limitations, internal control over financial reporting may not prevent or detect misstatements.Also, projections of any evaluation of effectiveness to future periods are subject to the risk that controls may becomeinadequate because of changes in conditions, or that the degree of compliance with the policies or procedures maydeteriorate.
In our opinion, FINRA maintained, in all material respects, effective internal control over financial reporting as ofDecember 31, 2014, based on the COSO criteria.
We also have audited, in accordance with the standards of the Public Company Accounting Oversight Board (UnitedStates), the consolidated balance sheets of FINRA as of December 31, 2014 and 2013, and the related consolidatedstatements of operations, comprehensive income (loss), changes in equity, and cash flows for the years then ended andour report dated June 29, 2015 expressed an unqualified opinion thereon.
McLean, VirginiaJune 29, 2015
FINRA 2014 Year in Review and Annual Financial Report 33

ˆ200Gkw!qakGTF9fWdŠ200Gkw!qakGTF9fWd
927550 FIN 34FINRAANNUAL REPORT
29-Jun-2015 10:36 ESTCLN PSWDC
RR Donnelley ProFile SER lehml0cm 21*PMT 1C
NC8600AC071793211.6.19
g09a84-1.0
Report of Independent RegisteredPublic Accounting Firm
Board of Governors of
Financial Industry Regulatory Authority, Inc.
We have audited the accompanying consolidated balance sheets of the Financial Industry Regulatory Authority, Inc.(FINRA) as of December 31, 2014 and 2013, and the related consolidated statements of operations, comprehensive income(loss), changes in equity, and cash flows for the years then ended. These financial statements are the responsibility of theCompany’s management. Our responsibility is to express an opinion on these financial statements based on our audits.
We conducted our audits in accordance with the standards of the Public Company Accounting Oversight Board (UnitedStates). Those standards require that we plan and perform the audit to obtain reasonable assurance about whether thefinancial statements are free of material misstatement. An audit includes examining, on a test basis, evidence supportingthe amounts and disclosures in the financial statements. An audit also includes assessing the accounting principles usedand significant estimates made by management, as well as evaluating the overall financial statement presentation. Webelieve that our audits provide a reasonable basis for our opinion.
In our opinion, the financial statements referred to above present fairly, in all material respects, the consolidated financialposition of FINRA at December 31, 2014 and 2013, and the consolidated results of their operations and their cash flows forthe years then ended, in conformity with U.S. generally accepted accounting principles.
We also have audited, in accordance with the standards of the Public Company Accounting Oversight Board (UnitedStates), FINRA’s internal control over financial reporting as of December 31, 2014, based on criteria established in InternalControl — Integrated Framework issued by the Committee of Sponsoring Organizations of the Treadway Commission(2013 framework) and our report dated June 29, 2015 expressed an unqualified opinion thereon.
McLean, VirginiaJune 29, 2015
34 FINRA 2014 Year in Review and Annual Financial Report
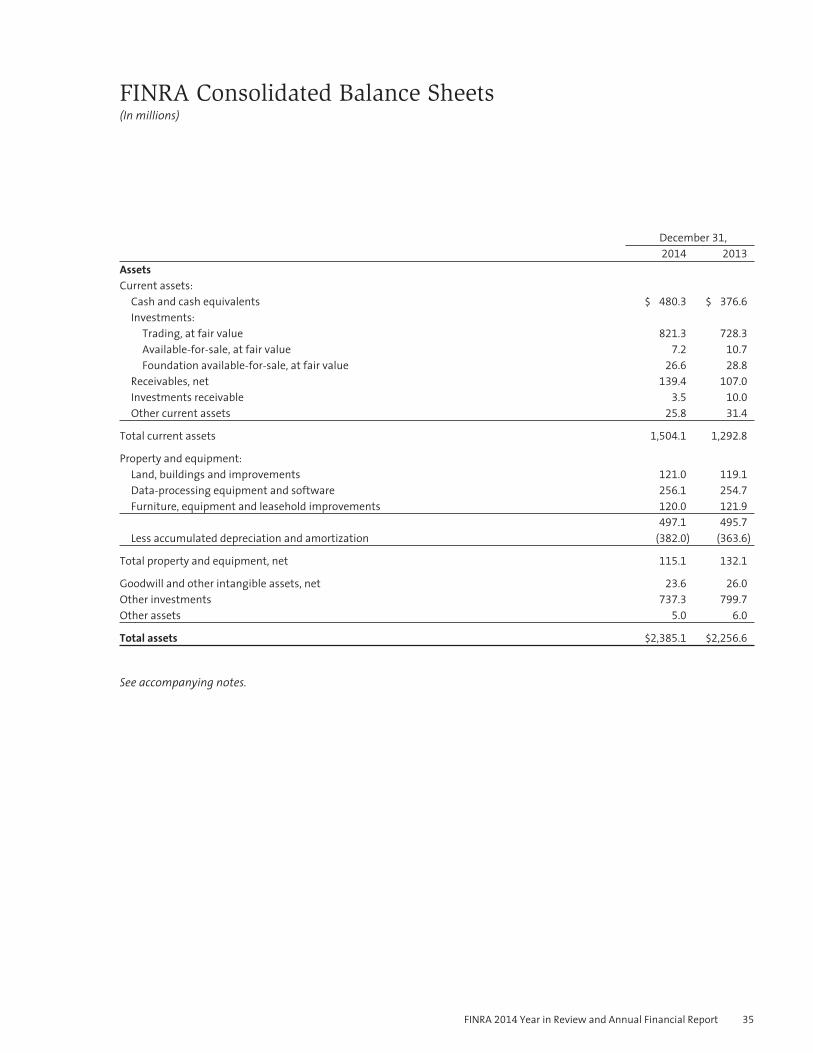
ˆ200Gkw!qaj@!1ybWCŠ 200Gkw!qaj@!1ybWC
927550 FIN 35FINRAANNUAL REPORT
25-Jun-2015 10:36 ESTCLN PSWDC
RR Donnelley ProFile SER pf_rendSTART PAGE
18*PMT 1C
SERP64RS1611.6.19
FINRA Consolidated Balance Sheets(In millions)
December 31,2014 2013
AssetsCurrent assets:
Cash and cash equivalents $ 480.3 $ 376.6
Investments:Trading, at fair value 821.3 728.3
Available-for-sale, at fair value 7.2 10.7
Foundation available-for-sale, at fair value 26.6 28.8
Receivables, net 139.4 107.0
Investments receivable 3.5 10.0
Other current assets 25.8 31.4
Total current assets 1,504.1 1,292.8
Property and equipment:Land, buildings and improvements 121.0 119.1
Data-processing equipment and software 256.1 254.7
Furniture, equipment and leasehold improvements 120.0 121.9
497.1 495.7
Less accumulated depreciation and amortization (382.0) (363.6)
Total property and equipment, net 115.1 132.1
Goodwill and other intangible assets, net 23.6 26.0
Other investments 737.3 799.7
Other assets 5.0 6.0
Total assets $2,385.1 $2,256.6
See accompanying notes.
FINRA 2014 Year in Review and Annual Financial Report 35

ˆ200Gkw!qaj@!31q@KŠ200Gkw!qaj@!31q@K
927550 FIN 36FINRAANNUAL REPORT
25-Jun-2015 10:36 ESTCLN PSWDC
RR Donnelley ProFile SER pf_rend 22*PMT 1C
SERP64RS1611.6.19
FINRA Consolidated Balance Sheets (continued)(In millions)
December 31,2014 2013
Liabilities and equityCurrent liabilities:
Accounts payable and accrued expenses $ 34.3 $ 31.8
Accrued personnel and benefit costs 183.7 191.9
Deferred revenue 70.1 71.4
Deferred contribution income 2.4 6.7
Deposits and renewals 89.9 84.3
Investments payable 87.1 151.5
Other current liabilities 6.2 5.3
SEC fee payable 173.8 116.8
Total current liabilities 647.5 659.7
Accrued pension and other postretirement benefit costs 215.8 136.6
Deferred revenue 12.6 14.3
Deferred contribution income — 2.9
Other liabilities 34.8 30.3
Total liabilities 910.7 843.8
Equity 1,615.5 1,486.5
Unrealized gain on available-for-sale investments 3.2 3.2
Net unrecognized employee benefit plan amounts (144.3) (76.9)
Total equity 1,474.4 1,412.8
Total liabilities and equity $2,385.1 $2,256.6
See accompanying notes.
36 FINRA 2014 Year in Review and Annual Financial Report

ˆ200Gkw!qaj@!4C0W*Š200Gkw!qaj@!4C0W*
927550 FIN 37FINRAANNUAL REPORT
25-Jun-2015 10:36 ESTCLN PSWDC
RR Donnelley ProFile SER pf_rend 19*PMT 1C
SERP64RS1611.6.19
FINRA Consolidated Statements of Operations(In millions)
Years Ended December 31,2014 2013
RevenuesOperating revenues
Regulatory fees, net of firm rebates of $20.0 in 2014 and 2013 $ 428.1 $ 414.6
User fees 216.3 206.4
Contract services fees 104.7 115.2
Transparency services fees 67.9 58.4
Dispute resolution fees 37.5 36.2
Other 9.5 9.6
Total operating revenues 864.0 840.4
Fines 132.6 60.4
Activity assessment 472.0 379.9
Total revenues 1,468.6 1,280.7
Activity assessment cost of revenues (472.0) (380.0)
Net revenues 996.6 900.7
ExpensesCompensation and benefits 652.5 700.3
Professional and contract services 148.6 145.5
Computer operations and data communications 40.6 31.2
Occupancy 37.5 37.3
Depreciation and amortization 28.8 31.7
General and administrative 56.8 52.9
Total expenses 964.8 998.9
Interest and dividend income 26.0 24.8
Operating income (loss) 57.8 (73.4)
Other income (expense)Net realized and unrealized investment gains 34.6 2.4
Equity earnings from other investments 37.8 73.6
Other expense (1.2) (0.9)
Net income $ 129.0 $ 1.7
See accompanying notes.
FINRA 2014 Year in Review and Annual Financial Report 37

ˆ200Gkw!qaj@!5NH@bŠ200Gkw!qaj@!5NH@b
927550 FIN 38FINRAANNUAL REPORT
25-Jun-2015 10:36 ESTCLN PSWDC
RR Donnelley ProFile SER pf_rendSTART PAGE
17*PMT 1C
SERP64RS1611.6.19
FINRA Consolidated Statements of Comprehensive Income(Loss)(In millions)
Years Ended December 31,
2014 2013
Net income $129.0 $ 1.7
Change in unrealized gain or loss on available-for-sale investments — 1.3
Employee benefit plan adjustments (67.4) 168.5
Comprehensive income $ 61.6 $171.5
See accompanying notes.
38 FINRA 2014 Year in Review and Annual Financial Report

ˆ200Gkw!qaj@!6Y=W8Š200Gkw!qaj@!6Y=W8
927550 FIN 39FINRAANNUAL REPORT
25-Jun-2015 10:36 ESTCLN PSWDC
RR Donnelley ProFile SER pf_rendSTART PAGE
21*PMT 1C
SERP64RS1611.6.19
FINRA Consolidated Statements of Changes in Equity(In millions)
Accumulated OtherComprehensive Income (Loss)
Equity
Unrealized Gainon Available -
for-Sale Investments
NetUnrecognized
EmployeeBenefit Plan
Amounts TotalBalance, January 1, 2013 $1,484.8 $1.9 $(245.4) $1,241.3
Comprehensive income 1.7 1.3 168.5 171.5
Balance, December 31, 2013 1,486.5 3.2 (76.9) 1,412.8
Comprehensive income 129.0 — (67.4) 61.6
Balance, December 31, 2014 $1,615.5 $3.2 $(144.3) $1,474.4
See accompanying notes.
FINRA 2014 Year in Review and Annual Financial Report 39
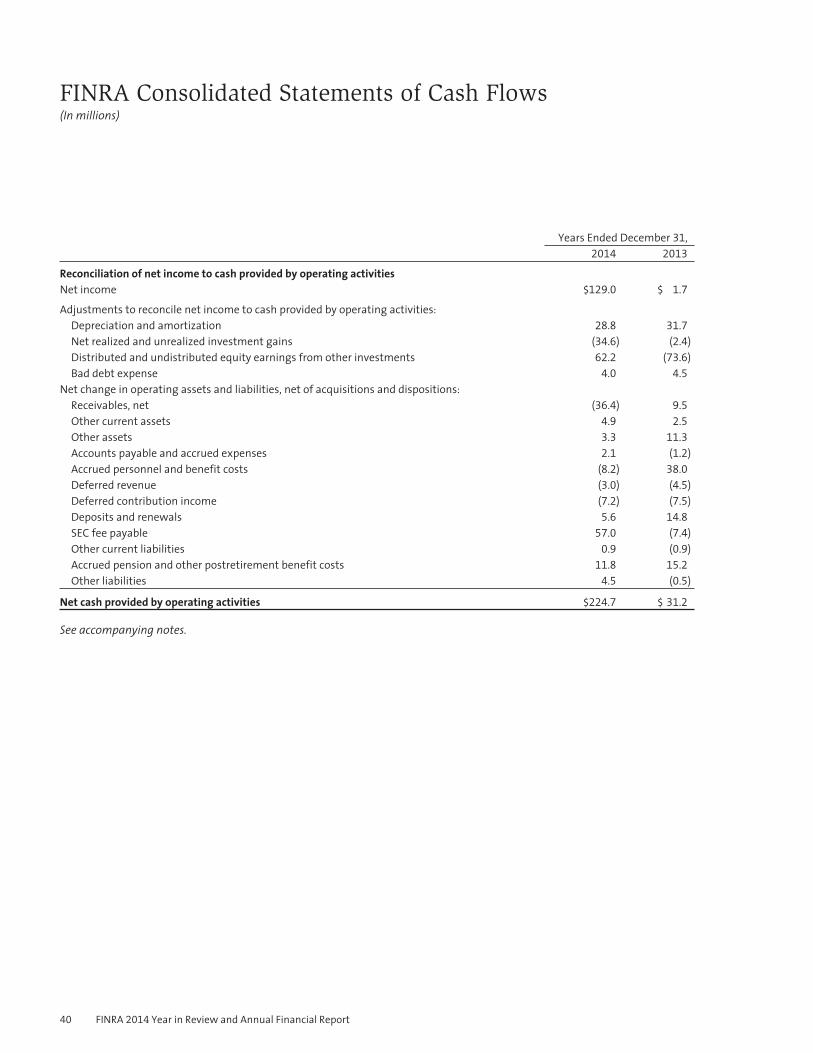
ˆ200Gkw!qaj@!7go@ÈŠ200Gkw!qaj@!7go@¨
927550 FIN 40FINRAANNUAL REPORT
25-Jun-2015 10:36 ESTCLN PSWDC
RR Donnelley ProFile SER pf_rendSTART PAGE
18*PMT 1C
SERP64RS1611.6.19
FINRA Consolidated Statements of Cash Flows(In millions)
Years Ended December 31,2014 2013
Reconciliation of net income to cash provided by operating activitiesNet income $129.0 $ 1.7
Adjustments to reconcile net income to cash provided by operating activities:Depreciation and amortization 28.8 31.7
Net realized and unrealized investment gains (34.6) (2.4)
Distributed and undistributed equity earnings from other investments 62.2 (73.6)
Bad debt expense 4.0 4.5
Net change in operating assets and liabilities, net of acquisitions and dispositions:Receivables, net (36.4) 9.5
Other current assets 4.9 2.5
Other assets 3.3 11.3
Accounts payable and accrued expenses 2.1 (1.2)
Accrued personnel and benefit costs (8.2) 38.0
Deferred revenue (3.0) (4.5)
Deferred contribution income (7.2) (7.5)
Deposits and renewals 5.6 14.8
SEC fee payable 57.0 (7.4)
Other current liabilities 0.9 (0.9)
Accrued pension and other postretirement benefit costs 11.8 15.2
Other liabilities 4.5 (0.5)
Net cash provided by operating activities $224.7 $ 31.2
See accompanying notes.
40 FINRA 2014 Year in Review and Annual Financial Report

ˆ200Gkw!qaj@!8p%W,Š200Gkw!qaj@!8p%W,
927550 FIN 41FINRAANNUAL REPORT
25-Jun-2015 10:36 ESTCLN PSWDC
RR Donnelley ProFile SER pf_rend 16*PMT 1C
SERP64RS1611.6.19
FINRA Consolidated Statements of Cash Flows (continued)(In millions)
Years Ended December 31,2014 2013
Cash flow from investing activitiesNet purchases of trading securities $(115.3) $ (25.4)
Proceeds from redemptions of available-for-sale investments 11.1 33.9
Purchases of available-for-sale investments (2.4) (6.7)
Return of capital and proceeds from redemptions from other investments 0.3 4.1
Net purchases of property and equipment (7.7) (10.3)
Net cash used in investing activities (114.0) (4.4)
Cash flow from financing activitiesChange in donor-restricted cash (7.0) (7.1)
Net cash used in financing activities (7.0) (7.1)
Increase in cash and cash equivalents 103.7 19.7
Cash and cash equivalents at beginning of year 376.6 356.9
Cash and cash equivalents at end of year $ 480.3 $376.6
See accompanying notes.
FINRA 2014 Year in Review and Annual Financial Report 41

ˆ200Gkw!qaj@!9atWiŠ 200Gkw!qaj@!9atWi
927550 FIN 42FINRAANNUAL REPORT
25-Jun-2015 10:36 ESTCLN PSWDC
RR Donnelley ProFile SER pf_rendSTART PAGE
20*PMT 1C
SERP64RS1611.6.19
FINRA 2014 Notes to Consolidated Financial Statements
1. ORGANIZATION AND NATURE OF OPERATIONS
References to the terms “we,” “our,” “us,” “FINRA” or the “Company” used throughout these Notes to ConsolidatedFinancial Statements refer to the Financial Industry Regulatory Authority, Inc. (FINRA), a Delaware corporation, and itswholly owned subsidiaries. FINRA wholly owns the following significant subsidiaries: FINRA Regulation, Inc. (FINRA REG),FINRA Dispute Resolution, Inc. (FINRA DR) and FINRA Investor Education Foundation (the Foundation). The Foundation is atax-exempt membership corporation incorporated in the State of Delaware, with FINRA as the sole member.
We are the largest independent regulator of securities firms doing business with the public in the United States. Weregulate the activities of the U.S. securities industry and perform market regulation pursuant to our own statutoryresponsibility and under contract for the New York Stock Exchange LLC (NYSE), NYSE Arca, Inc. (NYSE Arca), NYSE MKT LLC(NYSE MKT), the NASDAQ OMX Group, Inc. (NASDAQ), NASDAQ OMX BX, Inc. (Boston), NASDAQ OMX PHLX LLC(Philadelphia), BATS Global Markets, Inc. (BZX and BYZ), the Direct Edge exchanges (EDGA and EDGX), the InternationalSecurities Exchange and other exchanges. On December 19, 2014, FINRA signed an agreement with the Chicago BoardOptions Exchange and the C2 Options Exchange (CBOE and C2) to provide regulatory services to these exchanges startingJanuary 1, 2015. We also regulate the over-the-counter (OTC) securities markets for listed and unlisted equities and theOTC markets for corporate bonds, asset-backed instruments, certain government agency instruments, municipal securitiesand other fixed income instruments.
We provide arbitration and mediation services to assist in the resolution of monetary and business disputes between andamong investors, securities firms and registered representatives. We also provide dispute resolution services for severalexchanges through contractual agreements, thereby offering consistent procedures and the uniformity of a single forumfor the resolution of securities-industry related disputes.
We provide technology-driven registration, testing and continuing education, and other regulatory services, as well asessential operations and support services to firms, other self-regulatory organizations (SROs), the Securities ExchangeCommission (SEC), the North American Securities Administrators Association, state regulators, the investing public, theConference of State Bank Supervisors and its wholly-owned subsidiary, the State Regulatory Registry LLC (SRR). Wedeveloped and continue to enhance BrokerCheck, a free tool that helps investors research the professional backgrounds ofcurrent and former FINRA-registered brokerage firms and brokers, as well as investment adviser firms and representatives.
We are committed to ensuring that investors and market participants have access to trade information so they can moreeffectively access securities prices and valuations through the management and operation of FINRA’s OTC markettransparency facilities. These facilities include the Trade Reporting and Compliance Engine (TRACE) for fixed incomesecurities, the OTC Reporting Facility (ORF) for equity securities not listed on an exchange and Trade Reporting Facilities(TRFs), operated in partnership with NYSE and NASDAQ, for OTC trading in equity securities that are listed on an exchange.In this capacity, we provide the public and professionals with timely quotes and trade information for equity and debtsecurities.
The Foundation provides underserved Americans with the knowledge, skills and tools necessary for financial successthroughout life. The Foundation funds innovative research and educational projects aimed at segments of the investingpublic who could benefit from additional resources.
2. SUMMARY OF SIGNIFICANT ACCOUNTING POLICIES
BASIS OF PRESENTATION
The accompanying consolidated financial statements are prepared in accordance with U.S. generally accepted accountingprinciples (U.S. GAAP) and include the accounts of FINRA and its wholly owned subsidiaries. We have eliminated allintercompany balances and transactions in consolidation.
42 FINRA 2014 Year in Review and Annual Financial Report

ˆ200Gkw!qaj@!C2YWcŠ 200Gkw!qaj@!C2YWc
927550 FIN 43FINRAANNUAL REPORT
25-Jun-2015 10:36 ESTCLN PSWDC
RR Donnelley ProFile SER pf_rend 25*PMT 1C
SERP64RS1611.6.19
FINRA 2014 Notes to Consolidated Financial Statements
2. SUMMARY OF SIGNIFICANT ACCOUNTING POLICIES (CONTINUED)
USE OF ESTIMATES
The preparation of these consolidated financial statements requires management to make estimates and assumptions,including estimates of fair value of investments, valuation of investments and assumptions related to our benefit plans,allowances for uncollectible accounts, and the estimated service periods related to our recognition of certain revenue, thataffect the amounts reported in the consolidated financial statements and accompanying notes. Actual results couldmaterially differ from those estimates.
CASH AND CASH EQUIVALENTS
Cash and cash equivalents include demand cash, cash held in banks and all non-restricted, highly liquid investments withoriginal maturities of 90 days or less when acquired.
INVESTMENTS
Debt and Marketable Equity Securities
At the time of purchase, we classify individual securities as trading, available-for-sale or held-to-maturity based on the typeof security and our intent and ability to sell or to hold the securities. We have designated our investments in debt andmarketable equity securities as either trading or available-for-sale. Trading securities are carried at fair value, with changesin fair value recorded as a component of net realized and unrealized investment gains in the consolidated statements ofoperations. We present cash flows from purchases and sales of trading securities as investing activities based on the natureand purpose for which the securities were acquired. We record available-for-sale securities at fair value and recognizetemporary changes in fair value as unrealized gains as a separate component of other comprehensive income.
Fair value is determined based on quoted market prices, when available, or on estimates provided by external pricingsources or dealers who make markets in such securities. Realized gains and losses on sales of securities are included inearnings using the average cost method. Investment receivables or payables relate to security trades and otherinvestment redemptions or purchases executed on or prior to the balance sheet date, but not yet settled, as we followtrade-date accounting.
Other Investments
FINRA has residual investments in hedge funds, which we account for under the equity method. We are also a limitedpartner in a private investment fund. We account for our private investment fund under the equity method based on ourrelative ownership interest in the partnership. The application of the equity method to our investments in hedge fundsand the private investment fund, including our related equity earnings, retains the investment company accountingapplied by such funds.
Other-Than-Temporary Impairment
FINRA periodically monitors and evaluates the realizability of its available-for-sale and equity method investments. Whenassessing realizability, including other-than-temporary declines in value, we consider such factors as the extent of thedecline in value, the duration of unrealized losses, the potential for recovery in the near term and the probability that wewill sell an equity method investment at an amount different from the net asset value of our ownership interest. We alsoreview the financial statements of our equity method investments for potential indicators of impairment. If events andcircumstances indicate that a decline in the value of these assets has occurred and is deemed other-than-temporary, thecarrying value of the investment is reduced to its fair value and the impairment is charged to earnings.
FINRA 2014 Year in Review and Annual Financial Report 43

ˆ200Gkw!qaj@!DCm@LŠ200Gkw!qaj@!DCm@L
927550 FIN 44FINRAANNUAL REPORT
25-Jun-2015 10:36 ESTCLN PSWDC
RR Donnelley ProFile SER pf_rend 20*PMT 1C
SERP64RS1611.6.19
FINRA 2014 Notes to Consolidated Financial Statements
2. SUMMARY OF SIGNIFICANT ACCOUNTING POLICIES (CONTINUED)
RECEIVABLES, NET
The Company’s receivables are primarily concentrated with FINRA-registered firms, associated persons, NYSE Euronext,NASDAQ, BATS and other exchanges. The consolidated financial statements present receivables net of an allowance foruncollectible accounts. As of December 31, 2014 and 2013, an allowance for uncollectible accounts of $11.4 million and$20.8 million is presented within receivables, net in the accompanying consolidated balance sheets. The decrease in theallowance as of December 31, 2014, was due to a change in policy. We calculate the allowance based on the age, source ofthe underlying receivable and past collection experience. We maintain the allowance at a level that management believesto be sufficient to absorb estimated losses inherent in our accounts receivable portfolio. The allowance as of December 31,2014 and 2013, primarily relates to fines and arbitration activities. The allowance is increased by the provision for baddebts, which is charged against operating results and decreased by the amount of charge-offs, net of recoveries. We basethe amount charged against operating results on several factors, including a periodic assessment of the collectibility ofeach account. In circumstances where a specific firm’s inability to meet its financial obligations is known (e.g., bankruptcyfilings), we record a specific provision for bad debts to reduce the receivable to the amount we reasonably believe will becollected.
PROPERTY AND EQUIPMENT
FINRA records property and equipment at cost less accumulated depreciation. We expense repairs and maintenance costsas incurred. We calculate depreciation using the straight-line method over estimated useful lives ranging from 10 to 40
years for buildings and improvements, two to five years for data-processing equipment and software, and five to 10 yearsfor furniture and equipment. We amortize leasehold improvements using the straight-line method over the term of theapplicable lease, including any extension periods at our option. Depreciation and amortization expense for property andequipment, including amortization of capitalized software costs, totaled $25.2 million and $27.9 million for 2014 and2013.
SOFTWARE COSTS
FINRA capitalizes internal computer software development costs incurred during the application development stage.Computer software costs incurred prior to or subsequent to the application development stage are charged to expense asincurred. We capitalize significant purchased application software and operational software programs that are an integralpart of computer hardware and amortize them using the straight-line method over their estimated useful life, generallythree years. We expense all other purchased software as incurred.
The consolidated financial statements reflect unamortized, capitalized software development costs of $8.0 million and$12.9 million as of December 31, 2014 and 2013, within total property and equipment, net in the consolidated balancesheets. Net additions to capitalized software were $1.0 million and $2.7 million in 2014 and 2013. Amortization ofcapitalized internal computer software costs totaled $5.8 million and $4.5 million for 2014 and 2013, and is included indepreciation and amortization in the consolidated statements of operations.
IMPAIRMENT OF LONG-LIVED ASSETS
We review our long-lived assets for impairment annually. In the event facts and circumstances indicate that long-livedassets or other assets may be impaired, we perform an evaluation of recoverability that compares the estimated futureundiscounted cash flows associated with the asset to the asset’s carrying amount. If the evaluation failed the recoverabilitytest, we would then prepare a discounted cash flow analysis to estimate fair value and the amount of any impairment. In2014 and 2013, there were no indicators of long-lived asset impairment, and no impairment charges were recognized.
44 FINRA 2014 Year in Review and Annual Financial Report
ˆ200Gkw!qaj@!D#b@QŠ200Gkw!qaj@!D#b@Q
927550 FIN 45FINRAANNUAL REPORT
25-Jun-2015 10:36 ESTCLN PSWDC
RR Donnelley ProFile SER pf_rend 21*PMT 1C
SERP64RS1611.6.19
FINRA 2014 Notes to Consolidated Financial Statements
2. SUMMARY OF SIGNIFICANT ACCOUNTING POLICIES (CONTINUED)
DEFERRED REVENUE
Deferred revenue represents cash received for which we have not yet provided the related services. Included in deferredrevenue is the unearned portion of mediation fees, arbitration fees, registration fees and firm application fees. Werecognize revenue from the upfront initial components of these fees on a straight-line basis over estimated serviceperiods. The estimated service periods for mediation fees, arbitration fees, registration fees and firm application fees,based on historical experience, are four months, 14 months, four years and 12 years, respectively.
GLOBAL RESEARCH ANALYST SETTLEMENT
On September 2, 2005, the Federal District Court for the Southern District of New York (the Court) issued an order (theOrder) approving the SEC’s new investor education plan, whereby a portion of funds collected in connection with theGlobal Research Analyst Settlement (the GRA Settlement) and earmarked by the Court for investor education, lessexpenses previously approved by the Court, would be remitted to the Foundation. Pursuant to the final judgments againsteach of the defendants under the GRA Settlement, the Foundation received a total of $55.0 million.
As disclosed in Note 1, the Foundation is a consolidated subsidiary of FINRA. At the consolidated level, FINRA presents theamounts the Foundation received in relation to the Order, including interest and dividends earned on these funds, asdeferred contribution income in the consolidated balance sheets, and recognizes the related revenue, net of interest anddividends earned on the funds, as the Foundation makes grant payments and incurs expenses pursuant to the guidelinesin the Order. For the periods ended December 31, 2014 and 2013, the Foundation incurred grant payments and expensesagainst the GRA Settlement funds of $7.2 million and $7.4 million.
Included in other current assets and other long-term assets in the consolidated balance sheets are funds from the GRASettlement, including the interest earned on these funds. The GRA Settlement funds are included in other assets becausetheir use is restricted to the Foundation. The Foundation invests the GRA Settlement funds in a U.S. Treasury moneymarket fund in accordance with the terms of the GRA Settlement, which stipulates that funds received must be invested inmoney market funds or securities with maturities of less than six months and backed by the full faith and credit of thefederal government. The current portion of the GRA Settlement funds as of December 31, 2014, was $3.2 million. There isno long-term portion of the GRA Settlement funds as of December 31, 2014. The current and long-term portions of theGRA Settlement funds as of December 31, 2013, were $6.7 million and $3.4 million.
Under the terms of the Order, to the extent that any of the GRA Settlement funds are not used by the Foundation within 10
years of the date of the Order, FINRA may be required to return any unused funds. Additionally, in the event of a proposeddissolution of the Foundation, the SEC shall file an application with the Court setting forth a plan for the disposition of anyremaining GRA Settlement funds in the Foundation. As of March 31, 2015, all such funds have been expended.
DEPOSIT AND RENEWAL LIABILITIES
FINRA’s deposit and renewal liabilities primarily represent deposits into our Central Registration Depository (CRD) system.FINRA-registered firms use these deposits to pay for services, including registration fees charged by states and other SROs.
OTHER LIABILITIES
FINRA’s other liabilities include amounts associated with the Investment Adviser Registration Depository (IARD) program.
FINRA administers the IARD program. IARD is an electronic filing system for investment advisers regulated by the SECunder the Investment Advisers Act of 1940, and by the states, represented by the North American SecuritiesAdministrators Association. The IARD system collects and maintains the registration and disclosure information forinvestment advisers and their associated persons. IARD fees received but not yet earned are included in deferred revenuein the consolidated balance sheets.
FINRA 2014 Year in Review and Annual Financial Report 45
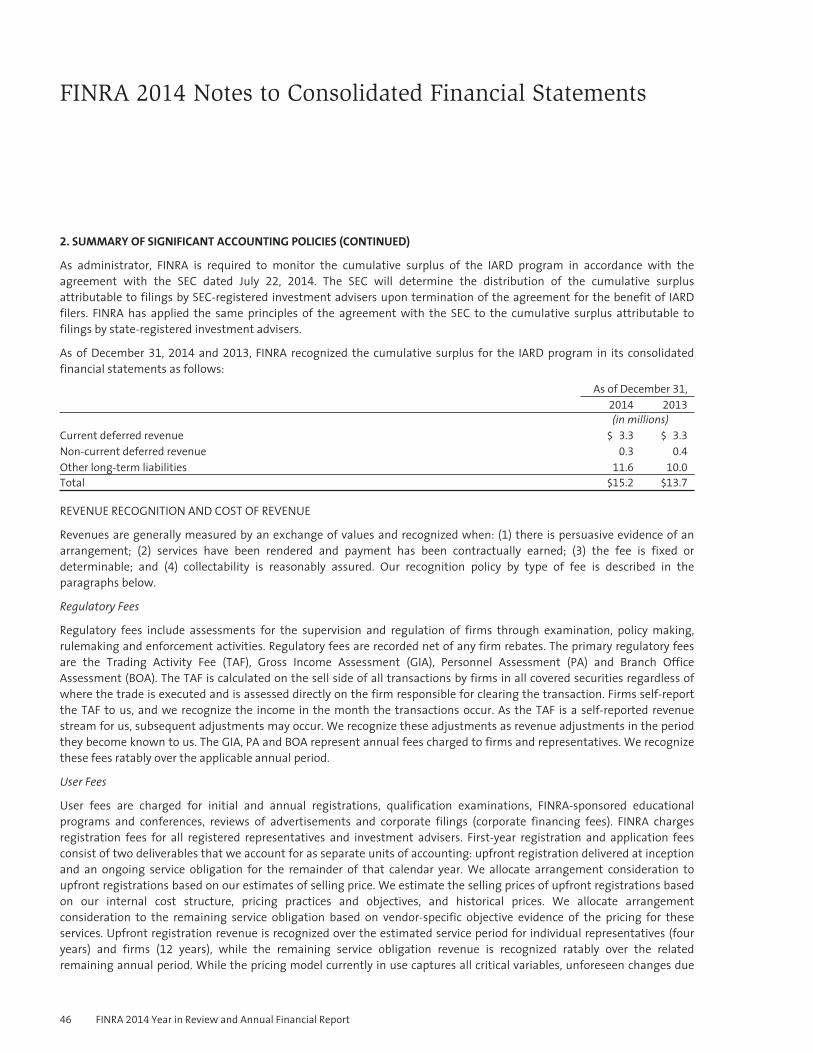
ˆ200Gkw!qaj@!G5rW5Š 200Gkw!qaj@!G5rW5
927550 FIN 46FINRAANNUAL REPORT
25-Jun-2015 10:36 ESTCLN PSWDC
RR Donnelley ProFile SER pf_rend 19*PMT 1C
SERP64RS1611.6.19
FINRA 2014 Notes to Consolidated Financial Statements
2. SUMMARY OF SIGNIFICANT ACCOUNTING POLICIES (CONTINUED)
As administrator, FINRA is required to monitor the cumulative surplus of the IARD program in accordance with theagreement with the SEC dated July 22, 2014. The SEC will determine the distribution of the cumulative surplusattributable to filings by SEC-registered investment advisers upon termination of the agreement for the benefit of IARDfilers. FINRA has applied the same principles of the agreement with the SEC to the cumulative surplus attributable tofilings by state-registered investment advisers.
As of December 31, 2014 and 2013, FINRA recognized the cumulative surplus for the IARD program in its consolidatedfinancial statements as follows:
As of December 31,2014 2013
(in millions)Current deferred revenue $ 3.3 $ 3.3
Non-current deferred revenue 0.3 0.4
Other long-term liabilities 11.6 10.0
Total $15.2 $13.7
REVENUE RECOGNITION AND COST OF REVENUE
Revenues are generally measured by an exchange of values and recognized when: (1) there is persuasive evidence of anarrangement; (2) services have been rendered and payment has been contractually earned; (3) the fee is fixed ordeterminable; and (4) collectability is reasonably assured. Our recognition policy by type of fee is described in theparagraphs below.
Regulatory Fees
Regulatory fees include assessments for the supervision and regulation of firms through examination, policy making,rulemaking and enforcement activities. Regulatory fees are recorded net of any firm rebates. The primary regulatory feesare the Trading Activity Fee (TAF), Gross Income Assessment (GIA), Personnel Assessment (PA) and Branch OfficeAssessment (BOA). The TAF is calculated on the sell side of all transactions by firms in all covered securities regardless ofwhere the trade is executed and is assessed directly on the firm responsible for clearing the transaction. Firms self-reportthe TAF to us, and we recognize the income in the month the transactions occur. As the TAF is a self-reported revenuestream for us, subsequent adjustments may occur. We recognize these adjustments as revenue adjustments in the periodthey become known to us. The GIA, PA and BOA represent annual fees charged to firms and representatives. We recognizethese fees ratably over the applicable annual period.
User Fees
User fees are charged for initial and annual registrations, qualification examinations, FINRA-sponsored educationalprograms and conferences, reviews of advertisements and corporate filings (corporate financing fees). FINRA chargesregistration fees for all registered representatives and investment advisers. First-year registration and application feesconsist of two deliverables that we account for as separate units of accounting: upfront registration delivered at inceptionand an ongoing service obligation for the remainder of that calendar year. We allocate arrangement consideration toupfront registrations based on our estimates of selling price. We estimate the selling prices of upfront registrations basedon our internal cost structure, pricing practices and objectives, and historical prices. We allocate arrangementconsideration to the remaining service obligation based on vendor-specific objective evidence of the pricing for theseservices. Upfront registration revenue is recognized over the estimated service period for individual representatives (fouryears) and firms (12 years), while the remaining service obligation revenue is recognized ratably over the relatedremaining annual period. While the pricing model currently in use captures all critical variables, unforeseen changes due
46 FINRA 2014 Year in Review and Annual Financial Report

ˆ200Gkw!qaj@!HH0@kŠ200Gkw!qaj@!HH0@k
927550 FIN 47FINRAANNUAL REPORT
25-Jun-2015 10:36 ESTCLN PSWDC
RR Donnelley ProFile SER pf_rend 19*PMT 1C
SERP64RS1611.6.19
FINRA 2014 Notes to Consolidated Financial Statements
2. SUMMARY OF SIGNIFICANT ACCOUNTING POLICIES (CONTINUED)
to external market forces may result in the revision to some of our inputs. These modifications may result in the allocationof consideration in future periods that differs from the allocation presently in use. Absent a significant change in thepricing inputs, future changes in the pricing model are not expected to materially impact our allocation of arrangementconsideration.
Qualification fees consist of examination and continuing education fees. We recognize qualification fees as we administerexaminations or continuing education programs. FINRA-sponsored meeting and conference fees include fees paid byfinancial services industry participants for participating in our educational programs. We recognize these fees when theprogram or conference takes place. Advertising fees are charged for our review of firms’ communications to ensure thatthey are fair, balanced and not misleading. We recognize advertising fees as revenue when our review is completed.Corporate financing fees are charged for our review of proposed public offerings. We recognize corporate financing feeswhen our review is completed.
Contract Services Fees
Contract services fees represent amounts charged for regulatory services provided primarily to the NASDAQ family ofmarkets, the NYSE family of markets, the BATS family of markets and other exchanges, as well as the TRFs, for servicesincluding surveillance reviews, investigations, examinations and the disciplinary process. On December 19, 2014, FINRAsigned an agreement with CBOE and C2 to provide market surveillance, financial surveillance, examinations,investigations and disciplinary services to these exchanges starting January 1, 2015. Contract services fees also includefees for the mortgage licensing system FINRA developed and deployed to SRR. We recognize contract services fees as theservices are provided.
Transparency Services Fees
Transparency services fees are charged for the use of the TRACE and Alternative Display Facility (ADF). In addition, fees arecharged for our ORF service for the reporting of trades and comparison in certain OTC equity securities. TRACE fees includemarket data fees as well as fees charged on secondary market transactions in eligible fixed income securities reported tous. ADF fees include market data fees as well as fees for posting quotes and comparison. The OTC Bulletin Board® (OTCBB®)is a regulated quotation service in which fees are charged for a variety of services related to the display of real-time quotesin OTC equity securities that are eligible for quotation on the OTCBB. In addition, fees are earned for the sale of marketdata from the OTCBB and the ORF. We recognize transparency services fees as the transactions occur or when the marketdata is sold.
Dispute Resolution Fees
FINRA earns fees during the arbitration and mediation processes. Certain arbitration fees, such as initial, counterclaim,cross-claim and other filing fees, and surcharge fees, relate to the entire period covered by an arbitration case and arerecognized as revenue over the average life of an arbitration case (14 months). Mediation filing fees are recognized overthe average life of a mediation case (four months). All other arbitration- and mediation-related fees, such as pre-hearingand hearing processing fees, adjournment fees, hearing session fees and mediation session fees, which are event-driven,are recognized as the service is provided. Dispute resolution fees also include arbitrator and mediator application fees thatare recognized as the service is provided.
Fines
Fines represent sanctions for rule violations, which FINRA recognizes upon issuance of a written consent or disciplinarydecision. We do not view fines as part of our operating revenues. FINRA limits the use of fine monies to capitalexpenditures and regulatory projects, which are reported to our Board of Governors (Board).
FINRA 2014 Year in Review and Annual Financial Report 47

ˆ200Gkw!qaj@!JSJWvŠ 200Gkw!qaj@!JSJWv
927550 FIN 48FINRAANNUAL REPORT
25-Jun-2015 10:36 ESTCLN PSWDC
RR Donnelley ProFile SER pf_rend 19*PMT 1C
SERP64RS1611.6.19
FINRA 2014 Notes to Consolidated Financial Statements
2. SUMMARY OF SIGNIFICANT ACCOUNTING POLICIES (CONTINUED)
Activity Assessment Revenues and Cost of Revenues
FINRA, as an SRO, pays certain fees and assessments to the SEC pursuant to Section 31 of the Securities Exchange Act of1934. These fees are designed to recover costs incurred by the government for the supervision and regulation of securitiesmarkets and securities professionals, and are calculated based on the aggregate dollar amount of sales of coveredsecurities transacted by or through any firm other than on a national securities exchange. Such covered transactions arereported to us through the ADF, TRFs and ORF. We remit these SEC fees to the U.S. Treasury semiannually, in March andSeptember.
We recover the cost of the Section 31 fees and assessments through an activity assessment, charged to thefirm responsible for clearing the transaction, based on the aggregate dollar amount of sales of coveredsecurities transacted by or through any firm other than on a national securities exchange. The assessments billed tosecurities firms are recognized when the transactions are reported. As of December 31, 2014 and 2013, we had $47.1
million and $31.7 million of SEC fee receivables presented within receivables, net in the accompanying consolidatedbalance sheets. FINRA, as the primary obligor to the SEC, reports the activity assessment on a gross basis within revenues.Amounts due to the SEC are reported as a cost of revenue. We report amounts pending remittance to the SEC in SEC feepayable in the accompanying consolidated balance sheets.
Activity assessment revenues and cost of revenues are driven by third-party providers and securities firms reportingactivity in a complete, accurate and timely manner. As a result, subsequent adjustments may occur. We recognize anyresulting activity assessment adjustments in the period they become known to us.
Interest and Dividend Income
FINRA recognizes interest income from cash, trading investments, and available-for-sale investments as it is earned.Dividend income is recognized on the ex-dividend date.
PENSION AND OTHER POSTRETIREMENT LIABILITIES
FINRA provides two non-contributory defined benefit pension plans for the benefit of eligible employees. The non-contributory defined benefit plans consist of a qualified Employees Retirement Plan (ERP) and a non-qualifiedSupplemental Executive Retirement Plan (SERP). Both plans are now closed to new participants. We also provide anemployer-funded defined contribution Retiree Medical Account Plan (RMA Plan) to assist our retirees with the cost ofhealth care expenses during retirement. Under the RMA Plan, Retiree Medical Accounts are created for eligible employeesand retirees, and fixed annual credits are applied to those accounts for each year of FINRA service beginning at age 40. Incalculating the expense and liability related to all of the abovementioned plans, we use several statistical and otherfactors, which attempt to anticipate future events. Key factors include assumptions about the expected rates of return onplan assets and the discount rate as determined by FINRA, within certain guidelines, as well as assumptions regardingfuture salary increases, mortality, turnover, retirement ages and the medical expense trend rate. We consider marketconditions, including changes in investment returns and interest rates, in making these assumptions. The discount rateused in the calculations is developed using a composite yield curve analysis based on a portfolio of high-quality, non-callable, marketable bonds. We determine the long-term rate of return based on analysis of historical and projectedreturns as prepared by our actuary and external investment consultant. FINRA’s Pension/401(k) Plan Committee (thePension Committee) reviews and advises FINRA management on both the expected long-term rate of return and thediscount rate assumptions. Amortization of net gain or loss included in accumulated other comprehensive income (loss)reflects a corridor based on 10 percent of the greater of the projected benefit obligation or the market-related value ofplan assets as of the beginning of the plan year, and is included as a component of net periodic pension cost.
48 FINRA 2014 Year in Review and Annual Financial Report

ˆ200Gkw!qaj@!Kb=@WŠ200Gkw!qaj@!Kb=@W
927550 FIN 49FINRAANNUAL REPORT
25-Jun-2015 10:36 ESTCLN PSWDC
RR Donnelley ProFile SER pf_rend 22*PMT 1C
SERP64RS1611.6.19
FINRA 2014 Notes to Consolidated Financial Statements
2. SUMMARY OF SIGNIFICANT ACCOUNTING POLICIES (CONTINUED)
INCOME TAXESFINRA, FINRA REG and FINRA DR are tax-exempt organizations under Internal Revenue Code (IRC) Section 501(c)(6). TheFoundation is a tax-exempt organization under IRC Section 501(c)(4). However, unrelated business income activities aretaxed at normal corporate rates to the extent that they result in taxable net income. We determine deferred tax assetsand liabilities based on differences between the financial statement carrying amounts and the tax basis of existing assetsand liabilities (i.e., temporary differences). We measure these assets and liabilities at the enacted rates that we expect willbe in effect when we will realize these differences. We also determine deferred tax assets based on the amount of netoperating loss carryforwards. If necessary, we establish a valuation allowance to reduce deferred tax assets to the amountthat is more likely than not to be realized.CONCENTRATION OF CREDIT RISKFinancial instruments that potentially subject us to concentrations of credit risk consist of cash and cash equivalents,trading investments, other investments and accounts receivable. We do not require collateral on these financialinstruments.We maintain cash and cash equivalents in excess of federally insured limits, principally with financial institutions located inthe U.S. Risk on accounts receivable is reduced by the number of entities comprising our member firm base and throughongoing evaluation of collectibility of amounts owed to us. We use outside investment managers to manage our investmentportfolio and a custody agent, a publicly traded company headquartered in New York, to hold our trading securities.We maintain a broadly diversified investment portfolio, representing a wide range of assets and asset classes, in order toattain acceptable levels of risk and return. Our investment portfolio, excluding Foundation investments, consists ofinvestments in debt securities, equity securities and private investments. Our limited partnership investment representsapproximately 46 percent of our total invested assets, excluding cash, as of December 31, 2014. The Foundation’sinvestment portfolio consists of mutual funds and a commingled fund.The Company attempts to minimize credit risk by monitoring the creditworthiness of the financial institutions with whichit transacts business.RECENT ACCOUNTING PRONOUNCEMENTSIn May 2014, the Financial Accounting Standards Board (FASB) issued Accounting Standards Update (ASU) No. 2014-09,Revenue from Contracts with Customers (Topic 606). The ASU provides that a company recognize revenue when it transferspromised goods or services to customers in an amount that reflects the consideration to which the company expects to beentitled in exchange for those goods or services. Accordingly, companies will need to use more judgment and make moreestimates which may include identifying performance obligations in the contract, estimating the amount of variableconsideration to include in the transaction price and allocating the transaction price to each separate performance obligation.The ASU is effective for FINRA on January 1, 2018; however, as a nonpublic entity, we may early adopt on January 1, 2017. Weare currently assessing the potential impact that the ASU will have on our consolidated financial statements.In April 2015, the FASB issued ASU No. 2015-05, Intangibles—Goodwill and Other—Internal-Use Software (Subtopic 350-40):Customer’s Accounting for Fees Paid in a Cloud Computing Arrangement. Originally proposed in August 2014, the ASU addressesthe lack of explicit accounting guidance concerning how customers account for fees paid to a cloud service provider based uponwhether a cloud computing arrangement includes a software license. If a cloud computing arrangement includes a softwarelicense, the accounting for the software license would be consistent with other software licenses. If a cloud computingarrangement does not include a software license, the arrangement would be accounted for as a service contract. The ASU doesnot change existing accounting guidance for software licenses or service contracts. The ASU is effective for FINRA on January 1,2016, and can be adopted either retrospectively or prospectively to all arrangements entered into or materially modified afterthe effective date. We are currently assessing the potential impact that the ASU will have on our consolidated financialstatements.
FINRA 2014 Year in Review and Annual Financial Report 49

ˆ200Gkw!qaj@!LkpW{Š200Gkw!qaj@!LkpW{
927550 FIN 50FINRAANNUAL REPORT
25-Jun-2015 10:36 ESTCLN PSWDC
RR Donnelley ProFile SER pf_rend 23*PMT 1C
SERP64RS1611.6.19
FINRA 2014 Notes to Consolidated Financial Statements
2. SUMMARY OF SIGNIFICANT ACCOUNTING POLICIES (CONTINUED)
The following accounting pronouncements were also recently issued:
▪ ASU No. 2013-11, Presentation of an Unrecognized Tax Benefit When a Net Operating Loss Carryforward, aSimilar Tax Loss, or a Tax Credit Carryforward Exists; and
▪ ASU No. 2014-15, Presentation of Financial Statements—Going Concern (Subtopic 205-40): Disclosure ofUncertainties about an Entity’s Ability to Continue as a Going Concern.
We have assessed these pronouncements and determined that they do not have any material impact on our consolidatedresults of operations or financial position.
3. DEFERRED REVENUE
The following is a summary of amounts that we included in current and non-current deferred revenue as of December 31,
2014, and the years over which we will recognize those amounts:
Registration ArbitrationAnnual and
Other Total(in millions)
Year ending December 31,2015 $ 7.3 $5.0 $57.8 $70.1
2016 5.2 — — 5.2
2017 3.4 — — 3.4
2018 1.4 — — 1.4
2019 and thereafter 2.6 — — 2.6
$19.9 $5.0 $57.8 $82.7
The following is a summary of activity in our current and non-current deferred revenue for the periods endedDecember 31, 2014 and 2013, for all revenue arrangements. Annual and other revenue below primarily includes the GIA,PA, BOA and registered representative renewal fees. The additions reflect the fees charged during the period, while theamortization reflects the revenues recognized during the period based on the accounting methodology described above:
Registration ArbitrationAnnual and
Other Total(in millions)
Balance as of January 1, 2014 $19.9 $ 4.6 $ 61.2 $ 85.7
Additions 9.2 10.1 319.4 338.7
Amortization (9.2) (9.7) (322.8) (341.7)Balance as of December 31, 2014 $19.9 $ 5.0 $ 57.8 $ 82.7
Registration ArbitrationAnnual and
Other Total(in millions)
Balance as of January 1, 2013 $20.1 $ 5.0 $ 65.1 $ 90.2
Additions 9.5 8.7 318.1 336.3
Amortization (9.7) (9.1) (322.0) (340.8)Balance as of December 31, 2013 $19.9 $ 4.6 $ 61.2 $ 85.7
50 FINRA 2014 Year in Review and Annual Financial Report

ˆ200Gkw!qaj@!Mt%@lŠ200Gkw!qaj@!Mt%@l
927550 FIN 51FINRAANNUAL REPORT
25-Jun-2015 10:36 ESTCLN PSWDC
RR Donnelley ProFile SER pf_rend 20*PMT 1C
SERP64RS1611.6.19
FINRA 2014 Notes to Consolidated Financial Statements
4. INVESTMENTS
FINRA owns a diverse investment portfolio consisting of 1) U.S. government (including state and local) securities; 2) agencymortgage-backed securities; 3) corporate and asset-backed securities; 4) equity securities; 5) mutual and commingledfunds; 6) other investments (including private investments); and 7) other financial instruments. We have classified ourmarketable investments as trading or available-for-sale based on their nature, and our intent and ability to sell or to holdthe securities.
Our investment policy strives to preserve principal, in real terms, while seeking to earn a long-term rate of returncommensurate with the degree of risk deemed appropriate by the Board. We execute our investment strategy throughseparately managed accounts (SMAs) and direct investments. During 2014, our active trading portfolio was managed byan investment manager, who has the authority to buy and sell investments within FINRA-determined, pre-establishedparameters.
FINRA’s investment portfolio consisted of the following as of:December 31,2014 2013
(in millions)Trading investments $ 821.3 $ 728.3
Available-for-sale investments: FINRA 7.2 10.7
Available-for-sale investments: Foundation 26.6 28.8
Other investments:Equity method investments 737.0 799.4
Cost method investments 0.3 0.3
Total other investments 737.3 799.7
Total $1,592.4 $1,567.5
Trading Investments
Unrealized gain (loss) for the period on trading securities held at December 31, 2014 and 2013, was $26.4 million and$(24.7) million.
Available-for-Sale Investments
FINRA’s available-for-sale investments (excluding those of the Foundation) consisted of the following:Amortized Gross Unrealized Fair
Cost Gain Loss Value(in millions)
As of December 31, 2014:Mutual funds $ 6.8 $0.4 $(—) $ 7.2
As of December 31, 2013:Mutual funds $10.4 $0.3 $(—) $10.7
FINRA 2014 Year in Review and Annual Financial Report 51

ˆ200Gkw!qaj@!N$GWUŠ200Gkw!qaj@!N$GWU
927550 FIN 52FINRAANNUAL REPORT
25-Jun-2015 10:36 ESTCLN PSWDC
RR Donnelley ProFile SER pf_rend 20*PMT 1C
SERP64RS1611.6.19
FINRA 2014 Notes to Consolidated Financial Statements
4. INVESTMENTS (CONTINUED)
Available-for-Sale Investments (Continued)
For 2014 and 2013, gross investment gains and losses recognized from our investments in mutual and commingled funds,including amounts reclassified from unrealized gains and losses in accumulated other comprehensive income, are asfollows:
2014 2013
(in millions)Gross investment gains recognized $0.8 $0.5
Gross investment losses recognized — —Amounts reclassified from accumulated other comprehensive income 0.7 0.3
As of December 31, 2014, the Foundation had investments in mutual and commingled funds with a cost of $23.8 millionand a fair value of $26.6 million. As of December 31, 2013, the Foundation had investments in mutual and commingledfunds with a cost of $25.9 million and a fair value of $28.8 million. The Foundation’s investments are available for use bythe Foundation to fund future research and investor education projects.
Other-Than-Temporary Declines in Fair Value
In 2014 and 2013, we did not record any impairment charges related to our mutual and commingled funds. As ofDecember 31, 2014 and 2013, we did not identify any events or circumstances that would indicate the value of our mutualand commingled funds should be impaired. Should there be any impairment charges related to other-than-temporarydeclines in the fair value of available-for-sale investments, they would be reflected in net realized and unrealizedinvestment gains (losses) in the consolidated statements of operations.
Temporary Declines in Fair Value
As of December 31, 2014 and 2013, the Foundation had one mutual fund with a fair value of $2.9 million, reflectingunrealized losses of $0.1 million less than six months in duration. As of December 31, 2014 and 2013, FINRA had noavailable-for-sale investments with aggregate unrealized losses.
Other Investments
As of December 31, 2014, FINRA had investments accounted for under the equity method of $736.3 million in one limitedpartnership and $0.7 million in hedge funds. These investments are included in other investments in the consolidatedbalance sheets. Our limited partnership investment represents a variable interest in an investment limited partnership. Thepurpose of the limited partnership is to maximize risk-adjusted returns over the long term by investing in a highlydiversified asset allocation strategy. The nature of the limited partnership includes investments in equity, fixed income andalternative investments. As a limited partner, we do not have the power to direct the activities of the partnership that mostsignificantly impact the partnership’s business, nor are we the party most closely associated with the partnership.Therefore, we are not the primary beneficiary and, accordingly, account for our interest under the equity method. Our equityin the earnings of the partnership is based on the partnership’s reported net asset value (which approximates fair value).The partnership’s net assets consist primarily of its investments accounted for at fair value; the majority of the partnership’sfair value measurements are based on the estimates of the general partner. We recognized equity earnings from thispartnership of $38.0 million and $73.3 million in 2014 and 2013. During 2014 and 2013, we did not make any contributionsto this partnership. During 2014, we redeemed $100.0 million from this partnership. Our maximum exposure to loss relatedto this partnership is limited to $736.3 million, the carrying amount of our investment, due to the legal structure and designof this partnership. We have no outstanding capital commitments, guarantees or any other liquidity arrangements with thispartnership. Our ownership interest in this partnership at December 31, 2014 and 2013, was 59.4 percent and 63.3 percent.
52 FINRA 2014 Year in Review and Annual Financial Report

ˆ200Gkw!qaj@!Q6Y@HŠ200Gkw!qaj@!Q6Y@H
927550 FIN 53FINRAANNUAL REPORT
25-Jun-2015 10:36 ESTCLN PSWDC
RR Donnelley ProFile SER pf_rend 20*PMT 1C
SERP64RS1611.6.19
FINRA 2014 Notes to Consolidated Financial Statements
4. INVESTMENTS (CONTINUED)
We had an ownership interest in all equity method investments with total net assets of $8.7 billion and total earningsfrom operations of $119.0 million as of and for the period ended December 31, 2014. Our weighted ownership interest inall equity method investees was 8.4 percent at December 31, 2014.
In 2014, we recognized equity earnings from equity method investments of $37.8 million. We did not recognize anyimpairment charges on our equity method investments for the year ended December 31, 2014.
As of December 31, 2013, FINRA had investments accounted for under the equity method of $798.3 million in one limitedpartnership and $1.1 million in hedge funds. We had an ownership interest in all equity method investments with totalnet assets of $9.5 billion and total earnings from operations of $1.1 billion as of and for the period ended December 31,2013. Our weighted ownership interest in all equity method investees was 8.4 percent at December 31, 2013.
In 2013, we recognized equity earnings from equity method investments of $73.6 million. We did not recognize anyimpairment charges on our equity method investments for the year ended December 31, 2013.
5. FAIR VALUE MEASUREMENT
The Company considers cash and cash equivalents, trading and available-for-sale investments, receivables, investmentsreceivable and investments payable to be its financial instruments. The carrying amounts reported in the consolidatedbalance sheets for these financial instruments equal or closely approximate fair value.
U.S. GAAP defines fair value as the price that would be received upon the sale of an asset or paid to transfer a liability in anorderly transaction between market participants as of the measurement date (i.e., an exit price).
U.S. GAAP prioritizes the level of market price observability used in measuring assets and liabilities at fair value. There are anumber of factors that impact market price observability, including the type of assets and liabilities and the specificcharacteristics of the assets and liabilities. Assets and liabilities with prices that are readily available, actively quoted or forwhich fair value can be measured from actively quoted prices generally will have a higher degree of market priceobservability and less degree of judgment used in measuring fair value.
Assets and liabilities measured at fair value are classified into one of the following categories:
Level 1 Quoted prices (unadjusted) in active markets for identical assets or liabilities that the entity has the abilityto access as of the measurement date.
Level 2 Inputs other than quoted prices included within Level 1 that are observable for the asset or liability, eitherdirectly or indirectly, through corroboration with observable data.
Level 3 Unobservable inputs, such as internally developed pricing models for the asset or liability due to little orno market activity for the asset or liability.
In certain cases, the inputs used to measure fair value may fall into different levels of the fair value hierarchy. In suchcases, an asset or liability’s level within the fair value hierarchy is based on the lowest level input that is significant to thefair value measurement. The assessment of significance of a particular input to the fair value measurement in its entiretyrequires judgment and factors specific to the asset or liability.
FINRA 2014 Year in Review and Annual Financial Report 53
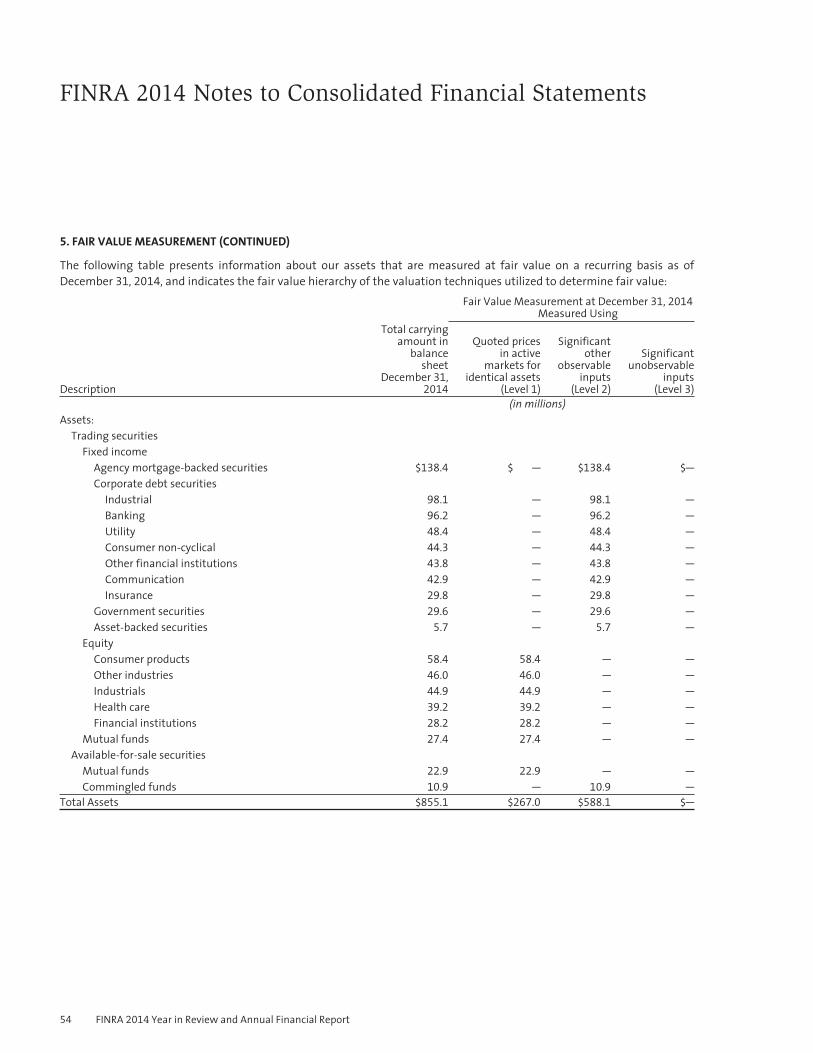
ˆ200Gkw!qaj@!RHnW]Š200Gkw!qaj@!RHnW]
927550 FIN 54FINRAANNUAL REPORT
25-Jun-2015 10:36 ESTCLN PSWDC
RR Donnelley ProFile SER pf_rend 17*PMT 1C
SERP64RS1611.6.19
FINRA 2014 Notes to Consolidated Financial Statements
5. FAIR VALUE MEASUREMENT (CONTINUED)
The following table presents information about our assets that are measured at fair value on a recurring basis as ofDecember 31, 2014, and indicates the fair value hierarchy of the valuation techniques utilized to determine fair value:
Fair Value Measurement at December 31, 2014
Measured Using
Description
Total carryingamount in
balancesheet
December 31,2014
Quoted pricesin active
markets foridentical assets
(Level 1)
Significantother
observableinputs
(Level 2)
Significantunobservable
inputs(Level 3)
(in millions)Assets:
Trading securitiesFixed income
Agency mortgage-backed securities $138.4 $ — $138.4 $—
Corporate debt securitiesIndustrial 98.1 — 98.1 —
Banking 96.2 — 96.2 —
Utility 48.4 — 48.4 —
Consumer non-cyclical 44.3 — 44.3 —
Other financial institutions 43.8 — 43.8 —
Communication 42.9 — 42.9 —
Insurance 29.8 — 29.8 —
Government securities 29.6 — 29.6 —
Asset-backed securities 5.7 — 5.7 —
EquityConsumer products 58.4 58.4 — —
Other industries 46.0 46.0 — —
Industrials 44.9 44.9 — —
Health care 39.2 39.2 — —
Financial institutions 28.2 28.2 — —
Mutual funds 27.4 27.4 — —
Available-for-sale securitiesMutual funds 22.9 22.9 — —
Commingled funds 10.9 — 10.9 —
Total Assets $855.1 $267.0 $588.1 $—
54 FINRA 2014 Year in Review and Annual Financial Report
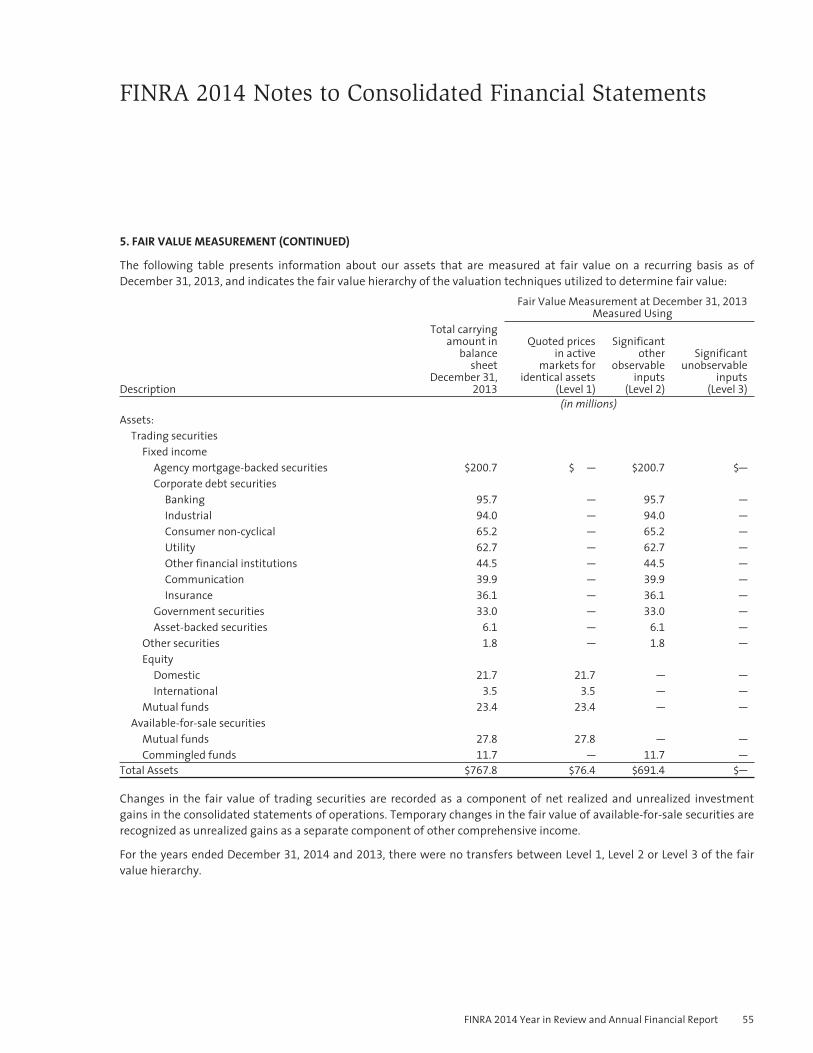
ˆ200Gkw!qaj@!SS#@jŠ200Gkw!qaj@!SS#@j
927550 FIN 55FINRAANNUAL REPORT
25-Jun-2015 10:36 ESTCLN PSWDC
RR Donnelley ProFile SER pf_rend 19*PMT 1C
SERP64RS1611.6.19
FINRA 2014 Notes to Consolidated Financial Statements
5. FAIR VALUE MEASUREMENT (CONTINUED)
The following table presents information about our assets that are measured at fair value on a recurring basis as ofDecember 31, 2013, and indicates the fair value hierarchy of the valuation techniques utilized to determine fair value:
Fair Value Measurement at December 31, 2013
Measured Using
Description
Total carryingamount in
balancesheet
December 31,2013
Quoted pricesin active
markets foridentical assets
(Level 1)
Significantother
observableinputs
(Level 2)
Significantunobservable
inputs(Level 3)
(in millions)Assets:
Trading securitiesFixed income
Agency mortgage-backed securities $200.7 $ — $200.7 $—
Corporate debt securitiesBanking 95.7 — 95.7 —
Industrial 94.0 — 94.0 —
Consumer non-cyclical 65.2 — 65.2 —
Utility 62.7 — 62.7 —
Other financial institutions 44.5 — 44.5 —
Communication 39.9 — 39.9 —
Insurance 36.1 — 36.1 —
Government securities 33.0 — 33.0 —
Asset-backed securities 6.1 — 6.1 —
Other securities 1.8 — 1.8 —
EquityDomestic 21.7 21.7 — —
International 3.5 3.5 — —
Mutual funds 23.4 23.4 — —
Available-for-sale securitiesMutual funds 27.8 27.8 — —
Commingled funds 11.7 — 11.7 —
Total Assets $767.8 $76.4 $691.4 $—
Changes in the fair value of trading securities are recorded as a component of net realized and unrealized investmentgains in the consolidated statements of operations. Temporary changes in the fair value of available-for-sale securities arerecognized as unrealized gains as a separate component of other comprehensive income.
For the years ended December 31, 2014 and 2013, there were no transfers between Level 1, Level 2 or Level 3 of the fairvalue hierarchy.
FINRA 2014 Year in Review and Annual Financial Report 55

ˆ200Gkw!qaj@!TcDWIŠ 200Gkw!qaj@!TcDWI
927550 FIN 56FINRAANNUAL REPORT
25-Jun-2015 10:36 ESTCLN PSWDC
RR Donnelley ProFile SER pf_rend 18*PMT 1C
SERP64RS1611.6.19
FINRA 2014 Notes to Consolidated Financial Statements
5. FAIR VALUE MEASUREMENT (CONTINUED)
The following is a description of the valuation methodologies used for financial assets measured at fair value on arecurring basis and the general classification of these instruments pursuant to the fair value hierarchy.
Fixed Income
All of our fixed income securities classified as trading securities are priced using the services of third-party pricing vendors.These vendors utilize evaluated and industry-accepted pricing models that vary by asset class and incorporate marketinputs such as available trade, bid and other market information to determine the fair value of the securities. Accordingly,the valuation of these securities is categorized in Level 2 of the fair value hierarchy.
We independently validate the fair value measurement of our trading securities to determine that the assigned fair valuesare appropriate. To validate pricing information received, our policy is to employ a variety of procedures throughout theyear, including comparing information received to other pricing sources and performing independent price checks.
Mutual Funds
All of the mutual funds classified as trading investments, which consist of funds invested in domestic bonds as well asdomestic and international equities, relate to our defined contribution SERP for senior officers and deferred compensationplan for officers under the provisions of Section 457(b) of the IRC. The Company also invests in mutual funds that areclassified as available-for-sale investments based on our intent and ability to sell or to hold these investments. One mutualfund investment, related to our closed defined benefit SERP obligation, consists of a life-cycle fund focused on assetallocation through investments in other mutual funds, primarily in bonds with the remainder in equities. Additionally, wehave domestic mutual funds that invest in low-duration, fixed income securities; intermediate maturity, fixed incomesecurities; and Treasury inflation-protected securities.
These investments are valued at the publicly quoted net asset value per share which is computed as of the close ofbusiness on the balance sheet date. Accordingly, the valuation of these securities is categorized in Level 1 of the fair valuehierarchy.
Equity
Our equity securities consist of common stocks of large corporations in a variety of industry sectors, primarily in the UnitedStates. These securities are listed on major security exchanges and are valued at their closing prices on the balance sheetdate. Accordingly, the valuation of these securities is categorized in Level 1 of the fair value hierarchy.
Commingled Fund
Our commingled fund invests in international equities, excluding emerging markets, and tracks the MSCI World Index.This investment is valued at the quoted net asset value per unit, computed as of the close of business on the balance sheetdate. Units of this investment are valued daily and a unit-holder’s ability to transact in the fund’s units occurs daily.Accordingly, the valuation of these securities is categorized in Level 2 of the fair value hierarchy.
56 FINRA 2014 Year in Review and Annual Financial Report

ˆ200Gkw!qaj@!VlW@ÁŠ200Gkw!qaj@!VlW@`
927550 FIN 57FINRAANNUAL REPORT
25-Jun-2015 10:36 ESTCLN PSWDC
RR Donnelley ProFile SER pf_rend 21*PMT 1C
SERP64RS1611.6.19
FINRA 2014 Notes to Consolidated Financial Statements
6. INCOME TAXES
FINRA, FINRA REG and FINRA DR are tax-exempt organizations under IRC Section 501(c)(6). The Foundation is a tax-exemptorganization under IRC Section 501(c)(4).
Unrelated Business Income
Unrelated business income activities are taxed at normal corporate rates to the extent that they have taxable net income.Our unrelated business activities consist primarily of mortgage licensing services provided under our contract with SRR,certain external client exams and, in 2010 and prior, international consulting.
In 2013, management performed an evaluation of the net operating loss (NOL) previously reported under New NASDHolding, Inc. (NAHO), a wholly-owned taxable subsidiary of FINRA. Management determined that FINRA, as the parentorganization, should succeed to the NAHO NOLs upon the liquidation of NAHO. At the time of liquidation, the NOL wasdetermined to have a remaining value, net of gains recognized as part of the transaction, of $60.2 million. As a result ofthis recognition, as of December 31, 2014, and 2013, FINRA had federal unrelated business loss carryforwards of $60.6
million and $63.8 million, primarily related to NAHO losses and international consulting. The loss carryforwards arescheduled to expire beginning in 2021 through 2028.
The deferred tax asset related to the transfer of the NAHO NOL to FINRA was measured at $20.5 million. In order to recorda deferred tax asset without a valuation allowance, it must be more likely than not that the deferred tax asset will berealized. A component of realization is dependent on generating sufficient taxable income prior to the expiration of theloss carryforwards, as well as evaluation of uncertain tax positions. In 2013, we recorded a valuation allowance equal tothe amount of the deferred tax asset resulting from the NAHO liquidation. As of December 31, 2014, and 2013, FINRA hada federal deferred tax asset of $0.5 million ($21.0 million net of a $20.5 million valuation allowance) and $1.6 million ($22.1
million net of a $20.5 million valuation allowance), reflecting the benefit of $60.6 million and $63.8 million in losscarryforwards and other minor deferrals. There is no change in the valuation allowance for 2014. The net change in thevaluation allowance in 2013 is $20.5 million. The amount of the deferred tax asset considered realizable, however, couldbe reduced in the near term if estimates of future taxable income during the carryforward period are reduced. There areno other significant deferred tax assets or liabilities related to unrelated business income. The federal and state 2014 and2013 income tax provision of $1.2 million and $1.3 million primarily represents the net change in deferred tax assetsrelated to unrelated business loss carryforwards during the year. The income tax provision is included in other expense inthe consolidated statements of operations in 2014 and 2013.
We did not have any significant unrelated business income taxes payable or refundable in 2014 or 2013.
Uncertain Tax Positions
U.S. GAAP provides a two-step approach for evaluating tax positions. Recognition (step 1) occurs when an entity concludesthat a tax position, based solely on its technical merits, is more likely than not to be sustained upon examination. In step 2
(measurement), the tax benefit is measured as the largest amount of benefit, determined on a cumulative probabilitybasis, that is more likely than not to be realized upon ultimate settlement. During the years from 2011 to 2014, whichrepresent the years management considers to be open for examination by taxing authorities, management did notidentify the existence of any uncertain tax positions. Accordingly, all tax positions are recognized and measured at theirfull realizable benefit in the consolidated balance sheets and statements of operations. However, in future years, FINRAmay recognize an uncertain tax position if total cumulative NOL usage exceeds the amount resulting from pre-NAHOlosses.
FINRA 2014 Year in Review and Annual Financial Report 57

ˆ200Gkw!qaj@!WulW%Š200Gkw!qaj@!WulW%
927550 FIN 58FINRAANNUAL REPORT
25-Jun-2015 10:36 ESTCLN PSWDC
RR Donnelley ProFile SER pf_rend 19*PMT 1C
SERP64RS1611.6.19
FINRA 2014 Notes to Consolidated Financial Statements
7. EMPLOYEE BENEFIT LIABILITIES
Defined Benefit Pension Plans
As of December 31, 2014 and 2013, we provided two non-contributory defined benefit pension plans for the benefit of oureligible employees, consisting of a qualified ERP and a non-qualified SERP. The benefits are based primarily on years ofservice and employees’ average compensation, as defined, during the highest 60 consecutive months of employment.Both plans are now closed to new participants.
We established an irrevocable rabbi trust to fund our SERP obligation, and included this trust in our consolidated financialstatements. As of December 31, 2014 and 2013, $7.2 million and $10.7 million of investments are included in available-for-sale securities in the consolidated balance sheets, representing the amounts contributed by FINRA, plus earned incomeand market value gains, less distributions to retirees and market value losses. Additionally, as of December 31, 2014, $1.2
million of investments is included in cash and cash equivalents in the consolidated balance sheets, representing pendingdistributions to participants.
The investment policy and strategy of the plan assets, as established by the Pension Committee, strive to achieve a rate ofreturn on plan assets that over the long term will, in concert with Company contributions, fund the plan’s liabilities toprovide for required benefits. The ERP assets are allocated among a diversified portfolio of equity investments, fixedincome securities, alternative investments and cash equivalents with both domestic and international strategies.Derivatives are permitted on a limited scale for hedging or creation of market exposures. Direct debt and equity interestsare prohibited in any broker-dealer, exchange, contract market, regulatory client, alternative or electronic trading system,and entities that derive a certain threshold of revenue from broker-dealer activities. Asset allocations are reviewedquarterly and adjusted, as appropriate, to remain within target allocations. The Pension Committee reviews theinvestment policy annually, under the guidance of an investment consultant, to determine whether a change in the policyor asset allocation targets is necessary. The ERP assets consisted of the following as of December 31, 2014 and 2013:
2014
TargetAllocation 2014 2013
Equity securities:U.S. equity 18.0% 17.6% 16.4%
Non-U.S. equity 16.0% 15.8% 14.9%
Global equity 12.0% 12.5% 11.5%
Fixed income securities 41.0% 41.2% 32.8%
Alternative investments 11.0% 10.9% 9.0%
Cash equivalents 2.0% 2.0% 15.4%
Total 100.0% 100.0% 100.0%
The allocation percentages at December 31, 2013, vary from the targets as a result of a $57.3 million contribution (14.7
percent of assets) made in December 2013 and initially invested in cash equivalents.
The expected long-term rate of return for the plan’s total assets is based on the expected returns of each of the abovecategories, weighted based on the current target allocation for each class. Based on historical experience, the PensionCommittee expects that the ERP’s active asset managers overall will provide a modest premium to their respective marketbenchmark indexes. At least annually, the Pension Committee evaluates whether adjustments are needed based onhistorical returns to more accurately reflect expectations of future returns.
58 FINRA 2014 Year in Review and Annual Financial Report

ˆ200Gkw!qaj@!X$!@eŠ200Gkw!qaj@!X$!@e
927550 FIN 59FINRAANNUAL REPORT
25-Jun-2015 10:36 ESTCLN PSWDC
RR Donnelley ProFile SER pf_rend 22*PMT 1C
SERP64RS1611.6.19
FINRA 2014 Notes to Consolidated Financial Statements
7. EMPLOYEE BENEFIT LIABILITIES (CONTINUED)
The following tables present information about the fair value of the Company’s ERP assets at December 31, 2014 and2013, by asset category, and indicate the fair value hierarchy of the valuation techniques utilized to determine fair value:
Fair Value Measurement at December 31, 2014
Measured Using
Description
Quoted pricesin active
markets foridentical
assets(Level 1)
Significantother
observableinputs
(Level 2)
Significantunobservable
inputs(Level 3) Total
(in millions)Short-term investments in common/collective trusts (a) $ — $ 7.9 $ — $ 7.9
Corporate stocks 15.9 — — 15.9
Partnership/joint venture interests – real assets (b): — — 3.5 3.5
Common/collective trusts (c):Equity — 118.0 — 118.0
Fixed income — 38.4 — 38.4
Mutual funds:Equity 38.3 — — 38.3
Fixed income 154.4 — — 154.4
Total $ 208.6 $164.3 $3.5 $376.4
Fair Value Measurement at December 31, 2013
Measured Using
Description
Quoted pricesin active
markets foridentical
assets(Level 1)
Significantother
observableinputs
(Level 2)
Significantunobservable
inputs(Level 3) Total
(in millions)Short-term investments in common/collective trusts (a) $ — $ 60.8 $ — $ 60.8
Corporate stocks 14.5 — — 14.5
Partnership/joint venture interests – real assets (b): — — 3.5 3.5
Common/collective trusts – equity (c) — 113.7 — 113.7
Private pension plan investment entities – fixed income (d) — 64.6 — 64.6
Mutual funds:Equity 38.1 — — 38.1
Fixed income 95.2 — — 95.2
Total $ 147.8 $239.1 $3.5 $390.4
(a) Includes non-government fixed income securities, government obligations, money market instruments and repurchaseagreements. Fair values have been estimated using the net asset value per unit of the trusts. Units of this investment arevalued daily and a unit-holder’s ability to transact a unit is not restricted.
(b) Includes an investment in a private equity fund that invests in the natural resources and real estate industries. Fair valueshave been estimated using the net asset value of the Plan’s ownership interest of partner’s capital.
FINRA 2014 Year in Review and Annual Financial Report 59

ˆ200Gkw!qaj@!Z7BW{Š200Gkw!qaj@!Z7BW{
927550 FIN 60FINRAANNUAL REPORT
25-Jun-2015 10:36 ESTCLN PSWDC
RR Donnelley ProFile SER pf_rend 19*PMT 1C
SERP64RS1611.6.19
FINRA 2014 Notes to Consolidated Financial Statements
7. EMPLOYEE BENEFIT LIABILITIES (CONTINUED)
The investment in the private equity fund is nonredeemable. The term of the private investment is the later of August 11,
2018, or one year after the date on which all of its underlying investments have been disposed, but may be terminatedearlier as set forth in the partnership agreement. The commitment to the fund is $5.3 million, of which $3.9 million had beenfunded as of December 31, 2014 and 2013.
(c) Includes both domestic and international equities. Fair values have been estimated using the net asset value per unit of thefunds. Investment managers are not constrained by any particular investment style and may invest in either “growth” or“value” securities. Units of this investment are valued daily and a unit-holder’s ability to transact in the trusts’ units occursdaily.
(d) Includes global fixed income and international equities. Fair values have been estimated using the net asset value per unit ofthe funds. The net asset value of these investments is determined daily or at least twice a month while redemptions ofshares are made often, based upon the closing net asset value. No redemption restrictions exist for these funds.
For the years ended December 31, 2014 and 2013, there were no transfers between Level 1, Level 2 or Level 3 of the fairvalue hierarchy.
The valuation techniques and inputs used to measure fair value of the ERP assets are consistent with the Company’svaluation procedures as disclosed in Note 5, “Fair Value Measurement.” At times, the Company may engage externalvaluation experts to assist with the determination of the fair value of certain ERP assets. For alternative investments, netasset value is used as a practical expedient to measure fair value, unless it is probable that an investment will be sold for adifferent amount. In these cases, fair value is measured based on recent observable transaction information for similarinvestments, the consideration of non-binding bids from potential buyers and third-party valuations.
Postretirement and Retiree Medical Benefit Plans
As of December 31, 2014 and 2013, the Company provided a non-contributory postretirement life insurance benefit planfor the benefit of eligible employees. The postretirement benefit plan provides a specified life insurance benefit to eligibleretired employees. The postretirement benefit plan is closed with respect to new participants.
As of December 31, 2014 and 2013, the Company provided an employer-funded defined contribution RMA Plan to assistour retirees with the cost of health care expenses during retirement. Under the RMA Plan, Retiree Medical Accounts arecreated for eligible employees and retirees and fixed annual credits are applied to those accounts for each year of FINRAservice beginning at age 40. Active employees may also accrue credits for a portion of their unused vacation and personalleave. The credits can be accessed only in retirement and may be used only toward paying a portion of monthly premiumsunder FINRA-sponsored retiree health plans.
Voluntary Retirement Program
On October 7, 2013, FINRA announced the implementation of a Voluntary Retirement Program (VRP). The VRP wasdesigned for those employees who were retirement-eligible (minimum age of 55) and when combined with years ofservice, reached a minimum combined age/years of service of 65 as of January 31, 2014. The VRP included provisions forbenefits in the form of severance payments; medical, dental and vision benefits; outplacement services; eligibility andpayout for various bonus programs; and additional service credits for the FINRA ERP or contributions to the definedcontribution component of the savings plan, as applicable.
We followed the accounting guidance related to special termination benefits provided under the VRP. As of December 31,2013, we accrued severance benefits of $19.5 million related to the VRP, and this amount is included in compensation andbenefits in the consolidated statement of operations. In 2014, $15.5 million of severance benefits were paid out to VRPparticipants.
60 FINRA 2014 Year in Review and Annual Financial Report

ˆ200Gkw!qaj@!Zx&WbŠ200Gkw!qaj@!Zx&Wb
927550 FIN 61FINRAANNUAL REPORT
25-Jun-2015 10:36 ESTCLN PSWDC
RR Donnelley ProFile SER pf_rend 21*PMT 1C
SERP64RS1611.6.19
FINRA 2014 Notes to Consolidated Financial Statements
7. EMPLOYEE BENEFIT LIABILITIES (CONTINUED)
Settlements and/or special termination benefits with respect to pension and retiree medical benefits under the VRP areincluded in the plan disclosures below.
Plan Disclosures
The following tables disclose information related to our “Pension Plans,” which include the ERP and SERP described above,and “Other Plans,” which include the postretirement and RMA plans described above. The reconciliation of the projectedbenefit obligation, the change in the fair value of plan assets for the periods ended December 31, 2014 and 2013, and theaccumulated benefit obligation at December 31, 2014 and 2013, are as follows:
Pension Plans Other Plans2014 2013 2014 2013
(in millions)
Change in benefit obligationBenefit obligation at beginning of period $ 485.4 $ 557.5 $ 51.4 $ 53.1
Service cost 29.3 42.8 3.1 4.1
Interest cost 22.3 21.6 2.6 2.1
Actuarial losses (gains) 63.7 (132.4) 10.9 (6.8)
Benefits paid (67.1) (16.8) (1.2) (1.1)
Special termination benefits — 12.7 — —Benefit obligation at end of period $ 533.6 $ 485.4 $ 66.8 $ 51.4
Change in plan assetsFair value of plan assets at beginning of period $ 390.4 $ 309.6 $ — $ —Actual return on plan assets 13.8 33.2 — —Company contributions 39.3 64.4 1.2 1.1
Benefits paid (67.1) (16.8) (1.2) (1.1)
Fair value of plan assets at end of period $ 376.4 $ 390.4 $ — $ —Underfunded status of the plan $(157.2) $ (95.0) $(66.8) $(51.4)
Accumulated benefit obligation (ABO) $ 410.1 $ 366.4
Our total accrued pension and other postretirement liability in the consolidated balance sheet comprises the following:Pension Plans Other Plans2014 2013 2014 2013
(in millions)Current $ 5.7 $ 7.4 $ 2.5 $ 2.4
Noncurrent 151.5 87.6 64.3 49.0
Net amount at December 31 $157.2 $95.0 $66.8 $51.4
The current portion of pension and other liabilities represents the net present actuarial value of benefits to be paid overthe next 12 months in excess of plan assets and is included in accrued personnel and benefit costs in the consolidatedbalance sheet. There are no plan assets for the SERP and RMA Plan.
The Company does not expect any plan assets to be returned to it during the year ending December 31, 2015.
FINRA 2014 Year in Review and Annual Financial Report 61

ˆ200Gkw!qaj@!a1G@+Š200Gkw!qaj@!a1G@+
927550 FIN 62FINRAANNUAL REPORT
25-Jun-2015 10:36 ESTCLN PSWDC
RR Donnelley ProFile SER pf_rend 20*PMT 1C
SERP64RS1611.6.19
FINRA 2014 Notes to Consolidated Financial Statements
7. EMPLOYEE BENEFIT LIABILITIES (CONTINUED)
The net amounts included in accumulated other comprehensive income (loss) are as follows:Pension Plans Other Plans2014 2013 2014 2013
(in millions)Unrecognized net actuarial loss $(119.4) $(61.3) $(15.1) $ (4.2)
Unrecognized prior service cost (0.9) (1.1) (8.9) (10.3)
Net amount at December 31 $(120.3) $(62.4) $(24.0) $(14.5)
The following amounts were included in other comprehensive income (loss) during 2014:
Incurredbut Not
Recognized
ReclassificationAdjustment for
Prior PeriodAmounts
Recognized(in millions)
Actuarial (loss) gainPension plans $(59.5) $1.4
Other plans (10.9) —
(70.4) 1.4
Prior service costPension plans — 0.2
Other plans — 1.4
— 1.6
$(70.4) $3.0
Estimated amounts to be amortized from accumulated other comprehensive income (loss) into net periodic benefit costduring 2015 based on December 31, 2014, plan measurements are as follows:
PensionPlans
OtherPlans
(in millions)Unrecognized prior service costs $0.2 $1.4
Unrecognized actuarial losses 5.3 0.5
The weighted-average assumptions used to determine benefit obligations for the years ended December 31, 2014 and2013, are as follows:
Pension Plans Other Plans2014 2013 2014 2013
Discount rate 4.20% 5.00% 3.75% 4.69%
Rate of compensation increase 3.89% 4.80% — —
The weighted-average assumptions used to determine net periodic benefit cost for the year are as follows:Pension Plans Other Plans2014 2013 2014 2013
Discount rate 5.00% 4.00% 4.69% 3.55%
Rate of compensation increase 4.80% 4.78% — —
Expected return on plan assets 6.75% 6.75% — —
62 FINRA 2014 Year in Review and Annual Financial Report

ˆ200Gkw!qaj@!bcy@@Š200Gkw!qaj@!bcy@@
927550 FIN 63FINRAANNUAL REPORT
25-Jun-2015 10:36 ESTCLN PSWDC
RR Donnelley ProFile SER pf_rend 20*PMT 1C
SERP64RS1611.6.19
FINRA 2014 Notes to Consolidated Financial Statements
7. EMPLOYEE BENEFIT LIABILITIES (CONTINUED)
The assumptions above are used to develop the benefit obligations at year end and to develop the net periodic benefit costfor the subsequent year. Therefore, the assumptions used to determine benefit obligations were established at each yearend while the assumptions used to determine net periodic benefit cost for each year are established at the end of eachprevious year. The expected return on plan assets that will be used in the determination of 2015 net periodic benefit costis 6.25 percent.
The benefit obligations and the net periodic benefit cost are based on actuarial assumptions that are reviewed on anannual basis. We revise these assumptions based on an annual evaluation of long-term trends, as well as marketconditions, which may have an impact on the cost of providing retirement benefits.
The components of net periodic benefit cost included in the consolidated statements of operations are as follows:Pension
PlansOtherPlans
2014 2013 2014 2013
(in millions)Service cost $ 29.3 $ 42.8 $3.1 $4.1
Interest cost 22.3 21.6 2.6 2.1
Expected return on plan assets (23.4) (19.8) — —Recognized net actuarial losses 1.4 13.3 — 0.3
Prior service cost recognized 0.2 0.2 1.4 1.4
Net transition obligation recognized — — — 0.1
Settlement expense 13.8 0.6 — —Special termination benefits — 12.7 — —Total $ 43.6 $ 71.4 $7.1 $8.0
The assumed health care cost trend rate to be used for the next year to measure the expected cost of other plan liabilitiesis 8.5 percent, with a gradual decline to 6.1 percent by the year 2019. This estimated trend rate is subject to change. Theassumed health care cost trend rate can have a significant effect on the amounts reported. However, a 1-percentage-pointchange in the assumed health care cost trend rate would not have a material impact on the benefit obligation or serviceand interest components of net periodic benefit cost.
We measure our plans as of the end of each fiscal year. The ERP’s funding policy is to fund at least 100 percent of the ERP’sfunding target liability as set forth by the Internal Revenue Service. In 2015, we expect to contribute $36.2 million to theERP. We do not expect to make any contributions to the SERP in 2015. In addition, we expect to make the following benefitpayments to participants over the next 10 years:
Pension Plans Other Plans(in millions)
Year ending December 31,2015 $ 24.1 $ 3.8
2016 19.9 4.3
2017 22.2 5.0
2018 29.4 5.9
2019 30.2 6.8
2020 through 2024 192.9 51.6
Total $318.7 $77.4
FINRA 2014 Year in Review and Annual Financial Report 63

ˆ200Gkw!qaj@!cm8W}Š200Gkw!qaj@!cm8W}
927550 FIN 64FINRAANNUAL REPORT
25-Jun-2015 10:36 ESTCLN PSWDC
RR Donnelley ProFile SER pf_rend 21*PMT 1C
SERP64RS1611.6.19
FINRA 2014 Notes to Consolidated Financial Statements
7. EMPLOYEE BENEFIT LIABILITIES (CONTINUED)
All Other Benefit Plans
FINRA also maintains a voluntary contributory savings plan for eligible employees. Employees are immediately eligibleto make elective contributions to the plan up to specified plan limits. Employees are also eligible to receive from FINRA acorresponding dollar-for-dollar matching contribution on any elective contribution made by the participant to the savingsplan, up to a maximum of 4 percent of base compensation, with an additional discretionary match. The plan also has aretiree medical match equal to 25 cents on the dollar for elective contributions in excess of 6 percent of compensation, upto an annual maximum match of $1,000. The savings plan expense for 2014 and 2013 was $22.7 million and $22.8 million,which is included within compensation and benefits expense in the consolidated statements of operations. The savingsplan expense includes a discretionary 2 percent match totaling $6.7 million and $6.6 million for 2014 and 2013, and isincluded within compensation and benefits expense in the consolidated statements of operations. The retiree medicalmatch for 2014 and 2013 totaled $1.8 million and $1.9 million, which is included within compensation and benefitsexpense in the consolidated statements of operations.
FINRA also offers a defined contribution component to the savings plan to all new hires since 2011, as well as the ERPparticipants who elected to participate in the defined contribution component instead of the ERP. The accrued benefit ofthe former ERP participants was frozen, but future service with FINRA still allows for growth into vesting and eligibility forearly retirement and/or early payment subsidies. The Company’s contributions for this component are based on theparticipant’s age plus years of service, and vesting is on a graduated scale for up to six years. The investment options arethe same as the current options in the savings plan. Expenses related to the defined contribution component to thesavings plan for 2014 and 2013 were $5.8 million and $4.7 million, which are included within compensation and benefitsexpense in the consolidated statements of operations.
FINRA maintains a deferred compensation plan for officers under the provisions of Section 457(b) of the IRC. Eligibleemployees may contribute to the plan and, at its discretion, FINRA may make additional contributions to the plan. FINRAplaced the assets of this plan into an irrevocable rabbi trust that the Company consolidates. As of December 31, 2014,$15.1 million of investments and $15.1 million of amounts due to plan participants are included in trading investmentsand accrued personnel and benefit costs in the consolidated balance sheet, representing participant contributions to thisplan and accrued earnings. As of December 31, 2013, $12.9 million of investments and $12.9 million of amounts due toplan participants are included in trading investments and accrued personnel and benefit costs in the consolidated balancesheet, representing participant contributions to this plan and accrued earnings. As of December 31, 2014 and 2013, FINRAmade no additional contributions to this plan.
FINRA maintains a defined contribution SERP for the Company’s senior officers. FINRA makes annual contributions basedon salary and a portion of incentive compensation. Contributions and earnings vest upon the earlier of 1) the end of eachthird year of participation following such contribution; 2) attainment of age 62; 3) death; or 4) a disabled participant’stermination of employment. FINRA placed the assets of this plan into an irrevocable rabbi trust that the Companyconsolidates. As of December 31, 2014, $12.3 million of investments and $12.3 million of amounts due to plan participantsare included in trading investments and accrued personnel and benefit costs in the consolidated balance sheet,representing FINRA’s contributions to this plan plus accrued earnings. As of December 31, 2013, $10.5 million ofinvestments and $10.5 million of amounts due to plan participants are included in trading investments and accruedpersonnel and benefit costs in the consolidated balance sheet, representing FINRA’s contributions to this plan plus accruedearnings.
64 FINRA 2014 Year in Review and Annual Financial Report

ˆ200Gkw!qaj@!dvR@PŠ200Gkw!qaj@!dvR@P
927550 FIN 65FINRAANNUAL REPORT
25-Jun-2015 10:36 ESTCLN PSWDC
RR Donnelley ProFile SER pf_rend 24*PMT 1C
SERP64RS1611.6.19
FINRA 2014 Notes to Consolidated Financial Statements
8. LEASES
FINRA leases certain office space and equipment in connection with its operations. The majority of these leases containescalation clauses based on increases in rent, property taxes and building operating costs. Certain of these leases alsocontain renewal options. Rent expense for operating leases was $23.8 million and $23.7 million for the years endedDecember 31, 2014 and 2013, which is included in occupancy expense in the consolidated statements of operations.
Future minimum lease payments under non-cancelable operating leases with initial or remaining terms of one year ormore consisted of the following at December 31, 2014:Year ending December 31, (in millions)2015 $ 29.4
2016 28.7
2017 27.3
2018 27.0
2019 26.4
Remaining years 47.7
Total minimum lease payments $ 186.5
9. COMMITMENTS AND CONTINGENCIES
General Litigation
The Company may be subject to claims arising out of the conduct of its business. Currently, there are certain legalproceedings pending against us. Management is not aware of any unasserted claims or assessments that would have amaterial adverse effect on our financial position and the results of operations. While the outcome of any pending or futurelitigation cannot be predicted, management does not believe that any such matter will have a material adverse effect onour business or financial position. As of December 31, 2014, there were no material estimated losses requiring disclosurerelated to pending legal proceedings, because we believe the loss from these matters is not probable. We believe anylitigation contingency involves a chance of loss that is either remote or reasonably possible. Such pending legal mattersinvolve unspecified claim amounts, in which the respective plaintiffs seek an indeterminate amount of damages. Theoutcome of such matters is always uncertain, and unforeseen results can occur. It is possible that such outcomes couldrequire us to pay damages or make other expenditures or establish accruals in amounts that we could not estimate as ofDecember 31, 2014.
10. SUBSEQUENT EVENTS
In January 2015, we purchased the building located at 15200 Omega Drive in Rockville, Maryland (the Omega Building), ofwhich we previously leased approximately 65 percent of the office space, for approximately $18.0 million. The purchase ofthe Omega Building eliminated future minimum lease payments of $11.5 million in total, $1.5 million of which related tothe year ending December 31, 2015. In March 2015, we entered into an unsecured 2.99 percent fixed rate seven-year termloan in the amount of $18.0 million related to our purchase of the Omega Building.
Subsequent events have been evaluated through June 29, 2015, the date these financial statements became available tobe issued.
FINRA 2014 Year in Review and Annual Financial Report 65

ˆ200Gkw!qakGTGlHWDŠ200Gkw!qakGTGlHWD
927550 FIN 66FINRAANNUAL REPORT
29-Jun-2015 10:36 ESTCLN PSWDC
RR Donnelley ProFile SER lehml0cmSTART PAGE
10*PMT 1C
NC8600AC071793211.6.19
FINRA Board ofGovernors as ofMay 11, 2015Richard G. KetchumChairman andChief Executive OfficerFINRAWashington, DC
John J. Brennan (Industry)The Vanguard Group, Inc.Malvern, PA
Kevin Carreno (Industry)International Assets Advisory,LLCOrlando, FL
Mark S. Casady (Industry)LPL FinancialBoston, MA
Mark Cresap (Industry)Cresap, Inc.Radnor, PA
Carol Anthony (John) Davidson(Public)RetiredPrinceton, NJ
W. Dennis Ferguson (Industry)Capital Investment GroupBoca Raton, FL
Gregory J. Fleming (Industry)Morgan Stanley WealthManagementNew York, NY
William H. Heyman (Public)The Travelers Companies, Inc.Saint Paul, MN
Susan Wolburgh Jenah (Public)Former President and CEO ofInvestment Industry RegulatoryOrganization of CanadaToronto, ON
Robert Keenan (Industry)St. Bernard Financial ServicesRussellville, AR
Shelly Lazarus (Public)Ogilvy & MatherNew York, NY
Joshua S. Levine (Public)RetiredNew York, NY
Brigitte C. Madrian (Public)Harvard Kennedy School ofGovernmentCambridge, MA
Joseph M. Mecane (Industry)BarclaysNew York, NY
Richard S. Pechter (Public)RetiredNew York, NY
John W. Schmidlin (Public)RetiredNew York, NY
Robert W. Scully (Public)RetiredNew York, NY
Leslie Seidman (Public)Former Chairman,Financial AccountingStandards BoardWestport, CT
Joel Seligman (Public)University of RochesterRochester, NY
Luis M. Viceira (Public)Harvard Business SchoolBoston, MA
Elisse B. Walter (Public)RetiredBethesda, MD
Seth H. Waugh (Industry)Deutsche Bank AmericasNew York, NY
James D. Weddle (Industry)Edward JonesSt. Louis, MO
Visit www.finra.org/leadershipfor more information.
FINRA OfficersRichard G. KetchumChairman andChief Executive Officer
F. Gregory AhernExecutive Vice President,Corporate Communications andGovernment Relations
Susan F. AxelrodExecutive Vice President,Regulatory Operations
J. Bradley BennettExecutive Vice President,Enforcement
Richard W. BerryExecutive Vice President andDirector of Dispute Resolution
Robert L. D. ColbyExecutive Vice President andChief Legal Officer
Carlo V. di FlorioChief Risk Officer andHead of Strategy
Todd T. DiganciExecutive Vice President andChief Financial Officer
Cameron K. FunkhouserExecutive Vice President,Office of Fraud Detection andMarket Intelligence
Thomas R. GiraExecutive Vice President,Market Regulation
Steven A. JoachimExecutive Vice President,Transparency Services
Derek W. LindenExecutive Vice President,Registration and Disclosure
John F. MalitzisExecutive Vice President,Market Regulation
66 FINRA 2014 Year in Review and Annual Financial Report

ˆ200Gkw!qakGTJfM@ÁŠ 200Gkw!qakGTJfM@`
927550 FIN 67FINRAANNUAL REPORT
29-Jun-2015 10:36 ESTCLN PSWDC
RR Donnelley ProFile SER lehml0cm 13*PMT 1C
NC8600AC071793211.6.19
Robert A. MarchmanExecutive Vice President,Market Regulation—LegalAdministration
Steven J. RandichExecutive Vice President andChief Information Officer
Michael G. RufinoExecutive Vice President,Head of Member Regulation—Sales Practice
Thomas M. SelmanExecutive Vice President,Regulatory Policy andLegal Compliance Officer
Daniel M. SibearsExecutive Vice President,Regulatory Operations—SharedServices
William J. WollmanExecutive Vice President,Member Regulation—Risk Oversight andOperational Regulation
FINRA CorporateOffices1735 K Street, NWWashington, DC 20006
(202) 728-8000
9509 Key West AvenueRockville, MD 20850
(301) 590-6500
9513 Key West AvenueRockville, MD 20850
(301) 590-6500
15201 Diamondback DriveSuite 250
Rockville, MD 20850
(301) 590-6500
15200 Omega DriveSuite 210
Rockville, MD 20850
(240) 386-4000
15200 Omega DriveSuite 300
Rockville, MD 20850
(301) 258-8500
One Liberty Plaza165 BroadwayNew York, NY 10006
(212) 858-4000
Brookfield Place200 Liberty StreetNew York, NY 10281
(212) 416-0600
FINRA DistrictOfficesAtlantaOne Securities Center3490 Piedmont Road, NESuite 500
Atlanta, GA 30305
(404) 239-6100
(404) 237-9290 (fax)
Boca RatonBoca Center Tower 1
5200 Town Center CircleSuite 200
Boca Raton, FL 33486
(561) 443-8000
(561) 443-7995 (fax)
Boston99 High StreetSuite 900
Boston, MA 02110
(617) 532-3400
(617) 451-3524 (fax)
Chicago55 West Monroe StreetSuite 2700
Chicago, IL 60603
(312) 899-4400
(312) 606-0742 (fax)
Dallas12801 North Central ExpresswaySuite 1050
Dallas, TX 75243
(972) 701-8554
(972) 716-7646 (fax)
Denver4600 South Syracuse StreetSuite 1400
Denver, CO 80237
(303) 446-3100
(303) 620-9450 (fax)
Kansas City120 West 12th StreetSuite 800
Kansas City, MO 64105
(816) 421-5700
(816) 421-5029 (fax)
Long IslandTwo Jericho Plaza2nd Floor, Wing AJericho, NY 11753
(516) 827-6100
(516) 827-6101
Los Angeles300 South Grand AvenueSuite 1600
Los Angeles, CA 90071
(213) 229-2300
(213) 617-3299 (fax)
New Jersey581 Main StreetSuite 710
Woodbridge, NJ 07095
(732) 596-2000
(732) 596-2001 (fax)
New Orleans1100 Poydras StreetEnergy CentreSuite 850
New Orleans, LA 70163
(504) 522-6527
(504) 522-4077 (fax)
New YorkBrookfield Place200 Liberty StreetNew York, NY 10281
(212) 858-4000
(212) 858-4189 (fax)
Philadelphia1835 Market StreetSuite 1900
Philadelphia, PA 19103
(215) 665-1180
(215) 496-0434 (fax)
FINRA 2014 Year in Review and Annual Financial Report 67

ˆ200Gkw!qakGTKodWCŠ200Gkw!qakGTKodWC
927550 FIN 68FINRAANNUAL REPORT
29-Jun-2015 10:36 ESTCLN PSWDC
RR Donnelley ProFile SER lehml0cm 10*PMT 1C
NC8600AC071793211.6.19
San FranciscoOne Montgomery StreetSuite 2100
San Francisco, CA 94104
(415) 217-1100
(415) 956-1931 (fax)
Seattle601 Union StreetSuite 1616
Seattle, WA 98101
(206) 624-0790
(206) 623-2518 (fax)
FINRA MarketRegulationRegional Offices55 West Monroe StreetSuite 2600
Chicago, IL 60603
(312) 899-4504
(312) 236-9257 (fax)
440 South LaSalle StreetSuite 3500
Chicago, IL 60605
Brookfield Place200 Liberty StreetNew York, NY 10281
(212) 416-0600
1835 Market StreetSuite 1900
Philadelphia, PA 19103
(215) 665-1180
(215) 496-0434 (fax)
220 Montgomery StreetSuite 200
San Francisco, CA 94104
(415) 835-4860
(301) 339-7545 (fax)
FINRA DisputeResolutionRegional OfficesMidwest Region55 West Monroe StreetSuite 2600
Chicago, IL 60603
(312) 899-4440
(312) 236-9239 (fax)
Northeast RegionOne Liberty Plaza165 Broadway27th FloorNew York, NY 10006
(212) 858-4200
(301) 527-4873 (fax)
Southeast RegionBoca Center Tower 1
5200 Town Center CircleSuite 200
Boca Raton, FL 33486
(561) 416-0277
(301) 527-4868 (fax)
West Region300 South Grand AvenueSuite 900
Los Angeles, CA 90071
(213) 613-2680
(301) 527-4766 (fax)
68 FINRA 2014 Year in Review and Annual Financial Report
ˆ200Gkw!qa!FZH@f7?Š200Gkw!qa!FZH@f7?
927550 BACK 1FINRAANNUAL REPORT
02-Jun-2015 23:50 ESTCLN PSWDC
RR Donnelley ProFile SER bandp0dcSTART PAGE
9*PMT 1C
serdoc111.6.19
This Annual Financial Report and the information contained herein is for general educational and informational purposesonly and is not intended for trading purposes and may not be used or relied upon in any manner whatsoever by personsconsidering or making investment decisions. The information contained herein is only timely as of the date of this reportand the information, estimates and expressions of judgment herein are subject to change without notice. To the extentthis Annual Financial Report contains statements that are not recitations of historical fact, such statements mayconstitute “forward-looking statements”. In this respect, the words “estimate,” “project,” “anticipate,” “expect,” “intend,”“believe,” and similar expressions are intended to identify forward-looking statements. Forward-looking statements arebased on current expectations of future events and are subject to risks and uncertainties that could cause actual results todiffer materially from those expressed or implied by such statements. All forward-looking statements included in thisSection are made only as of the date of the statement, and FINRA assumes no obligation to update any forward-lookingstatements made by them as a result of new information, future events, or other factors. Although FINRA takes reasonablecare to ensure that the information contained in the Annual Financial Report is accurate, the information is provided “asis” and FINRA makes no representations or warranties, express or implied, regarding the information contained herein,including but not limited to any warranties regarding the accuracy, completeness or timeliness of the informationprovided herein. Use of or reliance upon this Annual Financial Report or the information contained herein for any purposeis at the user’s own risk and discretion. Neither FINRA nor any of its respective affiliates, directors, officers, registeredrepresentatives or employees, nor any third party vendor, will be liable or have any liability, whether in contract, tort, strictliability or otherwise, for any direct, indirect, incidental, consequential, punitive or special damages arising out of or in anyway connected with your access or use or inability to access or use the Annual Financial Report or reliance on its content.Persons considering or making investment decisions should refer to the annual, quarterly and current reports, proxystatements and other information filed by the prospective investment vehicle with the Securities and ExchangeCommission (SEC) under the Securities Exchange Act of 1934, as amended. Such reports and other information may beread and copied at the SEC’s Public Reference Room at 100 F Street, N.E., Washington, DC 20549 or obtained by mail fromthe Public Reference Room at prescribed rates. Such reports and other information are also available at the SEC’s InternetWeb site, www.sec.gov. This Annual Financial Report does not incorporate by reference any other document orinformation.
© Copyright 2015. Financial Industry Regulatory Authority, Inc. All Rights Reserved. FINRA is a trademark of FinancialIndustry Regulatory Authority, Inc. No portion of this document may be duplicated, republished, modified, redistributed, ormanipulated in any form without prior written permission from FINRA.
FINRA 2014 Year in Review and Annual Financial Report

Investor protection. Market integrity. 1735 K Street NWWashington, DC20006-1506
www.finra.org© 2015 FINRA. All rights reserved.FINRA and other trademarks of the Financial Industry Regulatory Authority, Inc. may not be used without permission.15_0162.2—06/15