finite element parametric study on the performance of
TRANSCRIPT

73
Finite Element Parametric Study on the Performance of Geosynthetic Reinforced Soil–Integrated Bridge System (GRS-IBS)
Allam Ardah1 and Murad Abu-Farsakh2
1 Ph.D Candidate, Department of Civil and Environmental Engineering, Louisiana State University, Baton Rouge, LA 70803. 2 Research Professor, Louisiana Transportation Research Center, Louisiana State University, Baton Rouge, LA 70808. (Corresponding author).
ABSTRACT This paper presents a numerical investigation of the performance of geosynthetic reinforced soil integrated bridge system (GRS-IBS). The numerical simulations were conducted using two-dimensional (2D) PLAXIS 2016 FE program. The hardening soil model proposed by Schanz et al. (1999) was used to simulate the behavior of the backfill material; the interface between the backfill materials and the reinforcement was simulated using the Mohr-Coulomb frictional model, and the reinforcement and facing block were simulated using the linear elastic model. A FE parametric study was conducted to evaluate the effect of internal friction angle, 𝜙𝜙, width of reinforcement soil footing (RSF), BRSF, secondary reinforcement (bearing bed reinforcement), and setback distance, ab, on the performance of the GRS-IBS in terms of lateral facing displacement, maximum strain along the reinforcement, and maximum strain envelope. The FE results indicates that the internal friction angle and both the setback distance and width of strip footing have siginficant and medium impact, respectively, on the performance of the GRS-IBS in terms of strain distribution along the reinforcemnt. However, it was found that width of RSF and the length of reinforcement have no impact on the performance of GRS-IBS in terms of strain distribution and lateral facing deformation. Finally, based on the parametric study, the potential failure envelope of the GRS-IBS abutment was found to be a combination of punching shear failure envelope (top) and Rankine failure envelope (bottom), in which the failure envelope is developed under the inner edge of the footing and extending vertically downward to intersect with the Rankine active failure envelope. Keywords: Geosynthetics, Parametric Study, Reinforced soil, Geosynthetic Reinforced Soil (GRS), Integrated Bridge System (IBS), Finite Element analysis, Bridge abutment. INTRODUCTION Geosynthetic reinforced soil (GRS) can be defined as a special reinforced soil with closely geosynthetic fabric stacked in layers as a soil stabilization, which is considered as an alternative design method to the conventional bridge support technology. Although the GRS has been around for a while, its uses as part of integrated bridge system (IBS) is fairly new. Using the geosynthetics as reinforcement in retaining walls, slopes and embankment started many years ago (Allen et al., 1992). The Geosynthetic Reinforced Soil (GRS) walls and Mechanically Stabilized Earth Walls (MSE) are getting more attention these days over the traditional concrete walls due to the ease of

74
construction, cost saving, and reduction in construction time (Adams et al. 2011). Abu Hejleh et al. (2000) pointed out that the GRS and MSE walls can support the roadway structures and traffic loads in addition to the support of the self-weight of the backfill soil.
According to the Federal Highway Administration (FWHA) (Adams et al. 2011), the GRS-IBS usually includes a GRS abutment, a GRS integrated approach, and a reinforced soil foundation. The main difference between the GRS walls and mechanically stabilized earth (MSE) walls is the reinforcement tensions and soil stresses are assembled in a different way than in the case of MSE walls. Many researchers demonstrated the importance of reinforcement spacing over the reinforcement stiffness in case of GRS walls. They found out that the reinforcement spacing plays a significant role in the performance and carrying capacities of the GRS-IBS (e.g., Hatami and Bathurst 2005, 2006; Adams et al. 2011; Zheng and Fox, 2016; Ardah et al. 2018). The main difference between the MSE walls and the GRS walls is that the MSE walls considered externally supported system, in which the facing block is structurally connected to the reinforcement; while the GRS walls considered an internally supported system, in which the facing block is not a structure element but rather an aesthetic component. Wu (2007) introduced the “bin pressure” concept to estimate the lateral earth pressure of tightly reinforced soils at the facing. He found out that the lateral earth pressure is mainly depends on the reinforcement spacing rather than the height of the GRS wall. NUMERICAL MODEL The finite element method of analysis program PLAXIS 2D 2016 (Brinkgreve, 2002) was used in this study to investigate the effect of different variables and parameters on the performance of GRS-IBS. The model was verified using the field measurement of the instrumented Maree Michel GRS bridge abutment (Saghebfar et al. 2017a,2017b, Abu Farsakh et al. 2017, 2018a, 2018b, 2018c). The results of numerical simulation were in good agreement with the field measurements during the construction process and after the bridge was open to traffic loading (Ardah et al. 2017). Figure1 presents the finite element grid and the boundary conditions that was used in this study. Mesh sensitivity technique was first conducted to select the mesh-size where the numerical results are not mesh-size dependent. It can be seen in Figure 1 that the dimensions of the model domain were extended three times the abutment height in the x-direction and one and half times in the y-direction to minimize the effect of boundary conditions on the model response. A roller support was selected to prevent the lateral movement of the soil in the x-direction. The bottom of the domain was fixed by bin support to prevent soil movement in both the lateral and vertical direction. FE PARAMETRIC STUDY Six different parameters were considered in this study to investigate the performance of the GRS-IBS under live loading condition (service loading) in terms of lateral facing displacement, maximum strain along the reinforcement, and maximum strain envelope. The selected parameters are: effect of internal friction angle, 𝜙𝜙, width of reinforcement soil footing, BRSF, secondary reinforcement, and setback distance, ab. The abutment height was selected to be 7.0 m having a reinforcement spacing and stiffness of 0.2 m and 600 kN/m, respectively, with a span length of 36.6 m subjected to an equivalent distributed roadway live load of 12 kPa. The bridge girders were simulated as solid blocks similar to a previous study conducted by Zheng and Fox (2017), assuming the bridge span length to depth ratio equal to 24 (Lspan/D = 24), composed of elastic

75
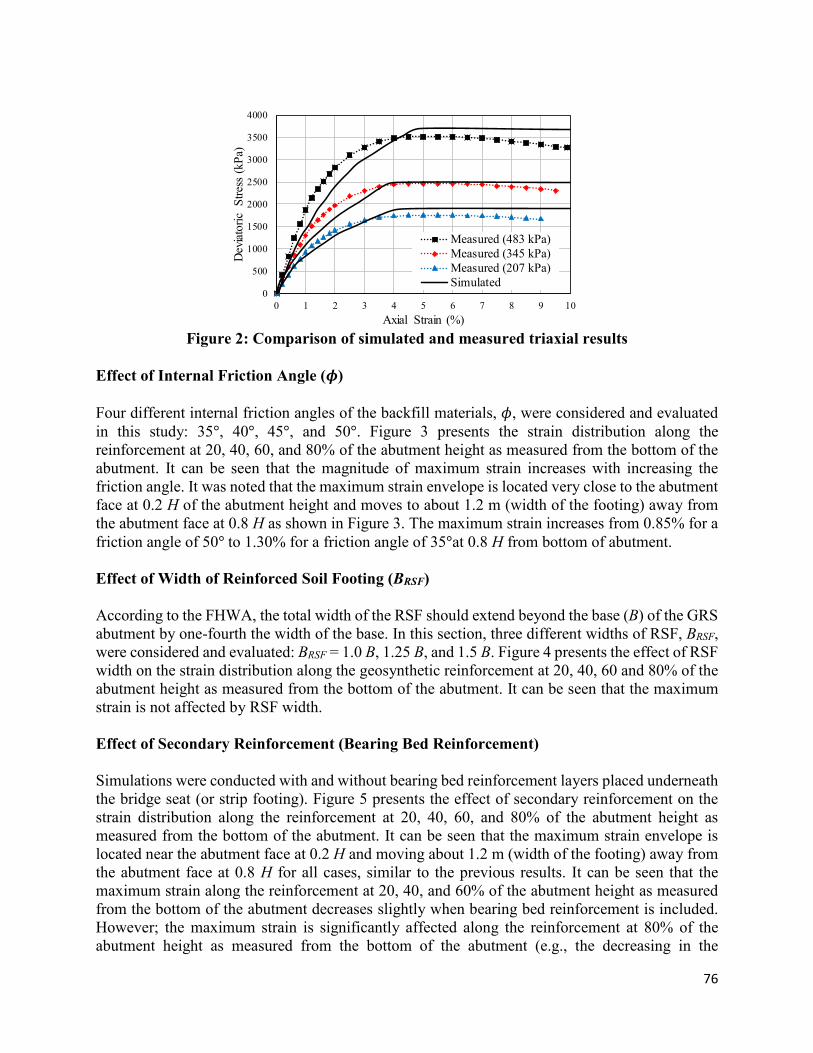
elements with an equivalent unit of 11.86 kN/m3 and elastic modulus E= 20 GPa. The selected constitutive models materials properties are listed in Table 1. The triaxial and large direct shear testing method were conducted to evaluate the strength and stiffness of the backfill materials properties. A total of three triaxial testing were conducted at three different confining pressures of 207, 345, and 483 kPa for a soil specimen size of 15.24 cm diameter and 30.48 cm height. Figure 2 presents the simulated and measured stress-strain curve for the backfill materials.
Figure 1: GRS-IBS numerical model with geometry and boundaries conditions.
Table1: Materials Properties
Category Description Facing Block Linear elastic model; E = 3×10⁷ kPa,; 𝛾𝛾=12.5 kN/m3; dimensions,
40.64×20.32×20.32 cm; Poisson’s ratioa, 𝜈𝜈 = 0 Geotextile linear elastic perfectly plastic model; Tensile strength @ 2% = 13×17 kN/m,
Tensile strength @ 5% = 35×40 kN/m; Tult = 80 kN/m; reinforcement spacing = 0.2 m; Axial stiffness, EA= 600 kN/m.
Backfill Material Hardening soil model; dry unit weight, 𝛾𝛾d= 18 kN/m /m3; wet unit weight, 𝛾𝛾t=19 kN/m /m3; cohesion, c =20 kPa; friction angle, 𝜙𝜙 =51°; dilation angle 𝛹𝛹=21°; 𝐸𝐸50
𝑟𝑟𝑟𝑟𝑟𝑟=34,000 kPa, 𝐸𝐸𝑢𝑢𝑟𝑟𝑟𝑟𝑟𝑟𝑟𝑟= 103,200 kPa, 𝐸𝐸𝑜𝑜𝑟𝑟𝑜𝑜
𝑟𝑟𝑟𝑟𝑟𝑟=26,400, 𝜈𝜈= 0.2; power, m = 0.5
Foundation Soil Soil model, Mohr-Coulomb model; dry unit weight,𝛾𝛾d= 15.2 kN/m3; wet unit weight, 𝛾𝛾w=18.65 kN/m3; cohesion, c=17.7 kPa; 𝜙𝜙= 27°; E =30000 kPa; 𝜈𝜈= 0.2.
Interface (backfill and geotextile) linear elastic with Mohr-Coulomb failure criterion; adhesion, c=8.6 kPa; interface friction angle 𝛿𝛿=40.4°
Interface (block and geotextile) linear elastic with Mohr-Coulomb failure criterion; cohesion, c=7 kPa; friction angle 𝜙𝜙=34°
a The Poisson’s ratio of the facing block was selected based on a previous study conducted by Wu et al. (2013).
76
Figure 2: Comparison of simulated and measured triaxial results
Effect of Internal Friction Angle (𝝓𝝓) Four different internal friction angles of the backfill materials, 𝜙𝜙, were considered and evaluated in this study: 35°, 40°, 45°, and 50°. Figure 3 presents the strain distribution along the reinforcement at 20, 40, 60, and 80% of the abutment height as measured from the bottom of the abutment. It can be seen that the magnitude of maximum strain increases with increasing the friction angle. It was noted that the maximum strain envelope is located very close to the abutment face at 0.2 H of the abutment height and moves to about 1.2 m (width of the footing) away from the abutment face at 0.8 H as shown in Figure 3. The maximum strain increases from 0.85% for a friction angle of 50° to 1.30% for a friction angle of 35°at 0.8 H from bottom of abutment. Effect of Width of Reinforced Soil Footing (BRSF) According to the FHWA, the total width of the RSF should extend beyond the base (B) of the GRS abutment by one-fourth the width of the base. In this section, three different widths of RSF, BRSF, were considered and evaluated: BRSF = 1.0 B, 1.25 B, and 1.5 B. Figure 4 presents the effect of RSF width on the strain distribution along the geosynthetic reinforcement at 20, 40, 60 and 80% of the abutment height as measured from the bottom of the abutment. It can be seen that the maximum strain is not affected by RSF width. Effect of Secondary Reinforcement (Bearing Bed Reinforcement) Simulations were conducted with and without bearing bed reinforcement layers placed underneath the bridge seat (or strip footing). Figure 5 presents the effect of secondary reinforcement on the strain distribution along the reinforcement at 20, 40, 60, and 80% of the abutment height as measured from the bottom of the abutment. It can be seen that the maximum strain envelope is located near the abutment face at 0.2 H and moving about 1.2 m (width of the footing) away from the abutment face at 0.8 H for all cases, similar to the previous results. It can be seen that the maximum strain along the reinforcement at 20, 40, and 60% of the abutment height as measured from the bottom of the abutment decreases slightly when bearing bed reinforcement is included. However; the maximum strain is significantly affected along the reinforcement at 80% of the abutment height as measured from the bottom of the abutment (e.g., the decreasing in the
0
500
1000
1500
2000
2500
3000
3500
4000
0 1 2 3 4 5 6 7 8 9 10
Dev
iator
ic S
tress
(kPa
)
Axial Strain (%)
Measured (483 kPa)Measured (345 kPa)Measured (207 kPa)Simulated

77
maximum strain when the bearing bed reinforcement is included is equivalent to reducing the span length from 36.6 m to 30.5 m as shown in Figure 5). Effect of Setback Distance (ab) Simulations were conducted for five different setback distance ab = 0.2, 0.4, 0.6, 0.8, and 1.0 m from the abutment face. Figure 6 presents the effect of the setback distance on the strain distribution along the reinforcement at 20, 40, 60, and 80% of the abutment height as measured from the bottom of the abutment. It can be seen that the maximum strain along the reinforcement slightly increases by increasing the setback distance away from the abutment face due to increasing the span length associated with increasing the setback distance. It was noted that the maximum strain value is located right under the inner edge of the footing as shown in Figure 6. When the inner edge of footing moves, maximum strain location moves accordingly.
Figure 3: Effect of internal friction angle on the strain distribution along geosynthetics

78
Figure 4: Effect of width of RSF on the strain distribution along geosynthetics

79
Figure 5: Effect of secondary reinforcement on the strain distribution along geosynthetics
Bearing Bed area
0.00
0.20
0.40
0.60
0.80
1.00
1.20
0.00 1.00 2.00 3.00 4.00 5.00
Stra
in (%
)
Distance from wall (m)
Layer (0.8 H)
36.6 m30.5 m24.4 m18.3 m18.3 m without24.4 m without30.5 m without36.6 m without
0.00
0.20
0.40
0.60
0.80
1.00
1.20
0.00 1.00 2.00 3.00 4.00 5.00
Stra
in (%
)
Distance from wall (m)
Layer (0.6 H)
36.6 m30.5 m24.4 m18.3 m18.3 m without24.4 m without30.5 m without36.6 m without
0.00
0.20
0.40
0.60
0.80
1.00
1.20
0.00 1.00 2.00 3.00 4.00 5.00
Stra
in (%
)
Distance from wall (m)
Layer (0.4 H)
36.6 m30.5 m24.4 m18.3 m18.3 m without24.4 m without30.5 m without36.6 m without
0.00
0.20
0.40
0.60
0.80
1.00
1.20
0.00 1.00 2.00 3.00 4.00 5.00
Stra
in (%
)
Distance from wall (m)
Layer (0.2 H)36.6 m30.5 m24.4 m18.3 m18.3 m without24.4 m without30.5 m without36.6 m without

80
Figure 6: Effect of setback distance on the strain distribution along geosynthetics
0.00
0.20
0.40
0.60
0.80
1.00
1.20
0.00 1.00 2.00 3.00 4.00 5.00
Stra
in (%
)
Distance from wall (m)
Layer (0.8 H)
ab = 1.0 mab = 0.8 mab = 0.6 mab = 0.4 mab = 0.2 m
0.00
0.20
0.40
0.60
0.80
1.00
1.20
0.00 1.00 2.00 3.00 4.00 5.00
Stra
in (%
)
Distance from wall (m)
Layer (0.6 H)
ab= 1.0 mab= 0.8 mab= 0.6 mab= 0.4 mab= 0.2 m
0.00
0.20
0.40
0.60
0.80
1.00
1.20
0.00 0.50 1.00 1.50 2.00 2.50 3.00 3.50 4.00 4.50 5.00
Stra
in (
%)
Distance from wall (m)
Layer (0.4 H)
ab= 1.0 mab= 0.8 mab= 0.6 mab= 0.4 mab= 0.2 m
0.00
0.20
0.40
0.60
0.80
1.00
1.20
0.00 1.00 2.00 3.00 4.00 5.00
Stra
in (%
)
Distance from wall (m)
Layer (0.2 H) ab = 1.0 mab = 0.8 mab = 0.6 mab = 0.4 mab = 0.2 m
ab

81
It can be seen in Figures 3, 4, 5 and 6 that the changing in friction angle, , of backfill materials, with REF, secondary reinforcement, or length of reinforcement does not affect the maximum strain location. It was noted that the location of maximum strain envelope starts right under the inner edge of the strip footing on top of the GRS abutment and extending vertically downward for the top part of the bridge abutment and is followed by the general Rankine active failure envelope for the bottom part of the GRS-IBS abutment. These results led us to investigate the effect of width strip footing and setback distance, the location strip footing, on the location of the maximum strain envelope as was shown previously in Figure 6. It can be seen that the maximum strain location for the top part of the GRS abutment follows the inner edge of the strip footing as well. The potential failure envelope, the maximum strain locations, for the top half of the GRS abutment is very similar to the punching shear failure envelope defined by a previous study conducted by Chen et al. (2009) on reinforced crushed limestone underneath spread footing. Takemura et al. (1992) investigated the failure mechanism of reinforced sand by using centrifuge test. Their results showed that the intensely shear bands were developed from the edges of the footing and is extending vertically downward. It is interesting to notice that the results indicate that the failure envelope is a combination of punching shear failure envelope (top) and Rankine failure envelope (bottom), in which the failure envelope is developed under the inner edge of the footing and extending vertically downward to intersect with the Rankine active failure envelope as illustrated in Figure 7.
Figure 7: Illustration. Location of potential failure surface for internal stability design of GRS-IBS
CONCLUSIONS A FE parametric study was conducted to investigate the effect of different variables and parameters on the performance of geosynthetic reinforced soil integrated bridge system (GRS-IBS) using the two-dimensional (2D) PLAXIS 2016 FE program. The performance of GRS-IBS was evaluated in

82
terms of lateral facing deformation, reinforcement strain, and location of possible failure zone locus of maximum strain using FE method of analysis. The FE parametric study are: internal friction angle, 𝜙𝜙, width of reinforcement soil footing, BRSF, secondary reinforcement, and setback distance, ab, Based on the finding of this study, the following conclusions can be made: • The FE results showed that the internal friction angle, , has a significant influence on the
magnitude of maximum strain value and the lateral facing deformation. The maximum strain increases from 0.85% for a friction angle of 50° to 1.30% for a friction angle of 35°at 0.8 H from bottom of abutment. The maximum lateral facing displacement increases from 32 mm for a friction angle of 50° to about 52 mm for a reinforcement spacing of 35°.
• The maximum strain along the reinforcement at 20, 40, and 60% of the abutment height as measured from the bottom of the abutment decreases slightly when the bearing bed reinforcement is included. However, the maximum strain is significantly affected along the reinforcement at 80% of the abutment height as measured from the bottom of the abutment.
• The maximum strain along the reinforcement slightly increases by increasing the setback distance away from the abutment face due to increasing the span length associated with increasing the setback distance.
• It was noted that the location of the maximum strain location is associated with the bearing width, in which the maximum strain envelope is located right under the inner edge of the bearing width for the reinforcement layer at 0.8 H of the abutment height as measured from the bottom of the abutment. This result is very similar to the punching shear failure envelope defined by a previous study conducted by Chen et al. (2009).
• The critical slip surface was determined based on the parametric study analysis by selecting the locus of the maximum strain (maximum tensile force) throughout the reinforcement layers.
REFERENCES Abu-Farsakh, M., Saghebfar, M., Ardah, A. and Chen, Q., 2017. A Case Study on Evaluating the
Performance of a Geosynthetic Reinforced Soil Integrated Bridge System (GRS-IBS). In: Geotechnical Frontiers, pp. 12-22.
Abu-Farsakh, M., Ardah, A. and Voyiadjis, G., 2018a. Numerical Investigation of the Performance of Geosynthetic Reinforced Soil–Integrated Bridge System (GRS-IBS) Subjected to Differential Settlement (No. 18-01788).
Abu-Farsakh, M., Ardah, A. and Voyiadjis, G., 2018b. 3D Finite element analysis of the geosynthetic reinforced soil-integrated bridge system (GRS-IBS) under different loading conditions. Transportation Geotechnics, 15, pp.70-83.
Abu-Farsakh, M., Ardah, A. and Voyiadjis, G., Numerical Investigation of the Performance of a Geosynthetic Reinforced Soil-Integrated Bridge System (GRS-IBS) under Working Stress Conditions. In IFCEE 2018c (pp. 76-87).
Abu-Hejleh, N., Wang, T. and Zornberg, J.G., 2000. Performance of geosynthetic-reinforced walls supporting bridge and approaching roadway structures. In: Advances in transportation and geoenvironmental systems using geosynthetics, pp. 218-243.
Adams, M., Nicks, J., Stabile, T., Wu, J., Schlatter, W. and Hartmann, J., 2011. Geosynthetic Reinforced Soil Integrated Bridge System, Interim Implementation Guide (No. FHWA-HRT-11-026).

83
Ardah, A., Abu-Farsakh, M. and Voyiadjis, G., 2017. Numerical evaluation of the performance of a Geosynthetic Reinforced Soil-Integrated Bridge System (GRS-IBS) under different loading conditions. In: Geotextiles and Geomembranes.
Ardah, A., Abu-Farsakh, M.Y. and Voyiadjis, G.Z., 2018. Numerical Evaluation of the Effect of Differential Settlement on the Performance of GRS-IBS. Geosynthetics International, pp.1-45.
Brinkgreve, R.B.J. (Ed.), 2002. Plaxis: Finite Element Code for Soil and Rock Analyses: 2D-version 8:[user's Guide]. Balkema.
Bathurst, R. J., Walters, D., Vlachopoulos, N., Burgess, P., & Allen, T. M. (2000). Full scale testing of geosynthetic reinforced walls. In Advances in transportation and geoenvironmental systems using geosynthetics (pp. 201-217).
Chen, Q., Abu-Farsakh, M. and Sharma, R., 2009. Experimental and analytical studies of reinforced crushed limestone. Geotextiles and Geomembranes, 27(5), pp.357-367.
Hatami, K., & Bathurst, R. J. (2005). Development and verification of a numerical model for the analysis of geosynthetic-reinforced soil segmental walls under working stress conditions. Canadian Geotechnical Journal, 42(4): 1066-1085.
Hatami, K., & Bathurst, R. J. (2006). Numerical model for reinforced soil segmental walls under surcharge loading. Journal of Geotechnical and Geoenvironmental engineering, 132(6), 673-684.
Saghebfar, M., Abu-Farsakh, M., Ardah, A., Chen, Q. and Fernandez, B.A., 2017a. Performance monitoring of Geosynthetic Reinforced Soil Integrated Bridge System (GRS-IBS) in Louisiana. Geotextiles and Geomembranes, 45(2), pp.34-47.
Saghebfar, M., Abu-Farsakh, M.Y., Ardah, A., Chen, Q. and Fernandez, B.A., 2017b. Full-Scale Testing of Geosynthetic-Reinforced, Soil-Integrated Bridge System. Transportation Research Record: Journal of the Transportation Research Board, (2656), pp.40-52.
Schanz, T., Vermeer, P.A. and Bonnier, P.G., 1999. The hardening soil model: formulation and verification. Beyond 2000 in computational geotechnics, pp.281-296.
Wu, J. T. H. (2007). "Lateral Earth Pressure against the Facing of Segmental GRS Walls." Geosynthetics in Reinforcement and Hydraulic Applications (GSP 165), Gabr, and Bowders (Eds.). ASCE, Reston, VA, 165-175.
Wu, J.T., Pham, T.Q. and Adams, M.T., 2013. Composite behavior of geosynthetic reinforced soil mass (No. FHWA-HRT-10-077).
Zheng, Y. and Fox, P.J., 2016. Numerical Investigation of Geosynthetic-Reinforced Soil Bridge Abutments under Static Loading. Journal of Geotechnical and Geoenvironmental Engineering, 142(5), p.04016004.
Allen, T.M., Christopher, B.R. and Holtz, R.D., 1992. Performance of a 41 Foot High Geotextile Wall: Final Report, Experimental Feature WA87-03. Washington State Department of Transportation, Planning, Research and Public Transportation Division.