finite element and plate theory modeling of acoustic ... · the second approach used a dynamic...
TRANSCRIPT
1
Finite Element and Plate Theory Modeling of Acoustic Emission Waveforms
W. H. Prosser, M. A. Hamstad+*, J. Gary+, and A. O’Gallagher+
NASA Langley Research Center
Hampton, VA 23681-0001
*University of Denver
Denver, CO 80208
+National Institute of Standards and Technology
Boulder, CO 80303
Submitted to the Journal of Nondestructive Evaluation - May, 1998
This is a contribution of the U.S. National Institute of Standards and Technology; not
subject to copyright in US.
ABSTRACT
A comparison was made between two approaches to predict acoustic emission waveforms in
thin plates. A normal mode solution method for Mindlin plate theory was used to predict
the response of the flexural plate mode to a point source, step-function load, applied on the
plate surface. The second approach used a dynamic finite element method to model the
problem using equations of motion based on exact linear elasticity. Calculations were made
using properties for both isotropic (aluminum) and anisotropic (unidirectional
graphite/epoxy composite) materials. For simulations of anisotropic plates, propagation
along multiple directions was evaluated. In general, agreement between the two theoretical
approaches was good. Discrepancies in the waveforms at longer times were caused by
differences in reflections from the lateral plate boundaries. These differences resulted from
the fact that the two methods used different boundary conditions. At shorter times in the
signals, before reflections, the slight discrepancies in the waveforms were attributed to
https://ntrs.nasa.gov/search.jsp?R=20040086809 2018-07-12T00:10:52+00:00Z
2
limitations of Mindlin plate theory, which is an approximate plate theory. The advantages of
the finite element method are that it used the exact linear elasticity solutions, and that it can
be used to model real source conditions and complicated, finite specimen geometries as well
as thick plates. These advantages come at a cost of increased computational difficulty,
requiring lengthy calculations on workstations or supercomputers. The Mindlin plat theory
solutions, meanwhile, can be quickly generated on personal computers. Specimens with
finite geometry can also be modeled. However, only limited simple geometries such as
circular or rectangular plates can easily be accommodated with the normal mode solution
technique. Likewise, very limited source configurations can be modeled and plate theory is
applicable only to thin plates.
Key Words: Acoustic Emission, Plate Theory, Finite Element Modeling
INTRODUCTION
The ability to accurately model acoustic emission (AE) waveforms offers significant
potential for improving the interpretation of AE data. Applications of such models include
the determination of optimal placement of sensors in an AE test, the scaling of AE results
from laboratory coupons to structures of practical interest, the calibration of transducers,
and insight into inversion of AE data to eliminate extraneous noise and identify source
mechanisms. However, in much of the early work (1-4) on modeling AE waveforms,
approaches introduced in seismology have been applied to model the propagation of bulk
and surface waves. Such models could be used to predict waveforms only in an infinite
half-space, or in a plate of infinite lateral extent. In the plate geometry, the results were valid
only for short propagation distances of less than ten plate thicknesses.
The geometries of many practical structures of interest for AE monitoring, though, are
neither infinite in lateral extent, nor composed of thick plates or large components where

3
propagation of bulk waves is dominant. Thin plates, pipes, shells, rods, and beams are
common. In such geometries, the distance from the receiver to the AE source is often many
times the specimen thickness and the wave propagation is dominated by guided modes.
Much experimental effort recently (5-10) has focused on guided wave propagation effects in
the interpretation of AE signals. This research has led to improved accuracy in the locating
the sources of emission, to the ability to better discriminate and eliminate extraneous noise
signals, and to enhanced identification of AE sources.
Following this trend, recent theoretical efforts to model AE waveforms have also considered
guided wave propagation. Integral transform techniques have been used to predict the Lamb
wave response for AE sources in anisotropic composite materials (11-12). Solutions were
obtained for both exact elasticity theory and approximate laminated plate theory, and were
shown to be in agreement with experimental observations. However, a limitation of this
theoretical approach is that it again assumes a geometry of an infinite plate thus ignoring
reflections from plate edges. A normal mode solution technique for classical plate theory
has also been used to provide solutions for the flexural plate mode (lowest order
antisymmetric Lamb mode) in plates with finite geometries (13). Results for predictions of
the flexural plate mode in an isotropic material were shown to agree with experimental
observations of simulated AE signals for very low frequencies where this theory is valid.
The extension of this solution technique to Mindlin plate theory (MPT) (14) which more
accurately predicts the flexural plate mode at higher frequencies, is considered in this paper.
Such an approach was also recently used for the prediction of flexural plate mode AE
waveforms in isotropic plates and shown to be in agreement with experimental
measurements of simulated AE signals (15). In that work, solutions were also developed for
the Mindlin-Medick plate theory to predict the extensional mode in isotropic plates as well.
However, comparisons with exact linear elasticity solutions did not provide as good an
agreement. A dynamic finite element method (DFEM) has been developed for predicting

4
AE waveforms in the far field in plates (16-17). This approach also allows the consideration of
plates of finite lateral extent. Theoretical predictions from this method were shown to be in
good agreement with experimental measurements of signals generated by a simulated AE
source.
In this research, theoretical predictions were compared from both DFEM and MPT for the
flexural plate mode component of a simulated AE signal. Calculations were made with both
isotropic (aluminum) and anisotropic (unidirectional graphite/epoxy) material properties.
For the anisotropic material, several different directions of propagation were considered.
The DFEM has a number of advantages in that it is based on exact linear elasticity theory
and can be used for both isotropic and anisotropic media. Additionally, the method has the
potential to model realistic structural geometries to include propagation effects such as
signal reflections. Realistic source geometries such as buried dipole sources can also be
modeled. However, the DFEM calculations are computationally intensive requiring both
significant memory and processor time. Currently, they can be made only on workstation
or higher-class machines, and models take many hours or days to complete. The normal
mode solutions to MPT are much less computationally demanding. They can be made on
personal computers within minutes. Although both isotropic and anisotropic materials, as
well as finite geometries, can be modeled, source configurations and specimen geometries
which can be considered are limited. Also, MPT is an approximate theory and useful only
for predicting the flexural mode response. Other plate theories, such as the Mindlin-
Medick plate theory can predict the extensional mode, but typically do not provide as good
an agreement with experimental measurements or predictions based on exact elasticity (15).
MINDLIN PLATE THEORY

5
Mindlin (14) improved on classical plate theory for isotropic media by including the effects
of shear deformation and rotatory inertia. This approach was later extended to anisotropic
laminated composites (18) and used to predict flexural mode dispersion (19) in composites.
The normal mode solution technique of MPT used in this research was developed for
predicting the response of an orthotropic laminated plate to an impact (20). However, waves
propagating away from the impact site were not considered in that work, as solutions were
examined for the displacement only at the position of impact. More recently, the normal
mode solution for MPT was used to model AE waveforms (15). However, results only for
isotropic materials were presented.
As the derivations of MPT and the normal mode solution approach are available in the
references mentioned above, they are not repeated in detail here. A specially orthotropic
composite laminate, which is a symmetric laminate with plies in the 0 and/or 90 degree
directions only, is assumed with the z axis normal to the plate. The normal mode solution
for the z axis displacement (w) is presented. The plate was assumed to be rectangular with a
thickness (h), length (a) along the x axis, and width (b) along the y axis. Simply supported
boundary conditions were assumed along the plate edges. The material properties were the
density (ρ), the classical laminated plate bending stiffness coefficients (D11 , D12 , D22 , and
D66), and shear correction bending stiffnesses (A44 and A55). A step function point load of
amplitude P was assumed to occur on the plate surface at x = ξ, y = ζ, and time, t = 0.
The resulting displacement (w) at any point (x,y) as a function of time is then given by
w(x, y, t) = 4Phab m=1
∞
∑n=1
∞
∑ sin n x sin m y sin n sin m (1 − cos nmt)
nm2 , (1)
where
n = na
, m = mb
, (2)

6
and
nm2 = nm
2
(1+ nm2
Enm2
)
. (3)
In Equation (3),
nm2 =
D11 n4 + D22 m
4 + 2(D12 + 2D66 ) n2
m2
h , (4)
and
Enm2 =
A44 m2 + A55 n
2
h . (5)
The term βnm represents the frequency for the given normal mode. An approximate solution
is obtained by calculating the summations up to given values of n and m. The resulting
waveform then contains frequencies only up to the value of βnm for these maximum values.
For all calculations in this work, a total of n = m = 200 normal modes were summed.
For an isotropic material, the following relationships hold between the plate stiffness
coefficients and the Young’s modulus (E), Poisson’s ratio (ν), and the shear modulus (G):
D11 = D22 = D = Eh3
12(1− 2 ) , (6)
D12 = D = Eh 3
12(1− 2 ) , (7)
D66 = (1 − )2
D = (1 − )Eh 3
24(1− 2 ) , (8)
and

7
A44 = A55 = k2 Gh , (9)
where
G = E2(1+ )
. (10)
and κ is the shear correction coefficient. A value of 5/6 for κ2 has been derived for
materials which are homogeneous through the thickness of the plate (20). This was the case
for both the aluminum and the unidirectional graphite/epoxy modeled in this work.
DYNAMIC FINITE ELEMENT METHOD
The DFEM used in this research has been reported elsewhere (16,17) and the details are not
repeated here. Both a two-dimensional, cylindrically symmetric model (16), which is useful
for isotropic materials, and a three-dimensional model (17), which can handle anisotropic
media, have been developed. The results from both models have been compared with
experimental waveforms generated by simulated sources (pencil lead fractures) on a plate
surface and acquired with an absolutely calibrated sensor. Model predictions and
experimental measurements were in excellent agreement for isotropic materials. Because of
the lower complexity and memory requirements of the two-dimensional approach, models
can be run with either decreased cell size (increased spatial resolution) or much shorter
calculation times. However, in addition to modeling anisotropic media, the three-
dimensional approach is required to model realistic specimen geometries (other than a
round plate with the source at the center) as well as realistic sources such as a non-
axisymmetric buried dipole.
In both cases a leapfrog approximation in time and linear elements in space is used. Stress
free boundary conditions are assumed along the top and bottom surfaces as well as along
the outer edges of the plate. To model a step function in the DFEM, a linear ramp with rise

8
time smaller than the time step can be used. However, such a fast rise time can produce
numerical transients in the calculated signal. For these calculations, the time step was
approximately 0.02 µs while the rise time of the linear ramp source was 0.1 µs The effect
of this rise time was evaluated by increasing it up to several microseconds in otherwise
identical model calculations. For rise times of less than 1 µs, no differences were observed
in the calculated flexural waveforms, which suggested that the linear ramp source with rise
times over this range converged to a step function source for this mode. Likewise, the point
source used in the plate theory calculations could not be modeled by the DFEM. The
previous work has shown that the source diameter must be at least four time the cell
dimension for sources with fast rise times to avoid introducing high frequency numerical
transients. For all of these calculations, this minimum source size was used. For the high
spatial resolution used in the two-dimensional model, this source diameter was quite small
and approximated a point source well. As with the source rise time, the effect of the source
diameter on the model results were evaluated by increasing the diameter up to several times
the minimum value. Again, no effect was observed on the calculated waveforms. Because
of the limited spatial resolution of the three-dimensional model, the minimum source
diameter was larger. However, good agreement with the plate theory calculations was still
observed.
ISOTROPIC MATERIAL (ALUMINUM)
The material properties for aluminum were used for both MPT and DFEM calculations.
The density was assumed to be 2770 kg/m3, Young’s modulus to be 73.0 GPa, and
Poisson’s ratio to be 0.3. The plate thickness was taken as 3.175 mm. For MPT, a
rectangular plate geometry was modeled with a length along x of 0.508 m and width along y
of 0.381 m. The source was positioned at x = 0.254 m, y = 0.127 m. Five different receiver

9
positions were modeled, all along the x = 0.254 m line, at positions ranging from y = 0.2032
m to 0.3048 m at intervals of 2.54 cm. Thus, the distance from the source to the receiver
varied from 7.62 cm to 17.78 cm (24 to 56 plate thicknesses). For the two-dimensional
DFEM calculations, the radius was assumed to be 0.254 m, with the source positioned at the
center of the plate (r = 0). The cell size, which was uniform in r and z, was 0.079 mm
which provided 40 elements through the thickness. Again, five receivers were modeled at
positions ranging from 7.62 cm to 17.78 cm in 2.54 cm intervals. So that only the
asymmetric Lamb modes could be obtained from the DFEM results, simulated point
receivers were placed both on top and bottom of the plate in the model. Then, by adding the
signals from the top and bottom for a given location and dividing by two, the symmetric
Lamb mode components were eliminated leaving only the asymmetric components. For
both model calculations, the amplitude of the monopole source force function was assumed
to be 1 N.
In Fig. 1, the model waveforms from both methods at propagation distances of 7.62, 12.7,
and 17.78 cm are compared over a full 150 µs time scale. Overall, the agreement between
the two methods is good. At longer times, there is some discrepancy between the signals,
which was attributed to the effect of differences in reflections from plate edges. As the plate
geometries and boundary conditions are different for the two methods, agreement in the
prediction of reflected signals is not expected. The significant dispersion of this mode is
observed when looking at the changes in the signal shape at different distances of
propagation. Fig. 2 shows the same signals but at expanded time scales for the early arrival
portion of the signals. More discrepancy between the two methods is observed for the
higher frequencies in the early arrival. There are several possible explanations for these
differences. The first could be the difference in the input force function between the step
function used for MPT and the fast rise time linear ramp used for DFEM. However, the
effect of varying the rise time was investigated and it is not believed that this is a significant

10
contribution to the differences. Another explanation could be the difference between the
source diameter from the point source assumed in the plate theory model and the finite, but
small, source used for the finite element calculations. Again, this was evaluated with the
DFEM by varying the source diameter, with no significant changes observed. The final and
most likely cause of the discrepancies is due to the approximate nature of MPT. Since the
DFEM is based on exact linear elasticity and has been confirmed by comparison with
experimental measurements, it is assumed that the differences observed are due to
limitations of MPT.
ANISOTROPIC MATERIAL (GRAPHITE/EPOXY)
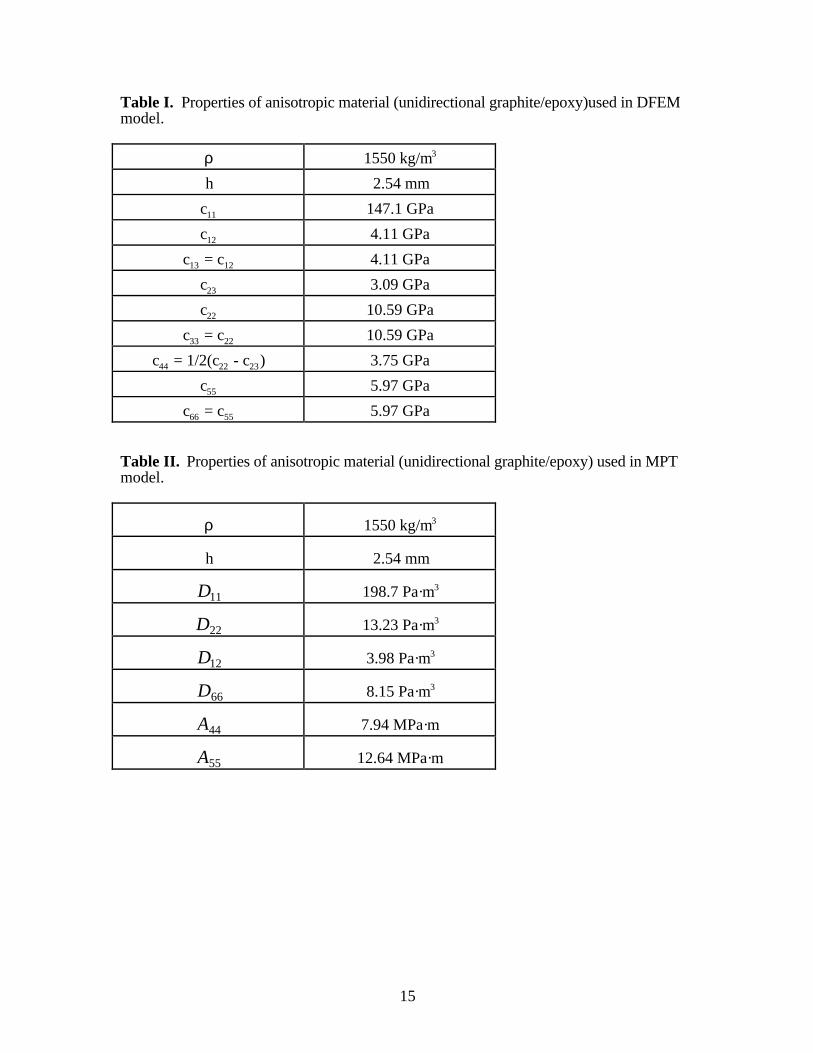
The composite material modeled was assumed to be a unidirectional material of thickness
2.54 mm. The elastic properties were assumed to be those of AS4/3502 graphite/epoxy.
The axes were designated such that the x axis was along the fibers, the y axis was normal to
the fibers in the plane of the plate, and the z axis was perpendicular to the plane of the plate.
As a unidirectional material, the material was assumed to be transversely isotropic (nine
nonzero elastic stiffness moduli, five of which are independent). The values of these
coefficients, which were used in the DFEM calculations, are given in Table I. The
coefficients used in the MPT calculations, which were calculated from the elastic properties
in Table I, are shown in Table II.
Calculations were made for propagation along the fiber direction (0°), perpendicular to the
fibers (90°), and at 45°. The three-dimensional DFEM model was used to include effects
of anisotropy. This allowed the lateral geometry of a rectangular plate to be used for the
DFEM and MPT models. However, it is noted that the boundary conditions along the
edges were still different (stress free for finite element method and simply supported for
plate theory). Thus, agreement at long times where significant reflection components are
contained in the signals is not expected. Also, although the lateral plate dimensions were the

11
same for a given MPT and DFEM calculations for a particular propagation direction, they
were not the same for all directions. This was because of the much larger memory
requirements of the three-dimensional finite element method which placed limitations on the
dimensions of the plate. For each direction, lateral dimensions, source location, and receiver
positions were chosen to minimize the effects of reflections from the edges. For the
0° propagation direction, a, the lateral dimension along x was 0.254 m while b, the lateral
dimension along y was 0.1524 m. For 90°, a was 0.1524 m and b was 0.254 m, and for
45°, a and b were both 0.2286 m. For all propagation directions, the distance from the
source to receiver was varied from 7.62 to 15.24 cm (30 to 60 plate thicknesses) at intervals
of 2.54 cm. However, results are shown only for a maximum propagation distance of 12.7
cm as the effect of reflections from the plate edges caused significant discrepancies at a
distance of 15.24 cm. Again for the DFEM, the simulated point receivers were modeled
both on top and bottom of the plate to allow elimination of the symmetric mode components
in the signals.
For the DFEM, only ten elements were used through the thickness for a cell size of 0.254
mm. The cell aspect ratio was unity. This larger cell size was adequate for these
calculations because of the low frequencies (and thus long wavelengths) in the flexural
mode signals. However, because of the larger element size, there was a correspondingly
larger source diameter which could have a minimum value of only four times the cell size. It
is possible that this larger source diameter may have contributed to discrepancies between
the DFEM results and those from MPT in which the point source was again used. As
before, a linear ramp source with 0.1 µs rise time was used with an amplitude of 1 N.
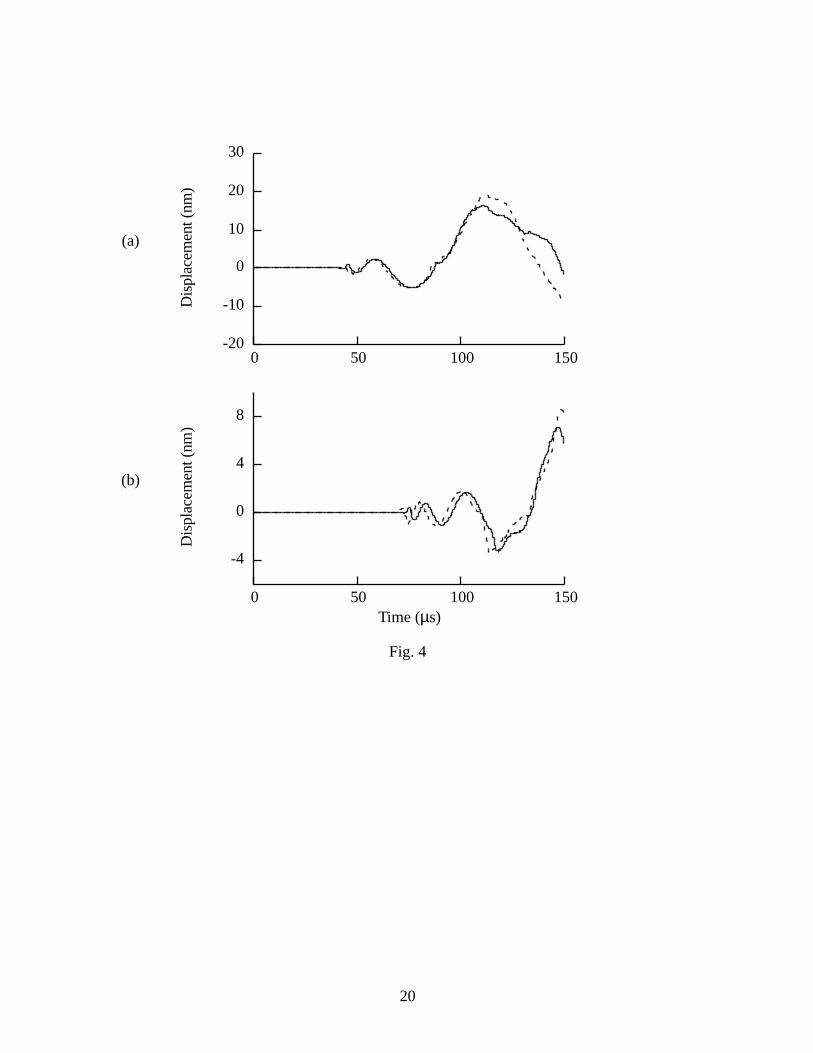
The results for the DFEM and MPT models for propagation along the 0° direction at
distances of 7.62 and 12.7 cm are shown in Fig. 3. Figures 4 and 5 show similar results for
propagation along the 45° and 90° directions respectively. As these figures show, the

12
agreement is good. Some discrepancy due to differences in reflections is observed at later
times in the waveforms.
SUMMARY AND CONCLUSIONS
Two theoretical methods for predicting flexural plate mode acoustic emission waveforms in
thin plates were compared. The first was a dynamic finite element method (DFEM) and the
second was based on a normal mode solution to Mindlin plate theory (MPT). Both
methods were used to calculate the response of a plate to an out of plane source on the
surface of a plate for both isotropic (aluminum) and anisotropic (unidirectional
graphite/epoxy composite) materials. In general, good agreement between the two methods
was observed. Discrepancies at long times in the waveforms were due to differences in the
contributions from reflections from plate edges from different specimen geometries and/or
boundary conditions for the two models. Since the DFEM is based on exact linear
elasticity and has been previously verified by comparison with experimental measurements,
the observed differences between the two techniques at shorter times, not caused by
reflection differences, were attributed to the approximate nature of MPT.
Both methods allow calculations of waveforms in finite geometry specimens and can be
used for isotropic and anisotropic media. However, since the DFEM is based on exact
linear elasticity, it provides the displacements from all modes, symmetric and antisymmetric,
while the MPT provides only the flexural plate mode (lowest order symmetric mode).
Other plate theories can be used for the calculation of the extensional plate modes, but
typically do not agree as well with experiment or full elasticity solutions. The DFEM can
also be used to model arbitrary specimen geometries and source configurations, while MPT
is limited to rectangular or circular geometries and much more limited source
configurations. However, the trade-off for the enhanced capabilities of the DFEM is the
significant computational intensity for this method. It requires workstation class computers

13
with significant memory and lengthy run times. The normal mode solution for MPT can be
calculated on a personal computer in only a few minutes.
In discussing how these models might compare with signals generated by real AE sources
in plates, it is noted that sources with a large out-of-plane or bending component generate
preferentially large flexural plate modes. Such sources include impact, delamination in
composites, and cracks near the surface or not symmetric with the midplane of the plate.
Since both models predict the flexural mode response, they might both be applicable.
Because of the flexibility in modeling different source configurations and geometries, the
DFEM would obviously provide more accurate models for these real sources. However, in-
plane sources such as fatigue cracking in metals and matrix cracking produce large
extensional mode signals with little or no flexural modes if the crack is symmetric with
respect to the midplane of the plate. For these real AE sources, MPT would not be useful as
it does not predict the extensional mode.
REFERENCES
1. F. R. Breckenridge, Carl E. Tschiegg, and M. Greenspan, Acoustic Emission: SomeApplications of Lamb's Problem, J. Acoust. Soc. Am. 57(3):626-631 (1975).
2. N. N. Hsu, Dynamic Green's Functions of an Infinite Plate - A Computer Program,NBSIR 85-3234 (1985).
3. Y. H. Pao, Theory of Acoustic Emission, Elastic Waves and Non-Destructive Testing ofMaterials, AMD 29:107-128 (1978).
4. M Ohtsu and K. Ono, The Generalized Theory and Source Representations of AcousticEmission, J. Acoustic Emission, 5(4):124-133 (1986).
5. M. R. Gorman, Plate Wave Acoustic Emission, J. Acoust. Soc. Am. 90(1):358-364(1991).
6. M. R. Gorman and W. H. Prosser, AE Source Orientation by Plate Wave Analysis, J.Acoustic Emission 9(4): 283-288 (1991).
7. S. M. Ziola and M. R. Gorman, Source Location in Thin Plates Using Cross-Correlation,J. Acoust. Soc. Am. 90(5): 2551-2556 (1991).

14
8. M. R. Gorman and S. M. Ziola, Plate Waves Produced by Transverse Matrix Cracking,Ultrasonics 29:245-251 (1991).
9. W. H. Prosser, K. E. Jackson, S. Kellas, B. T. Smith, J. McKeon, and A. Friedman,Advanced, Waveform Based Acoustic Emission Detection of Matrix Cracking inComposites, Materials Evaluation 53(9):1052-1058 (1995).
10. W. H. Prosser, The Propagation Characteristics of the Plate Modes of AcousticEmission Waves in Thin Aluminum Plates and Thin Graphite/Epoxy Composite Plates andTubes, NASA Technical Memorandum 104187 (1991).
11. D. Guo, A. Mal, and K. Ono, Wave Theory of Acoustic Emission in CompositeLaminates, J. Acoustic Emission, 14(3-4):S19-S46 (1996).
12. D. Guo, Lamb Waves from Microfractures in Composite Plates, Ph. D. Thesis,University of California at Los Angeles (1996).
13. M. R. Gorman and W. H. Prosser, Application of Normal Mode Expansion toAcoustic Emission Waves in Finite Plates, J. Appl. Mech., 63(2):555-557 (1996).
14. R. D. Mindlin, Influence of Rotatory Inertia and Shear on Flexural Motions ofIsotropic Elastic Plates, J. Appl. Mech., 18:31-38 (1951).
15. W. Huang, Application of Mindlin Plate Theory to Analysis of Acoustic EmissionWaveforms in Finite Plates, to be published in the Proceedings of the Review of Progress inQuantitative Nondestructive Evaluation, 17 (1998).
16. J. Gary and M. A. Hamstad, On the Far-field Structure of Waves Generated by aPencil Lead Break on a Thin Plate, J. Acoustic Emission, 12(3-4):157-170 (1994).
17. M. A. Hamstad, J. Gary, and A. O’Gallagher, Far-field Acoustic Emission Waves byThree-Dimensional Finite Element Modeling of Pencil-Lead Breaks on a Thick Plate, J.Acoustic Emission, 14(2):103-114 (1996).
18. P. C. Yang, C. H. Norris, and Y. Stavsky, Elastic Wave Propagation in HeterogeneousPlates, Int. J. Solids Struct. 2:665 (1966).
19. B. Tang, E. G. Henneke II, and R. C. Stiffler, Low Frequency Flexural WavePropagation in Laminated Composite Plates, Proceedings of Workshop on Acousto-Ultrasonics: Theory and Applications, 45-65 (1987).
20. T. S. Chow, On the Propagation of Flexural Waves in an Orthotropic Laminated Plateand Its Response to an Impulsive Load, J. Comp. Mat., 5:306-319 (1971).
15
Table I. Properties of anisotropic material (unidirectional graphite/epoxy)used in DFEMmodel.
ρ 1550 kg/m3
h 2.54 mm
c11 147.1 GPa
c12 4.11 GPa
c13 = c12 4.11 GPa
c23 3.09 GPa
c22 10.59 GPa
c33 = c22 10.59 GPa
c44 = 1/2(c22 - c23) 3.75 GPa
c55 5.97 GPa
c66 = c55 5.97 GPa
Table II. Properties of anisotropic material (unidirectional graphite/epoxy) used in MPTmodel.
ρ 1550 kg/m3
h 2.54 mm
D11 198.7 Pa·m3
D22 13.23 Pa·m3
D12 3.98 Pa·m3
D66 8.15 Pa·m3
A44 7.94 MPa·m
A55 12.64 MPa·m

16
FIGURE CAPTIONS
Fig. 1 - Comparison of DFEM (solid curve) and MPT (dashed curve) results for isotropic(aluminum) material at propagation distances of (a) 7.62 cm, (b) 12.7 cm, and (c) 17.78 cm.
Fig. 2 - Comparison of DFEM (solid curve) and MPT (dashed curve) results for isotropic(aluminum) material at propagation distances of (a) 7.62 cm, (b) 12.7 cm, and (c) 17.78 cmon expanded time scales.
Fig. 3 - Comparison of DFEM (solid curve) and MPT (dashed curve) results foranisotropic (graphite/epoxy) material along 0° direction at propagation distances of (a) 7.62cm and (b) 12.7 cm.
Fig. 4 - Comparison of DFEM (solid curve) and MPT (dashed curve) results foranisotropic (graphite/epoxy) material along 45° direction at propagation distances of(a) 7.62 cm and (b) 12.7 cm.
Fig. 5 - Comparison of DFEM (solid curve) and MPT (dashed curve) results foranisotropic (graphite/epoxy) material along 90° direction at propagation distances of(a) 7.62 cm and (b) 12.7 cm.

17
-2
-1
0
1
2
3
0 50 100 150
Dis
plac
emen
t (nm
)
-2
0
2
4
6
8
0 50 100 150
Dis
plac
emen
t (nm
)
-30
-25
-20
-15
-10
-5
0
5
0 50 100 150
Dis
plac
emen
t (nm
)
Time (µs)
(a)
(b)
(c)
Fig. 1

18
-0.4
-0.3
-0.2
-0.1
0
0.1
0.2
0.3
0.4
40 50 60 70 80 90
Dis
plac
emen
t (nm
)
-0.8
-0.6
-0.4
-0.2
0
0.2
0.4
0.6
0.8
20 30 40 50 60 70
Dis
plac
emen
t (nm
)
-1.5
-1
-0.5
0
0.5
1
1.5
0 10 20 30 40 50
Dis
plac
emen
t (nm
)
Time (µs)
(a)
(b)
(c)
Fig. 2

19
-20
-10
0
10
20
30
40
50
0 50 100 150
Dis
plac
emen
t (nm
)
-120
-100
-80
-60
-40
-20
0
20
0 50 100 150
Dis
plac
emen
t (nm
)
Time (µs)
(a)
(b)
Fig. 3
20
-4
0
4
8
0 50 100 150
Dis
plac
emen
t (nm
)
-20
-10
0
10
20
30
0 50 100 150
Dis
plac
emen
t (nm
)
Time (µs)
(a)
(b)
Fig. 4

21
-4
-2
0
2
4
0 50 100 150
Dis
plac
emen
t (nm
)
-15
-10
-5
0
5
10
15
0 50 100 150
Dis
plac
emen
t (nm
)
Time (µs)
(a)
(b)
Fig. 5