fingerprint classification using fast fourier …hpark/papers/finger_jrl.pdf · fingerprint...
TRANSCRIPT
Fingerprint Classificationusing Fast Fourier Transform
and Nonlinear Discriminant Analysis�Cheong Hee Parkyand Haesun Parkz
Dept. of Computer Science and EngineeringUniversity of Minnesota
Minneapolis, MN 55455, USAfchpark, [email protected]
Abstract
In this paper, we present a new approach for fingerprint classification based on
Discrete Fourier Transform (DFT) and nonlinear discriminant analysis. Utilizing the
Discrete Fourier Transform and directional filters, a reliable and efficient directional
image is constructed from each fingerprint image, and then nonlinear discriminant
analysis is applied to the constructed directional images,reducing the dimension dra-
matically and extracting the discriminant features. The proposed method explores the
capability of DFT and directional filtering in dealing with low quality images and the
effectiveness of nonlinear feature extraction method in fingerprint classification. Ex-
perimental results demonstrates competitive performancecompared with other pub-
lished results.
Keywords Discrete Fourier Transform, Fingerprint classification, Generalized singu-
lar value decomposition, Nonlinear discriminant analysis, Kernel methods.�This work was supported in part by the National Science Foundation grants CCR-0204109 and ACI-0305543. Any opinions, findings and conclusions or recommendations expressed in this material are those ofthe authors and do not necessarily reflect the views of the National Science Foundation(NSF).yCorresponding author: Tel: 1-352-392-9011, Fax: 1-352-392-3537. C. H. Park is currently as a postdocat the Dept. of Industrial and Systems Engineering, University of Florida, Gainesville, FL 32611, USA.zH. Park is in the National Science Foundation, 4201 Wilson Boulevard, Arlington, Virginia 22230, USA.The work of H. Park has been performed while at the NSF and was supported by IR/D from the NSF.
1

1 Introduction
Fingerprints have long been used as a reliable biometric feature for personal identification.
Fingerprint classification refers to the problem of assigning fingerprints to one of sev-
eral prespecified classes. Automatic classification can be used as a preprocessing step
for fingerprint matching, reducing matching time and complexity by narrowing the search
space to a subset of a typically huge database [1, 2]. Fingerprints are graphical images of
flow-like ridges, and they are classified as left loop (L), right loop (R), whorl (W), arch (A)
and tented arch (T) according to Henry’s classification scheme [3] as shown in Fig. 1.
Classification performance highly depends on the preprocessing steps where various
ways to extract and represent distinguishable features among classes can be applied. The
features generated after the preprocessing steps are fed into classifiers such as neural net-
works [4], hidden Markov model [5], probabilistic neural networks [6], support vector ma-
chines [7]. Jain et al. extracted features from Gabor-filtered images which were centered on
a core point and used two-stage classifiers of K-nearest neighbor and neural networks [2].
Since the fingerprints are flow-like images, many approaches are based on directional struc-
tures explicitly or implicitly. Local orientational flows are estimated from a fingerprint
image and desired features are computed from the estimated orientation field. The fea-
tures can be singular points and the classification is basedon the number and locations of
detected singular points [8]. In [9], a directional image ispartitioned into homogeneous re-
gions and the relative relations of segmented regions are used for classification. In order to
overcome the possible ill-posed problem of the directionalpartitioning task, Cappelli et al.
performed guided segmentation using directional masks as aprototype of each class [10].
In this paper, we propose an approach for fingerprint classification based on the Dis-
crete Fourier Transform (DFT) and nonlinear discriminant analysis. In order to obtain
reliable and efficient representations of fingerprint images, we utilize the Discrete Fourier
2
Transform (DFT) and directional filters. The DFT is a usefulcomputational tool that pro-
vides an efficient means for detecting directionality or periodicity in the frequency domain
and removing noise by deleting high frequency coefficients[11]. In order to estimate lo-
cal ridge orientations in a fingerprint image, we apply directional filters in the frequency
domain after the image has been transformed by the DFT. Directional images are then
constructed in order to capture the distinguishing orientational structure among classes.
By deleting high frequency coefficients in the frequency domain, our method utilizing the
DFT and directional filters can deal with noise in fingerprint images effectively, and there-
fore tolerate low quality fingerprint images. Kernel discriminant analysis (KDA/GSVD)
is a nonlinear discriminant analysis based on kernel methods and the generalized singular
value decomposition (GSVD) [12]. It performs Linear Discriminant Analysis after trans-
forming the original data to a linearly separable structureusing a kernel-based nonlinear
mapping. KDA/GSVD is capable of handling high dimensional data and extracting most
discriminant features for classification automatically.We apply KDA/GSVD to the con-
structed directional images extracting nonlinear discriminant features, which are used for
very effective fingerprint classification.
The paper is organized as follows. In Section 2, we give a detailed explanation of how
to construct directional images using the DFT and directional filters. A nonlinear discrimi-
nant analysis, KDA/GSVD, based on kernel methods and the GSVD is presented in Section
3. Experimental results using the NIST database 4 [13] demonstrates the comparable per-
formance of our proposed method over previously proposed methods.
2 Construction of Directional Images
Fingerprints vary in size, are positioned randomly in printed images, and the backgrounds
can contain noise such as scratches, lines or blur. In the Discrete Fourier Transform (DFT),
3
thresholding the high frequency coefficients correspondsto reducing the noise effects,
while the low frequency coefficients provide a trigonometric interpolation via a finite linear
combination of sines and cosines of the various frequencies[14]. The DFT has been widely
used in signal and image processing [11]. We apply the Fast Fourier Transform (FFT), the
fast algorithm for computing the DFT, to construct a directional image.
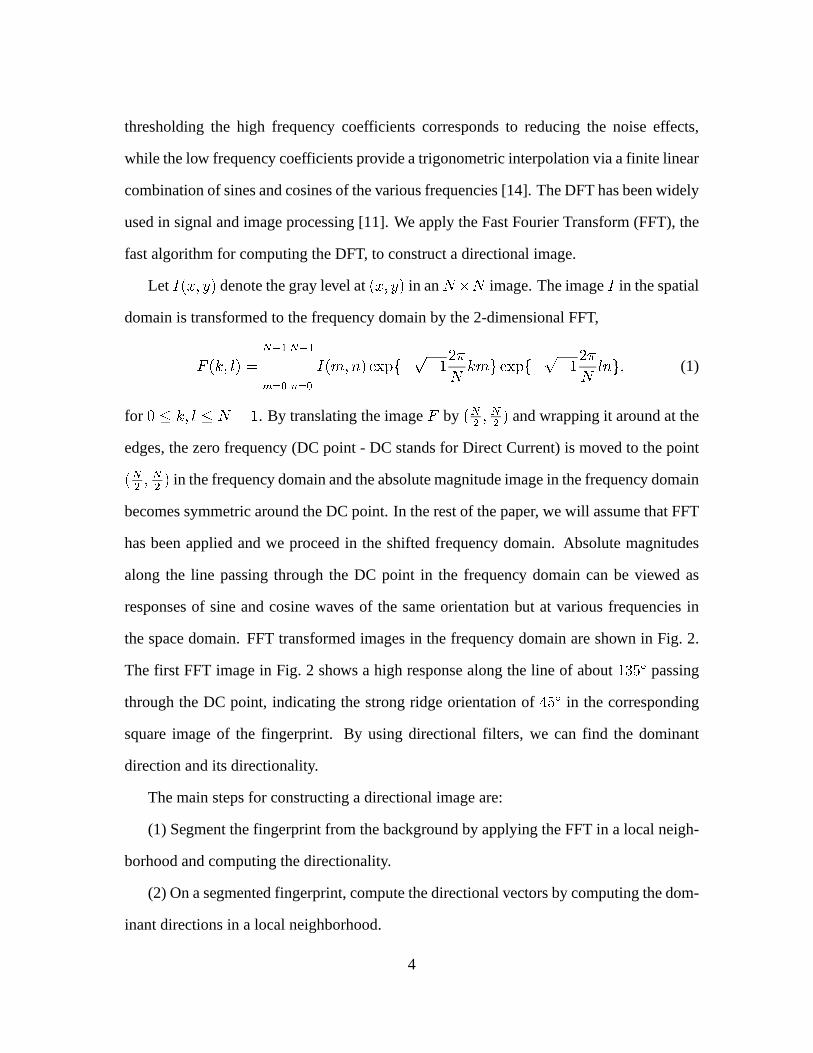
Let I(x; y) denote the gray level at(x; y) in anN�N image. The imageI in the spatial
domain is transformed to the frequency domain by the 2-dimensional FFT,
F (k; l) = N�1Xm=0N�1Xn=0 I(m;n) expf�p�12�N kmg expf�p�12�N lng; (1)
for 0 � k; l � N � 1. By translating the imageF by (N2 ; N2 ) and wrapping it around at the
edges, the zero frequency (DC point - DC stands for Direct Current) is moved to the point(N2 ; N2 ) in the frequency domain and the absolute magnitude image in the frequency domain
becomes symmetric around the DC point. In the rest of the paper, we will assume that FFT
has been applied and we proceed in the shifted frequency domain. Absolute magnitudes
along the line passing through the DC point in the frequency domain can be viewed as
responses of sine and cosine waves of the same orientation but at various frequencies in
the space domain. FFT transformed images in the frequency domain are shown in Fig. 2.
The first FFT image in Fig. 2 shows a high response along the line of about135Æ passing
through the DC point, indicating the strong ridge orientation of 45Æ in the corresponding
square image of the fingerprint. By using directional filters, we can find the dominant
direction and its directionality.
The main steps for constructing a directional image are:
(1) Segment the fingerprint from the background by applyingthe FFT in a local neigh-
borhood and computing the directionality.
(2) On a segmented fingerprint, compute the directional vectors by computing the dom-
inant directions in a local neighborhood.
4

(3) Find thecore point, to be defined later, which can be used as a landmark forunified
centering of fingerprints belonging to the same class, and construct the directional image
centered on the core point.
As we explain the three steps in the next sections, the specific parameter values used
in our experiments are given. The parameter values were determined by applying the three
steps to fingerprint images of the training data set and examining the produced directional
images.
2.1 Fingerprint Segmentation
Given an input image of size512 � 512, its rows and columns are divided into 16 pixels,
giving 31� 31 inner grid points. The FFT is applied on the32� 32 pixels centered at each
inner grid point(m;n), 1 � m;n � 31. See the square regions in the fingerprint image
and the corresponding FFT images in Fig. 2. In order to detectthe dominant direction
of orientational flow in each32 � 32 sized local neighborhood, we devise a filter, called
a directional filter, which will be used in the FFT image. Thedirectional filterD� for
orientation� 2 [0; 180) is given as follows:
D�(i+ p; j + p) = � expf�u2a2 � v2b2 g; if u2a2 + v2b2 � 1;0; otherwise; for � p � i; j � p; (2)
where
� v = i � os� + j � sin�u =pi2 + j2 � v2;2� a and2� b are the lengths of the short and the long axes of the ellipsoidu2a2 + v2b2 = 1,
respectively. An example of directional filters is illustrated in Fig. 3. By using directional
filters that emphasize the low frequency coefficients around the DC point and disregard the
high frequency coefficients, the noise effects in fingerprint images can be reduced effec-
tively. In our algorithm, we usedp = 16, a = 1:5, b = 32=3 and� = 0; 10; � � � ; 170.
At each grid point(m;n), 1 � m;n � 31, directionalityDm;n and local dominant
5
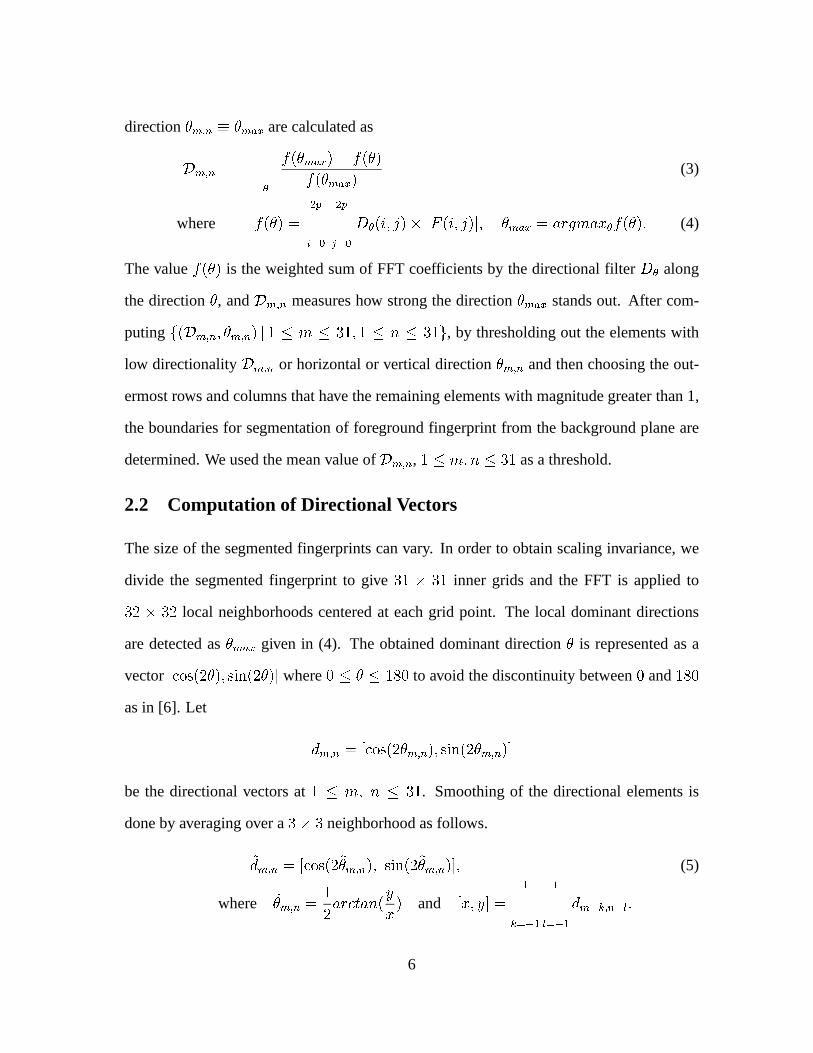
direction�m;n � �max are calculated as
Dm;n = X� f(�max)� f(�)f(�max) (3)
where f(�) = 2pXi=0 2pXj=0 D�(i; j)� jF (i; j)j; �max = argmax�f(�): (4)
The valuef(�) is the weighted sum of FFT coefficients by the directional filter D� along
the direction�, andDm;n measures how strong the direction�max stands out. After com-
putingf(Dm;n; �m;n) j 1 � m � 31; 1 � n � 31g, by thresholding out the elements with
low directionalityDm;n or horizontal or vertical direction�m;n and then choosing the out-
ermost rows and columns that have the remaining elements with magnitude greater than 1,
the boundaries for segmentation of foreground fingerprintfrom the background plane are
determined. We used the mean value ofDm;n, 1 � m;n � 31 as a threshold.
2.2 Computation of Directional Vectors
The size of the segmented fingerprints can vary. In order to obtain scaling invariance, we
divide the segmented fingerprint to give31 � 31 inner grids and the FFT is applied to32 � 32 local neighborhoods centered at each grid point. The local dominant directions
are detected as�max given in (4). The obtained dominant direction� is represented as a
vector[ os(2�); sin(2�)℄ where0 � � � 180 to avoid the discontinuity between0 and180as in [6]. Let
dm;n = [ os(2�m;n); sin(2�m;n)℄be the directional vectors at1 � m; n � 31. Smoothing of the directional elements is
done by averaging over a3� 3 neighborhood as follows.~dm;n = [ os(2~�m;n); sin(2~�m;n)℄; (5)
where ~�m;n = 12ar tan(yx) and [x; y℄ = 1Xk=�1 1Xl=�1 dm+k;n+l:6
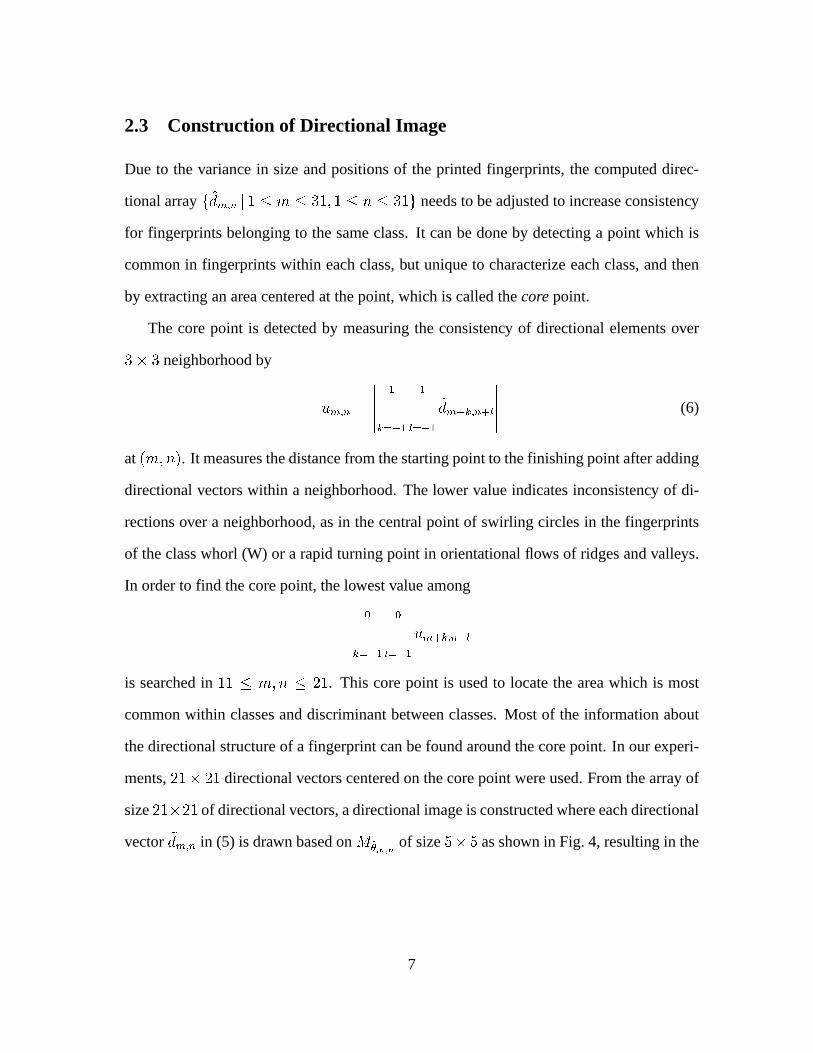
2.3 Construction of Directional Image
Due to the variance in size and positions of the printed fingerprints, the computed direc-
tional arrayf ~dm;n j 1 � m � 31; 1 � n � 31g needs to be adjusted to increase consistency
for fingerprints belonging to the same class. It can be done by detecting a point which is
common in fingerprints within each class, but unique to characterize each class, and then
by extracting an area centered at the point, which is called thecore point.
The core point is detected by measuring the consistency of directional elements over3� 3 neighborhood by
um;n = ����� 1Xk=�1 1Xl=�1 ~dm+k;n+l����� (6)
at(m;n). It measures the distance from the starting point to the finishing point after adding
directional vectors within a neighborhood. The lower valueindicates inconsistency of di-
rections over a neighborhood, as in the central point of swirling circles in the fingerprints
of the class whorl (W) or a rapid turning point in orientational flows of ridges and valleys.
In order to find the core point, the lowest value among0Xk=�1 0Xl=�1um+k;n+lis searched in11 � m;n � 21. This core point is used to locate the area which is most
common within classes and discriminant between classes. Most of the information about
the directional structure of a fingerprint can be found around the core point. In our experi-
ments,21� 21 directional vectors centered on the core point were used. From the array of
size21�21 of directional vectors, a directional image is constructedwhere each directional
vector ~dm;n in (5) is drawn based onM~�m;n of size5� 5 as shown in Fig. 4, resulting in the
7
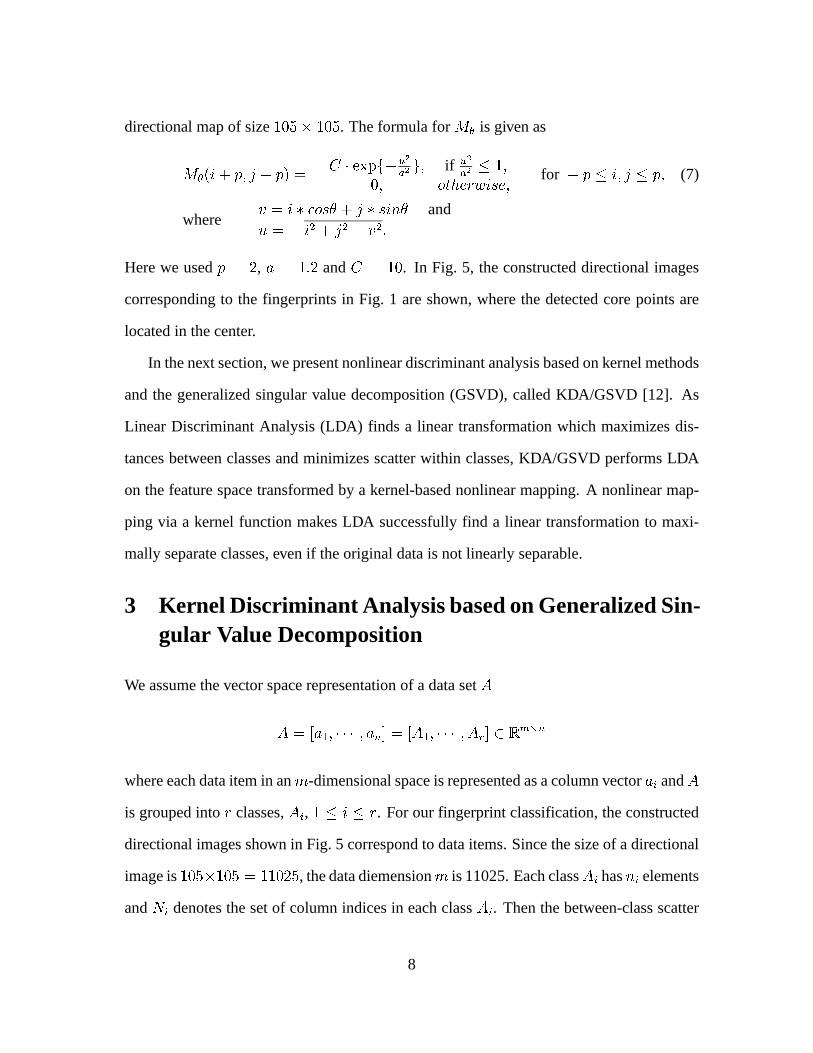
directional map of size105� 105. The formula forM� is given as
M�(i+ p; j + p) = � C � expf�u2a2 g; if u2a2 � 1;0; otherwise; for � p � i; j � p; (7)
where
� v = i � os� + j � sin� andu =pi2 + j2 � v2:Here we usedp = 2, a = 1:2 andC = 10. In Fig. 5, the constructed directional images
corresponding to the fingerprints in Fig. 1 are shown, wherethe detected core points are
located in the center.
In the next section, we present nonlinear discriminant analysis based on kernel methods
and the generalized singular value decomposition (GSVD), called KDA/GSVD [12]. As
Linear Discriminant Analysis (LDA) finds a linear transformation which maximizes dis-
tances between classes and minimizes scatter within classes, KDA/GSVD performs LDA
on the feature space transformed by a kernel-based nonlinear mapping. A nonlinear map-
ping via a kernel function makes LDA successfully find a linear transformation to maxi-
mally separate classes, even if the original data is not linearly separable.
3 Kernel Discriminant Analysis based on Generalized Sin-gular Value Decomposition
We assume the vector space representation of a data setAA = [a1; � � � ; an℄ = [A1; � � � ; Ar℄ 2 Rm�n
where each data item in anm-dimensional space is represented as a column vectorai andAis grouped intor classes,Ai, 1 � i � r. For our fingerprint classification, the constructed
directional images shown in Fig. 5 correspond to data items.Since the size of a directional
image is105�105 = 11025, the data diemensionm is 11025. Each classAi hasni elements
andNi denotes the set of column indices in each classAi. Then the between-class scatter
8
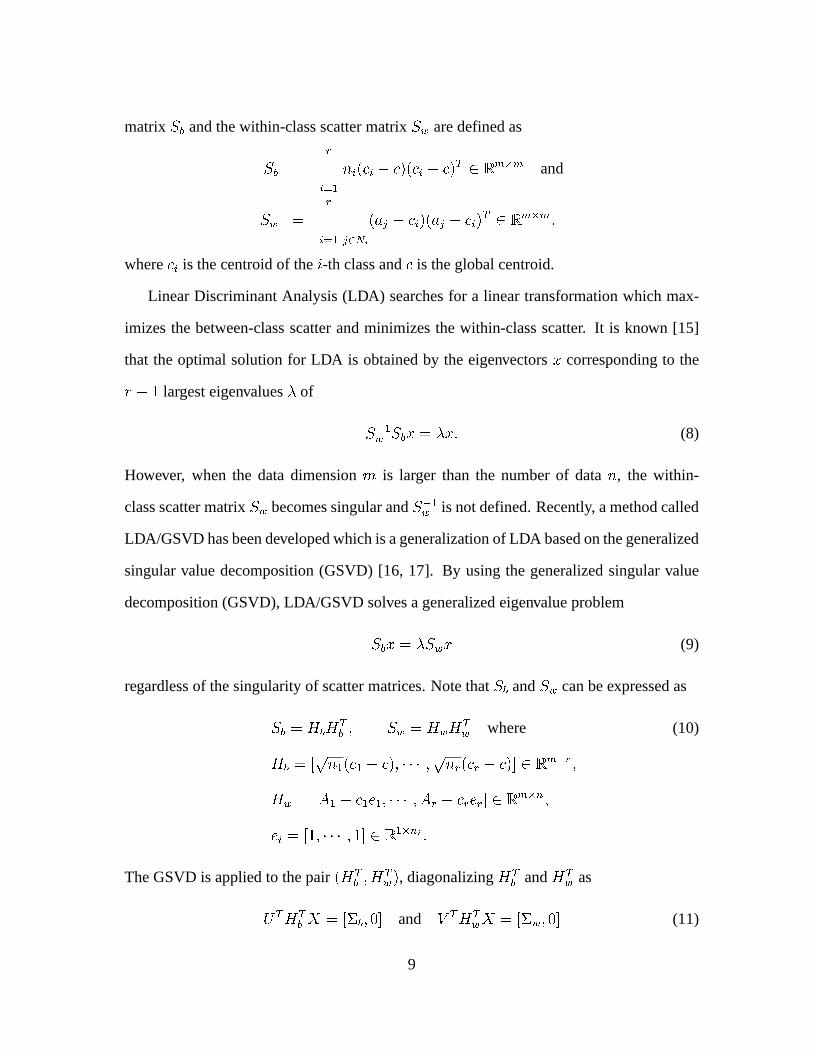
matrixSb and the within-class scatter matrixSw are defined as
Sb = rXi=1 ni( i � )( i � )T 2 Rm�m and
Sw = rXi=1 Xj2Ni(aj � i)(aj � i)T 2 Rm�m ;where i is the centroid of thei-th class and is the global centroid.
Linear Discriminant Analysis (LDA) searches for a linear transformation which max-
imizes the between-class scatter and minimizes the within-class scatter. It is known [15]
that the optimal solution for LDA is obtained by the eigenvectorsx corresponding to ther � 1 largest eigenvalues� of
S�1w Sbx = �x: (8)
However, when the data dimensionm is larger than the number of datan, the within-
class scatter matrixSw becomes singular andS�1w is not defined. Recently, a method called
LDA/GSVD has been developed which is a generalization of LDAbased on the generalized
singular value decomposition (GSVD) [16, 17]. By using the generalized singular value
decomposition (GSVD), LDA/GSVD solves a generalized eigenvalue problem
Sbx = �Swx (9)
regardless of the singularity of scatter matrices. Note that Sb andSw can be expressed as
Sb = HbHTb ; Sw = HwHTw where (10)Hb = [pn1( 1 � ); � � � ;pnr( r � )℄ 2 Rm�r ;Hw = [A1 � 1e1; � � � ; Ar � rer℄ 2 Rm�n;ei = [1; � � � ; 1℄ 2 R 1�ni :The GSVD is applied to the pair(HTb ; HTw ), diagonalizingHTb andHTw as
UTHTb X = [�b; 0℄ and V THTwX = [�w; 0℄ (11)
9
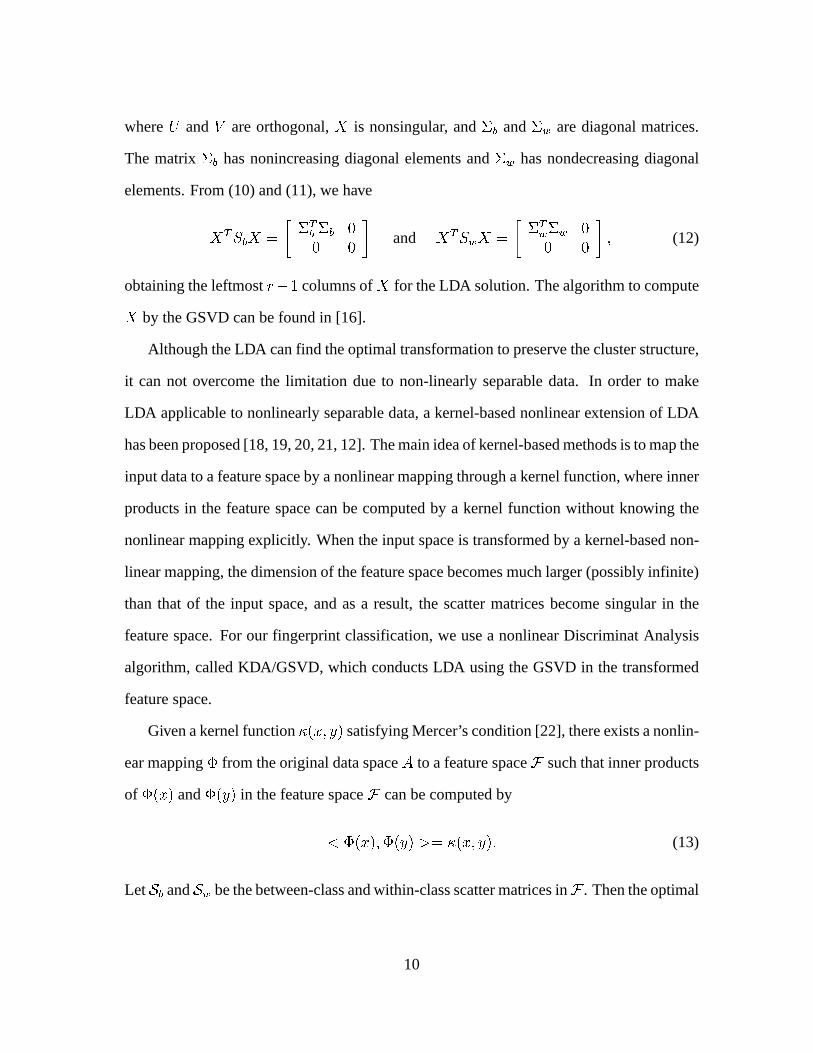
whereU andV are orthogonal,X is nonsingular, and�b and�w are diagonal matrices.
The matrix�b has nonincreasing diagonal elements and�w has nondecreasing diagonal
elements. From (10) and (11), we have
XTSbX = � �Tb �b 00 0 � and XTSwX = � �Tw�w 00 0 � ; (12)
obtaining the leftmostr�1 columns ofX for the LDA solution. The algorithm to computeX by the GSVD can be found in [16].
Although the LDA can find the optimal transformation to preserve the cluster structure,
it can not overcome the limitation due to non-linearly separable data. In order to make
LDA applicable to nonlinearly separable data, a kernel-based nonlinear extension of LDA
has been proposed [18, 19, 20, 21, 12]. The main idea of kernel-based methods is to map the
input data to a feature space by a nonlinear mapping through akernel function, where inner
products in the feature space can be computed by a kernel function without knowing the
nonlinear mapping explicitly. When the input space is transformed by a kernel-based non-
linear mapping, the dimension of the feature space becomes much larger (possibly infinite)
than that of the input space, and as a result, the scatter matrices become singular in the
feature space. For our fingerprint classification, we use anonlinear Discriminat Analysis
algorithm, called KDA/GSVD, which conducts LDA using the GSVD in the transformed
feature space.
Given a kernel function�(x; y) satisfying Mercer’s condition [22], there exists a nonlin-
ear mapping� from the original data spaceA to a feature spaceF such that inner products
of �(x) and�(y) in the feature spaceF can be computed by
< �(x);�(y) >= �(x; y): (13)
LetSb andSw be the between-class and within-class scatter matrices inF . Then the optimal
10
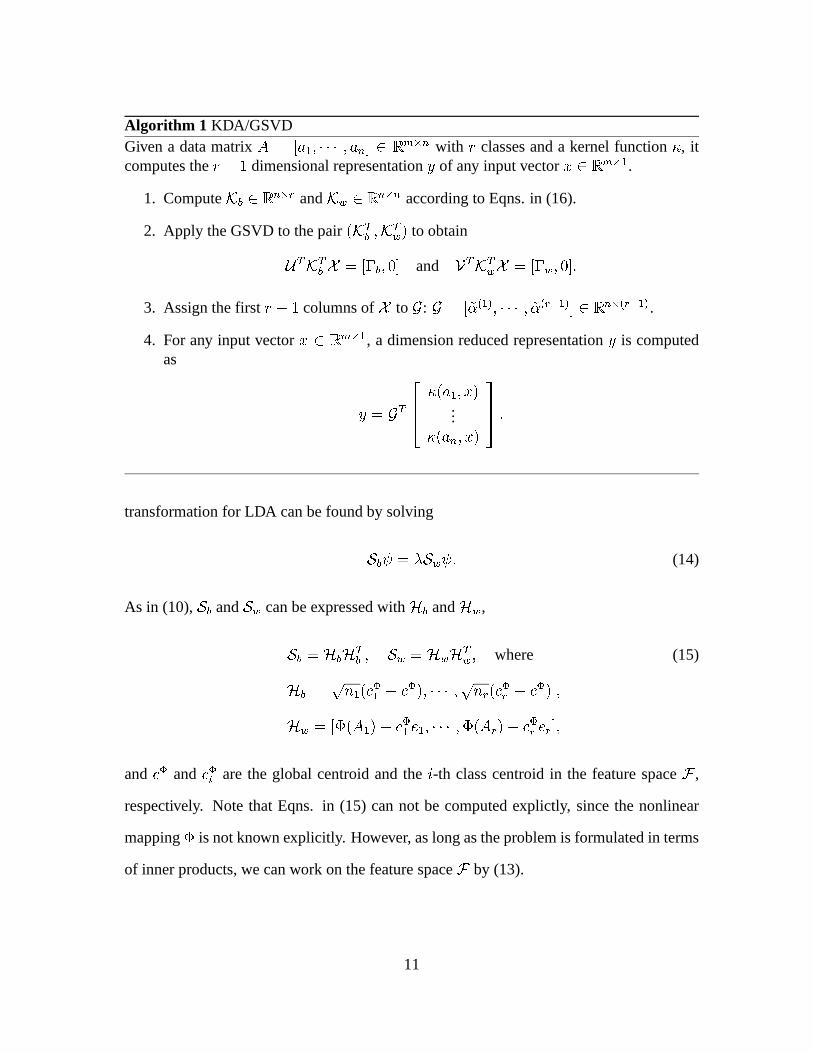
Algorithm 1 KDA/GSVDGiven a data matrixA = [a1; � � � ; an℄ 2 Rm�n with r classes and a kernel function�, itcomputes ther � 1 dimensional representationy of any input vectorx 2 Rm�1.
1. ComputeKb 2 R n�r andKw 2 R n�n according to Eqns. in (16).
2. Apply the GSVD to the pair(KTb ;KTw) to obtainUTKTb X = [�b; 0℄ and VTKTwX = [�w; 0℄:3. Assign the firstr � 1 columns ofX to G: G = [~�(1); � � � ; ~�(r�1)℄ 2 R n�(r�1).4. For any input vectorx 2 Rm�1, a dimension reduced representationy is computed
as
y = GT 264 �(a1; x)...�(an; x)
375 :transformation for LDA can be found by solving
Sb = �Sw : (14)
As in (10),Sb andSw can be expressed withHb andHw,
Sb = HbHTb ; Sw = HwHTw; where (15)Hb = [pn1( �1 � �); � � � ;pnr( �r � �)℄;Hw = [�(A1)� �1 e1; � � � ;�(Ar)� �r er℄;and � and �i are the global centroid and thei-th class centroid in the feature spaceF ,
respectively. Note that Eqns. in (15) can not be computed explictly, since the nonlinear
mapping� is not known explicitly. However, as long as the problem is formulated in terms
of inner products, we can work on the feature spaceF by (13).
11
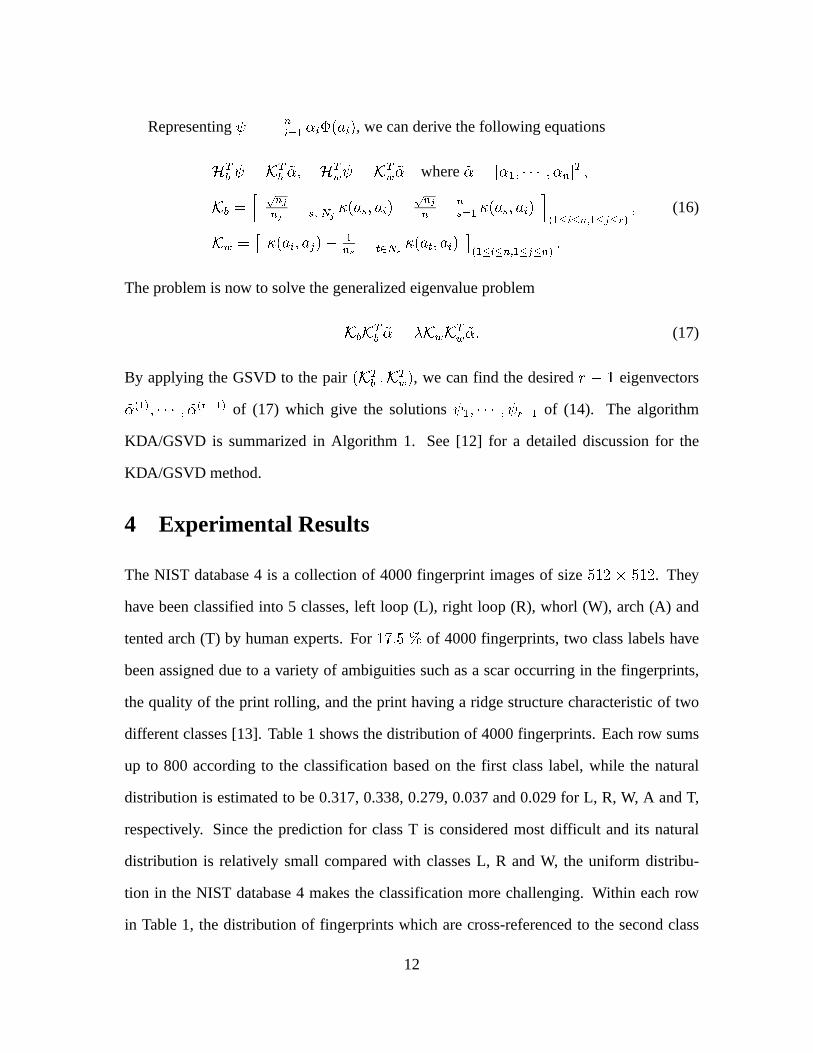
Representing =Pni=1 �i�(ai), we can derive the following equations
HTb = KTb ~�; HTw = KTw ~� where~� = [�1; � � � ; �n℄T ;Kb = h pnjnj Ps2Nj �(as; ai)� pnjn Pns=1 �(as; ai) i(1�i�n;1�j�r) ; (16)Kw = � �(ai; aj)� 1ns Pt2Ns �(at; ai) �(1�i�n;1�j�n) :The problem is now to solve the generalized eigenvalue problem
KbKTb ~� = �KwKTw ~�: (17)
By applying the GSVD to the pair(KTb ;KTw), we can find the desiredr � 1 eigenvectors~�(1); � � � ; ~�(r�1) of (17) which give the solutions 1; � � � ; r�1 of (14). The algorithm
KDA/GSVD is summarized in Algorithm 1. See [12] for a detailed discussion for the
KDA/GSVD method.
4 Experimental Results
The NIST database 4 is a collection of 4000 fingerprint images of size512 � 512. They
have been classified into 5 classes, left loop (L), right loop (R), whorl (W), arch (A) and
tented arch (T) by human experts. For17:5 % of 4000 fingerprints, two class labels have
been assigned due to a variety of ambiguities such as a scar occurring in the fingerprints,
the quality of the print rolling, and the print having a ridgestructure characteristic of two
different classes [13]. Table 1 shows the distribution of 4000 fingerprints. Each row sums
up to 800 according to the classification based on the first class label, while the natural
distribution is estimated to be 0.317, 0.338, 0.279, 0.037 and 0.029 for L, R, W, A and T,
respectively. Since the prediction for class T is considered most difficult and its natural
distribution is relatively small compared with classes L, Rand W, the uniform distribu-
tion in the NIST database 4 makes the classification more challenging. Within each row
in Table 1, the distribution of fingerprints which are cross-referenced to the second class
12
is shown. In handling the cross-referenced fingerprints, one can consider only the first
class label disregrading the second class label. However, considering that the classification
was difficult even by human experts, in our experiment a fingerprint was considered as
belonging to both classes when it has multiple class labels.
Among the 4000 fingerprint images, 2000 fingerprints, S0001 to S2000, are the second
rolling of the same people from whom fingerprints F0001 to F2000 were taken. For a fair
comparison, we set experimental conditions the same as those in [2, 7]. The training set is
formed with the first 1000 fingerprints from F labels and thefirst 1000 fingerprints from
S labels, and the test set is composed of the remaining 2000 fingerprints. If the predicted
class label for the test data matches one of the multiple labels, the prediction is considered
to be correct.
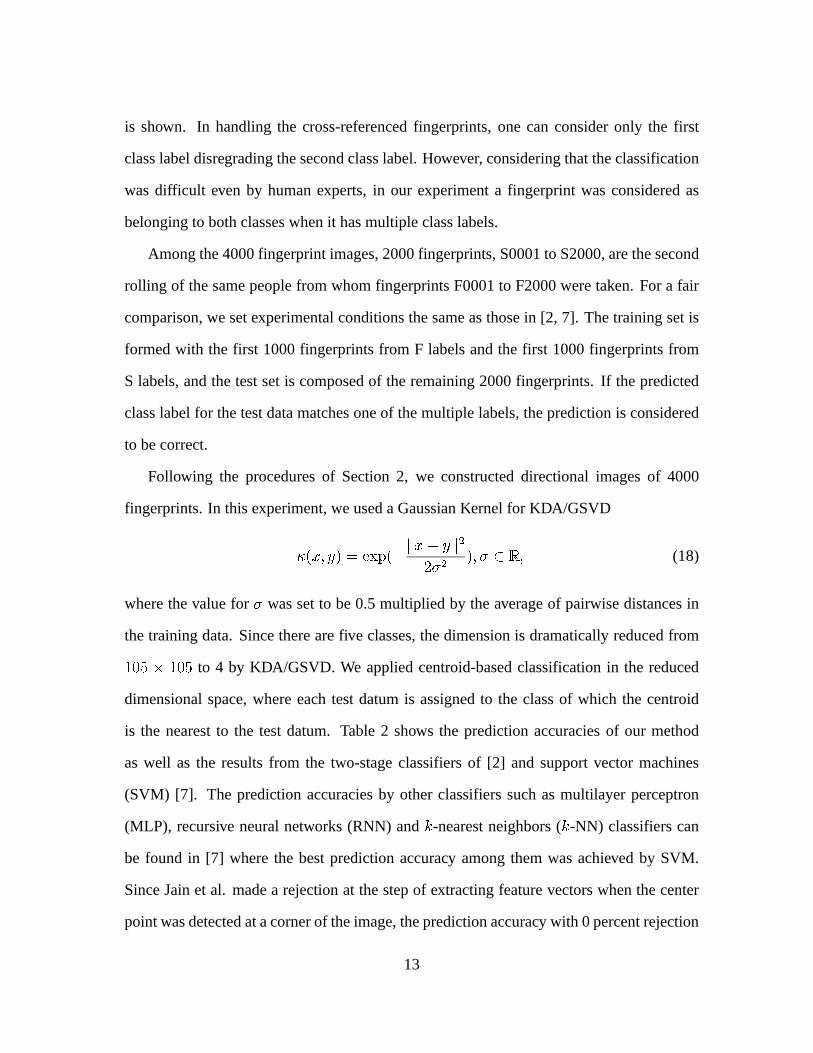
Following the procedures of Section 2, we constructed directional images of 4000
fingerprints. In this experiment, we used a Gaussian Kernelfor KDA/GSVD
�(x; y) = exp(�kx� yk22�2 ); � 2 R ; (18)
where the value for� was set to be 0.5 multiplied by the average of pairwise distances in
the training data. Since there are five classes, the dimension is dramatically reduced from105 � 105 to 4 by KDA/GSVD. We applied centroid-based classificationin the reduced
dimensional space, where each test datum is assigned to the class of which the centroid
is the nearest to the test datum. Table 2 shows the predictionaccuracies of our method
as well as the results from the two-stage classifiers of [2] and support vector machines
(SVM) [7]. The prediction accuracies by other classifiers such as multilayer perceptron
(MLP), recursive neural networks (RNN) andk-nearest neighbors (k-NN) classifiers can
be found in [7] where the best prediction accuracy among themwas achieved by SVM.
Since Jain et al. made a rejection at the step of extracting feature vectors when the center
point was detected at a corner of the image, the prediction accuracy with 0 percent rejection
13
rate for their method is not available. In our method, the rejection criterion is based on the
ratio between the distance to the nearest class centroid andthe distance to the farthest
class centroid. The confusion matrix by our proposed methodis shown in Table 3. In the
confusion matrix, when the test data is cross-referenced and misclassified, the first class
label was considered the actual class label. The proposed method obtained high prediction
accuracies even with a simple centroid-based classifier. Since the dimension is reduced so
dramatically, in the test stage the savings of computational complexity can be achieved.
In order to verify that a nonlinear discriminant analysis works efficiently in fingerprint
classification, we utilized a NIST fingerprint image software PCASYS [6]. The PCASYS
extracts a two dimensional array of size28 � 30 of orientation vectors[ os(2�); sin(2�)℄from a fingerprint image after various preprocessing. (See[6] for details.) The array of
the size28� 30 by PCASYS corresponds to an array of the21� 21 directional vectors of
Section 2.3 in our proposed method. From the arrays extracted by PCASYS, directional
images were constructed by usingM� in (7), and then KDA/GSVD was applied to the
constructed directional images. The prediction accuracies are shown on the second line
(PCASYS + KDA/GSVD) in Table 4 which repeats the results fromTable 2 for comparison.
This demonstrates that the nonlinear feature extraction bykernel discriminant analysis can
be used effectively to extract optimal features for fingerprint classification.
We also applied KDA/GSVD for the four-class classificationproblem where the classes
A and T are combined. Since the number of classes in this problem is 4, the reduced
dimension by KDA/GSVD is 3. The results by our method and from[2, 7] are reported in
Table 5.
14
5 Conclusion
In this paper, a novel approach was presented for fingerprint classification based on Dis-
crete Fourier Transform and nonlinear discriminant analysis. The directional images are
constructed from fingerprint images utilizing the Discrete Fourier Transform (DFT). Ap-
plying directional filters in the frequency domain after the transformation by the DFT
achieves effective low frequency filtering, reducing the noise effects in fingerprint im-
ages. The constructed directional images contain the essential directional structure which
is common within each class and discriminates between classes. Kernel-based nonlinear
discriminant analysis performs dramatic dimension reduction giving high quality discrim-
inant information for classification by capturing global difference among classes. The fast
algorithm FFT for DFT speeds up the preprocessing to construct directional images. Once
the transformation matrix by KDA/GSVD is computed, the classification in the reduced di-
mensional space saves computational complexites further.The experimental results show
that even simple classification methods such as centroid-based classification can achieve
high prediction accuracies over more complex methods previously published.
Acknowledgements
The authors would like to thank Dr. Panos Pardalos for valuable comments and informa-
tions.
References
[1] H.C. Lee and R.E. Gaensslen.Advances in Fingerprint Technology. Elsevier, 1991.
[2] A.K. Jain, A. Prabhakar, and L. Hong. A multichannel approach to fingerprint
classification. IEEE transactions on pattern analysis and machine intelligence,
15
21(4):348–359, 1999.
[3] E.R. Henry.Classification and Uses of Finger Prints. London: Routledge, 1900.
[4] K. Moscinska and G. Tyma. Neural network based fingerprint pattern classification.
Proc. Third Int’l Conf. Neural Network, pages 229–232, 1993.
[5] A. Senior. A hidden markov model fingerprint classifier. Proc. 31st Asilomar Conf.
Signals, Systems, and Computers, pages 306–310, 1997.
[6] G.T. Candela, P.J. Grother, C.I. Watson, R.A. Wilkinson, and C.L. Wilson. PCASYS-
a pattern-level classification automation system for fingerprints, 1995. NISTIR 5647,
Aug.
[7] Y. Yao, G.L. Marcialis, M. Pontil, P. Frasconi, and F. Roli. Combining flat and struc-
tured representations for fingerprint classification with recursive neural networks and
support vector machines.Pattern Recognition, 36(2):397–406, 2003.
[8] K. Karu and A.K. Jain. Fingerprint classification.Pattern Recognition, 29(3):389–
404, 1996.
[9] D. Maio and D. Maltoni. A structural approach to fingerprint classification, 1996.
Proc. 13th ICPR, Vienna, Aug.
[10] R. Cappelli, A. Lumini, and D. Maio. Fingerprint classification by directional im-
age partitioning. IEEE transactions on pattern analysis and machine intelligence,
21(5):402–421, 1999.
[11] F. Liu and R.W. Picard. Periodicity, directionality, and randomness: Wold features
for image modeling and retrieval.IEEE transactions on pattern analysis and machine
intelligence, 18(7):722–733, 1996.
16

[12] C.H. Park and H. Park. Kernel discriminant analysis based on generalized singular
value decomposition. Technical Reports 03-017, Department of Computer Science
and Engineering, University of Minnesota, Twin Cities, 2003.
[13] C.I. Watson and C.L. Wilson. NIST special database 4. fingerprint database. National
Institute of Standard and Technology(March 1992).
[14] A.V. Oppenheim, A.S. Willsky, and I.T. Young.Signals and Systems. Prentice-Hall,
1983.
[15] K. Fukunaga.Introduction to Statistical Pattern Recognition. Acadamic Press, second
edition, 1990.
[16] P. Howland, M. Jeon, and H. Park. Structure preserving dimension reduction for
clustered text data based on the generalized singular valuedecomposition. SIAM
Journal on Matrix Analysis and Applications, 25(1):165–179, 2003.
[17] P. Howland and H. Park. Generalizing discriminant analysis using the generalized
singular value decomposition.IEEE transactions on pattern analysis and machine
intelligence, to appear. Also available in Technical Reports 03-013, Department of
Computer Science and Engineering, University of Minnesota, Twin Cities, 2003.
[18] S. Mika, G. Ratsch, J. Weston, B. Scholkopf, and K.-R. Muller. Fisher discriminant
analysis with kernels. In E.Wilson J.Larsen and S.Douglas,editors,Neural networks
for signal processing IX, pages 41–48. IEEE, 1999.
[19] G. Baudat and F. Anouar. Generalized discriminant analysis using a kernel approach.
Neural computation, 12:2385–2404, 2000.
[20] V. Roth and V. Steinhage. Nonlinear discriminant analysis using kernel functions.
Advances in neural information processing systems, 12:568–574, 2000.
17
[21] S.A. Billings and K.L. Lee. Nonlinear fisher discriminant analysis using a minimum
squared error cost function and the orthogonal least squares algorithm. Neural net-
works, 15(2):263–270, 2002.
[22] N. Cristianini and J. Shawe-Taylor.An Introduction to Support Vector Machines and
other kernel-based learning methods. Cambridge, 2000.
About the Author- Cheong Hee Park received her Ph.D. in Mathematics from Yonsei
University, Korea in 1998. She received the M.S. and Ph.D. degrees in Computer Science
at the Department of Computer Science and Engineering, University of Minnesota in 2002
and 2004 respectively. Her research interests include pattern recognition, data mining,
bioinformatics and machine learning.
About the Author-Haesun Park received her B.S. degree in Mathematics from Seoul
National University, Seoul Korea, in 1981 with summa cum laude and the university presi-
dent’s medal as the top graduate of the university. She received her M.S. and Ph.D. degrees
in Computer Science from Cornell University, Ithaca, NY, in1985 and 1987, respectively.
She has been on faculty at Department of Computer Science andEngineering, University
of Minnesota, Twin Cities since 1987, where currently she isa professor. Her current re-
search interests include numerical linear algebra, pattern recognition, information retrieval,
data mining, and bioinformatics. She served on the editorial board of SIAM Journal on
Scientific Computing, Society for Industrial and Applied Mathematics, from 1993 to 1999.
Currently, she is on the editorial board of Mathematics of Computation, American Mathe-
matical Society, BIT Numerical Mathematics, and Computational Statistics and Data Anal-
ysis, International Association of Statistical Computing, a special issue on numerical linear
algebra and statistics. She has recently served on the committees of several meetings in-
cluding the program committees for text mining workshop at SIAM conference on Data
18

Mining for past several years. Since November, 2003, she hasbeen at the National Science
Foundation as a program director in the Devision of Computer& Communication Founda-
tions, the Directorate of Computer and Information Scienceand Engineering (CISE/CCF).
19

Figure 1. Fingerprint images
Figure 2. The fingerprint and absolute magnitude images by FFT
Figure 3. Directional filter
Figure 4.M� of p = 2, a = 1:2 and� = 45ÆFigure 5. The directional images
Table 1. The distribution of fingerprints in NIST database 4
Table 2. The prediction accuracies for the five-class classification problem (1)
Table 3. The confusion matrix
Table 4. The prediction accuracies for the five-class classification problem (2)
Table 5. The prediction accuracies for the four-class classification problem
20
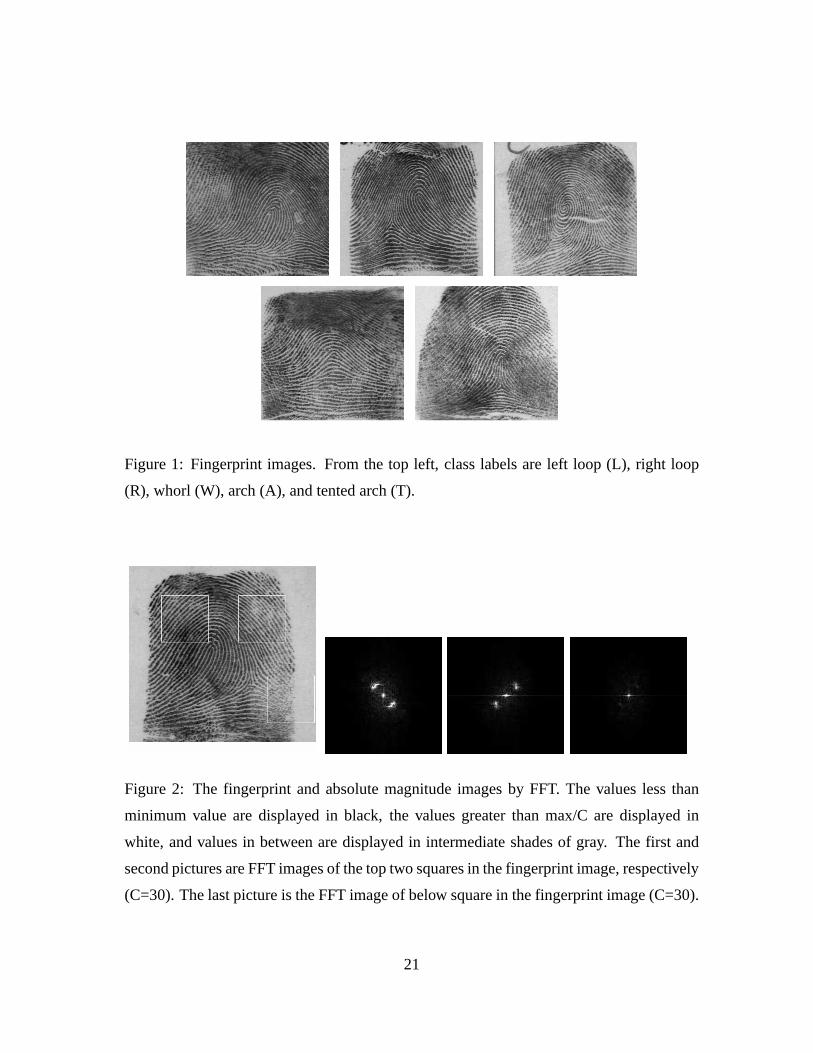
Figure 1: Fingerprint images. From the top left, class labels are left loop (L), right loop
(R), whorl (W), arch (A), and tented arch (T).
Figure 2: The fingerprint and absolute magnitude images by FFT. The values less than
minimum value are displayed in black, the values greater than max/C are displayed in
white, and values in between are displayed in intermediate shades of gray. The first and
second pictures are FFT images of the top two squares in the fingerprint image, respectively
(C=30). The last picture is the FFT image of below square in the fingerprint image (C=30).
21

05
1015
2025
30
0
5
10
15
20
25
30
0
0.5
1
1.5
Figure 3: Directional filterD� of p = 16, a = 1:5, b = 32=3 and� = 0.
50 100 150 200 250 300 350 400
50
100
150
200
250
300
350
400
Figure 4:M� of p = 2, a = 1:2 and� = 45Æ: The values are displayed in gray scale and
pixel points of the size5� 5 are shown as�.
22
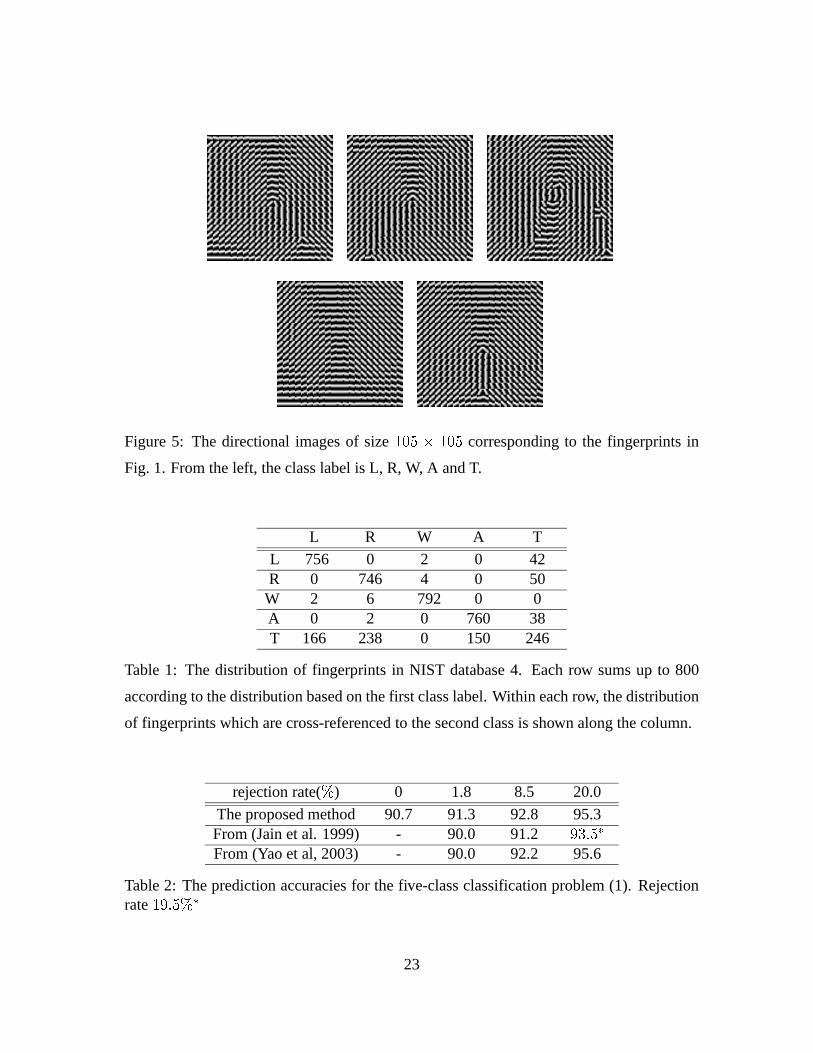
Figure 5: The directional images of size105 � 105 corresponding to the fingerprints in
Fig. 1. From the left, the class label is L, R, W, A and T.
L R W A T
L 756 0 2 0 42R 0 746 4 0 50W 2 6 792 0 0A 0 2 0 760 38T 166 238 0 150 246
Table 1: The distribution of fingerprints in NIST database 4. Each row sums up to 800
according to the distribution based on the first class label. Within each row, the distribution
of fingerprints which are cross-referenced to the second class is shown along the column.
rejection rate(%) 0 1.8 8.5 20.0
The proposed method 90.7 91.3 92.8 95.3From (Jain et al. 1999) - 90.0 91.2 93:5�From (Yao et al, 2003) - 90.0 92.2 95.6
Table 2: The prediction accuracies for the five-class classification problem (1). Rejectionrate19:5%�
23
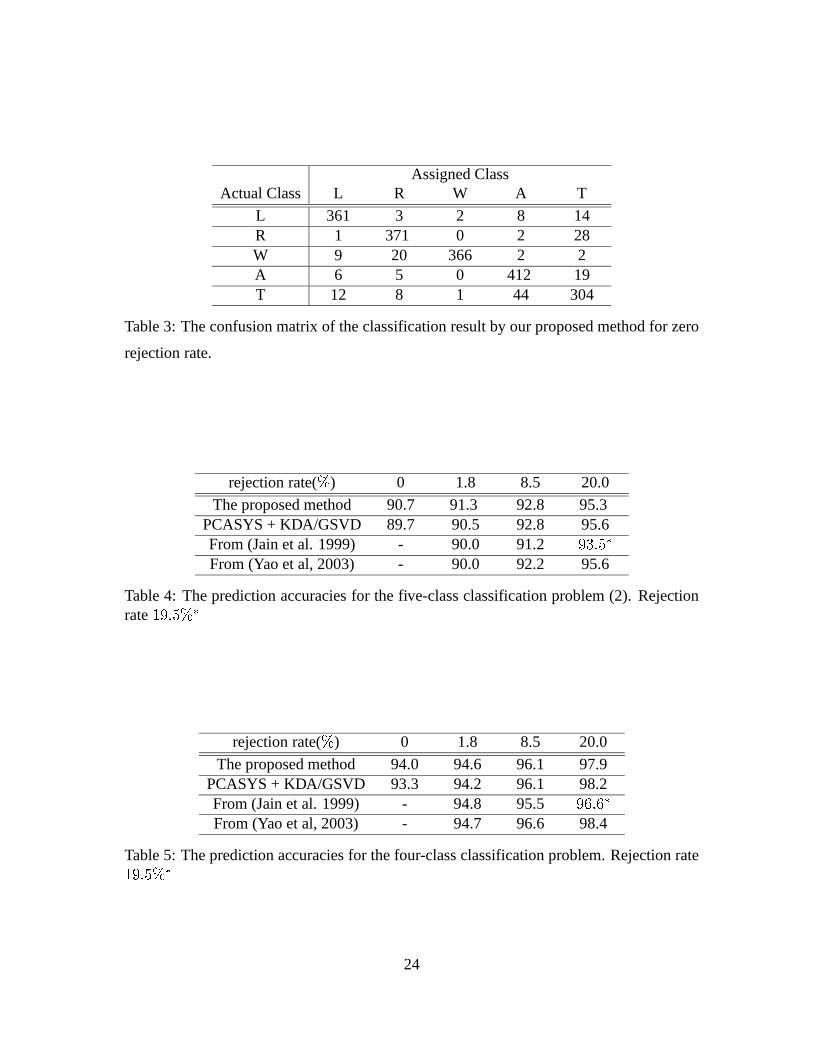
Assigned ClassActual Class L R W A T
L 361 3 2 8 14R 1 371 0 2 28W 9 20 366 2 2A 6 5 0 412 19T 12 8 1 44 304
Table 3: The confusion matrix of the classification result by our proposed method for zero
rejection rate.
rejection rate(%) 0 1.8 8.5 20.0
The proposed method 90.7 91.3 92.8 95.3PCASYS + KDA/GSVD 89.7 90.5 92.8 95.6From (Jain et al. 1999) - 90.0 91.2 93:5�From (Yao et al, 2003) - 90.0 92.2 95.6
Table 4: The prediction accuracies for the five-class classification problem (2). Rejectionrate19:5%�
rejection rate(%) 0 1.8 8.5 20.0
The proposed method 94.0 94.6 96.1 97.9PCASYS + KDA/GSVD 93.3 94.2 96.1 98.2From (Jain et al. 1999) - 94.8 95.5 96:6�From (Yao et al, 2003) - 94.7 96.6 98.4
Table 5: The prediction accuracies for the four-class classification problem. Rejection rate19:5%�24