finger tapping clinimetric score prediction in parkinson's disease
TRANSCRIPT

Hindawi Publishing CorporationComputational Intelligence and NeuroscienceVolume 2013, Article ID 717853, 13 pageshttp://dx.doi.org/10.1155/2013/717853
Research ArticleFinger Tapping Clinimetric Score Prediction in Parkinson’sDisease Using Low-Cost Accelerometers
Julien Stamatakis,1,2 Jérome Ambroise,2,3 Julien Crémers,1,4 Hoda Sharei,1
Valérie Delvaux,1,4 Benoit Macq,2 and Gaëtan Garraux1,4
1 Movere Group, Cyclotron Research Centre, University of Liege, Sart Tilman B30, 4000 Liege, Belgium2 Institute of Information and Communication Technologies, Electronics and Applied Mathematics, Universite Catholique de Louvain,Place du Levant 2, 1348 Louvain-la-Neuve, Belgium
3 Institut de Recherche Exprimentale et Clinique, Center for Applied Molecular Technologies, Universite Catholique de Louvain,Chapelle-aux-Champs 30, 1200 Woluwe-St-Lambert, Belgium
4Department of Neurology, University Hospital Centre, University of Liege, Sart Tilman B35, 4000 Liege, Belgium
Correspondence should be addressed to Julien Stamatakis; [email protected]
Received 29 August 2012; Revised 4 March 2013; Accepted 5 March 2013
Academic Editor: Christian W. Dawson
Copyright © 2013 Julien Stamatakis et al. This is an open access article distributed under the Creative Commons AttributionLicense, which permits unrestricted use, distribution, and reproduction in any medium, provided the original work is properlycited.
Themotor clinical hallmarks of Parkinson’s disease (PD) are usually quantified by physicians using validated clinimetric scales suchas the Unified Parkinson’s Disease Rating Scale (MDS-UPDRS). However, clinical ratings are prone to subjectivity and inter-ratervariability. The PD medical community is therefore looking for a simple, inexpensive, and objective rating method. As a first steptowards this goal, a triaxial accelerometer-based systemwas used in a sample of 36 PD patients and 10 age-matched controls as theyperformed theMDS-UPDRSfinger tapping (FT) task. First, raw signals were epoched to isolate the successive single FTmovements.Next, eighteen FT task movement features were extracted, depicting MDS-UPDRS features and accelerometer specific features. Anordinal logistic regressionmodel and a greedy backward algorithmwere used to identify themost relevant features in the predictionof MDS-UPDRS FT scores, given by 3 specialists in movement disorders (SMDs). The Goodman-Kruskal Gamma index obtained(0.961), depicting the predictive performance of the model, is similar to those obtained between the individual scores given by theSMD (0.870 to 0.970).The automatic prediction ofMDS-UPDRS scores using the proposed systemmay be valuable in clinical trialsdesigned to evaluate and modify motor disability in PD patients.
1. Introduction
The most important functional disturbance in patients withParkinson’s disease (PD), a chronic neurodegenerative condi-tion, is a disorder of voluntary movement prominently char-acterized by slowness. This phenomenon is generally calledbradykinesia [1]. Tremor and muscle rigidity are also partof the motor phenotypic spectrum [2]. Although it has notbeen possible to define a single underlying pathophysiologicmechanism that explains everything, bradykinesia and othermotor symptoms seem to be related to a progressive loss ofdopaminergic neurons in the substantia nigra [2, 3].
Since decades, themedical community has been develop-ing clinical tools such as rating scales to quantify the severity
of motor and other symptoms in PD. Despite the variousattempts to use instruments and devices for quantification,clinical scales remain the preferred method because they areeasy to administer and widely available.
In the late eighties, theUnified Parkinson’s Disease RatingScale (UPDRS) was proposed as the primary internationalrating scale for PD clinical care and research and is stillanchored in the daily practice of MDs. The motor examina-tion part of the UPDRS requires the Specialists in MovementDisorders (SMDs) to score motor disturbances on a 5-pointscale ranging from 0 (normal performance) to 4 (severe,unable to perform the task) on the basis of visual inspection.In 2008, the Movement Disorder Society has published anupgraded version of the original UPDRS [4], based on
2 Computational Intelligence and Neuroscience
the critiques that were formulated by the Task Force forRating Scales in Parkinson’s disease [5].The new scale (MDS-UPDRS) has been shown to be more sensitive for slightimpairments and to enable a more objective rating throughdetailed instructions for all tasks. However, theMDS-UPDRSstill suffers from methodological limitations common to allclinical rating scales including subjectivity and interratervariability [6].
Objective quantitative measures usingmovement sensorscan assist clinicians in evaluating motor deficits. Inertial andmagnetic sensors have been proposed to quantify motorperformances in various medical applications [7], fromthe distinction between normal and pathological walkingpatterns [8] to the estimation of upper limb orientationbased on accelerometer and gyroscope measurements [9].These sensors are small, low-cost, light-weighted, and canrecord components of the movements as accelerations ordisplacements. Their use is not restricted to laboratoryenvironments [8], and they do not suffer from occlusionproblems as expensive visual marker-based tracking systems[10]. Accelerometers have therefore become a preferredchoice for continuous, unobtrusive, and reliable methodin human movement quantification [7]. In PD, inertialsensors have been proposed to investigate the asymmetryof tremor intensity and frequency [11], to quantify tremorand bradykinesia [12], to study the dynamics of restingand postural limb tremor [13], or to analyze the dynamicvoluntary muscle contractions [14]. Accelerometers have alsobeen used to quantify the impairment of finger tapping(FT) movements [1, 15, 16], to study the effect of movementfrequency on repetitive finger movements [17], or to pro-pose new parameters for the quantification of the FT test[18].
The reason why those more sophisticated sensor systemshave not been adopted yet in daily clinical practices is thatthose systems are too expensive, too sophisticated for clinicalneeds, and too heavy to handle for patients. A way to improvemovement evaluation while still using clinical scales is todevelop systems that will assess movements during clinicalscale tasks and predict clinical scale scores automatically. Afirst approach consists in evaluating the correlations betweenkinematic measures from motion sensors and clinical scales,which is a growing field of research. The reliability of aModified Bradykinesia Rating Scale and its correlation withkinematic measures from inertial sensors has recently beenevaluated [19]. Giuffrida et al. have evaluated the correlationbetween a multiple linear regression model and original-UPDRS scores for tremor tasks [6].
In order to improve the diagnosis accuracy of PD, a toolto predict FT scores from MDS-UPDRS FT task movementfeatures is presented here.
2. Materials and Methods
2.1. Subjects and Materials. Thirty-six PD patients (meanage ± SD = 63.9 ± 9.1 year, range 37–79; 28 males; meandisease duration = 7.5 ± 4.0 year, total score of MDS-UPDRS motor examination = 32 ± 10.8) and ten healthy
𝑥
𝑦𝑧
Accelerometer
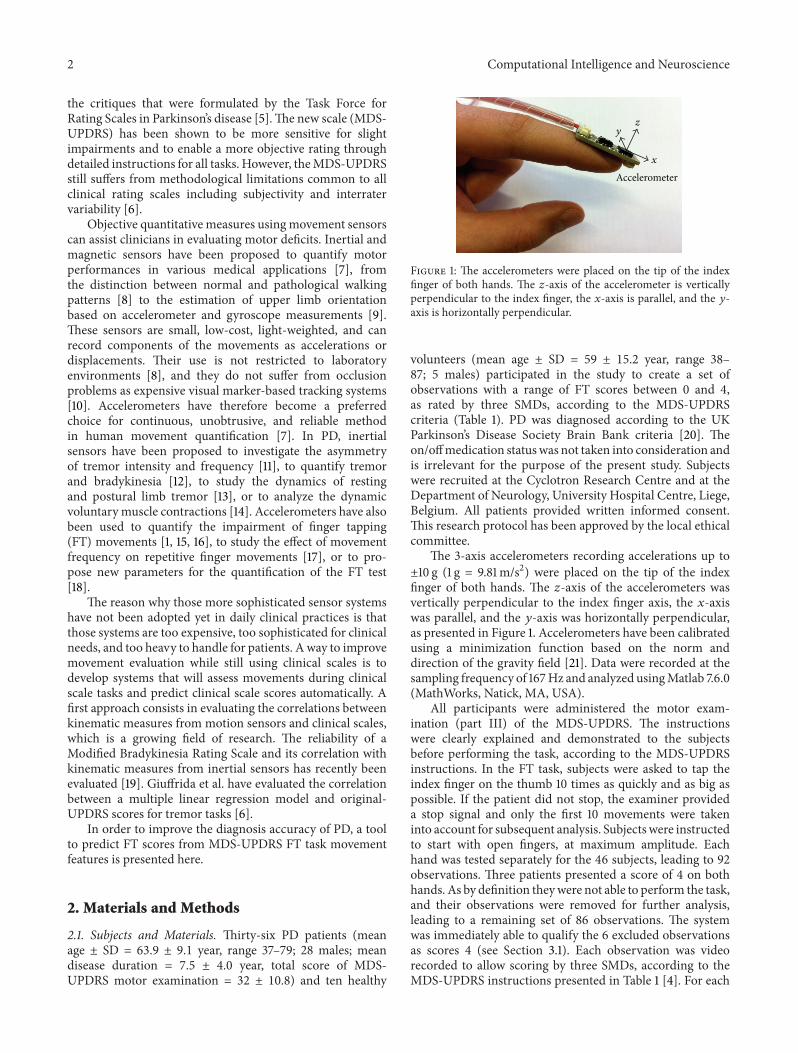
Figure 1: The accelerometers were placed on the tip of the indexfinger of both hands. The 𝑧-axis of the accelerometer is verticallyperpendicular to the index finger, the 𝑥-axis is parallel, and the 𝑦-axis is horizontally perpendicular.
volunteers (mean age ± SD = 59 ± 15.2 year, range 38–87; 5 males) participated in the study to create a set ofobservations with a range of FT scores between 0 and 4,as rated by three SMDs, according to the MDS-UPDRScriteria (Table 1). PD was diagnosed according to the UKParkinson’s Disease Society Brain Bank criteria [20]. Theon/offmedication statuswas not taken into consideration andis irrelevant for the purpose of the present study. Subjectswere recruited at the Cyclotron Research Centre and at theDepartment of Neurology, University Hospital Centre, Liege,Belgium. All patients provided written informed consent.This research protocol has been approved by the local ethicalcommittee.
The 3-axis accelerometers recording accelerations up to±10 g (1 g = 9.81m/s2) were placed on the tip of the indexfinger of both hands. The 𝑧-axis of the accelerometers wasvertically perpendicular to the index finger axis, the 𝑥-axiswas parallel, and the 𝑦-axis was horizontally perpendicular,as presented in Figure 1. Accelerometers have been calibratedusing a minimization function based on the norm anddirection of the gravity field [21]. Data were recorded at thesampling frequency of 167Hz and analyzed usingMatlab 7.6.0(MathWorks, Natick, MA, USA).
All participants were administered the motor exam-ination (part III) of the MDS-UPDRS. The instructionswere clearly explained and demonstrated to the subjectsbefore performing the task, according to the MDS-UPDRSinstructions. In the FT task, subjects were asked to tap theindex finger on the thumb 10 times as quickly and as big aspossible. If the patient did not stop, the examiner provideda stop signal and only the first 10 movements were takeninto account for subsequent analysis. Subjects were instructedto start with open fingers, at maximum amplitude. Eachhand was tested separately for the 46 subjects, leading to 92observations. Three patients presented a score of 4 on bothhands. As by definition theywere not able to perform the task,and their observations were removed for further analysis,leading to a remaining set of 86 observations. The systemwas immediately able to qualify the 6 excluded observationsas scores 4 (see Section 3.1). Each observation was videorecorded to allow scoring by three SMDs, according to theMDS-UPDRS instructions presented in Table 1 [4]. For each

Computational Intelligence and Neuroscience 3
Table 1: MDS-UPDRS instructions for FT task scoring [4] (instructthe patient to tap the index finger on the thumb 10 times as quicklyand as big as possible. Rate each side separately, evaluating speed,amplitude, hesitations, halts, and decrementing amplitude).
Score Scoring instructions0 No problems
1
Any of the following:(a) the regular rhythm is broken with one or twointerruptions or hesitations of the tapping movement;(b) slight slowing;(c) the amplitude decrements near the end of the 10taps.
2
Any of the following:(a) 3 to 5 interruptions during tapping;(b) mild slowing;(c) the amplitude decrements midway in the 10-tapsequence.
3
Any of the following:(a) more than 5 interruptions during tapping or at leastone longer arrest (freeze) in ongoing movement;(b) moderate slowing;(c) the amplitude decrements starting after the 1st tap.
4 Cannot or can only barely perform the task because ofslowing, interruptions, or decrements.
observation, the SMD consensus score was defined as themean score rounded to the nearest integer.
2.2. Signal Epoching. The first processing step was to epochthe recorded data in order to isolate the first 10 consecutive FTmovements or samples. A single FT movement was definedas the interval between two taps, that is, when the indextapped the thumb, which resulted in a high frequency andhigh amplitude peak in the 𝑧-axis signal. These peaks wereidentified using the high frequency output of the Daubechieswavelet transform (db4) of the recorded 𝑧-axis signal. The 𝑧-axis recorded accelerations and their epoching are presentedfor an SMD consensus score of 0 obtained in a healthyvolunteer (Figure 2) and for an SMD consensus score of3 obtained in a PD patient (Figure 3). Another importantlandmark in each FT movement is the time for maximumopening acceleration that is represented by a low frequencybut high amplitude peak in themidst of the 𝑧-axismovement,which occurs when the subject splits off his/her fingers.
2.3. Feature Definition and Extraction. According to theMDS-UPDRS, bradykinesia during the FT task is clinicallycharacterized bymovement slowness, and/or a decrementingspeed and/or amplitude of repetitive movements, and/orhesitations [22]. Hesitations can occur at the initiation ofthe opening/closing movement (initiation hesitation) or dur-ing the finger opening movement (execution hesitation orhypometria).
After epoching, 8 MDS-UPDRS features were definedfrom the 10 consecutive FT movements to capture these
1 2 3 4 5 6 7 8 9 10 11
Time (s)
1
2 3
4
5 6
7
8
9
108
6
4
2
0
−2
−4
𝑧-a
xis a
ccel
erat
ions
(𝑔)
Figure 2: 𝑧-axis raw signal for an SMD consensus score of 0obtained from a healthy volunteer performing 10 FT movements.The bullets topped by numbers represent the beginning of a newtappingmovement, that is, when the index taps the thumb.The peakin the midst of each movement depicts the finger opening phase.
2 4 6 8 10 12 14 16
012345678
−1
1
2
3
4 5 6
7
8910
Time (s)
𝑧-a
xis a
ccel
erat
ions
(𝑔)
Figure 3: 𝑧-axis raw signal for an SMD consensus score of 3obtained from a PD patient performing 10 FT movements. Thebullets topped by numbers represent the beginning of a new tappingmovement, that is, when the index taps the thumb. The peak in themidst of each movement depicts the finger opening phase.
clinical characteristics on the basis of the computed move-ment frequency, the opening angle, the level of hypometria,and their linear changes across the 10 FT movements. Tenaccelerometer-specific features were also extracted on thebasis of the percentage of movement time for maximumopening acceleration,maximumclosing and opening acceler-ations, and their linear changes across the 10 FT movements.Table 2 gives a summary of the features along with theirminimum and maximum values across the 86 observations.
Among the MDS-UPDRS features, the movement speedwas expressed through themeanmovement frequency (Freq)which was computed from the inverse of each movementtime. In order to depict the prospective decrementing speed(Dfreq), we estimated the number of movements executedbefore the decrement started using a statistical t-test. Foreach FT movement in a given series, we compared themean FT frequency of the remaining movements with themean frequency of FT movements already completed. Weexamined whether this difference was significant using at-test (𝑃 < 0.05). If the difference in frequency for twoconsecutive t-tests was significant, the FT movement leading

4 Computational Intelligence and Neuroscience
Table 2: Features summary with minimum and maximum valuesacross the 86 observations. The 8 MDS-UPDRS features are pre-sented first.
Feature Feature definition Min MaxFreq Mean movement frequency (Hz) 0.367 5.106Dfreq Index for decrementing frequency (—) 2 10Afreq Index for augmenting frequency (—) 2 10Angle Mean opening angle (∘) 5.139 117.8Dangle Index for decrementing angle (—) 2 10Hypom Hypometria (—) 0 10Hesits Number of hesitations (—) 0 5Halts Number of halts (—) 0 1Topen Mean, standard deviation, and slope
of percentage of movement timefor maximum openingacceleration (—)
0.191 0.533sdTopen 0.017 0.232slTopen −0.031 0.032Aclose
Mean, standard deviation, and slope ofmaximum closing acceleration (g)
1.131 9.676sdAclose 0.338 3.145slAclose −0.448 0.603Aopen
Mean, standard deviation, and slope ofmaximum opening acceleration (g)
0.761 10.81sdAopen 0.054 1.483slAopen −0.304 0.364RMS Root mean square (g) 0.942 4.047
to the first significant difference was used to determinethe prospective decrementing speed onset. Therefore, if nodecrement was observed, a value of 10 was obtained for thatfeature. The same method was used to detect an increase inmovement speed (Afreq).
The possible presence of halts in the movement (Halts)was also a clinical characteristic. Halts were detected if thedifference between a movement frequency and the frequencyslope (linear changes among the 10 samples, computed withthe robustfit Matlab function) was above a given threshold.
The number of hesitations was also computed (Hesits).A sample was defined as a hesitation if its frequency or per-centage movement time for maximum opening accelerationwas outside a range defined from the mean, the standarddeviation, and the slope. Each sample with a hesitationincrements the value of the Hesitation feature.
The level of hypometria can be depicted by the smoothnessof the opening movement (Hypom). For a healthy subject,this movement is composed of one acceleration and onedeceleration, which gives the lower frequency but highamplitude peak in the midst of the FT movement. In PDpatients, this opening movement could be a mix of multipleaccelerations and decelerations, due to execution hesitations,which are reflected by multiple peaks in the recorded 𝑧-axis acceleration. Indeed, bradykinesia is characterized by theinability to energize the appropriate muscles to initiate andmaintain large and fast movements. PD patients thereforeneed series of multiple agonist bursts to accomplish a largermovement [22]. Here, these bursts were detected using thefindpeaksMatlab function. Each sample with more than two
peaks was used to increment the value of the Hypometriafeature.
In order to express the amplitude of the movement(Angle) and its possible decrementation (Dangle), themean ofthe opening angles was computed. An attribute of accelerom-eters is that static acceleration due to gravity is recorded aswell as inertial components ofmovements [8]. Under static orquasistatic conditions, that is, when the recorded accelerationis mainly due to gravity, the accelerometer can be used as aninclinometer and basic trigonometry gives the angle of tilt.The opening angle is based on the value of the gravity in the𝑥-axis when the fingers are open (𝑎𝑥
2) and closed (𝑎𝑥
1), according
to (1). During these two periods, the recorded acceleration isonly due to gravity and tremor. As tremor is minimum in the𝑥-axis, the parallel direction to the finger, the mean gravityis computed on that axis. The detection of open and closedfingers is based on the variance of the 𝑥-axis processed signal.In order to depict the prospective decrementing amplitude,the same t-test method as presented before is used. Consider
opening angle = 𝜃open − 𝜃closed
= arcsin (𝑎𝑥2) − arcsin (𝑎𝑥
1) .
(1)
Among the accelerometer-specific features, we definedthe mean (Topen), standard deviation (sdTopen), and slope(slTopen) of the percentage of movement time when maxi-mum opening acceleration occurred across the 10 FT move-ments.
The mean, standard deviation, and slope of maximumclosing accelerations (Aclose, sdAclose, and slAclose) andmax-imum opening accelerations (Aopen, sdAopen, and slAopen)were also extracted from the 𝑧-axis recorded accelerations.The features associated with the maximum closing accel-eration express the strength of the finger tap while thefeatures associated with the maximum opening accelerationrepresent the speed of the opening movement. Since theAclose and Aopen features are based on the amplitude ofthe accelerations, the gravitational artifact due to the gravitycomponent in the recorded acceleration must be considered.TheDC component of gravitational acceleration can easily beremoved by high-pass filtering. However, the task of separat-ing the gravitational and inertial components of accelerationat the frequency of rotation is impossible unless multiplesensors are used [23]. As feature extraction is performed,the gravitational artifact is no longer a problem as long as itremains constant or negligible as compared with the rangeof the feature. When the fingers are closed, the gravity fieldis parallel to the 𝑧-axis and its value is about 1 g. As thesubject splits off its fingers, the 𝑧-axis component of thegravity varies as 𝑔 cos𝛼, where 𝛼 is the angle between the 𝑧-axis and the gravity field. The maximum closing accelerationis extracted as the peak acceleration when the index tapsthe thumb, that is, when the 𝑧-axis is parallel to the gravityfield, according to the instructions given to the subjects.Therefore, the gravitational artifact is nearly constant atthis time. The maximum opening acceleration occurs at thebeginning of the opening movement, that is, when 𝛼 ≤ 45∘.The gravitational artifact has then a maximum variation of

Computational Intelligence and Neuroscience 5
0.292 g, which is negligible as compared with the range of thefeature value (9.538 g—Table 2).
The last extracted feature was the root mean square(RMS) that gives a measure of the signal magnitude, as usedin [6].
Altogether, theMDS-UPDRS features and the accelerom-eter-specific features formed a set of 18 FT task movementfeatures.
2.4. Construction of the Predictive Model. The main goal ofthis work was to develop a tool to predict objective MDS-UPDRS scores from FT task movement features and toidentify which of these features best predicted MDS-UPDRSFT scores given by 3 SMDs independently, on the basis of thecorresponding video recordings. As the outcome is discreteand has a natural order, the MDS-UPDRS score predictionproblem was addressed using an ordinal logistic regressionmodel.
2.4.1. Ordinal Logistic Regression Model. Logistic regressionis a statistical tool used to predict a discrete outcome, suchas group membership, from a set of predictor variables thatmay be continuous or discrete. If the outcome is binary (𝑦 =0, 1) and if we have 𝑝 predictor variables 𝑥
1, 𝑥2, . . ., 𝑥
𝑝,
the systematic part of the binary logistic regression model isdefined as follows:
log (𝜃) = 𝛼 + 𝛽1𝑥1+ 𝛽2𝑥2+ ⋅ ⋅ ⋅ + 𝛽
𝑝𝑥𝑝, (2)
with
𝜃 =
𝑃 (𝑦 = 1 | 𝑥1, 𝑥2, . . . , 𝑥
𝑝)
1 − 𝑃 (𝑦 = 1 | 𝑥1, 𝑥2, . . . , 𝑥
𝑝)
. (3)
The logit of the probability of the outcome 𝑦 (i.e., thelogarithm of the odds 𝜃 of event 𝑦) is modeled as a linearcombination of the predictor variables. When the outcomeis discrete but not binary as in this study (𝑦 = 0, 1, 2 or 3),the binary logistic regression model can be extended intoan ordinal logistic regression model, by taking into accountthe ordinal nature of the outcome. Here, the probability thata subject belongs to one of the categories equal or orderedbefore 𝑗 (𝑃(𝑦 ≤ 𝑗)) is compared to the probability thatthe patient belongs to one of the categories ordered after𝑗 (𝑃(𝑦 > 𝑗)). The systematic part of the ordinal logisticregression model is defined as follows:
log (𝜃𝑗) = 𝛼𝑗− 𝛽1𝑥1− 𝛽2𝑥2− ⋅ ⋅ ⋅ − 𝛽
𝑝𝑥𝑝, (4)
with
𝜃𝑗=
𝑃 (𝑦 ≤ 𝑗 | 𝑥1, 𝑥2, . . . , 𝑥
𝑝)
𝑃 (𝑦 > 𝑗 | 𝑥1, 𝑥2, . . . , 𝑥
𝑝)
with (𝑗 = 0, 1, 2) . (5)
The 𝛼𝑗and 𝛽 coefficients are estimated from the data by
using a maximum likelihood procedure. In these equations,we observe that each of the three logit log(𝜃
𝑗) has its own 𝛼
𝑗
term but the same 𝛽 coefficients. It means that the effect of
the predictor variables is the same for the three logit or, equiv-alently, for each odds 𝜃
𝑗. We also observe a minus sign before
the predictor variables coefficients because probabilities inthe ordinal logistic regressionmodel are defined in a differentway from those in the binary logistic regression model.A positive estimation of a parameter therefore indicates apositive correlation between its associated variable and theSMD consensus score.
In order to use this ordinal regression model as aprediction tool, the model must first be trained on a trainingdataset. In this training dataset, each observation is associatedwith the FT task movement features (considered as predictorvariables in the model) as well as an SMD consensus score(considered as the outcome variable in the model). Then,the ordinal logistic regression model can be applied to newobservations with unknown MDS-UPDRS scores in order topredict these scores from their FT task movement features.The probability to belong to each ordered class 𝑃(𝑦) canindeed be computed for a single observation from the 𝜃
𝑗
values.Then, a continuous score can be obtained by summingthe values of the outcome (0, 1, 2, or 3) multiplied by theestimated 𝑃(𝑦). This continuous score ranges between 0 and3 and can be discretized, if necessary, by using thresholds.
A global model was trained on the 86 observations(Figure 4). It is of note that all eighteen features may notbe useful in building the model. A subset of features can beselected to try to maximize the predictive performance of themodel. Here, we used a greedy backward algorithm to selectthe subset of features that best predicted MDS-UPDRS FTscores (Figure 5). Then, since the global model was trainedon all the observations, its predictive performance could notbe evaluated on an independent dataset. Therefore, in orderto estimate the predictive performance of the global model, aleave-one-out cross-validation approach was used (Figure 6).Construction of the global model, feature selection, andperformance evaluation were performed using the Design,vcdExtra, and Zelig R packages (The R Project for StatisticalComputing).
2.4.2. Feature Selection. For the global model construction,feature selection was performed once on the 86 observations.Indeed, a subset of the 18 features extracted from the FT taskonly could be useful to build the ordinal logistic regressionmodel in order to maximize the predictive performance ofthe model. The selection of the variable set maximizing thepredictive performance of the model is known as a variableselection problem [24]. In order to take into account theinteraction effect between the predictor variables, we used awrapper technique for variable selection. Various subsets ofvariables, that is, features, are generated and evaluated [25].The various subsets of features are generated using a greedybackward selection. Greedy search strategies are computa-tionally advantageous and robust against overfitting [24].Theidea is to start with a model containing all the features andto evaluate its predictive performance.Then, the less relevantfeatures are removed iteratively. The predictive performanceassociated to a subset of features was evaluated in two steps.First, an inner cross-validation loop was performed in order

6 Computational Intelligence and Neuroscience
86 observations
18 features
No performanceevaluation
Global modelconstruction
Figure 4: A global model was trained based on the 86 observations,each one of them being associated with 18 features as well as oneSMD consensus score. Since all the observations were used for theconstruction of the global model, the predictive performance of themodel could not be evaluated on an independent dataset.
86 observations
18 features
No performanceevaluation
Global modelconstruction
Feature selection
Figure 5: Not all 18 features may be useful in building the model.A subset of features can be selected to maximize the predictiveperformance of the model.
86 observations
18 featuresFeature selection
Modelconstruction
Performanceevaluation
Leave-one-out cross-validation
Figure 6: In order to evaluate the predictive performance of theglobal model, a leave-one-out cross-validation approach was used.
to obtain a prediction score for each observation. Second, theGoodman-Kruskal Gamma index between the predictionsand the SMD consensus scores was computed and definedas the performance criterion. This index tests the strengthof association of cross-tabulated data when both variablesare measured at the ordinal level [26]. At each iteration, thefeature elimination conducting to the highest improvementof the Goodman-Kruskal Gamma index was performed. Thebackward elimination stops when any feature eliminationleads to a decrease of this index.
2.4.3. Predictive Performance Evaluation. Leave-one-outcross-validation, with an inner and outer loop, was per-formed to estimate the predictive performance of the globalmodel. At each iteration of the outer loop, the dataset wasseparated into a learning part and a test part. The learningpart contained 85 observations while the test part onlycontained the remaining observation. The learning part wasused to select the relevant predictor variables through awrapper technique (using an inner cross-validation loop asexplained in Section 2.4.2) and to train the ordinal logisticregression model. The selection of the relevant variableswas performed only on the training part in order to avoidoverestimation of predictive performance. After the trainingstep, the model was used to predict the MDS-UPDRS scoreof the remaining observation in the test part. This procedurehas been repeated 86 times in order to have predictions forall the observations. Eighty-six subsets of relevant featureswere therefore obtained during cross-validation. Finally,
each observation was associated to a continuous predictionbetween 0 and 3 as well as a discrete SMD consensus score(0, 1, 2, or 3). Various performance indexes were computedin order to evaluate the predictive performance of themodel.
The area under the curve (AUC) of the receiver operatingcharacteristic (ROC)was computed.TheROC curve plots thesensitivity (true positive rate) against 1− specificity (false pos-itive rate) for consecutive thresholds used to define predictedpositives and negatives from the continuous scores [27]. AnAUC of 0.5 corresponds to a noninformative model while anAUC of 1 corresponds to a perfect model. The accuracy wasdefined as the proportion of correct classifications among allthe classifications. Sensitivity, specificity, and consequentlyAUC, as well as accuracy, can only be computed for binaryclassification tasks. As the outcome is discrete with fourordered classes, the problem had to be reformulated into thethree following binary classification problems:
(i) first classification task: separate observations with ascore of 0 from observations with a score greater than0;
(ii) second classification task: separate observations witha score of 0 or 1 from observations with a score greaterthan 1;
(iii) third classification task: separate observations with ascore of 0, 1 or 2 fromobservationswith a score greaterthan 2.
In order to compute the next performance indexes,discretized scores were necessary. Thresholds were used todiscretize the continuous scores into the four ordered classes.The sensitivity, specificity, and accuracy defined in (6) werethen computed as follows:
sensitivity = TPTP + FN
,
specificity = TNTN + FP
,
accuracy = TP + TNTP + TN + FP + FN
,
(6)
where TP, TN, FP, and FN denote the number of truepositives, true negatives, false positives, and false negatives,respectively.
The discretized predictions were also used to compute theGoodman-Kruskal Gamma index between the predictionsand the SMD consensus scores. The values of Goodman-Kruskal Gamma index range from −1 (negative association)to 1 (perfect agreement).
3. Results
3.1. SMDConsensus Scores. According to the SMDconsensusscores, 12 observations led to a score of 0, 32 observationsled to a score of 1, 31 observations led to a score of 2, and 11observations led to a score of 3. Three patients also obtaineda score of 4 in both hands. However, those patients were not

Computational Intelligence and Neuroscience 7
included in the analysis since they could not perform thetask. No movement features could be extracted from theirmovements and the system immediately gave them a scoreof 4 based on the low variance of the recorded signals, witha 100% accuracy. The Goodman-Kruskal Gamma indexesobtained between the individual scores given by the threeSMD and the SMD consensus scores are 0.922, 0.982, and0.992, respectively. The Goodman-Kruskal Gamma indexobtained between the individual SMD scores varies between0.870 and 0.970.
3.2. Signal Epoching and Feature Extraction. Visual inspec-tion of epoched signals showed a very high accuracy (99%).Two parameters expressing the position and the width of thepeak detection windows had to be adapted for the epochingof signals recorded on tremulous PD patients and for thosewith a score of 3, who typically have hesitations or halts inmovements.
After signal epoching, 18 features were extracted fromthe MDS-UPDRS FT task on the basis of the computedmovement frequency, percentage ofmovement time formax-imum opening acceleration, maximum closing and open-ing accelerations, opening angle, and level of hypometriaas described in Section 2.3. The minimum and maximumvalues obtained for each feature across the 86 observationsappear in Table 2. The raw signal and extracted featuresare presented for a SMD consensus score of 0 obtainedfrom a healthy volunteer (Figures 2 and 7) and an SMDconsensus score of 3 obtained from a PD patient (Figures 3and 8). The healthy volunteer showed steady performanceover repetitive FT movements. The movement amplitude isbig and constant. The PD patient performed the FT task ata slower frequency but there was no sign of decrementingor augmenting frequency. The mean opening angle is quitelower and decrements over time, reflected by aDangle featurevalue of 2. So, the patient managed to keep a constantfrequency, but performed smaller and smaller movements.Three hesitations are also detected. These interpretations ofmovement features have been validated by examination of thecorresponding video recordings.
3.3. Ordinal Logistic Regression Model and Feature Selection.Feature selection was performed on the 86 observation inorder to build the global model. This model included 12 fea-tures as predictor variables. The model parameter estimatesappear in Table 3. The 𝛼 parameters have no particular inter-pretation.The positive (negative)𝛽 parameters correspond tovariables that are positively (negatively) correlated with theSMD consensus scores. For example, as the 𝛽
11coefficient is
negative, an increase of Aopen tends to conduct to a lowerSMD consensus score. This is illustrated in Figure 9. Theabsolute value of these parameters have to be carefully inter-preted by taking into account the range of the correspondingvariables. The very high 𝛽
9coefficient is partially due to
the very small range (0.063) of slTopen. As all observationswere used to train this model, its performance could not beevaluated on an independent test dataset. Nevertheless, it wasestimated with a cross-validation strategy.
Table 3: Model parameter estimates.
Parameter Estimation𝛼0
−18.768
𝛼1
−11.989
𝛼2
−4.066
𝛽1(Freq) −0.647
𝛽2(Dfreq) −0.726
𝛽3(Afreq) −0.238
𝛽4(Dangle) −0.411
𝛽5(Hesits) 1.398𝛽6(Halts) 16.653𝛽7(Topen) 5.858𝛽8(sdTopen) 25.089𝛽9(slTopen) 112.52𝛽10(slAclose) 3.966𝛽11(Aopen) −1.171
𝛽12(slAopen) −9.711
Table 4: SMD consensus scores versus predicted scores.
SMD consensus scores
Predictedscores 0 1 2 3
0 9 3 0 01 3 24 6 02 0 5 24 23 0 0 1 9
Table 5: AUC of the ROC, sensitivity, specificity, and accuracy foreach binary classification task.
Groups AUC Sens. Spec. Acc.0 versus 123 0.945 0.750 0.959 0.93001 versus 23 0.919 0.886 0.900 0.872012 versus 3 0.970 0.986 0.818 0.965
3.4. Predictive Performance Evaluation. After the nested(inner and outer loop) cross-validation, each observationwasassociated with a prediction score. As these scores are on acontinuous scale between 0 and 3, thresholdsmust be definedin order to classify the observations in the different orderedclasses and compute some of the performance indexes. As afirst approximation, thresholds of 0.5, 1.5, and 2.5 were used.A Goodman-Kruskal Gamma index of 0.961 was obtainedbetween the predictions and the SMD consensus scores.The ordered contingency table (Table 4) indicates the jointfrequency distribution of both the predictions and the SMDconsensus scores. We observed that the maximum deviationbetween the predictions and the SMD consensus scores is 1and that most observations are on the diagonal.
The sensitivity, the specificity, the accuracy, and the AUCof the ROC were computed using the predictions obtainedwith the nested cross-validation for each binary classificationtask and appear in Table 5. The ROC curve obtained for thesecond classification task is presented in Figure 10.

8 Computational Intelligence and Neuroscience
0 2 4 6 8 100
1
2
3
Freq
uenc
y (H
z)
Sample (—)
(a)
0 2 4 6 8 10
1
0.8
0.6
0.4
0.2
0
% M
vt ti
me (
—)
Sample (—)
(b)
0 2 4 6 8 100
2
4
6
8
10
Max
acce
lera
tion
( 𝑔)
Sample (—)
(c)
0 2 4 6 8 100
2
4
6
8
10
Max
acce
lera
tion
( 𝑔)
Sample (—)
(d)
0 2 4 6 8 10
0
50
100
150
200
Ang
le (∘
)
Sample (—)
(e)
0 2 4 6 8 100
2
4
6
8
10
Sample (—)
Leve
l hyp
omet
ria (—
)
(f)
Figure 7: Typical features for an SMD consensus score of 0. Plot (a) gives themovement frequencies (circles). Plot (b) gives the percentages ofmovement time for maximum opening acceleration. Plot (c) gives the maximum closing accelerations. Plot (d) gives the maximum openingaccelerations. Plot (e) gives the opening angles. Plot (f) gives the level of hypometria (circles) and the possible presence of initiation hesitations(triangles). For each plot except (f), the mean is in dotted line, the linear regression among points is in continuous line, and the limits for thedetection of hesitations are in dashed lines (plots (a) and (b) only). The healthy volunteer performed repetitive FT movements at a low andslowly growing frequency and did not have any hesitations or halts. The percentage time for maximum opening acceleration is steady oversamples, as maximum closing and opening accelerations.Themovement amplitude is big and constant, showing no decrementing amplitude.

Computational Intelligence and Neuroscience 9
0 2 4 6 8 100
1
2
3Fr
eque
ncy
(Hz)
Sample (—)
(a)
0 2 4 6 8 10
1
0.8
0.6
0.4
0.2
0
% M
vt ti
me (
—)
Sample (—)
(b)
0 2 4 6 8 100
2
4
6
8
10
Max
acce
lera
tion
( 𝑔)
Sample (—)
(c)
0 2 4 6 8 100
2
4
6
8
10
Max
acce
lera
tion
( 𝑔)
Sample (—)
(d)
0 2 4 6 8 10
0
50
100
150
200
Ang
le (∘
)
Sample (—)
(e)
0 2 4 6 8 100
2
4
6
8
10
Sample (—)
Leve
l hyp
omet
ria (—
)
(f)
Figure 8: Typical features for an SMD consensus score of 3. Plot (a) gives themovement frequencies (circles). Plot (b) gives the percentages ofmovement time for maximum opening acceleration. Plot (c) gives the maximum closing accelerations. Plot (d) gives the maximum openingaccelerations. Plot (e) gives the opening angles. Plot (f) gives the level of hypometria (circles) and the possible presence of initiation hesitations(triangles). For each plot except (f), the mean is in dotted line, the linear regression among points is in continuous line, and the limits for thedetection of hesitations are in dashed lines (plots (a) and (b) only). The PD patient performed the FT task at a slower frequency, but therewas no sign of decrementing or augmenting frequency. Maximum closing acceleration strongly decreases over samples, as for the maximumopening acceleration, which reflects a decrementing performance of the FT movement. Compared to the healthy volunteer, the mean valuesare lower, suggesting more difficulties in performing the movement. The mean opening angle is quite lower and decrements over time,reflected by aDangle feature value of 2. So, the patient managed to keep a constant frequency but performed smaller and smaller movements.The patient does not present signs of hypometria. Three hesitations but no halts are detected. According to the analysis of the movementfrequencies, the 3rd movement is abnormally fast, reflecting a jerky movement, the 8th movement is too slow, reflecting a hesitation whileclosing the fingers (lower value of percentage time for maximum opening acceleration), and the 4th movement is detected as an openinghesitation because the maximum opening acceleration occurs too late in the movement. On the frequency plot, this last movement is amongthe slowest.

10 Computational Intelligence and Neuroscience
0 1 2 3
MD consensus score
10
8
6
4
2
Aopen
Figure 9: Plot of Aopen values according to SMD consensus scores.An increase of Aopen tends to conduct to a lower SMD consensusscore, as reflected by the negative 𝛽
11coefficient.
0 0.2 0.4 0.6 0.8 1
1
0.8
0.6
0.4
0.2
0
Sens
itivi
ty
Pred = 1.445
Sens: 92.9%Spec: 88.6%PV+: 88.6%PV−: 92.9%
Area under the curve: 0.92
1− specificity
Figure 10: ROC curve obtained for the second classification task.ROC curves are used to optimize sensitivity and specificity and tocompute AUC.
During the nested cross-validation, feature selection wasperformed 86 times, that is, one time for each iteration of theouter loop. Table 6 summarizes the frequency of selection foreach variable. The eight variables (Dfreq, Afreq, Hesits, Halts,slTopen, slAclose, Aopen, sand slAopen) selected as relevant inmost iterations (at least 90%of the time) are presented in boldin Table 6. These features are all among the features selectedduring the construction of the global model presented inSection 3.3.
4. Discussion
We have presented here a new system designed to predictMDS-UPDRS scores on the basis of features extracted from
Table 6: Number of selection of each feature during the leave-one-out cross-validation.
Nb Feature Occur.1 Freq 722 Dfreq 843 Afreq 834 Angle 535 Dangle 646 Hypom 497 Hesits 838 Halts 869 Topen 4910 sdTopen 5411 slTopen 8512 Aclose 1813 sdAclose 2714 slAclose 8615 Aopen 8316 sdAopen 2917 slAopen 7818 RMS 20
signals recorded during the FT task.The FT task is commonlyused to assess movement bradykinesia in PD patients. In thistask, subjects are asked to repetitively tap their index fingeron their thumb as quickly as possible.The first 10 movementsare used for scoring.
The presented method was developed on data obtainedfrom 10 healthy volunteers and 36 PD patients to create aset of 92 observations with a range of FT scores between0 and 4—as rated by three SMDs—according to the MDS-UPDRS criteria (Table 1). However, patients with a score of4 at the MDS-UPDRS FT task were immediately detectedas so by the system as they were not able to perform thetask. It was neither possible nor necessary to include them insubsequent analyses. Removing those 6 observations led to aset of 86 observations used for further analyses. The healthyvolunteer/PD patient status and the on/off medication statuswere not relevant for the purpose of this study.
An SMD consensus score has been defined for eachobservation by taking the average score of three SMDrounded to the nearest integer. There was a good level ofagreement between the individual scores given by the threeSMDs and the SMDs consensus scores, as reflected by theGoodman-Kruskal Gamma indexes (0.922, 0.982, and 0.992).However, all SMDs were not always in agreement with eachother, as reflected by some of the Goodman-Kruskal Gammaindexes obtained between the individual scores (0.870),which confirms the need of a SMD consensus score. Weacknowledge that a higher number of SMDmay help refiningSMD consensus scores.
The raw accelerometer signals were first epoched auto-matically to decompose the accelerometer signals into succes-sive single FT movements. The success rate of this epochingwas 99%. However, two parameters had to be adapted
Computational Intelligence and Neuroscience 11
manually for tremulous PDpatients and for thosewith a scoreof 3, who typically have hesitations or halts in movements.This problemcould be eventually addressed by including con-tact switches to demonstrate a physical contact between theindex and the thumb fingertips during each trial. However,using this approach, some adjustment would still be requiredfor trial identification when the patient has difficulties insplitting fingers apart (i.e., freezing). Therefore, while thecurrent system can identify individual fingermovementswitha 99% accuracy in the population under consideration, weacknowledge that achieving a 100% accuracy would requireadditional development both at the hardware and softwarelevels. This is a necessary step to make this tool available fordaily clinical practices. 𝑧-axis raw signals and their epoching,obtained for SMD consensus scores of 0 and 3, are presentedin Figures 2 and 3, respectively.
Eighteen FT task movement features have been definedand extracted on the epoched acceleration signals to capturemost of the FT movement characteristics. Among thosefeatures, eight features were based on MDS-UPDRS clinicalcharacteristics and ten were accelerometer-specific featuresthat cannot be easily assessed by visual inspection. Theminimum and maximum values obtained for each featureacross the 86 observations are presented in Table 2. Figures7 and 8 illustrate the features obtained for SMD consensusscores of 0 and 3, respectively.
The main goal was to develop a tool to predict objectiveMDS-UPDRS scores from FT task movement features and toidentify which of the eighteen features best predicted MDS-UPDRS FT scores given independently by the three SMDson the basis of the corresponding video recordings. Sincethe global model was trained on all the observations, itspredictive performance could not be evaluated. In order toestimate it, a leave-one-out cross-validation approach wasused and a prediction score was obtained for each of the 86observations.The predictive performance of the globalmodelwas estimated by comparing these continuous predictions tothe SMD consensus scores. In order to compute some of theperformance indexes, the continuous predictions were dis-cretized using thresholds (0.5, 1.5, and 2.5). These discretizedscores were first used to compute the Goodman-KruskalGamma index that tests the strength of association betweenthe SMD consensus scores and the prediction scores. A valueof 0.961 was obtained, which is similar to the ones obtainedbetween the individuals scores given by SMD, that rangedfrom 0.870 to 0.970. The ordered contingency table betweenSMD consensus scores and score predictions is presentedin Table 4. Most observations are on the diagonal, whichcorresponds to the same value for both the prediction andthe SMDconsensus score.Moreover, themaximumdeviationbetween the predictions and the SMD consensus scores is 1meaning that a patient with an SMD consensus score of 2 wassometimes misclassified in class 1 or 3 but never in class 0.
In order to compute the sensitivity, the specificity, theaccuracy, and the AUC of the ROC, the ordinal classifica-tion problem was redefined into three binary classificationproblems. An ROC curve as well as its AUC were computedfor each binary classification. Figure 10 presents the ROCcurve obtained for the second classification task (i.e., to
distinguish between FT scores 0-1 and 2-3). AUCs between0.919 and 0.970 were obtained. It means that an observationwith a given SMD consensus score will obtain a higherpredicted score than observations associated with lowerSMD consensus scores in most cases (>92%). Sensitivityand specificity were computed from the discretized scoresfor the three binary classification problems. In a futurework, these thresholds could be optimized by includingmore observations.The identification of these thresholds canindeed be performed on smooth ROC curves obtained fornumerous observations, by optimizing the sensitivity and thespecificity. These thresholds could also be chosen by takingthe “cost” of the different misclassifications into account.Including more observations will also probably increase thepredictive performance of the model. However, in this paper,the goal was to show that this technique is adapted andworks for the prediction ofMDS-UPDRS scores. Future workwill increase the number of observations to improve thepredictive performance of the model.
During the cross-validation, feature selection was per-formed 86 times. The features that were selected as relevantin most iterations (Table 6) are all among the ones chosento build the global model. Some of these features are thesame as those proposed in the MDS-UPDRS, asDfreq, Afreq,Hesits, and Halts. According to the instructions, SMDs haveto quantify a possible slowing on the basis of a visual analysisof the patient’s motor performance, for example. The Dfreqfeature describes this possible slowing and can, in addition,give the index where the slowing occurs. slTopen, slAclose,Aopen, and slAopen are accelerometer-specific features thatcannot be easily quantified by visual inspection. The possibledecrementing amplitude (Dangle) has not been selected asa relevant feature for score prediction while it is one of thethree main criteria that should be considered for scoringaccording to theMDS-UPDRS scoring instructions (Table 1).To better interpret this finding, it would have been useful toassess how often the amplitude decrement criterion was usedby SMD to score the FT task. The data available here doesnot allow testing for this. Indeed, the score given by SMDwas based on the presence of any of the three criteria, butSMDs were not asked to report which criteria was (were)selected for each given score. Thus, it is conceivable that theweight of the decrementing amplitude criteria for FT scoringis relatively low for both SMD and the proposed algorithm.The alternative explanation is that this feature is differentiallyconsidered by SMD and the computer-based method. In thiscase, one should consider inadequate computation in case oftremor or too fast movements or that it may be representedinside another accelerometer-specific feature such as slAopensince the intrinsic nature of the accelerometer measurementsis different from the one of the human eye. It is not becausethe prediction algorithmdoes not use the decrementing angleas a predictive variable that this feature should not be usedby MDs during their assessment. The accelerometer-baseddevice is possibly not able to represent this feature in a waythat can help to predict the UPDRS score. This is why otherfeatures are also used, as they may have a greater intrinsicability to represent motor features used to predict MDS-UPDRS scores. The difference between the MDS-UPDRS

12 Computational Intelligence and Neuroscience
features and those selected by the model can therefore beexplained. First, the system allows the quantification offeatures that cannot be detected by visual analysis where; onthe other hand, visual analysis allows taking into accountthe whole movement while accelerometers only summarizeit into eighteen features. Second, the statistical predictivemodel objectively combines all the relevant features while itis difficult to simultaneously focus on all movement featuresby simple visual inspection.
Since the developed tool is low-cost, easy-to-use indaily clinical practices and as it shows very good predictiveperformance, it may be used as a support decision tool. Theother tasks of the MDS-UPDRS can easily be integrated inthe tool since only the feature extraction algorithm has tobe adapted for each task while the model is automaticallycomputed based on the new data sets. For every new patientperforming anMDS-UPDRS task, the relevant featureswouldbe extracted using the observations returned by the tool. Theordinal logistic regression model would then compute anMDS-UPDRS score from the values of these features. Sincethe prediction of the model is continuous, it is more sensitivethan a 5-point scoring system. It could therefore be a valuableasset to assess the evolution of the disease and treatmentefficacy and could help SMD take a decision in ambiguouscases.
Acknowledgments
At the time of the study, J. Stamatakis was a Research Fellowat the Belgian Fund for Research in Industry and Agriculture(FRIA). J. Cremers and G. Garraux were Research Fellow andSenior Research Associate at the Belgian National Fund forScientific Research (FRS - FNRS), respectively.
References
[1] A. J. Espay, D. E. Beaton, F. Morgante, C. A. Gunraj, A. E.Lang, and R. Chen, “Impairments of speed and amplitudeof movement in Parkinson’s disease: a pilot study,” MovementDisorders, vol. 24, no. 7, pp. 1001–1008, 2009.
[2] A. Bartels and K. Leenders, “Parkinson’s disease: the syndrome,the pathogenesisa and pathophysiology,” Cortex, vol. 45, no. 8,pp. 915–921, 2009.
[3] A. Schnitzler and J. Gross, “Normal and pathological oscillatorycommunication in the brain,”Nature Reviews Neuroscience, vol.6, no. 4, pp. 285–296, 2005.
[4] C. G. Goetz, B. C. Tilley, S. R. Shaftman et al., “MovementDisorder Society-SponsoredRevision of theUnified Parkinson’sDisease Rating Scale (MDS-UPDRS): scale presentation andclinimetric testing results,”Movement Disorders, vol. 23, no. 15,pp. 2129–2170, 2008.
[5] Movement Disorder Society, Movement Disorder Society TaskForce on Rating Scales for Parkinson’s Disease, “The UnifiedParkinson’s Disease Rating Scale (UPDRS): status and recom-mendations,” Movement Disorders, vol. 18, no. 7, pp. 738–750,2003.
[6] J. P. Giuffrida, D. E. Riley, B. N. Maddux, and D. A. Held-mann, “Clinically deployable kinesiaŮ technology for auto-mated tremor assessment,” Movement Disorders, vol. 24, no. 5,pp. 723–730, 2009.
[7] A. Godfrey, R. Conway, D. Meagher, and G. OLaighin, “Directmeasurement of human movement by accelerometry,” MedicalEngineering and Physics, vol. 30, no. 10, pp. 1364–1386, 2008.
[8] J. J. Kavanagh and H. B. Menz, “Accelerometry: a techniquefor quantifying movement patterns during walking,” Gait andPosture, vol. 28, no. 1, pp. 1–15, 2008.
[9] R. A. Hyde, L. P. Ketteringham, S. A. Neild, and R. J. S. Jones,“Estimation of upper-limb orientation based on accelerometerand gyroscope measurements,” IEEE Transactions on Biomedi-cal Engineering, vol. 55, no. 2, pp. 746–754, 2008.
[10] H. Zhou, T. Stone, H. Hu, and N. Harris, “Use of multiplewearable inertial sensors in upper limb motion tracking,”Medical Engineering and Physics, vol. 30, no. 1, pp. 123–133, 2008.
[11] Z. Farkas, A. Csillik, I. Szirmai, and A. Kamondi, “Asymmetryof tremor intensity and frequency in Parkinson’s disease andessential tremor,” Parkinsonism and Related Disorders, vol. 12,no. 1, pp. 49–55, 2006.
[12] A. Salarian, H. Russmann, C. Wider, P. Burkhard, F. Vinger-hoets, and K. Aminian, “Quantification of tremor and bradyki-nesia in Parkinson’s disease using a novel ambulatory monitor-ing system,” IEEE Transactions on Biomedical Engineering, vol.54, no. 2, pp. 313–322, 2007.
[13] D. E. Vaillancourt and K. M. Newell, “The dynamics of restingand postural tremor in Parkinson’s disease,”Clinical Neurophys-iology, vol. 111, no. 11, pp. 2046–2056, 2000.
[14] S. M. Rissanen, M. Kankaanpaa, M. P. Tarvainen et al., “Anal-ysis of dynamic voluntary muscle contractions in Parkinson’sdisease,” IEEE Transactions on Biomedical Engineering, vol. 56,no. 9, pp. 2280–2288, 2009.
[15] R. Agostino, A. Curra, M. Giovannelli, N. Modugno, M.Manfredi, and A. Berardelli, “Impairment of individual fingermovements in Parkinson’s disease,”Movement Disorders, vol. 18,no. 5, pp. 560–565, 2003.
[16] A. Jobbagy, P. Harcos, R. Karoly, and G. Fazekas, “Analysisof finger-tapping movement,” Journal of Neuroscience Methods,vol. 141, no. 1, pp. 29–39, 2005.
[17] E. L. Stegemoller, T. Simuni, and C. D. MacKinnon, “Effectof movement frequency on repetitive finger movements inpatients with Parkinson’s disease,”Movement Disorders, vol. 24,no. 8, pp. 1162–1169, 2009.
[18] M. Yokoe, R. Okuno, T. Hamasaki, Y. Kurachi, K. Akazawa,and S. Sakoda, “Opening velocity, a novel parameter, for fingertapping test in patients with Parkinson’s disease,” Parkinsonismand Related Disorders, vol. 15, no. 6, pp. 440–444, 2009.
[19] D. A. Heldman, J. P. Giuffrida, R. Chen et al., “The modifiedbradykinesia rating scale for Parkinson’s disease: reliability andcomparison with kinematic measures,” Movement Disorders,vol. 26, no. 10, pp. 1859–1863, 2011.
[20] A. J. Hughes, S. E. Daniel, L. Kilford, and A. J. Lees, “Accuracyof clinical diagnosis of idiopathic Parkinson’s disease: a clinico-pathological study of 100 cases,” Journal of Neurology Neuro-surgery and Psychiatry, vol. 55, no. 3, pp. 181–184, 1992.
[21] B. Caby, J. Stamatakis, P. Laloux, B.Macq, andY.Vandermeeren,“Multimodal movement reconstruction for stroke rehabilita-tion and performance assessment,” Journal on Multimodal UserInterfaces, vol. 4, no. 3, pp. 119–127, 2011.
[22] J. Jankovic, “Pathophysiology and clinical assessment of parkin-sonian symptoms and signs,” inHandbook of Parkinson’s disease,R. Pahwa, K. E. Lyons, W. C. Koller et al., Eds., pp. 71–108, 2003.
[23] R. J. Elble, “Gravitational artifact in accelerometric measure-ments of tremor,” Clinical Neurophysiology, vol. 116, no. 7, pp.1638–1643, 2005.

Computational Intelligence and Neuroscience 13
[24] I. Guyon and A. Elisseeff, “An introduction to variable andfeature selection,”TheJournal ofMachine LearningResearch, vol.3, pp. 1157–1182, 2003.
[25] Y. Saeys, I. Inza, and P. Larranaga, “A review of feature selectiontechniques in bioinformatics,” Bioinformatics, vol. 23, no. 19, pp.2507–2517, 2007.
[26] G. Carr, K. Hafner, and G. Koch, “Analysis of rank measures ofassociation for ordinal data from longitudinal studies,” Journalof the American Statistical Association, vol. 84, no. 407, pp. 797–804, 1989.
[27] E. W. Steyerberg, A. J. Vickers, N. R. Cook et al., “Assessing theperformance of prediction models: a framework for traditionaland novel measures,” Epidemiology, vol. 21, no. 1, pp. 128–138,2010.