fine motor skill performance in irish children -...
TRANSCRIPT

Fine Motor Skill Performance in Irish
Children
David Gaul B.Sc
Supervisor: Dr. Johann Issartel
Thesis presented to the School of Health and Human
Performance, Dublin City University as part of
requirement for the degree of Master of Science.
August 2014

ii
Declaration of Authorship
I hereby certify that this material, which I now submit for assessment on the
programme of study leading to the award of Master of Science is entirely my own
work, and that I have exercised reasonable care to ensure that the work is original,
and does not to the best of my knowledge breach any law of copyright, and has not
been taken from the work of others save and to the extent that such work has been
cited and acknowledged within the text of my work.
Date: _________________
ID No.: ________________
Signed: ________________
David Gaul (Candidate)

iii
Acknowledgements
Firstly, I would like to thank DCU Faculty of Science and Health for supporting me
financially as a result of the DCU Faculty of Science and Health Distinguished
Scholar Scheme for the duration of this award. Secondly I would like to express my
gratitude to all the children, parents and teachers who made this study possible. I
would like to thank all the academic and administrative staff within DCU's School of
Health and Human Performance and in particular, my supervisor Dr. Johann Issartel
for his constant support and guidance. I would like to thank the trainee Physical
Education teachers who assisted with the data collection process as part of the
Final Year Project component of their degree. To my fellow postgraduate students
residing in A242, to put it simply….Thank you. This would have been a much more
arduous undertaking without their unending enthusiasm and support. Finally, I
would like to thank my friends and family who have always been there for me when
I needed them.

iv
Funding Sources:
This research was supported through the Faculty of Science and Health
Distinguished Scholars Scheme from Dublin City University.

v
Contents
Abstract ........................................................................................................................ 1
Background ............................................................................................................... 1
Methods ................................................................................................................... 1
Results ...................................................................................................................... 1
Discussion ................................................................................................................. 1
Chapter 1. INTRODUCTION ...................................................................................... 2
1.1 General Introduction ..................................................................................... 2
1.2 Aims: .............................................................................................................. 5
1.3 Objectives: ..................................................................................................... 5
Chapter 2. LITERATURE REVIEW ............................................................................. 6
2.1 Motor Skills .................................................................................................... 6
2.1.1 Development of Children ....................................................................... 6
2.1.2 Fundamental Movement Skills .............................................................. 7
2.1.3 Importance of Motor Development ...................................................... 8
2.2 Classifications of Motor Skills ...................................................................... 10
2.2.1 Gross Motor Skills ................................................................................ 10
2.2.2 Fine Motor Skills ................................................................................... 10
2.2.3 Motor Skill Tests ................................................................................... 10
2.3 Developmental Coordination Disorder ....................................................... 17
2.3.1 Symptoms ............................................................................................. 17
2.3.2 Prevalence ............................................................................................ 19
2.3.3 Comorbidity .......................................................................................... 19
2.3.4 Effect of DCD ........................................................................................ 21

vi
2.3.5 DCD and long term consequences ....................................................... 29
2.4 Coordination ................................................................................................ 35
2.4.1 Dynamic situations .............................................................................. 35
2.4.2 (Multi) Sensory Integration ................................................................. 36
2.5 Conclusion: .................................................................................................. 40
Chapter 3. METHODOLOGY ................................................................................... 42
3.1 Fine Motor Skills .......................................................................................... 42
3.1.1 Participants .......................................................................................... 42
3.1.2 Procedure ............................................................................................. 43
3.1.3 Scoring .................................................................................................. 44
3.1.4 Statistical Analysis ................................................................................ 45
3.2 Coordination ................................................................................................ 46
3.2.1 Participants .......................................................................................... 46
3.2.2 Stimuli .................................................................................................. 46
3.2.3 Procedure ............................................................................................. 47
3.2.4 Data Reduction ..................................................................................... 49
3.2.5 Statistical Analysis ................................................................................ 50
Chapter 4. RESULTS .................................................................................................... 51
4.1 BOT .............................................................................................................. 51
4.1.1 Standard Scores.................................................................................... 53
4.1.2 Scale Scores .......................................................................................... 55
4.1.3 Total Point Scores ................................................................................. 57
4.2 Pendulum .................................................................................................... 59
4.2.1 Continuous Relative Phase ................................................................... 59
4.2.2 Standard Deviation of CRP ................................................................... 61

vii
4.2.3 Summary .............................................................................................. 64
Chapter 5. DISCUSSION .......................................................................................... 65
5.1 Fine Motor Skills in Irish Children ................................................................ 65
5.1.1 Gender Influences ................................................................................ 66
5.1.2 Age Influence........................................................................................ 67
5.1.3 Cultural Problems ................................................................................. 69
5.1.4 An Irish Context .................................................................................... 69
5.1.5 Societal Problems ................................................................................. 70
5.1.6 Other influences ................................................................................... 71
5.2 Coordination ................................................................................................ 72
5.2.1 Condition .............................................................................................. 73
5.2.2 Frequency ............................................................................................. 74
5.2.3 Multisensory ........................................................................................ 74
Chapter 6. CONCLUSION ........................................................................................ 76
Chapter 7. LIMITATIONS/FUTURE STUDIES ........................................................... 77
Chapter 8. REFERENCES ......................................................................................... 78
Chapter 9. APPENDICES ...................................................................................... 106
9.1 Appendix A ................................................................................................ 107
9.2 Appendix B ................................................................................................. 116
9.3 Appendix C ................................................................................................. 120
9.4 Appendix D ................................................................................................ 124

viii
List of Figures
PAGE
Figure 2.1 The Phases of Motor Development 6
Figure 2.2 The Bruininks-Oseretsky Test of Motor Proficiency 14 2nd Edition Test Kit
Figure 2.3 Bruininks-Oseretsky Test of Motor Proficiency (BOT-2) 15
Composite and Subtests Structure
Figure 2.4 Manifestations of Developmental Coordination Disorder 18
Figure 2.5 Negative Cycle of Physical Activity 27
Figure 3.1 BOT-2 Fine Motor Skill Composite Structure 43
Figure 3.2 Example of Visual and Auditory Stimuli 47
Figure 3.3 Experimental Set Up for Pendulum Subtest 48
Figure 4.1 Breakdown of sample based on Percentile Ranks 52
Figure 4.2 Overall Fine Motor Skill differences for Class and Gender 53
Figure 4.3 Children's Overall percentile ranks according to Class 54
Figure 4.4 Subtest Scale Scores Differences for Class 55
Figure 4.5 Subtest Scale Scores Differences for Gender 56
Figure 4.6 Subtest Point Score Differences for Gender 57
Figure 4.7 Subtest Point Score Differences for Class 58
Figure 4.8 Effect of Condition of Continuous Relative Phase 59
Figure 4.9 Effect of Frequency on Continuous Relative Phase 60
Figure 4.10 Effect of Class on Continuous Relative Phase 61
Figure 4.11 Effect of Class and Frequency on Stability of Coordination 62
Figure 4.12 Effect of Frequency on Stability of Coordination 62
Figure 4.13 Effect of Class on the Stability of Coordination 63
Figure 4.14 Relationship between Class, Condition on Coordination 64
Figure 4.15 Relationship between Class &Frequency in Auditory Conditions 64

ix
List of Tables
PAGE
Table 3.1: Descriptive Statistics of Participants for BOT-2 Test 42
Table 3.2: BOT-2 Subtest Descriptions 44
Table 3.3: Descriptive Characteristics of Participants for Pendulum Test 46
Table 4.1: Sample breakdown based on Descriptive Categories and 51
Percentile Ranks of the BOT-2
Table 4.2: Percentage of Sample which meet cut off points for motor skill 52
impairments

1
Abstract
Author: David Gaul B.Sc
Title: Fine Motor Skill Performance in Irish Children
Background Motor skills are the basis for any bodily movement. They allow children to read, write, walk, talk and play sports. These skills play a central role in children's lives and specifically allow them to be physically active and healthy. However there is currently a lack of knowledge in relation to the level of fine motor skills in children both in Ireland and internationally. Fine motor skills are an essential component of numerous activities of daily life such as dressing and feeding and in addition to academic practices such as handwriting.
Methods This cross-sectional study used the Bruininks-Oseretsky Test of Motor Proficiency, Second Edition (BOT-2) to evaluate the fine motor skill proficiency of Irish primary school children (N=139) between the age of 6-12 years. A second measure involving a handheld pendulum was also used to determine children's sensory motor coordination levels with visual stimuli, auditory stimuli and a combination of both (multisensory).
Results In terms of fine motor skill proficiency, only 1st class children were found to be meeting the expected levels, while 3rd and 5th class children were found to score below the normative values for age and gender. There was a significant effect for gender, with boys being found to demonstrate higher levels of motor skill proficiency compared to girls. In addition, the investigation into sensory motor coordination levels of children also demonstrated an effect for age. The oldest children were found to demonstrate the best levels of coordination across visual, auditory and multisensory conditions.
Discussion These low levels of fine motor skill proficiency might impede performance of everyday life activities as well as children's willingness to participate in physical activity (Bouffard, 1996; Cairney et al 2005, 2006). This lower level of fine motor skill proficiency for older Irish children in addition to the observed gender differences could be as a result of different societal, cultural and environment influences.

2
Chapter 1. INTRODUCTION
1.1 General Introduction
In modern times, the lack of physical activity (PA) or "hypoactivity" has become a
major public health concern (Cairney et al. 2007). Research shows strong evidence
for the increased risk of stroke, cancer, cardiovascular disease, type II diabetes,
hypertension and mental health problems for those who are physically inactive, in
addition to being more likely to become overweight or obese (Biddle et al. 2004;
Lee et al. 2012). As such, those who engage in regular PA not only benefit reduced
risk rates of the conditions mentioned above but also benefit from increased
cardiorespiratory and muscle fitness, functional health, bone health and cognitive
function, healthier body mass and composition (Lee et al. 2012).
The level of motor skill proficiency has been shown to be a key predictor of
children's engagement with and enjoyment of regular PA (Okely et al. 2001;
Stodden et al. 2008). As such many interventions address motor skill proficiency or
motor skill competence in order to improve PA participation (Belton et al. 2014;
Sallis et al. 1997; Morgan et al. 2013). The association between motor skill
proficiency and levels of PA have been shown to strengthen with age but have been
found in children as young as 4 years of age, highlighting the importance of
adequate opportunities for practicing motor skills from a young age (Iivonen et al.
2013). It is also reported that children who have the highest and lowest scores for
motor proficiency demonstrate the strongest relationships for PA participation
(Williams et al. 2008). Children with the lowest levels of motor skill proficiency
often suffer from movement disorders such as Developmental Coordination
Disoder (DCD). These movement disorders make participation in activities which
require motor control such as PA, increasingly difficult. As such, children with the
poorest levels of motor skill proficiency are most at risk from developing the
negative health outcomes related to a lack of PA and sedentary behaviour.
Motor skill differences between genders are often reported in the literature, with
boys regularly being found to display higher levels of motor proficiency compared

3
to their female peers (Barnett et al. 2010). This is a particularly interesting finding
considering research suggests that there is no physiological reason why boys should
perform better than girls in terms of motor skills (Gallahue & Ozmun 2006). As a
result, this points to biological, environmental and societal influences being the
cause of such differences. The environment in which children now grow up in is
often quite passive with increased opportunity for engagement in sedentary
behaviours which limit the varied movement experiences required for typical motor
development (Maitland et al. 2013). The importance of movement in childhood is
often underestimated because it is such a innate component of human life. Motor
skills are the basis for any bodily movement. They allow children to read, write,
walk, talk and play sports. As such they play a central role in the physical, cognitive
and social develop of a child (Cools et al. 2009). Research has shown that over time
children with movement difficulties such as DCD are more likely to develop
social/emotional and behavioural difficulties such as poor self esteem, poor social
and physical competence, social isolation, poor academic development and higher
rates of mental health problems (Cantell 1994; Geuze & Börger 1993; Gillberg &
Kadesjö 2003; Losse et al. 1991; Schoemaker & Kalverboer 1994; Piek et al. 2006;
Skinner & Piek 2001). The research investigating the link between movement
difficulties, motor skill proficiency and engagement in PA focuses extensively on
fundamental motor skills (FMS) or gross motor skills (Iivonen et al. 2013; Hardy et
al. 2010; Okely et al. 2001; Belton et al. 2014). In modern times there has been an
increase in the time children spend engaged in screen based activities involving
games consoles, graphic tablets or smartphones (Maitland et al. 2013) which could
potentially reduced the amount of time children spend engaged in traditional
dexterous leisure time activities such as playing with wooden blocks, Lego®, card
games or model building. In addition other everyday tasks requiring fine motor
skills such as buttoning shirts and tying shoe laces are becoming increasingly less
common being replaced of labour saving alternatives such as zippers and velcro
fastenings (Summers et al. 2008a; Missiuna 1999). These societal changes have
drastically reduced the opportunities for practicing fine motor skills which are a part
of many of daily life activities such as dressing, feeding and personal care (Summers

4
et al. 2008a). As such any impairments in such motor skills as a child could
dramatically alter how children interact with the environment around them and
potentially reduce the quality of life they experience.
Currently there is a lack of knowledge on the level of fine motor skill proficiency of
children both internationally and in an Irish context. We also know little about
whether or not age and gender differences which exist in fundamental movement
skill proficiency extend to fine motor skill proficiency. Frequently coordination is
reported as an outcome measure of in a number of different motor skill
assessments in terms of visual-motor coordination, upper limb coordination or
hand eye coordination (Düger et al. 1999; Miguel 2011; Fong et al. 2011; Hatzitaki
et al. 2002). In addition coordination is regularly described as being affected in
children with potential movement problems. However, we know little about the
processes underlying coordination in children. In contrast coordination has been
extensively studied in adults using a variety of simple experimental paradigms such
as tapping and pendulum based tasks. These simple tasks allow the measurement
of differences in coordination as a result of changes in the type, frequency and
presentation of stimuli. Currently there is a gap in the literature outlining the role of
auditory and visual stimuli and how they affects children's ability to coordination in
a variety of sensory conditions during a pendulum based experiment. As a result
the inclusion of a sensory motor pendulum take would augment existing knowledge
of the coordination ability of children given through motor skill tests. This would
provide the basis to develop a better understanding of the coordinative processes
which exist in children and how they develop over time.

5
1.2 Aims:
To investigate the current level of fine motor skill proficiency in Irish primary school
children between the ages of 6-12.
To the investigate the level of coordination in 1) unisensory conditions (visual or
auditory stimuli) and 2) multisensory conditions in Irish primary school children
between the ages of 6-12.
1.3 Objectives:
To compare the fine motor skill proficiency levels of Irish children with the expected
values based on normative data from the U.S.A.
To investigate whether the gender differences shown in fundamental movement
skill proficiency levels extend into fine motor skills.
To investigate how fine motor skill and coordination ability of children develops
over age in accordance with the maturation process
To investigate whether sensory integration of unisensory and multisensory
information improves coordination in children.

6
Chapter 2. LITERATURE REVIEW
2.1 Motor Skills
2.1.1 Development of Children
Movement is a natural and vital human behaviour inbuilt within us from the earliest
stage of infant development. In fact, the earliest patterns of movement occur in the
womb during the prenatal development, with behaviours such as rolling or kicking
regularly being felt by the mother (Piek 2006). The development of new
technologies such as ultrasound have made it possible to observe the movement
patterns of preterm babies such as flexion and extension of limbs, rotation of the
head and even the sucking of the thumb (Piek 2006). However it is following birth
that infant motor development begins in earnest.
Heywood and Getchell (2001) describe the development of movement skills as a
series of milestones which children reach before passing onto the next one.
Gallahue and Ozmun’s (2006) model for motor development is categorised into
four distinct stages; the reflexive movement stage, the rudimentary movement
stage, the fundamental movement stage and the specialised movement stage.
Figure 2.1: The Phases of Motor Development (Gallahue & Ozmun 2006)

7
As infants, children experience the reflexive movement phase in the first year of
life. These motor patterns are involuntary movements in which infants gain
information about the immediate environment around them. These reflexes are
well documented and we are familiar with them in practice. The Palmar grasp
response is when a baby grasps a finger or object when it is close to the hand (Piek
2006). In this early stage of life, infants gradually gather and process information
from the environment around them. This leads to the replacement of involuntary
movements with voluntary movements of the rudimentary movement stage
(Gallahue & Ozmun 2006). The rudimentary movement stage includes control of
voluntary movements which are vital for survival such as postural stability (control
of head, neck and trunk muscles), manipulation (reaching, grasping, releasing) and
locomotion (crawling, walking) (Gallahue & Ozmun 2006). During early childhood,
children's motor skills develop rapidly. When the gross motor skills of balance and
locomotion are mastered during the rudimentary movement stage in the first two
years of life, children are free to begin to explore their surronding environment. The
fundamental movement stage of development begins between the ages of 2 and 7
years, and plays a crucial role for motor skill development in children as it lays the
foundations for motor skill ability in the future (Haibach et al. 2011).
2.1.2 Fundamental Movement Skills
Fundamental Movement Skills (FMS) are described as an organised series of related
movements used to perform basic movement tasks (Gallahue & Ozmun 2006).
Gallahue and Ozmun (2002) divide movement into three categories; locomotor
movement tasks such as walking or running, manipulative movement tasks such as
kicking and striking and stabilising movement tasks such as balance. It is these key
motor skills which are developed during the fundamental development stage. FMS
form the basis for many of the specific motor skills that we use in sport, leisure
activities and everyday life (Okely & Booth 2004). In addition the mastery of certain
FMS are prerequisites for functioning in activities of daily living as well as for later
participation in sport specific activities (Cools et al. 2009). As such those who lack
FMS are more likely to experience frustration and difficulty in the learning of more

8
advanced skills (Stodden et al. 2008). Children with poor FMS have been found to
have lower levels of health related fitness and participate less in organised sports
and PA compared with children who have proficient motor skills (Stodden et al.
2008; Okely & Booth 2004). This has been found to be the case with children as
young as 4 years of age, with those who scored higher on Ulrich's Test of Gross
Motor Development exhibiting greater levels of PA (Chen 2013).
The WHO (2001), in the International Classification of functioning, disability and
health, highlights that the focus is to be put on the person/children's everyday
functioning rather than the reasons behind their condition. Participation has been
seen as a key component as it is an important factor in overall health (Bart et al.
2011). This has been reported in several studies illustrating the importance of daily
living activities such as dressing or feeding (Wang et al. 2009; Rodger et al. 2003;
Summers et al. 2008b; Summers et al. 2008a; van der Linde et al. 2013; Missiuna et
al. 2003; Missiuna & Polatajko 1994).
2.1.3 Importance of Motor Development
In recent times, research has begun to show the relationship between motor and
cognitive development during infancy and how these two processes are much
closer related than previously thought (Haywood & Getchell 2009). It is through
movement that an infant can explore and interact with the environment around
them. As such they shape their perceptual and cognitive development (Gibson &
Pick 2000). A number of different factors combine to influence the speed and
quality of motor development in each child (Kurtz 2007). Genetic or inherited traits
can impact upon strength, agility or general talent for physical challenges, for
example making shorter children less likely to become as proficient as taller peers
at basketball. A study by Plimpton and Regimbal (1992) found that African
American children scored higher tests of speed and agility but lower on hand eye
coordination tasks compared to Caucasian children. Cultural and lifestyle
differences between families make opportunities to participate in certain activities
more or less available in addition to differences in the emphasis placed on different
kinds of activities. For example, Irish culture places emphasis on physical skills such

9
as catching and kicking as a result of the high prevalence of team sports. In
comparison, in Hong Kong there is a high emphasis placed on development of
manual dexterity and hand eye coordination (Lam 2008) which are key components
of activities such as table tennis. Despite biological and cultural influences, an
important component to motor skill development is the freedom and opportunity
for children to physically explore and interact with their environment. This is a
process with which we are accustomed to witnessing (e.g. crawling, running,
jumping, grabbing).
Before going into detail on numerous tests available to assess children motor skills
proficiency, it seems important to differentiate the two distinct types of motor
skills: gross motor skills and fine motor skills.

10
2.2 Classifications of Motor Skills
2.2.1 Gross Motor Skills
Gross motor skills are movements which involve the use of the large musculature of
the body. Gross motor skills are developed in the early years of life as they are
required for the stability and control of the body in addition to exploration of the
environment (Cools et al. 2009; Gallahue & Ozmun 2006; Haywood & Getchell
2009; Schmidt & Lee 2005). Much of the research to date has investigated the
differences in motor skills between gender, age, PA levels and more recently BMI
(Cliff et al. 2009; Graf et al. 2004; Morano et al. 2011). However the majority of
studies have used the standardised tests discussed below to measure differences.
As such the focus has been on running, jumping, balance, throwing or catching
activities.
2.2.2 Fine Motor Skills
According to child psychologists and physical educationists, fine motor skills are the
use of small muscles involved in movements that require the functioning of the
extremities to manipulate objects (Gallahue & Ozmun 2006). Fine motor skills play a
role in many activities of daily life such as dressing and feeding ones self, in addition
to being essential in writing and drawing (Cools et al. 2009; Summers et al. 2008a).
However there is a gap in what we know about the role of fine motor skill
development in terms of PA levels, social development, handwriting and in success
in activities of daily living as most research focuses on gross motor skills rather than
fine motor skills. The little that we do know is centred around the effect of
impairments such as DCD on fine motor skills will be outlined in more detail in
section 2.3.5.
2.2.3 Motor Skill Tests
There has been bumerous motor skills tests used to assess various aspects of motor
skill proficiency including fine motor skills, gross motor skills and sensory
integration. The choice of test should be based on the hypothesis which you wish to

11
examine as each test varies in terms of type of measurement and aim of the test as
well as age suitability, sensitivity and reliability (Cools et al. 2009).
2.2.3.1 Körperkoordinationtest für Kinder
The Körperkoordinationtest für Kinder (KTK) examines gross body control and
coordination through dynamic balance skill (Kiphard & Shilling 2007). The KTK is a
shortened version of the Hamm-Manburger Körperkoordination Test für Kinder by
Kiphard and Schilling (1974) consisting of 4 items. It is a relatively simple test to set
up and takes approximately 20 minutes to carry out. The KTK has been described as
being thoroughly standardized and considered highly reliable (Cools et al. 2009).
Despite these positives, the KTK is limited to one aspect of gross movement skill
assessment and does not cater for locomotion functioning and object control. It
also is a product oriented form of assessment which does not give the full picture of
technique and motor control (Cools et al. 2009; Kiphard & Shilling 2007).
2.2.3.2 Test of Gross Motor Development-2
The Test of Gross Motor Development, Second Edition (TGMD-2) measures gross
movement performance based on qualitative aspects of movement skills (Ulrich
2000). The age range, 3-10 years, covers the period in which the most dramatic
changes in a child’s gross movement skill development occur (Ulrich 2000). The test
itself consists of locomotion and control skills with six items in each of these
categories. The time taken to administer the test is 15-20 minutes and it requires
equipment that is commonly used in PE lessons thus making the test appropriate
for use in a wide array of schools. A great advantage of the TGDM-2 is that it is a
process and product oriented test that refers to a criterion and a norm thus it is
extremely efficient at identifying children who are behind their peers in gross motor
development (Cools et al. 2009). However its one major flaw is that it only
measures fundamental movement skills and provides no measure of fine motor
skill.

12
2.2.3.3 The Southern California Sensory Integration Test
The Southern California Sensory Integration Test (SCSIT) is a motor skills test
developed by Ayres (1972) which was extensively used in the 1980's to screen for
neurological impairments in children and to examine the potential impact of
Sensory Integration Therapy. Sensory Integration Therapy had been used by
occupational therapists to improve motor skills and/or coordination of children
with neuromuscular impairments and mental disabilities. However the SCSIT
proved to lack the sensitivity to detect changes as a result of intervention and
lacked appropriate standardised age and gender norms (Cools et al. 2009).
2.2.3.4 The Movement Assessment Battery for Children
The Movement Assessment Battery for Children test, the initial form Movement-
ABC (Henderson & Sugden 1992) and the revised form Movement-ABC-2
(Henderson et al. 2007) is a commonly used motor skills test. The initial test
assessed the developmental status of motor skills with a focus on detection of delay
or deficiency in a child’s movement skill development (Cools et al. 2009; Henderson
et al. 2007). The revised version is suitable for children between 3-16 years of age
and consists of 32 items, subdivided into 4 age bands. The test focuses on how a
child manages everyday tasks encountered in school and at home (Henderson et al.
2007). It consists of a motor and a non-motor component which provides
information on direct and indirect factors that potentially affect movement. The
test itself takes 20-30 minutes to complete and measures movement skills in three
categories: manual dexterity skills, ball skills and balance skills (Henderson et al.
2007). It is considered suitable for assessment of motor abilities, early milestones,
FMS and specialized movement skills (Burton & Miller 1998). The test is product
orientated, so while some children may produce high scores their overall technique
and motor skill level might be less developed. Cools et al., (2009) previously
reported that the MABC is not specifically designed for young children. The test is
also limited by its struture, with different activities for different age bands. As such,
specific motor skills cannot be directly compared across age brackets (Cools et al.
2009).

13
2.2.3.5 Bruininks-Oseretsky Test of Motor Proficiency 2nd Edition
The Bruininks-Oseretsky Test of Motor Proficiency 2nd Edition (BOT-2) is based on
original test designed by Oseretsky in Russia in 1903 which was translated into
English in 1946 (Doll 1946). The Oseretsky Test was composed of 5 subtest
categories: general static coordination, dynamic coordination of the hands, general
dynamic coordination, motor speed and simultaneous voluntary movements (Lam
2011). Initially, the Oseretsky Test was used by researchers and was often adapted
for use with mentally ill children and adults, children with neuromuscular
impairments in addition to normally developing children between the ages of 6-14
(Ziviani et al. 1982). However, it had a number of drawbacks including the duration
required to carry out and it’s difficulty to interpret (Ziviani et al. 1982).
In 1978, Bruininks developed the Bruininks-Oseretsky Test of Motor Proficiency
(BOTMP). Bruininks standardised and adapted the original Oseretsky tests for
children between the ages of 4-14. It was hoped that these changes would result in
a battery that provides “a comprehensive index of motor proficiency as well as
separate measures of both gross and fine motor skills” (p11 Bruininks, 1978). It
consisted of eight distinct subtests comprising of 64 individual items. It was
designed to measure the important components of children's motor behaviour such
as gross and fine motor skills (Lam 2011). Bruininks also developed a short form
comprised of 14 items of the test to facilitate a quicker screening of children (Düger
et al. 1999) and a more detailed evaluation component which provided percentile
ranks and age equivalents (Ziviani et al. 1982).

14
Figure 2.2: The Bruininks-Oseretsky Test of Motor Proficiency 2nd Edition Test Kit
The Bruininks-Oseretsky Test of Motor Proficiency, Second Edition (BOT-2) is the
most recent version of the BOTMP (Bruininks & Bruininks 2005). It is an individual
assessment of a child's fine and gross motor skill competency for children and
adolescents between the ages of 4 - 21 (Bruininks 2008). The BOT-2 is designed to
support practitioners such as occupational therapists, physical therapists or
teachers in the identification of children who have motor impairments. The test
items are designed to be enjoyable and appealing to the children to encourage
participation in addition to being easier to administer allowing both teachers and
therapists to carry out the test. The test has both a reliable and validated short
form in addition to a complete form. The entire test can be subdivided into both
fine and gross motor skill composites. It is comprised of 8 subtests, 4 of which
measure gross motor skills, 3 measure fine motor skills and one which measures
both fine and gross motor skill (Bruininks & Bruininks 2005).

15
Figure 2.3: Bruininks-Oseretsky Test of Motor Proficiency (BOT-2) Composite and Subtests Structure
The BOTMP and BOT-2 have been proven reliable and sensitive when used to assess
the fine and gross motor skills of a number of different disorders and neurological
impairments which have both major and minor effects on the motor control of
patients such as; ADHD (Cho et al. 2014; Kooistra et al. 2005), Autism and Aspergers
(Sahlander et al. 2008; Ghaziuddin & Butler 1998), Cerebral palsy (Chen et al. 2013;
Chen et al. 2011), Dyslexia (Kooistra et al. 2005) and other intellectual and physical
disabilities (Johnson et al. 2010; Wuang & Su 2009; Van Pelt & Kalish 1983; Lucas et
al. 2013; Aken et al. 2007). The depth of detail provided in the BOT-2 and BOTMP
make them useful for investigating unexplored aspects of motor development
(Düger et al. 1999). The large number of test activities in addition to the separate
composites and subtests make the BOT-2 very useful in terms of the scope in which
it can be used by various health care and educational professionals. For example, it
can be used by occupational and physical therapists as a diagnosis tool for various
motor impairments as well as providing measurements of improvement in motor
skills following an intervention (Düger et al. 1999). It can also provide useful
information on the individual needs of children with motor impairments and allows
for the development of specific motor training programs meeting the needs of a
child. In addition the short form is a useful tool for teachers or special education
assistants to aid in the decision making process for educational placement (Düger et
al. 1999).
BOT-2
Fine Motor Skills
Fine Motor Precision
Fine Motor Integration
Manual Dexterity
Fine and Gross Motor
Skill
Upper Limb Coordination
Gross Motor Skill
Strength Balance Running Speed & Agility
Bilateral Coordination

16
In terms of its role in research, the BOT-2 enables clinicians and researchers to
investigate the new aspects of motor development such as 1) how motor abilities
develop in early childhood and 2) the relationship between motor development and
age, gender, geographic region, and physical development, and 3) the role of motor
proficiency in a child's social, emotional and academic development (Bruininks &
Bruininks 2005). One study examined the correlation between the BOTMP and the
SCSIT in 49 children between the ages of 4-12 (Ziviani et al. 1982). These children
had been referred to occupational therapists following identification as learning
disabled by their teachers using intelligence testing (Ziviani et al. 1982). The
children were tested pre and post a 12 month Sensory Integration treatment with
the SCSIT and BOTMP long form. Ziviani and colleagues (1982) found that both tests
correlated significantly with each other. In particular the authors found that 14 of
the 18 items of the SCSIT correlated significantly with the fine motor skill composite
of the BOTMP. As such the authors noted how the fine motor skill composite may
be useful for screening children with sensory integrative dysfunction (Ziviani et al.
1982). The BOTMP proved to be more sensitive in terms of indentifying
improvements in fine motor skills following the intervention (Ziviani et al. 1982).

17
2.3 Developmental Coordination Disorder
Movement disorders were first discussed by Collier in the 1900s, in which he used
the term "congenital maladroitness" to describe children's motor problems.
Throughout the 20th century various research identified clumsiness or poor motor
control as a common developmental disorder (Orton 1937). As such the term
"clumsy child syndrome" became the most widely used term to describe children
whose ability to perform a skilled movement was impaired (Sigmundsson 2005;
Missiuna & Polatajko 1994; Gubbay 1978). Further work expanded upon the
research in the area leading to the term "developmental dyspraxia" to explain the
atypical development of motor skills (Ayres 1985). A number of other terms have
been used to describe children with developmental motor problems such as clumsy
child syndrome, integrative dysfunction, DAMP (Deficits in attention, motor control
and perception) and developmental dyspraxia over the years (Missiuna & Polatajko
1994; Landgren et al. 1998). In more recent times the term DCD in accordance with
the Diagnostic and Statistical Manual of Mental Disorders IV-TR (APA 2002) has
been used to avoid confusion among terms and potential bias on causality. Based
on DSM IV-TR, criteria for the diagnosis of DCD include (1) a marked impairment in
the developmental of motor coordination (2) the motor disturbance which
(significantly) interferes with academic achievement or activities of daily living; and
(3) that motor disturbance is not due to a general medical condition (e.g., cerebral
palsy, hemiplegia, or muscular dystrophy) and does not meet the criteria for a
Pervasive Developmental Disorder (APA 2002).
2.3.1 Symptoms
The development of normal motor milestones from infantile responses to
adolescences is well documented as discussed in Section 2.1.1 with milestones
such as throwing and writing which act as particularly salient indicators of typical
development patterns. As such, many neurological developmental impairments can
be screened for or identified based on the presence or absence of features of
childhood motor development by trained professionals such as doctors,
physiotherapists and occupational therapists (Haywood & Getchell 2009). Common

18
symptoms of DCD include noticeable delays in reaching motor milestones,
awkwardness, clumsiness and poor balance, coordination and handwriting (Cermak
& Larkin 2002; Kaplan et al. 2007; Dewey & Wilson 2001a). Children with DCD also
demonstrate motor difficulties that interfere with activities of daily living such as
feeding themselves, dressing themselves and involvement in PA (Kennedy et al.
2007; Cairney et al. 2006; Cermak & Larkin 2002; Gubbay 1978; Missiuna 1999).
These impairments result in the child's academic, social and physical development
being affected in addition to ease with which they perform activities of daily life
(Cairney, Veldhuizen, et al. 2010; Magalhães et al. 2011; Piek et al. 2006).
Figure 2.4: Manifestations of DCD (Taken from Kaplan & Sadocks 2007)

19
2.3.2 Prevalence
There is much debate over the prevalence rates of DCD among children. This is a
result of children with DCD not displaying any hard neurological signs which can be
diagnosed but instead demonstrating so called "soft" signs which indicate
abnormality (Dewey & Wilson 2001b). In addition, as the signs and symptoms
displayed vary between children, so too do the severity of symptoms in each child.
Children with DCD are a heterogeneous group, making the diagnosis and
estimations of prevalence difficult (Bo & Lee 2013). Nevertheless, most estimates of
the prevalence of DCD in children ranges between 5-9% with the variation resulting
from the diagnostic criteria used (APA 2002; Gillberg & Kadesjö 2003; Iloeje 2008;
Kadesjo & Gillberg 1999; Maeland 1992; Missiuna & Polatajko 1994). The various
motor skill tests used (such as the BOT-2 or MABC) often implement percentile
rates to categorise children, with children falling in the lowest 15% or the more
conservative 5% being identified as having motor impairments. Alternatively
questionaires such as the DCDQ have relied on parents answers to 15 questions on
a 5 point Likert scale to diagnose children with DCD (Wilson et al. 2009). However
the various measures often used to test children for DCD such as the BOT-2, MABC
and the DCDQ often show inconsistencies, by identifying different children to
potentially have DCD (Crawford et al. 2001). As such the term "probable DCD" or
"pDCD" is commonly used in research to identify children with movement problems
who seem to meet most of the criteria for DCD without having being formally
diagnosed. Despite this, even the most conservative estimates according to the
strict DSM-IV criteria suggest a prevalence rate of 1.8% in 7 year olds in the UK
(Lingam et al. 2009) with a higher prevalence in boys than girls (APA 2002;
Schoemaker & Kalverboer 1994).
2.3.3 Comorbidity
Attempts to classify subgroups of DCD have been made in the past (Albaret et al.
1995; Ajuriaguerra & Hecaen 1964), while Cermak (1985) suggested two types of

20
dyspraxic disorder, motor planning and motor executive disorders. Cermak (1985)
outlined that children in the first, group had difficulty in planning the correct
movements, where as individuals in the second group could plan the actions
correctly but had difficulty in performing the movements. The work of Ayres (1985)
suggested that the problem lay in the integration of sensory information in the
planning and execution of movement sequences. However other studies found
multiple subgroups based on cluster analyses of children's performance in a variety
of components of different motor skill tests. These subgroups consisted of bilateral
coordination problems, visual spatial deficits, manual dexterity problems and
problems in global motor coordination (Hoare 1994; Miyahara 1994; Wright &
Sugden 1996; Crawford et al. 2001). The heterogeneous nature of DCD has resulted
in a variety of difficulties experienced by children (Bo & Lee 2013; Sugden &
Chambers 2003; King et al. 2011). As such there is no "typical clumsy child" (Geuze
& Börger 1993). However, there is an argument that there is no child with "pure
DCD" as the symptoms of the disorder are so diverse in addition to the high
prevalence of overlaps with other developmental disorders such as attention deficit
hyperactive disorder (ADHD), Autism or reading disorders such as dyslexia (Barnett
et al. 1998; Kaplan et al. 2001; Kaplan & Wilson 1998; Bo & Lee 2013; Brookes et al.
2007; Dewey & Wilson 2001b; Kadesjo & Gillberg 1999; Gillberg & Kadesjö 2003;
Loh et al. 2011; Missiuna et al. 2011; Gillberg 1998; Landgren et al. 1998; Noda et
al. 2013). Approximately half of children with DCD also suffer from ADHD (Gillberg
et al. 2004; Pitcher et al. 2003; Loh et al. 2011). A number of studies have shown
reduced motor skill proficiency in children with ADHD which regulary falls to levels
used to identify children with DCD (Scharoun et al. 2013; Pitcher et al. 2003). A
study by Loh et al. (2011) showed similar scores for motor proficiency between
children with DCD and those diagnosed with DCD and ADHD. These comorbidities
can cause serious effects to research in this area if they are not controlled for
during testing. It is important that selection of test used should be influenced
strongly by a clear hypothesis and a strong theoretical framework (Macnab et al.
2001). The current theories of motor development emphases the role of contextual

21
factors over neuromaturational factors in motor skill learning and the development
of movement disorders (Gentile 1992).
2.3.4 Effect of DCD
2.3.4.1 Lower Levels of PA
Motor skill proficiency has been found to be associated with higher participation in
PA (Cliff et al. 2011; Wrotniak et al. 2006; Cliff et al. 2009) while lower levels of
motor skill ability have been associated with lower levels of PA (Cliff et al. 2009;
Lopes et al. 2012). Generally it has been thought that at younger ages the observed
differences between motor skill proficiency is as a result of biological or
environment factors (Gallahue & Ozmun 2006). However the associations between
motor skill proficiency and levels of PA have been found in children as young as 4
years of age (Iivonen et al. 2013) with the relationship strengthening over time in
line with theoretical models for development (Stodden et al. 2008). This emphases
not only the importance of development of motor skill proficiency from an early
age but promoting increased levels of motor proficiency throughout childhood
(Iivonen et al. 2013).
Research has shown that children with DCD might not be active enough to acquire
the related health benefits of PA nor can they develop the age appropriate fitness
levels (Hands & Larkin 2002). As a consequence, children with DCD are at a higher
risk of obesity (J Cairney et al. 2005), coronary vascular disease (Faught et al. 2005)
and reduced fitness levels such as strength, flexibility, cardiovascular fitness and
body composition (Hands & Larkin 2002). Therefore, they are less able to prevent
chronic disease and reap the health benefits of regular PA throughout life (Lee et al.
2012). A longitudinal study by Lopes et al (2012) found that despite a decrease in
PA levels in boys and girls between the ages of 6-10, the most proficient children
had a higher level of PA. As such, the children with high motor competence at age 6
showed little or no change in PA levels over the next 3 years; while children in the
lower and middle tertile showed significant decreases in PA (Lopes et al. 2012).
Therefore, reduced motor skill at a young age may result in lower levels of PA

22
throughout childhood into adolescence. Williams et al (2008) suggested that the
associations between motor skills and PA levels are more significant in children at
the highest and lowest ends of the spectrum, with the most proficient being the
most active while the least proficient engaging in the least amount of PA (Williams
et al. 2008). Research has shown that children with DCD are less likely to engage in
PA compared to their typically developing (TD) peers (Bouffard 1996; John Cairney
et al. 2005; Cantell 1994; Losse et al. 1991; Piek et al. 2006; Skinner & Piek 2001).
Hence, children who suffer from motor impairments such as DCD are at higher risk
of developing a sedentary lifestyle and the associated health risks such as
cardiovascular disease, hypertension and type 2 diabetes (Faught et al. 2005; Li et
al. 2011; Rivilis et al. 2011a; Schott et al. 2007).
The majority of studies of PA in children with DCD or pDCD rely on self report
measures (Cantell 1994; Losse et al. 1991; Piek et al. 2006; Skinner & Piek 2001). A
study which tackles the lack of objective measures of PA in DCD research is Kwan et
al. (2013). This study combined the use of psychosocial measures via a
questionnaire with an objective measure using accelerometers. Kwan and
colleagues (2013) found a significant difference in Moderate to Vigorous Physical
Activity (MVPA) between pDCD and TD children. In addition, all the PA cognition
variables were significantly associated with MVPA and pDCD (Kwan et al. 2013).
However the average MVPA were below the national recommendations in Canada
(60min/day) for entire group, with only 7 children (11%) meeting
recommendations; none of which were in the pDCD group. Other interesting
findings of the study included a greater proportion of the pDCD children were
found to be overweight or obese and pDCD children were found to have a
significantly lower IQ (Kwan et al. 2013). A number of other studies also objectively
measured PA and participation in out of school activities among school aged
children with DCD (diagnosed and pDCD) and TD children (Green et al. 2011; Jarus
et al. 2011; Spironello et al. 2010). It was found that children with DCD were less
active than TD children and participated less frequently in PA. However, they found
that gender played an important role with only the pDCD boys; who were being
found to have significantly lower levels of PA compared to their TD peers while

23
there was no significant difference in girls (Green et al. 2011; Spironello et al. 2010).
This gender difference may be as result of girls being found to engage in less
physically active leisure time activities compared to boys (Nilsson et al. 2009;
Woods et al. 2011; Eaton et al. 2012). In a study by Cantell et al (2008), it was
shown that children, adolescents and adults with low motor competence did not
differ in terms of basic physiological measures of health such as blood pressure and
resting heart rate; compared to those with high motor competence. However,
those with low motor competence did differ in fitness indices such as strength and
flexibility in addition to metabolic indices such cholesterol, BMI, lung capacity and
bone density (Cantell et al. 2008). There have been a widely reported number of
factors as to why children with DCD have been found to engage less in PA
compared to their TD peers.
2.3.4.2 Lower Self Efficacy and Enjoyment
The influence of social norms and values determines the extent to which clumsiness
or lack of motor proficiency influences social and emotional development of
children. In western society, sporting prowess is highly valued and admired
(Schoemaker & Kalverboer 1994). In fact, it has been shown that children would
often prefer to succeed in sport rather than in classroom based activities (Duda
1987).
It is at the beginning of formal schooling that the role of motor proficiency begins to
influence children's perceptions of competence. It is at this age that children
become exposed to the increased movement demands of the classroom and
playground (Schoemaker & Kalverboer 1994). They also begin to compare their
performances with peers (Horn & Hasbrook 1987). Schoemaker and Kalverboer
(1994) have previously shown that children as young as 6 demonstrated a lack of
confidence in their motor competence which influences their performance in other
activities. Self efficacy is the strength of one's belief in their own ability to complete
a task or reach a goal (Ormrod 2006). Both children and adolescents with
movement impairments such as DCD have been found to perceive themselves as
being less physically competent and have lower scores of self efficacy in comparison

24
to their TD peers (Skinner & Piek 2001; Cairney et al. 2009; Cantell et al. 2008;
Cermak & Larkin 2002; Poulsen et al. 2006; Poulsen et al. 2008). A key component
of this lack of self efficacy in PA relates to children's experiences of failure and
feelings of frustration (Dunford et al. 2005; Fitzpatrick & Watkinson 2003). The
lower levels of perceived competence in PA and frequent experience of failure
leads to lower levels of participation as children feel they are not capable of
performing at the standard deemed to be socially expected by their peers. This lack
of participation limits the opportunities to practice their motor skills which in turn
puts them further behind their peers (Katartzi & Vlachopoulos 2011).
Not surprisingly, children with DCD don’t enjoy PA as much as their TD peers
(Summers et al. 2008a; Bart et al. 2011; Kwan et al. 2013; Cairney et al. 2007). Kwan
et al (2013) found children with pDCD to be less confident in their physical abilities,
did not enjoy PA as much and valued PA less. A study by Bart et al (2011) on the
parents of children with DCD found that they reported lower levels of participation
and enjoyment of PA in children as young as 4 years old. This concerning finding
paired with the lack of self efficacy for PA in such young children (Schoemaker &
Kalverboer 1994) highlights the importance of early identification and intervention
(Missiuna et al. 2003; Piek & Edwards 1997). The lower levels of enjoyment of PA
activities also result in less desire to participate and which in turn results in fewer
opportunities to develop their motor skills (Katartzi & Vlachopoulos 2011). In the
past, the majority of those with DCD went undiagnosed, often wrongly being
perceived as being "clumsy", "uncoordinated" or "lazy" (Missiuna 1999; Kaplan &
Wilson 1998; John Cairney et al. 2005). This perception comes from the praxis
difficulties experienced by the children which make participation in a variety of
activities difficult. This results in children not fully participating or frequently going
off task which can often be mistaken as being lazy or disruptive (Kirby et al. 2010).
Children with physical coordination impairments are often susceptible to
restrictions to their participation due to withdrawal or even exclusion (Mandich et
al. 2001; Mandich et al. 2003).

25
2.3.4.3 Anxiety Levels
Anxiety among children with motor impairments is also a factor influencing their
affective development (Bejerot et al. 2013; Peters et al. 2001). When Fitzpatrick
and Watkinson (2002) retrospectively interviewed adults who suffered from motor
impairments as children, a strong theme of worry and anxiety became apparent.
The adults recalled frequently dreading activities which would highlight their lack of
motor competence and they often contemplated how they might be able to avoid
them (Fitzpatrick & Watkinson 2003). Fitzpatrick & Watkinson (2003) reported
feelings of worry about what would happen and that they were conscious of being
watched by peers. This was also the case in a study by Peters et al (2001) where
children were found to be more anxious and often embarrassed about being
watched by others, particularly their peers. This state of worry and anxiety in
advance of motor skill tasks was also found by Schoemaker and Kalverboer (1994).
Those with motor difficulties may choose to avoid PA and exercise which can often
seen as a coping measure for children (Batey et al. 2013; Missiuna et al. 2008).
Children with motor difficulties avoid PA to hide their lack of competence, to avoid
embarrassment or to evade teasing (Barnett et al. 2009; Katartzi & Vlachopoulos
2011; Piek et al. 2006). Avoidance also emerged as a theme in work by Fitzpatrick
and Watkinson (2002) with 16 adults who had previously experienced physical
awkwardness as children. The participants in the study all recalled experiences in
which they often withdrew or intentionally failed or "clowned" as a coping
mechanism to avoid embarrassment and ridicule in physical education class or
sporting activities (Cairney et al. 2007; Fitzpatrick & Watkinson 2003; Schoemaker &
Kalverboer 1994).
2.3.4.4 Social and Emotional Impact of Motor impairment.
The potential influence of motor impairments on the emotional problems of
children was first documented by Orton (1937). In more recent times, a number of
studies have documented lower levels of social and emotional happiness among
children with poor coordination and motor skills (Losse et al. 1991; Knight et al.

26
1992; Poulsen et al. 2007; Poulsen et al. 2008; Poulsen et al. 2005; Poulsen et al.
2006; Skinner & Piek 2001; Lorås et al. 2014; Vedul-Kjelsås et al. 2012; Sigmundsson
2005). The importance of motor skills is often underappreciated in terms of
childhood development. However it has a crucial role in the social and emotional
development of a child. Children who are poor movers tend to develop awareness
of their lack of competence when they compare themselves to their peers. In
children, physical ability often influences social status (Pelligrini & Smith 1998). The
results mean, those children with lower motor skill proficiency not only rate
themselves lower in terms of physical competence but also in terms of social status
(Losse et al. 1991). A number of studies found that along with less time spent
playing team sport, children with motor skill difficulties also rated themselves lower
for peer relations, parent relations and physical appearance (Poulsen et al. 2006;
Poulsen et al. 2008). These findings of lower self esteem among children with lower
motor skill proficiency were also found by Skinner and Piek (2001) in addition to
poorer scores for peer interactions.
The importance of motor skill proficiency can sometimes be seen as more
important in a social sense for boys rather than girls, with boys expected to be
skilful movers to be considered a "real boy" (Poulsen et al. 2005). Boys with motor
skill impairments are often excluded and have been found to score higher for
loneliness compared to their physically proficient peers (Poulsen et al. 2005). This is
a worrying finding, as loneliness can become chronic if long term (Poulsen et al.
2005). Children with motor impairments often face a “lose lose” situation as a
result in terms of participation in PA. If children manage to persist in participation
despite experiencing regular failure, they often are the subject of ridicule. They
frequently find themselves last to be picked in team sports or even excluded
resulting in more emotional damage (Katartzi & Vlachopoulos 2011; Rose et al.
1997). It is not surprising then that children with movement disorders such as DCD
score lower on measures of overall life satisfaction, have lower perceived freedom
for leisure time activities and report unfulfilled leisure needs (Poulsen et al. 2007).
In addition, children with motor impairments often becoming more socially
introverted and socially isolated (Jarus et al. 2011; Schoemaker & Kalverboer 1994).

27
This can lead to the development of a negative self image (Bouffard 1996; Vedul-
Kjelsås et al. 2012)
2.3.4.5 The negative cycle of Activity-Deficit
These negative experiences can lead to a steady reduction in the amount of time
spent being physically active or a "negative involvement cycle" (Keogh et al. 1981).
If children avoid motor activities as a result of failure or criticism, they will miss out
on opportunities to practice these skills creating a vicious cycle of deconditioning
and increased motor deficits (Jarus et al. 2011; Cairney, J. a Hay, Veldhuizen, et al.
2010). As such, children with motor impairments fall further behind TD children
(Fong et al. 2011; Skinner & Piek 2001). This has lead to an "activity-deficit"
between those with DCD and those without, giving rise to increased risk of
becoming overweight and obese for children with DCD (Hands & Larkin 2002).
Figure 2.5: Negative cycle of PA (Taken from Katartzi & Vlachopoulos 2011)

28
This model shows the cyclical relationship between low motor competence, PA
levels and physical fitness in children with motor skill problems. The children with
poor motor skill proficiency are less likely to engage in physical activities and thus
not only develop lower levels of physical fitness but also receive fewer
opportunities to practice their motor skills and develop their competency. This
relationship is mediated by a number of other biological, social and environmental
factors. This negative cycle can lead to children with motor problems falling further
behind typically developing children in terms of motor and social development
(Smoll 1974). The WHO (2001) highlighted the need for the focus to be put on the
person/children's everyday functioning rather than the reasons behind their
condition. Fine motor skills play a role in many activities of daily life such as self
help, in addition to being essential in writing and drawing (Cools et al. 2009).
However there is a gap in what we know about the role of fine motor skill
development in terms of PA levels, social development and in success in activities of
daily living.
2.3.4.6 Fine Motor Skills in Daily Life Activities
So far, research results have shown that poor fine motor skills were found to
contribute to poorer performance of activities of daily living (Summers et al.
2008a). Children with coordination and motor impairments have demonstrated
significant problems in the ease with which they carry out activities of daily living
(Mandich et al. 2003; Rodger et al. 2003; Rosenblum & Josman 2003; Missiuna et al.
2007). These activities of daily life include dressing, feeding and personal hygiene
(Summers et al. 2008b; Summers et al. 2008a; Fitzpatrick & Watkinson 2003;
Mandich et al. 2003; Rodger et al. 2003; Rosenblum & Josman 2003; Wright &
Sugden 1996). A number of studies by Summers et al (2008a, 2008b) have shown
particular difficulties in children with DCD, in both Australia and Canada, when
performing dressing activities such as buttoning shirts, zipping jackets and with the
orientation of clothing such as putting on clothing backwards or inside out. The
effect of fine motor skill impairments on activities of daily living can be seen
particularly in the manipulation of knife, fork and spoon in a controlled manner for

29
feeding activities (Summers et al. 2008a). Summers and colleagues (2008b) found
that parents of children with motor problems frequently reported that their
children were unable to cut certain foods, took longer to eat and were often messy
eaters regularly spilling food on the table or themselves. These difficulties are also
regularly found in self care activities such as brushing their teeth, brushing their
hair and flossing (Missiuna 1999; Missiuna et al. 2007).
Not surprisingly children with motor impairments have been found to be less
independent than their TD peers, regularly needing more assistance from parents
and teachers (Bart et al. 2011; Summers et al. 2008a). In particular, fine motor skill
impairments extend into school life with childrens handwriting being affected (Tal-
Saban et al. 2012; Rodger et al. 2003; Bernie & Rodger 2004; Klein et al. 2008;
Tseng et al. 2007). Handwriting has been found to influence participation in
academic tasks and as such children with low fine motor skill often have lower
scholastic performance (Cantell 1994; Rose et al. 1997; Skinner & Piek 2001; Geuze
& Börger 1993; Cantell et al. 2003; Tal-Saban et al. 2012). This has resulted in
parents of children with motor impairments reporting that their family life is
regularly constrained by the motor abilities of their children (Missiuna et al. 2008).
2.3.5 DCD and long term consequences
It has been previously thought that this "clumsiness" is just a stage which children
eventually "grow out of" (Gillberg & Kadesjö 2003; Geuze & Börger 1993; Losse et
al. 1991). However, there is strong evidence to show that poor motor competence
persists through childhood and into adolescence (Knight et al. 1992; Losse et al.
1991; Geuze & Börger 1993; Gillberg & Kadesjö 2003; Cantell 1994; Cantell et al.
2003; Osika & Montgomery 2008). A study by Losse et al (1991) showed that
problems with motor coordination at 6 years of age still persisted 10 years later in
addition to poor self concept scores. This study was then subsequently followed up
by Knight et al (1992) a year later which demonstrated that these motor difficulties
still existed however the social consequences of poor coordination had widened. As
DCD has only been recognised as a standardised disorder relatively recently, there
is currently a lack of longitudinal evidence on DCD over age into adulthood.

30
However, in the few studies of adults which deal with poor motor coordination and
motor skill problems suggest that these problems have existed throughout their
lives and influenced their everyday life as a result of the practical and social
consequences of their movement difficulties. (Fitzpatrick & Watkinson 2003;
Cousins & Smyth 2003; Cantell et al. 2003).
In the few studies which assess the motor skills and coordination of adults with
movement difficulties, results have shown that their motor performance was
frequently slower and more variable than adults without movement difficulties
(Cousins & Smyth 2003; de Oliveira & Wann 2010). Another study found lower
levels of performance among adults with pDCD for activities of daily function which
required fine motor coordination (Tal-Saban et al. 2012). As the symptoms and
consequences of motor problems persist throughout life, those with motor
difficulties are an at risk group for developing negative perceptions toward PA
which can lead to them becoming inactive adults (Cousins & Smyth 2003; Peters et
al. 2001). In addition, they are also more likely to develop the social and emotional
problems linked to motor impairment (Cairney, J. Hay, Veldhuizen, et al. 2010). As
such, children with movement difficulties are at higher risk of developing the health
concerns in adulthood associated with lack of PA such as cardiovascular disease,
type II diabetes, poor skeletal health or becoming overweight or obese and
psychological health problems such as depression (Lee et al. 2012; Biddle et al.
2004; Cairney et al. 2012; Faught et al. 2005; Li et al. 2011; Rivilis et al. 2011a).
Due to the wide ranging effects of motor impairments on the physical, social and
emotional development of children in addition to long term effects extending into
adulthood, there is a need for the development of appropriate forms of early
detection of motor impairments in children (Cairney et al. 2009; Missiuna et al.
2011). In addition, once these children have been identified there is also a need for
the design and implementation of suitable interventions to tackle these problems
before they take hold (Missiuna et al. 2006). The complexity and heterogeneity of
children with movement disorders means that any form of identification tool needs
to take into account a wide range of motor skills while also investigating the

31
potential influence of praxis difficulties such as sensory integration as a possible
cause.
2.3.6 Interventions
There has been great debate on how to best treat those with DCD. This stems from
the lack of understanding of the etiology of the disorder, with some believing it has
its origin in the planning stages of movement and others in the execution stages of
movements (Vaivre-Douret 2014; Barnhart et al. 2003; Cermak & Larkin 2002; Kirby
& Drew 2010; Kirby et al. 2010). As such, there has been plenty of speculation
whether DCD is as of a result of proposed visual perception deficits (Lord & Hulme
1987), kinaesthetic perception deficits (Laszlo & Bairstow 1983) or both (Hoare
1994). Alternatively, Dewey (2001) has suggested that it is as a result of problems in
the short term memory of clumsy children.
At present there are no genetic or physiological markers that can be used to
identify DCD. However, evidence exists to suggest that DCD does in fact have a
biological basis, as individuals with DCD tend to come from families with histories of
other specific learning disabilities (Kurtz 2007). There are certainly multiple
influences, all of which contribute to reduced motor skill proficiency. These include
socio-economic status of parents (Piek et al. 2008; Gale et al. 2009), gestation
influences such as premature birth(Pinheiro et al. 2014; Bos et al. 2013) and
maternal behaviour patterns (Lucas et al. 2013). In addition many other
environmental factors which are yet to be examined such as lifestyle, sibling
interactions, activity patterns and neighbourhood characteristics can all also
influence the development and severity of motor impairments (Kwan et al. 2013;
Visser 2003; Visser et al. 1998). This has resulted in complications and lack of
consistency in how children with motor impairments like DCD have been treated; as
treatment designs are driven by competing theories of motor development and
motor skill acquisition (Mandich et al. 2001). This has been reflected in the research
with therapists who treat various motor impairments such as DCD being found to
use a variety of different therapeutic techniques to cater to the individual needs of
children (Wallen & Walker 1995).

32
Sensory integration (SI) has been one of the most commonly used approaches for
treating children with DCD in the past (Ayres 1972). This treatment is based on the
theoretical assumption that a relationship exists between neural functioning,
sensorimotor behaviour and learning (Sugden & Dunford 2007). As such the
therapy; particularly in early childhood, uses the plasticity of the nervous system to
help improve underlying functioning and reduce the effects of abnormal function
(Mandich et al. 2001; Polatajko et al. 1992). The therapy does this through a variety
of activities which provide proprioceptive, tactile/kinaesthetic and vestibular
stimulation (Sugden & Dunford 2007). It is still a method which is frequently used,
with 61% of Occupational Therapists sampled in the UK reporting that they used SI
as a treatment (Kelly 2004). The effectiveness of SI is still debated with numerous
studies showing that it is no more effective than physical education, perceptual
motor training or tutoring at improving motor skills, academic, cognitive and
linguistic performance (Mandich et al. 2001). Yet Polatajko and colleagues (1992)
commented that SI therapy could have some merits in improving motor skills of
children with perceptual motor skill dysfunction.
Currently there is no specific treatment for individuals suffering from DCD. The
majority of treatments tend to be based around physical or occupational therapy
(Mandich et al. 2001; Smits-Engelsman et al. 2013; Gibbs et al. 2007). It is unlikely
that such perceptual integration disorders can be reversed completely therefore
early screening may facilitate the development of strategies to negate the severe
impact of such difficulties (John Cairney et al. 2005). Perhaps the most simplistic
approach to deal with children with movement disorders could be to provide
additional time and opportunities for practice. In a study by Missiuna et al. (2011),
children with DCD tended to trade accuracy in favour of speed. As such, children's
inaccurate movement can often appear clumsy as it lacks fine motor control. This
hypothesis is supported by studies carried out on adults with movement disorders
in which significantly slower movement speed was a prominent feature (de Oliveira
& Wann 2010; Cousins & Smyth 2003; Tal-Saban et al. 2012). It could be that adults,
having spent the majority of their life dealing with their movement disorders, have
managed to cope with their lack of accuracy in everyday activities by slowing down

33
their movements in order to give themselves more control over their actions. In a
study by Kirby et al (2010), children with DCD performance in a novel planning and
execution task was compared against TD children (Kirby et al. 2010). The task had a
number of planning and execution components. The DCD children seemed to find
the processing and utilisation of these components more difficult in comparison to
the TD children. The DCD children demonstrated a more inconsistent stepping
pattern compared to the TD group (Kirby et al. 2010). For the first 2 trials,
consistency was lower; however on the third trial they reached a similar level as TD
children (Kirby et al. 2010).
2.3.7 Role of Teacher
As a result of the vast number of problems associated with DCD, it is important for
the early identification of children with motor difficulties so that appropriate
interventions can be put in place (Missiuna et al. 2003). The early soft signs of
motor skill impairment typically manifest themselves from a young age during
classroom activities or in the school playground (Cermak & Larkin 2002; Missiuna
1999; Missiuna et al. 2003). As such, teachers are perfectly placed to identify
children who potentially have DCD or are at risk of the effects of motor impairment
(Missiuna et al. 2003; Rivard et al. 2007; Cermak & Larkin 2002). However, there
have been contrasting findings regarding teachers ability to accurately identify
children with motor skill impairments. One study has shown that teachers are only
successful in identifying children with movement disorders approximately 50% of
the time, with children who have moderate impairments often not being identified
(Piek & Edwards 1997). However identification may often be hindered by the
presence of co occurring difficulties (Rivard et al. 2007) and teachers being more
likely to report developmental delays for gross motor skills in boys and fine motor
skills in girls (Missiuna et al. 2003; Rivard et al. 2007; Gwynne & Blick 2004; King &
Dunn 1989; Faught et al. 2008). This is most likely due to the societal influences,
with boys with poorer gross motor coordination standing out more from their male
peers (Rivard et al. 2007).

34
Teachers also have a very prominent role in shaping children's attitudes toward PA
and developing positive experiences during physical education class and sport
(Rivard et al. 2007; Katartzi & Vlachopoulos 2011; Kwan et al. 2013). As enjoyment
positively predicts PA participation, these experiences are vital to encourage
participation for children who already have lowered self efficacy as a result of their
reduced motor proficiency (Cairney et al. 2007; Bart et al. 2011; Jarus et al. 2011;
Batey et al. 2013). Children with motor skill impairments are often unable to
perform at the same level of their peers. They frequently judge their inability to
keep up with their peers as failure based on the expectations of their peers
(Eijsermans et al. 2004). As such one easily manageable approach to encourage
participation and offset the effect of reduced motor competence is the setting of
appropriate goals for such children (John Cairney et al. 2005).

35
2.4 Coordination
Coordination has been the subject of vast amounts of research both in the past and
in more recent times (Schmidt et al. 1992; Beek et al. 2002; Richardson et al. 2007;
Fink et al. 2000). The majority of research has implemented simple experimental
paradigms based on pendulum (Schmidt et al. 1991) or tapping (Repp 2005) tasks.
The type of stimuli and the frequency at which they are presented are often
constraints which are modified and the effects of individuals coordination mode
and stability are analysed (Temprado & Laurent 2004; De Rugy et al. 2008;
Armstrong et al. 2013; Varlet, Marin, Issartel, et al. 2012; Wheat & Glazier 2005;
Schmidt et al. 2007; Repp & Penel 2004). As a result of the depth of research, the
way in which adults integrate auditory and visual stimuli in response to changes in
frequency and mode of presentation is well understood (Varlet, Marin, Issartel, et
al. 2012; Armstrong & Issartel 2014; Armstrong et al. 2013). This natural
entrainment process by which humans use external information to shape their
motor behaviour can be seen in a number of visual-motor coordination tasks which
use hand held pendulums (Schmidt et al. 2007; de Rugy et al. 2006; Armstrong &
Issartel 2014; Armstrong et al. 2013). A study by Armstrong et al (2014), found that
adults demonstrated higher levels of coordination for visual conditions compared
to auditory conditions. The results also showed slight improvements in coordination
when multisensory information was available compared to unisensory, particularly
in the most difficult conditions (Armstrong & Issartel 2014). However, there is little
known about these processes in children and if the way children integration
unisensory or multisensory information varies as a result of the maturation process.
2.4.1 Dynamic situations
Our daily lives are governed by adaption to the dynamical environment which we
live in (eg crossing the road or playing a sport). We are required to constantly
perceive stimuli, plan and initiate responses based on the various forms of
information we receive. This results in us becoming part of a continuous cycle of

36
perception and action. Thus, a deficiency in one's ability to accurately perceive
and/or act based on information can result in numerous problems in one’s
response.
2.4.2 (Multi) Sensory Integration
The everyday perception of a human is subject to the continuous flow of external
and internal information which arise as a consequence of both our own actions and
yet also elicit adaptive behaviour (Lalanne & Lorenceau 2004). Humans thrive on
their ability to detect changes in the environment through various stimuli and elicit
a response (Wolpert et al. 2003). Sensory integration is the extraction of
information from the external environment, processing and initiation of a
responsive action to meet the required need (Blakemore et al. 2002). Sensory
integration in itself is the neurological process of organising sensation from one's
own body and the environment, thus allowing one to work efficiently in that
environment (Blakemore et al. 2002). Lalanne and Lorenceau (2004) detail the
selection process of perceptual interpretation with regards to the modality
appropriateness hypothesis which states that the most reliable and precise
information is relied on to generate a physical response. Visual perception is an
intricate system concern mainly with object identification and spatial localization
(Tsai et al. 2008). Fetsch et al (2009) claim that visual perception is the dominant
modality in perception of self motion and in controlling goal directed actions. It
plays an important role in movement planning, correction and feedback control
(Fetsch et al. 2009). Auditory perception is the ability to perceive sound from the
transduction of nerve impulses from vibrations in the environment (McDermott et
al. 2013). Lalanne and Lorenceau (2004) describe audition as a vital modality in
perception, yet contrastingly highlighted that visual perception is deemed more
reliable.
According to Calvert & Thesen (2004) the past decade has seen a progressive shift
from research concerning sensory modalities in isolation toward investigating the
communication and coordination between multimodality sensory interactions
(Calvert & Thesen 2004) and integrations (Lalanne & Lorenceau 2004). The

37
integration of multiple sensory inputs has vital effects on the accurate perception
and adaptive behaviours in everyday life (Fetsch et al. 2009). The combination of
these modalities allows individuals to gather information from a variety of sources,
combine them to generate a complete perspective of the situation at hand and
react based on the modality according to the reliability of each. Previous research
has shown that the combination of both visual and auditory stimuli has lead to
improved performance (Van der Burg et al. 2008; Sinnett et al. 2008).
2.4.3 Development of Perception in children
In children, maturation of the structure and function of the optic array is complete
by the age of 2 (Gallahue & Ozmun 2006). However the perceptual abilities of
children are still developing at this age with maturity not being reached until the
age of 12 (Fetsch et al., 2009). The rate of development varies among the different
visual qualities such as; visual acuity, figure-ground perception, depth perception
and visual motor coordination (Gallahue & Ozmun 2006). The basis for each of
these qualities is developed rapidly and in most cases is near mature levels by the
age of 8 (Gallahue & Ozmun 2006). The ear is structurally complete from birth, with
infants being able to respond to sound before birth such as the changes in their
mothers heart rate. Although we know much less about the development of the
auditory system compared to the visual system, research suggests that children
reach adult like auditory perception abilities from the age of 2 years (Gallahue &
Ozmun 2006). However differences between adults and children are still likely to
exist based on differences in the efficiency of the integration of sensory information
(Gallahue & Ozmun 2006).
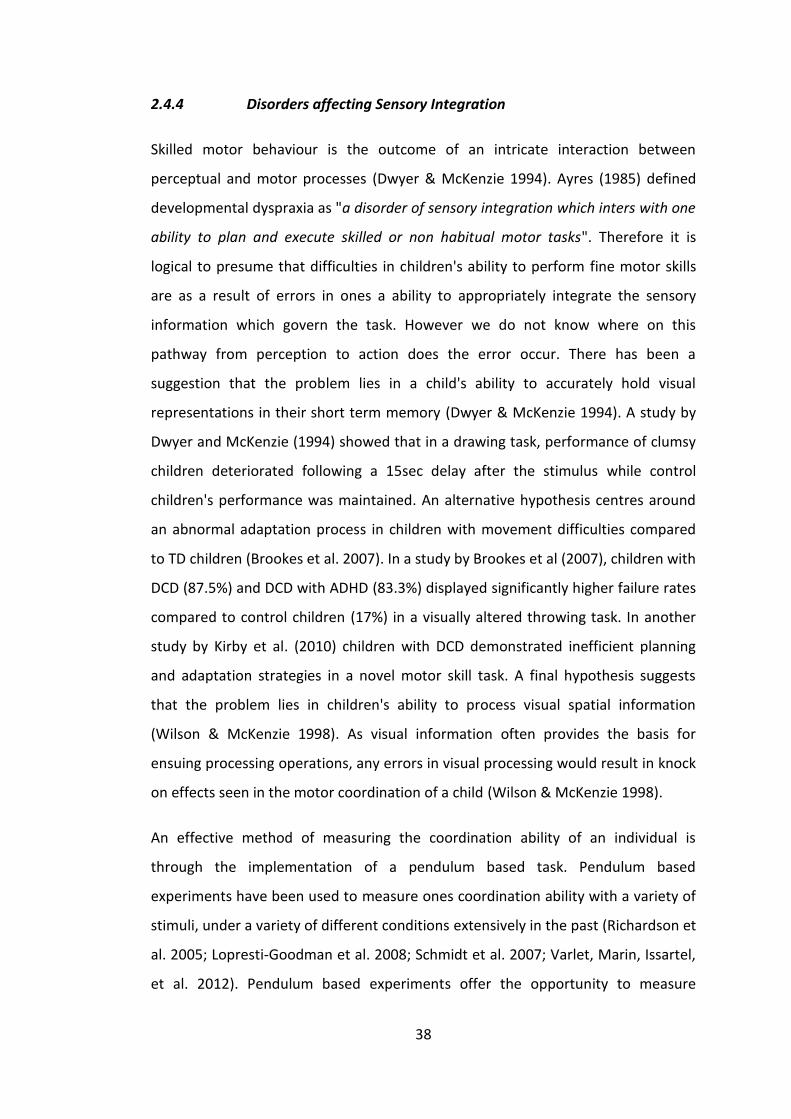
38
2.4.4 Disorders affecting Sensory Integration
Skilled motor behaviour is the outcome of an intricate interaction between
perceptual and motor processes (Dwyer & McKenzie 1994). Ayres (1985) defined
developmental dyspraxia as "a disorder of sensory integration which inters with one
ability to plan and execute skilled or non habitual motor tasks". Therefore it is
logical to presume that difficulties in children's ability to perform fine motor skills
are as a result of errors in ones a ability to appropriately integrate the sensory
information which govern the task. However we do not know where on this
pathway from perception to action does the error occur. There has been a
suggestion that the problem lies in a child's ability to accurately hold visual
representations in their short term memory (Dwyer & McKenzie 1994). A study by
Dwyer and McKenzie (1994) showed that in a drawing task, performance of clumsy
children deteriorated following a 15sec delay after the stimulus while control
children's performance was maintained. An alternative hypothesis centres around
an abnormal adaptation process in children with movement difficulties compared
to TD children (Brookes et al. 2007). In a study by Brookes et al (2007), children with
DCD (87.5%) and DCD with ADHD (83.3%) displayed significantly higher failure rates
compared to control children (17%) in a visually altered throwing task. In another
study by Kirby et al. (2010) children with DCD demonstrated inefficient planning
and adaptation strategies in a novel motor skill task. A final hypothesis suggests
that the problem lies in children's ability to process visual spatial information
(Wilson & McKenzie 1998). As visual information often provides the basis for
ensuing processing operations, any errors in visual processing would result in knock
on effects seen in the motor coordination of a child (Wilson & McKenzie 1998).
An effective method of measuring the coordination ability of an individual is
through the implementation of a pendulum based task. Pendulum based
experiments have been used to measure ones coordination ability with a variety of
stimuli, under a variety of different conditions extensively in the past (Richardson et
al. 2005; Lopresti-Goodman et al. 2008; Schmidt et al. 2007; Varlet, Marin, Issartel,
et al. 2012). Pendulum based experiments offer the opportunity to measure

39
dynamic coordination situations during synchronisation tasks with a variety of
visual, audio and multisensory conditions. In more recent times, pendulum based
experiments have been used to examine special populations who frequently
demonstrate impaired coordination such as those suffering with Schizophrenia
(Varlet, Marin, Raffard, et al. 2012; Del-Monte et al. 2013) and Autism (Fitzpatrick
et al. 2013). As coordination is a prerequisite for fine manipulation skills, a lack of
coordination could affect fine motor skill performance (Touwen 1979).

40
2.5 Conclusion:
There is a strong evidence base emphasising the importance regular PA in other to
reduce risk of developing conditions such as cancer, heart disease, hypertension
and type II diabetes (Lee et al. 2012). PA has also been found to play a crucial role in
the physical, cognitive and affective development in young children (Haywood &
Getchell 2009). Motor skill proficiency has been found to be one of the key
predictors of children's enjoyment of and participation in PA activity (Cairney et al.
2007). The evidence suggests that those who demonstrate the highest levels of
motor skill competence tend to be the most physically active. In contrast, those
who are the least proficient in terms of motor skills are likely to demonstrate the
lowest levels of PA participation (John Cairney et al. 2005). These children
frequently have undiagnosed motor skill problems such as DCD. As such, parents
and teachers often mistake children with these motor difficulties as being lazy or
just "clumsy" (Missiuna & Polatajko 1994). This can result in a vicious cycle of
physical inactivity developing, with those who require the most practice to improve
their motor skills frequently avoid opportunities to engage in PA thus falling further
behind their motor proficient peers (Venetsanou et al. 2007). As such, those with
low competence don't enjoy PA activity in addition to developing feelings of lower
self efficacy and perceptions of self worth (Piek et al. 2006). Consequently, as levels
of participation in PA tracks into adolescence and even into adulthood, inactive
children frequently develop in adults who engage in a sedentary lifestyle
(Fitzpatrick & Watkinson 2003). As motor skills, and in particular fine motor skill
competence, form the basis of numerous activities of daily living, unaddressed
motor skill impairments in childhood could significantly affect the quality of life
experienced into adulthood (Cousins & Smyth 2003). This project aims to assess the
level of fine motor skill proficiency with a comparison against international norms.
It is hoped that these results will give us a more holistic understanding of the
current state of motor skill development levels in Irish children.
On the other hand and as discussed above, human beings have the ability to
coordinate with a variety of different stimuli. As children mature, their motor skills

41
proficiency improves however so too do their perception systems (Gallahue &
Ozmun 2006). This leads to an increase in the efficacy by which they can better
integrate sensory information from one or more sources (visual, tactical, auditory,
etc). There is currently a great deal of knowledge on how adults perception and
action systems deal with modifications to the information received and how it
affects their visual motor coordination (Armstrong & Issartel 2014; Armstrong et al.
2013). However there is a lack of knowledge on how these characteristics differ in
younger children. Hence, this project aims to investigate the role of the different
sensory modalities in the coordination ability of children. In addition this project
also aims to develop an understanding of the effect of maturation on the sensory
integration ability of children.

42
Chapter 3. METHODOLOGY
The study was comprised of two measures. The first investigated the fine motor
skill ability of a sample of Irish primary school children between the ages of 6-12
using the BOT-2. A second measure of coordination using a pendulum based
experiment was carried out on a subsample of the cohort. This measure was used
to investigate the level of sensory motor condition for auditory, visual and
multisensory stimuli.
3.1 Fine Motor Skills
3.1.1 Participants
A sample of 139 children (69 Males and 70 Females) between the ages of 6-12 were
recruited from 3 schools in the Dublin 9 region. The parents/guardians of the
children provided consent for their child to participation and all children were free
to withdraw from the research at any stage. Teachers records were used to screen
children for any physical or learning disabilities which may have affected results.
Participants were subdivided into 3 cohorts based on the year of group they they
were a part of in school corresponding to 1st, 3rd and 5th Class. All participants had
their age, height and weight recorded and BMI calculated using the cut off points
for age and gender suggested by the International Obesity Task Force (Cole et al.
2008). Ethical approval was received from Dublin City University Research Ethics
Committee (DCUREC/2011/038).
Table 3.1: Descriptive Statistics of Participants for BOT-2 Test
1st Class 3rd Class 5th Class
N(Male/Female) 48(22M/26F) 44(26M/18F) 47(21M/26F)
Age (years) 7.29 ± .48 9.18 ± .55 11.18 ± .50
Weight (kg) 25.83 ± 5.14 32.93 ± 8.21 42.05 ± 10.98
Height (m) 1.25 ± .05 1.36 ± .06 1.47 ± .09

43
3.1.2 Procedure
Participants were tested using the Fine Motor Skill Composite of the BOT-2 test in
an indoor area according to the test guidelines (Bruininks & Bruininks 2005). The
children were tested in their school on a one by one basis. On arrival the
experimenter took a brief moment to try and build a rapport with the participant to
put them at ease and ensure that they gave their best effort (Bruininks & Bruininks
2005). The entire composite was composed of four subtests, each of which had a
number of activities. Following each subtest the participant was given a 2 minute
break. During this break the experimenter continued to engage with the child to
ensure the child felt comfortable. The administrators were qualified or final year
trainee physical education teachers. The instructions for each activity were given by
the examiners prior to the start of the task using the guidelines in the Fine Motor
Administrators Easel.
Figure 3.1: BOT-2 Fine Motor Skill Composite structure.
Fine Motor Skill Composite
Manual Control Unit
Fine Motor Precision Subtest
Fine Motor Integration
Subtest
Fine Manual Coordination Unit
Manual Dexterity Subtest
Upper Limb Coordination
Subtest

44
Table 3.2: BOT-2 Subtest Descriptions
Subtest Description
Fine Motor Precision Comprised of tracing lines, joining dots and filling in shapes
Fine Motor Integration Comprised of drawing different shapes accurately
Manual Dexterity Comprised of tasks such as moving coins and pegs, sorting
cards and threading blocks
Upper-Limb Coordination Comprised of throwing, catching and bouncing activities.
3.1.3 Scoring
The participant’s gender and age in years and months is calculated at the beginning
of the test. The scoring system varied between each item and scores were
calculated based on the marking guidelines. The raw scores for each item were
recorded in the test booklet in the unit measure (number of blocks, seconds,
catches etc.) and then converted into a numerical point score according to the
booklet. These point scores were used to calculate a Total Point Score for each
subtest. These Total Point Scores were then used to calculate the Scale Scores for
each Subtest using the conversion tables in test manual. These Scale Scores give the
tester an indication of how much a child differs from the average score for other
children of their each and gender in each of the subtest. The BOT-2 has been
designed so that a Scale Score of 15 for each subtest score represents average
motor skill performance according to age and gender standardised norms. The
Standard Score, which is also calculated using the testers manual, is an overall
measure of a child's motor proficiency in the 2 Motor Composite Units (Manual
Control & Fine Motor Coordination) and in the Overall Fine Motor Skill Composite.
A Standard Score of 50 represents average motor skill competence for each of the
Motor Composite Unites and the Overall Fine Motor Skill Composite. These units
use the standardised norms for age and gender so children can be compared. The
composite and unit scores can all be expressed in terms of percentile rank, age

45
equivalent or descriptive category (Appendix B). The raters were trained using
sample test results until they reached 99% agreement.
3.1.4 Statistical Analysis
All statistical analysis were performed using SPSS (IBM SPSS Statistics 19). A number
of different ANOVA's were carried out based on suitability of Point, Scale and
Standard scores which were calculated using the BOT-2 instruction manual.
Sphericity was assessed and the Greenhouse and Geisser's correction for degrees of
freedom were applied when sphericity was not met. Post hoc analysis using the
Bonferroni correction was carried out.

46
3.2 Coordination
3.2.1 Participants
A subsample of the children (N=72) also took part in an additional coordination
task. This task involved coordination of the participant’s movement with a number
of computer generated stimuli using a handheld pendulum. All participants were
free from any hearing impairments and had normal or corrected vision. All
participants were also screened for colour blindness using the Ishihara Test of
Colour Blindness short form.
Table 3.3: Descriptive Characteristics of Participants for Pendulum Test
1st Class 3rd Class 5th Class
N(Male/Female) 21(10M/11F) 25(13M/12F) 24(11M/13F)
Age (years) 6.97 ± .40 9.18 ± .55 11.18 ± .50
Weight (kg) 25.5 ± 4.67 33.72 ± 10.23 42.69 ± 11.74
Height (m) 1.24 ±.05 1.35 ±.06 1.45 ±.11
3.2.2 Stimuli
There were a total of 3 conditions in the experiment. There were 2 unimodal stimuli
and 1 bimodal stimulus. The visual stimuli were presented on a screen (Dell
Trinitron Ultrascan 1600HS Series CRT Monitor, Model D1626HT) placed
approximately 1meter from the participant at eye level. The visual stimuli consisted
of a square (5.2cm x 5.2cm) that faded from red to yellow while oscillating (Visual
Panning (VP)) horizontally across the screen on a grey background in a sinusoidal
manner with an amplitude of 28cm. The visual stimuli were created in Matlab using
Psychophysics Toolbox (Pelli 1997; Brainard 1997; Kleiner et al. 2007). The auditory
stimuli were presented through noise cancelling headphones and consisted of a
continuous tone that modulated from a low pitch (400 Hz) to a high pitch (800 Hz)
in a sinusoidal fashion panning (Audio Panning (AP)) from one ear to the other. The
high pitch sound was always heard in the left ear and the low pitch heard in the

47
right ear. Both audio stimuli were created using Supercollider (McCartney 2002).
The bimodal condition's consisted of the presentation of both the auditory and
visual stimuli at the same time.
For the VP condition, participants had to swing to the left as the square moved left
and to the right as the square moved right on the screen synchronizing the
endpoint of the movements with the square’s endpoints (Figure 3.2). For the AP
condition, participants were required to swing the pendulum to the left as the
sound panned to the left ear with a high pitch and to the right as the sound panned
to the right ear with a low pitch through the headphones, synchronizing the
endpoint of the movements with the sounds endpoints (Figure 3.2).
Figure 3.2: Graphical representation of Visual and Auditory Stimuli
All data was recorded at 100Hz using a Measurement Computing Data Acquisition
Device (measurement computing USB-1608FS) for analysis. The experiment was
controlled and run through Matlab using a Graphical User Interface as part of a
Psychophysics Toolbox Extension (Kleiner et al. 2007; Pelli 1997; Brainard 1997).
3.2.3 Procedure
On arrival participants were once more given a copy of an age appropriate plain
language statement and explained in lay terms what the experiment would involve.
The participants were then given an outline of each of the three stages 1) preferred

48
frequency calculation 2) Familiarisation and 3) Experimentation. Participants sat in
a height adjustable chair and placed their right arm in a forearm support.
Participants gripped a handheld aluminium pendulum with their right hand securely
so that they were in full control of the pendulums movements. The screen was
positioned to the participant’s right hand side at eye level and as such participants
were required to turn their head to look at the screen.
Figure 3.3: Experimental Set Up for Pendulum Subtest
The same pendulum was used as in Armstrong et al (2013, 2014) which was 49 cm
long with a weight of 53 g attached at the end of the rod. Its eigenfrequency was
0.75 Hz. Participants were prevented from viewing the pendulum’s movements and
their forearm by a wooden cover and a cloth curtain.
Participants swung the pendulum in a darkened room, through the sagittal plane by
flexing and extending their wrist and were told to move the pendulum within an
amplitude which they felt comfortable with. For the preferred frequency calculation
participants were asked to swing the pendulum in a dark room for two minutes at a
pace that was ‘most comfortable’ for them which they "could swing at all day"

49
(Schmidt et al. 2007). The preferred frequency of each participant was used to
create two additional frequencies: +20% of preferred and -20% of preferred.
During the familiarisation stage, participants were required to synchronize the
movements of the handheld pendulum with each of the three conditions. The
instructions for synchronization were the same as in the experimentation stage and
are described above. The stimuli were each presented once and at each
participant’s preferred frequency. The participants received additional
presentations of the stimuli if required to ensure understanding of the different
experimental conditions.
One block of the experiment consisted of three frequencies (Preferred, +20% and -
20%) and the three stimuli (Audio, Visual and Multisensory), resulting in a total of 9
conditions. Participants completed one trial of each of the 9 randomised conditions
for both of the two blocks. There was a 30 second break after each 40 second trial
and a two minute break between blocks to eliminate fatigue.
3.2.4 Data Reduction
We assessed participant’s synchronization using continuous relative phase (CRP)
and the standard deviation of CRP (SD CRP), to determine the level of coordination
between the participant’s movements and that of the stimuli in addition to the
variability of this coordination. Prior to analysis, the first 10 seconds of data were
removed and the remaining 30 seconds were filtered using a low pass 10 Hz
Butterworth filter. Data was then normalised between ±1 using min max scaling. All
data was averaged across each of the trials for the 9 experimental conditions. In a
small number of cases, when both of the a child's trials for the same condition
resulted in CRP values >90° it was determined that participants were unable to
carry out the task correctly. This resulted in 7% of trials being removed.
The degree of coordination between the participant and the stimulus was assessed
using CRP. CRP was calculated using a Hilbert Transform and scaled between 0° and
180°. In order to eliminate distortions caused by Hilbert Transform during the
computation of relative phase, the first and last cycles of each trial were removed

50
(Pikovsky et al. 2003). The variability of coordination was assessed using the SD CRP
calculated from the CRP values. The average CRP at the endpoints of the stimulus
was calculated using a range of ±180° in order to determine the lead/lag nature of
the participant’s movement in relation to the stimulus. This resulted in negative
values indicating participants leading the stimulus while positive values indicate
participants lagged behind the stimulus.
3.2.5 Statistical Analysis
All statistical analysis was performed using SPSS (IBM SPSS Statistics 19). A 3 x 3 x 3
repeated measures ANOVA was carried out on the CRP and Standard Deviation of
CRP to assess the quality and stability of visual motor coordination. Sphericity was
assessed and the Greenhouse and Geisser's correction for degrees of freedom were
applied when sphericity was not met. Post hoc analysis using the Bonferroni
correction was carried out.

51
Chapter 4. RESULTS
4.1 BOT
The number of children in each of the categories for scale and standard scores in
the Fine Motor Composite of the BOT-2 is outlined below in Table 4.1. It was found
that none of the children scored in the highest or lowest categories for Fine Motor
Skills. Figure 4.1 illustrates the percentage breakdown of the cohort into each of the
percentile ranks outlined by the BOT-2 manual. The majority of the sample (75%)
scored in the average category. However a surprisngly large proportion (19%) of the
sample scored in the below average category based on normative data for their age
and gender.
Table 4.1: Sample breakdown based on Descriptive Categories and Percentile Ranks of the BOT-2.
Descriptive Well Above
Average
Above
Average
Average Below
Average
Well
Below
Average
Scale Scores 25 or greater 20-24 11-19 6-10 5 or less
Standard
Score
70 or greater 60-69 41-59 31-40 30 or less
Percentile
Rank
98% or greater 84%-97% 13%-83% 3%-17% 2% or less
No. of
Children
0 9 104 26 0

52
Figure 4.1: Breakdown of sample based on Percentile Ranks.
The lowest 5th, 10th and 15th percentiles are frequently used to identify children
with DCD or pDCD in previous studies (See Section 2.3.2),. Table 4.2 shows the
percentage of the cohort which fall into each of these percentile ranks.
Table 4.2: Percentage of Sample which meet cut off points for motor skill impairments.
Percentile Cut Offs Lowest 15th
Percentile Lowest 10th
Percentile Lowest 5th
Percentile
Percentage of
Overall Cohort 25% 11% 2%
Percentage of Girls 37% 17% 4%
Percentage of Boys 12% 5% 0%
6%
75%
19%
Percentile Rank Breakdown
>98% (Well Above Average)
84%-97% (Above Average)
18%-83% (Average)
3%-17% (Below Average)
2% or less (Well Below Average)

53
4.1.1 Standard Scores
A 2 way between groups ANOVA was conducted to explore the impact of gender
and class on total fine motor skill, as measured by the Fine Motor Skill Composite
Score of the BOT-2. Participants class referred to their school year group which
resulted in three groups, 1st, 3rd and 5th class). The interaction effect between
gender and class group was non-significant F(2,133) = .81, p>0.05. There was a
statistically significant main effect for gender, F(1,133) = 5.16 p<0.05 however, the
effect size was small (partial eta squared = .037). The results indicated that mean
score for males (M = 49.38, SD =7.20) was significantly different to that of females
(M = 46.77, SD = 7.78). There was also a main effect for class F(2,133) = 7.095,
p<0.01 with a large effect size (partial eta squared = 0.96). Post hoc corrections
revealed significant differences between the means for first class (M = 51.13, SD =
8.04) and those of the third (M = 47.30, SD = 6.54, p<0.01) and fifth (M = 45.66, SD
= 7.09, p<0.01) class.
Figure 4.2: Overall Fine Motor Skill differences for Class and Gender
20
25
30
35
40
45
50
55
60
65
70
1st Class 3rd Class 5th Class
Com
posi
te S
core
Class Group
Fine Motor Skill Composite

54
These differences in Standard Scores compared to the average score of 50 as
outlined by the test may seem minor. However based on the scoring scale outlined
in the BOT-2 seen in Appendix D, these small differences in standard scores equate
to large differences in a children's overall fine motor proficiency when seen on a
percentile rank scale shown in Figure 4.3. As such 5th Class children's fine motor
score performance falls into the 37th percentile according to standardised data for
the BOT-2.
Figure 4.3: Children's Overall percentile ranks according to Class.
56.74 45.48 36.28 0.00
10.00
20.00
30.00
40.00
50.00
60.00
70.00
80.00
90.00
100.00
1st class 3rd class 5th class
Perc
entil
e Ra
nk(%
)
Class Group
Childrens Percentile Ranks

55
4.1.2 Scale Scores
A 4(Subtest) x 3(Class) x 2(Gender) repeated measures ANOVA was carried out to
assess the impact of Class Group and Gender on children's Motor Skill Performance
in each of the 4 Scale Scores of BOT-2 subtests. There was a significant interaction
effect for Class and Subtest, Wilks' Lambda =0.88, F(6,262) = 2.95, p<0.01, partial
eta squared = 0.06. Post hoc tests revealed that 1st class children demonstrated
signifcantly better scores for Fine Motor Integration (M = 17.07, Std Err = .45)
compared to 3rd (M = 14.41, Std Err = .48, p<0.01) and 5th class (M = 13.72, Std Err =
.46, p<0.01). The 1st class children also scored signifcantly higher for Upper-Limb
Coordination (M = 15.24 Std Err = .55) compared to 5th class (M = 13.27, Std Err =
.58 p<0.05). On the other hand it is important to note that for the Manual Dexterity
subtest, 5th class (M = 14.82) children scored higher than their 1st (M = 14.09, Std
Err = .61) and 3rd (M = 13.08, Std Err = .65) class peers but did not reach statistical
significant levels (p>0.05) (See Figure 4.4).
Figure 4.4: Subtest Score differences for Class.
0
2
4
6
8
10
12
14
16
18
20
Fine Motor Precision Fine Motor Integration
Manual Dexterity Upper-Limb Coordination
Scal
e Sc
ore
Subtest
Subtest Scale Scores
1st class
3rd class
5th class

56
There was a significant main effect for class group F(2,133) = 5.655, p<0.01 with a
large effect size (eta squared = 0.78). Post hoc comparisons using the bonferroni
correction revealed that 1st class children (M=15.34, Std Err=.35) scored significantly
higher compared to 3rd (M = 13.89, Std Err = .37, p<0.01) and 5th (M = 13.90, Std Err
= .35, p<0.05) (See Figure 4.4). There was also a main effect for gender F(1,137) =
4.13, p<0.05 with boys (M = 14.83, Std Err = .30) performing better than girls (M =
13.98, Std Err = .30). Post hoc tests showed boys to demonstrate signifcantly higher
scores for Manual Dexterity F(1,137) = 8.71, p<0.01 (See Figure 4.5).
Figure 4.5: Subtest Score differences for Gender
0
2
4
6
8
10
12
14
16
18
Fine Motor Precision
Fine Motor Integration
Manual Dexterity Upper Limb Coordination
Scal
e Sc
ores
Subtest
Subtest Scale Scores
Boys
Girls

57
4.1.3 Total Point Scores
A 4 (Subtest) x 3 (Class) x 2 (Gender) repeated measures ANOVA was carried out to
assess the impact of class group and gender on motor skill performance using the
Total Point Scores of the BOT-2. It was found that there was significant interaction
effect between gender and subtest, Wilks' Lambda = 0.90, F(3,131) = 4.69, p<0.05.
As shown in Figure 4.6, boys were found to demonstrate higher levels of
performance on the Manual Dexterity and Upper-Limb Coordination subtests (M =
26.26 and 31.28) compared to girls (M = 25.70 and 29.23). In contrast, Girls (M =
35.25 and 35.77) were found to score better on the Fine Motor Precision and Fine
Motor Integration Subtests Subtest respectively compared to boys (M = 34.02 and
35.03).
Figure 4.6: Subtest Point Score Differences for Gender
There was also an interaction effect between class and subtest Wilks' Lambda =
0.631, F(6,262) = 11.31, p<0.01. Post hoc analysis revealed that motor skill
0.0
5.0
10.0
15.0
20.0
25.0
30.0
35.0
40.0
Fine Motor Precision
Fine Motor Integration
Manual Dexterity Upper Limb Coordination
Poin
t Sco
res
Subtest
Subtest Point Scores
Boys
Girls

58
performance increased significantly with class group (p<0.01) for all subtests with
the exception of Fine Motor Integration where there was only a significant
difference between 1st and 5th class (p<0.01) (See Figure 4.7).
Figure 4.7: Subtest Point Score Differences for Class.
The was also a main effect for subtest with F(2.75,399) = 215.23, p<0.01 partial eta
squared 0.612. Post hoc tests showed that scores on all subtest differed signifcantly
at the p<0.01 signifcance level, with the exception of scores on the Fine Motor
Integration (M = 34.63, Std Err = .32) and the Fine Motor Precision (M = 35.55, Std
Err = .26) which differed at the p<0.05 level (See Figure 4.7).
0
5
10
15
20
25
30
35
40
Fine Motor Precision Fine Motor Integration Manual Dexterity Upper Limb Coordination
Poin
t Sco
re
Subtest
Total Point Score
1st
3rd
5th

59
4.2 Pendulum
A 3(Conditions) x 3(Frequencies) x 3(Class) repeated measures ANOVA was carried
out. Sphericity was assessed and the Greenhouse and Geisser's correction for
degrees of freedom were applied when sphericity was not met. Post hoc analysis
using the Bonferroni correction was carried out.
4.2.1 Continuous Relative Phase
There was no significant interaction effects to report between Condition and Class,
Wilk's Lambda = .88, F(4,74) = 1.20, p<0.05 or between Condition and Frequency,
Wilk's Lambda = .93, F(4,35) = 0.61, p<0.05, There was a significant main effects for
Condition, F(1.39, 52.88)=30.66, p<0.01, partial eta squared=.45. A post hoc
comparison using the Bonferroni correction revealed that participants scored
significantly lower for both Visual (p<0.01) and Multisensory (p<0.01) than for
Audio Conditions. In other words, the results indicate that the level of coordination
is better for the visual and multisensory conditions (lower CRP) compared to the
auditory conditions (Figure 4.8)
Figure 4.8: Effect of Condition of Continuous Relative Phase.
53.56 41.32 40.95 0
10
20
30
40
50
60
Auditory Visual Multisensory
CRP(
°)
Condition
Continuous Relative Phase

60
There was also a significant main effect for Frequency, F(1.69,64.11) = 12.80,
p<0.01, partial eta squared = 0.25. A Bonferroni post hoc comparisons also revealed
that participants scored significantly higher CRP values for -20% (p<0.01) and +20%
(p<0.01) when compared with preferred frequency. This indicates poorer
coordination (higher CRP) with the stimuli (See Figure 4.9).
Figure 4.9: Effect of Frequency on Continuous Relative Phase.
There was a significant effect for Class group F(2,35) = 15.631, p<0.01, partial eta
squared = 0.47. A Bonferroni post hoc comparison revealed that 1st Class children
performed significantly poorer (higher CRP) than their 3rd Class (p<0.05) and 5th
Class (p<0.01) peers (See Figure 4.10).
49.72 37.36 48.76 0
10
20
30
40
50
60
-20% Preferred 20%
CRP(
°)
Frequency
Continuous Relative Phase

61
Figure 4.10: Effect of Class on Continuous Relative Phase
4.2.2 Standard Deviation of CRP
A 3(Condition) x 3(Frequency) x 2(Age) ANOVA was used to investigate the stability
of coordination by looking at the Standard Deviation of CRP. There was a significant
interaction effect between Class and Frequency, Wilks' Lambda = .761,
F(4,74)=2.76, p<0.01, partial eta squared = 0.13. Post hoc test using the Bonferoni
correction yielded significant differences for the stability of the -20% (p<0.05) and
+20% (p<0.05) frequency compared to the perferred frequencies for 1st class
children. In addition post hoc tests showed signifcantly higher variability for the
+20% frequency for both 3rd (p<0.01) and 5th (p<0.05) class children (See Figure
4.11).
60.2411 49.0394 49.1096 0
10
20
30
40
50
60
70
1st Class 3rd Class 5th Class
CRP(
°)
Class Group
Continuous Relative Phase

62
Figure 4.11: Effect of Class and Frequency on the Stability of Coordination.
There was a main effect for Frequency, F(2,76) = 2.867, p<0.01, partial eta
squared=0.24. Despite the increased variability of 1st class children for -20% and
preferred frequencies shown in Figure 4.11, a Bonferroni post hoc demonstrated
significantly higher levels of variability in the +20% conditions (p<0.01) when
compared to -20% and preferred frequencies (Figure 4.12).
Figure: 4.12 Effect of Frequency on Stability of Coordination.
39.82
33.78
39.40
26.39
22.25
31.57
19.75 21.89
25.39
0.00
5.00
10.00
15.00
20.00
25.00
30.00
35.00
40.00
45.00
-20% Prefered 20%
SD o
f CRP
(°)
Frequency
Effect of Class and Frequency on SD CRP
1st Class
3rd Class
5th Class
28.65 25.97 32.12 0.00
5.00
10.00
15.00
20.00
25.00
30.00
35.00
40.00
-20% Prefered 20%
SD o
f CRP
(°)
Stability of Coordination

63
There was also a significant main effect for Condition, F(1.62,61.64) = 14.05, p<0.01,
partial eta squared = 0.27. A post hoc comparison showed significantly lower
stability for Auditory Conditions (p<0.01) compared to Visual and Multisensory
conditions (Figure 4.13).
Figure 4.13: Effect of Condition on Stability of Coordination.
32.49 28.23 26.03 0
5
10
15
20
25
30
35
40
Auditory Visual Multisensory
SD o
f CRP
(°)
Condition
Stability of Coordination

64
4.2.3 Summary
We found that coordination (CRP) across all conditions improves with age as shown
in Figure 4.14.
Figure 4.14: Relationship between Class, Condition on Coordination
Audio conditions consistently had the poorest levels of coordination. Interestingly
we found that despite age, all children performed at a similar level for the Audio
Preferred condition (≈53°). However when participants were pushed to more
difficult conditions (-20% and +20%) their CRP value rose quickly with the younger
children being most affected (See Figure 4.15).
Figure 4.15: Relationship between Class and Frequency in Auditory Conditions
0
10
20
30
40
50
60
70
Audio Visual Multi
CRP
(°)
Condition
Overall Coordination
1st
3rd
5th
0
10
20
30
40
50
60
70
80
AP-20 AP pref AP +20
CRP
(°)
Condition
Coordination for Audio
1st
3rd
5th
65
Chapter 5. DISCUSSION
5.1 Fine Motor Skills in Irish Children
The first finding is a particularly worrying statistic with 19% of the sample falling
into the below average descriptive characteristic of having a fine motor skill
proficiency (See Table 4.1). This figure is slightly higher than the reported
prevalence rates for motor impairments such as DCD (APA 2002; Kadesjo & Gillberg
1999; Lingam et al. 2009), however this could be as a result of a slightly larger
bracket (bottom 17th percentile compared to 10th) for inclusion than used in
previous research concerning movement impairments (Rivilis et al. 2012). The use
of a variety of different cut off points for motor proficiency (Table 4.2) is often
based on the measurement instrument used in addition to the stringency required
for selection of special populations such as those with DCD (Faught et al. 2008;
Schott et al. 2007; Lingam et al. 2009; Dunford et al. 2005; Cairney et al. 2009). As
such Table 4.2 shows the percentage of the sample which fall into each of the
previously used cut off points which brings prevalence rates more in line with
expected values (APA 2002). The BOT-2 uses a 17th cut off as it represents scores
above 2 Standard Deviations from the mean following transformation of scale
scores. In this context, the 17th percentile can be deemed suitable as the aim of this
study was not to diagnose children with movement disorders but rather to identify
the number children who have fine motor skill deficiencies and who are at risk of
being considered as children with DCD. This cut off will identify children who could
be in need of future formal screening for motor problems in addition to children
who are below the expected level of competency for fine motor skills. As such, the
children who fall into this group can thus be referred to as having movement
difficulties.
Regardless of the cut of point used, it is alarming that the such a high percentage of
children demonstrate motor skills proficiency well below the expected level. As
motor skill proficiency is found to track throughout childhood and into adulthood
(Tal-Saban et al. 2012; Cousins & Smyth 2003; Bo & Lee 2013) as well as being a
predictor of PA (Barnett et al. 2009; Lopes et al. 2011), falling behind at a young age

66
could have a dramatic influence on lifelong engagement in PA. In addition, as fine
motor skills are the basis behind many activities of daily living, such discrepancies
can influence the quality of life experienced by these children should these
difficulties persist (Missiuna et al. 2008; Fitzpatrick & Watkinson 2003). As such
children who find themselves in the below average bracket could be at risk of
developing lifelong motor difficulties.
5.1.1 Gender Influences
It was found that girls demonstrated significantly poorer fine motor skill proficiency
than boys with higher percentages of girls falling into the group for having
movement difficulties than boys (Table 4.2). The finding that males out perform
their female peers is frequently reported in other research on motor skill ability in
children (Barnett et al. 2010; Wrotniak et al. 2006; Hume et al. 2008; Breslin et al.
2012). However, girls are thought to have the ability to demonstrate equal motor
skill competence to boys up to puberty (Gallahue & Ozmun 2006; Haywood &
Getchell 2009) with the possible exception of activities relating to strength (Beunen
& Thomis 2000). Therefore it is suggested that it is as result of environmental
influences such as lack of opportunities to practice, encouragement and
reinforcements that girls motor proficiency is lower (Hume et al. 2008; Thomas
2000; Okely & Booth 2004). The role of cultural expectations for motor skill
proficiency are likely to play a major role in these differences. Stereotypical views
such as boys being expected to be more physically active than girls are likely to
influence people's perception of children's engagement in PA and motor skill levels
(Thomas & French 1985). Parents and teachers often reinforce these stereotypes by
presuming boys are more suited to team sports while girls are suited to more
locomotor based physical activities such as gymnastics or dance (Barnett et al.
2009). As such motor skill competence is often more valued and encouraged in
boys than in girls.
The gender differences found in the Manual Dexterity and Upper-Limb
Coordination Subtests (Figure 4.6) are symptomatic of reported gender differences.
The Upper-Limb Coordination Subtest contains object control skills such as

67
throwing, catching and bouncing, which boys have been found to be more
proficient in compared to girls (Blakemore et al. 2009; Hardy et al. 2010; Barnett et
al. 2009). The Manual Dexterity Subtest not only contains a number of object
control skills (sorting cards, moving pegs and stringing beads) but is measured
based on children's performance in a time pressured environment. Subjectively,
boys tended to demonstrate greater motivation to improve score between trials
during test compared to girls. This is in keeping with research which shows boys to
display more competitive and egocentric nature compared to girls more
cooperative and calmer demeanour (Hardy et al. 2010; Garcia 1994). These
differences seem to become more prominent with age but difference can be seen
in children as young as 5 years of age (Cliff et al. 2009). The gender differences
found in the Fine Motor Precision and Fine Motor Integration subtest (See Figure
4.6) also suggests the influence of stereotypes on motor skill proficiency. These two
subsets are less competitive in nature as they are not performed under time
pressure, in fact children are encouraged to take as much time as they need to
complete the task. These subtests also involve fine motor skill tasks which often
have a female gender bias associated with them such as tracing lines, drawing
shapes, folding paper and colouring in. As gender differences are routinely
reported, the BOT2 like other motor skill tests provided gender adjusted norms.
This makes the finding of gender differences in the Total Point Scores (Figure 4.6)
and particulary the Scale Scores (Figure 4.7) for each subtest noteworthy
considering the expected gender differences among children have been corrected
for.
5.1.2 Age Influence
If we look at the fine motor skill scores for first class children in Figure 4.2 we come
across some positive findings. We see that first class children achieve the mean
standard score of 50. This is a promising finding indicating that Irish children's fine
motor skill proficiency is progressing on track based on the normative data for 6-8
year olds. This positive finding points to effective teaching strategies and
appropriate curricula which incorporate fine motor skills during the earliest stages

68
of primary education in line with development theories of education (National
Council for Curriculum and Assessment 2009).
A rather surprising finding is that the youngest children seemed to demonstrate the
highest levels of fine motor proficiency overall (Figure 4.2). These results show the
youngest children (1st Class) significantly outperform their 3rd and 5th class
counterparts. This is a rather striking finding and contrary to our understanding of
typical motor development as motor skill has been found to improve with age as
children move up through the classes of primary school (Piek 2006; Haibach et al.
2011). This is as a result of increased physical and perceptual maturation
throughout childhood and adolescents into adulthood (Gallahue & Ozmun 2006). A
reduction in motor skill proficiency for the older class groups as shown in Figure 4.2
would indicate a degeneration of motor skill ability from 3rd class. However the
decrease in performance as age increases seen in Figure 4.2 comes from the
standardised nature of scores. The standard scores are calculated based on
expected performance for children of the same age and gender as outlined in
section 3.1.3. As a result scores are expected to be somewhat stationary unless
development is progressing at a faster or slower rate than typical maturation
(Wilson et al. 1995). The use of total point scores for subtests enable us to compare
groups with more sensitivity. When we look at the point scores for each of the
subtests (Figure 4.7) we can see the expected relationship between age and fine
motor skill proficiency, with children's fine motor skill scores improved steadily with
age. However the low standard scores and scale scores for both 3rd and 5th class is
still a interesting finding (Figure 4.2 and 4.4). These contrasting demonstrate that
although children's fine motor skill performance is improving with age (Figure 4.7),
it is not progressing at a rate which it is expected to based on the normative data
(Figure 4.2). This is a worrying finding, with Irish children beginning to fall behind
the expected rate of development (Figure 4.3) at young age and calls into question
the role of PA practices, sedentary behaviours, in addition to the effect of societal
and cultural differences between the standardised norms and the norms of Irish
children.

69
5.1.3 Cultural Problems
There can also be cultural influences effecting how children can be compared based
on motor skill proficiency. The cultural values of a society play a role in the
development of motor skills (Nakai et al. 2011; Lam 2008; Plimpton & Regimbal
1992; Iloeje 2008). For example, Chinese children demonstrate higher scores on the
Manual Dexterity Subtest compared to the normative data for the BOT2 which
comes from American children (Chui et al. 2007). This might be as a result of
Chinese children learning to eat with chopsticks from the age of 2 years old or write
from as young as 3 years of age (Lam 2008; Chui et al. 2007). In contrast Upper-
Limb Coordination subtest skills which are associated with popular sports in
American culture, are significantly lower in Chinese children (Chui et al. 2007). As
such it can be problematic to compare children from one country using a motor
skills test with norms developed in another country (Lam 2008).
5.1.4 An Irish Context
We need to consider why might Irish children be lagging behind their American
counterparts. The provision of physical education at elementary school level in the
United States of America is subject to routine assessment of the quality of its
delivery by national bodies (National Association for Sport and Physical Education &
American Heart Association 2010; National Association for Sport and Physical
Education & American Heart Association 2012; National Association for Sport and
Physical Education & American Heart Association 2006). This has lead to the
establishment of core elements of physical education provision across all 50 States
by the National Association for Sport and Physical Education (NASPE) (2006; 2010;
2012). These elements consist include 1) the provision of PE by a qualified/licensed
physical education teacher, 2) minimum time allocation of 150 minutes of PE per
week and 3) minimum standards for student achievement in PE (NASPE 2006, 2010,
2012). A study investigating the level of PE in Irish primary schools indentified a
variety of factors which impeded full implementation of the PE currculum such as
insufficent training and continued professional development opportunities for
teachers, lack of allocation of time for PE, poor facilities and lack of equipment

70
(Irish National Teachers Organisation 2007). The lack of adequate training in
physical education for Irish primary school teachers is reinforced by more recent
studies (Fletcher & Mandigo 2012; Coulter & Woods 2012; Murphy & O’Leary
2012). This is in stark contrast to the prequiste of certification to teach physical
education in the majority of States in America (National Association for Sport and
Physical Education & American Heart Association 2012). Our results show that Irish
children possess the same level of motor skill proficiency in the early stages of
primary education compared to their American peers (Figure 4.3). Figure 4.3 shows
that as age increases, Irish children begin to fall further behind their American
peers. One hypothesis is that the lack of opportunities for effective PA and motor
skill development in primary school leads to a gap between those children who
engage in regular PA outside of school and those who do not (Magalhães et al.
2011). As a result of these differences in proficiency and the increased awareness of
competence by children with age, children with lower competences become
discouraged from future participation (Stodden et al. 2008). An alternative
hypothesis concerns the influence of modern society and the advent of new
technology.
5.1.5 Societal Problems
In modern times it has become easier for children to occupy themselves without
need for social PA or leisure time free play. Children now spend large periods of
their free time engaged in screen time based activities involving smartphones,
games consoles or tablets, reducing time that had been previously spent engaged in
PA pursuits (Barnett et al. 2012). This may have also led to a reduction in dexterous
activities such playing board games many of which have proven to improve sensory,
motor and cognitive skills (Neistadt et al. 1993). As such they are losing valuable
opportunities for to work on their manual dexterity and coordination skills. These
skills can only be developed through practice. The engineering of fine manual
control tasks out of modern day life is a worrying prospect for the development of
these skills. Previous tasks such as tying shoe laces or ties and buttoning of shirts

71
and coats have been somewhat replaced by alternatives such as the use of velcro
straps, clip on ties and zips (Missiuna et al. 2003; Missiuna 1999).
5.1.6 Other influences
In addition to general cultural or societal influences, environmental factors unique
to each child can alter motor skill development. The influence of individual parental
practices also play a role in children's motor skill development (Summers et al.
2008a). For example, a parent who insists that their child uses a knife and fork
correctly increases the opportunities for practice of fine motor skills thus facilitating
higher levels of fine motor skill development compared to a child whose parents
employ other practices such as allowing children to use cutlery incorrectly or to
use a spoon (Summers et al. 2008b).
Fine motor skill analysis using the BOT-2 has provided us with a product based
assessment of the level of motor skill in Irish primary school children. Unfortunetly,
it tells us little about the higher processes which are occurring in order to perceive
information, organise, plan and execute actions. A simple synchronisation task such
as a pendulum based experiment would allow us to gain a better understanding of
the effect which the altering of sensory information has on the coordinative
structures of the brain.

72
5.2 Coordination
Pendulum based tasks have been used for years to evaluate the dynamics of
coordination in adults (Schmidt et al. 1990; Jeka & Kelso 1989; Roerdink et al. 2008;
Roerdink 2008). They have been used to gain a better understanding of motor
coordination in a variety of altered sensory conditions. The majority of studies have
measured coordination in response to visual and/or auditory stimuli (Varlet, Marin,
Issartel, et al. 2012; Richardson et al. 2005; Schmidt & O’Brien 1997; Armstrong &
Issartel 2014). Studies have also investigated the effect of frequency of
presentation and amplitude of movement of stimuli on coordination (Temprado &
Laurent 2004; De Rugy et al. 2008; Hajnal et al. 2009). A study by Hajnal et al.
(2009) investigated whether the duration which the stimulus was presented and
location of sensory information influenced visuomotor coordination. They found
that the end points of sensory information played a significant role in the strength
of coordination demonstrated (Hajnal et al. 2009). This suggests that end points
provide particularly salient information which individuals could concentrate on
coordinating with (Hajnal et al. 2009). Research has also shown that individuals
naturally begin to coordinate with external rhythms when they are present (Oullier
et al. 2008; Lopresti-Goodman et al. 2008; Richardson et al. 2005). This highlights
the continuous nature of human perception in which we are constantly interacting
with the environment and gathering information from a number of sources
(Schmidt et al. 2007). In fact this relationship has been found to be so strong that
individuals often cannot help coordinating with external stimuli despite being
instructed not to (Lopresti-Goodman et al. 2008; Richardson et al. 2005). As such,
coordination is a natural action for humans which happens throughout our
everyday lives and an ability to coordinate with a variety of constantly changing
stimuli is vital for our successful interaction with the world around us.
This study has been the first time to our knowledge that a pendulum based task has
been used to test the coordination levels of children. As such we hope that this
study will be able to shed new light on the coordinative processes in children and
examine how they differ from that of adults.

73
5.2.1 Condition
Not surprisingly children were found to demonstrate lower level of overall
coordination compared to adults (Armstrong & Issartel 2014). Children
demonstrated average CRP values of 54°, 41° and 41° for auditory, visual and
multisensory conditions respectively. This is signifcantly higher than values of 27°
for auditory, 16° for visual and 19° for multisensory conditions reported by
Armstrong et al. (2014) for adults. This relationship also existed for the stability of
coordination with children showing greater SD of CRP compared to adults for
auditory (33° v 13°), visual (28° v 8.6°) and multisensory (26° v 9°) conditions
(Armstrong & Issartel 2014). However coordination (Figure 4.10) and stability of
coordination (Figure 4.11 ) were shown to improve with age. This is an interesting
difference as research shows that the maturation of the structure and function of
the perceptual systems is reached as young as 6 years of age in relation to the
visual and auditory system (Haywood & Getchell 2009; Gallahue & Ozmun 2006;
Piek 2006). This function although mature, is likely to lag behind that of adults in
terms of the speed and efficiency with which information is processed. Therefore it
is plausible to hypothesise that this improvement in coordination levels which will
continue with age is as a result of an increase in the efficiency and speed with
which children process information and initiate the appropriate actions (Haywood
& Getchell 2009). The youngest children demonstrated the lowest level of
coordination overall (Figure 4.10) scoring significantly poorer than their older peers.
This is not a surprising finding as children of this age group are on the fringes of
maturation for their perceptual systems and as such have limited experience of
their uses in dynamic environments (Piek 2006).
Like adults, children demonstrated preference for visual stimuli (Armstrong &
Issartel 2014; Armstrong et al. 2013). All children had higher levels of coordination
(Figure 4.8) and more stability (Figure 4.13) for visual conditions compared to audio
conditions. This is not surprising with children being found to demonstrate a higher
reliance for visual information compared to auditory or even haptic. (D’Hondt et al.
2011; Cuisinier et al. 2011; Huys et al. 2005). As such interventions for the

74
treatment of children with motor impairments have often centred around visual
stimuli (Gersten et al. 1975).
5.2.2 Frequency
Children demonstrated the highest coordination levels for trials at their preferred
frequency with no significant differences being found between the different age
groups (Figure 4.6). Children's performance for the faster (+20%) and slower (-20%)
frequencies were found to have CRP values indicating poorer levels of coordination
(Figure 4.9) and SD of CRP demonstrating more variability in their performance
(Figure 4.12). This is in keeping with previous research showing poorer coordination
and greater variability in adults once tempo is increased beyond ones natural or
"eigenfrequency" (Schmidt et al. 1998). The increase or decrease in frequency
seemed to increase the difficulty resulting in higher variability in coordination
(Figure 4.12). The differences for the +20% condition reached significant levels
which suggests the increased difficulty of the slower frequency may have been
offset by the increased time available for adaption during the movement. In
particular the +20% frequencies proved to be the most difficult frequency (Figure
4.12) showing the most variability in performance for all age groups. The magnitude
of increase for frequency might have been a factor in this, with a 20% increase in
speed proving to be difficult for children of such a young age. This may have caused
children to switch between periods of falling behind the stimulus and catching up
again.
5.2.3 Multisensory
Research suggests that an increase in the information available results in improved
performance when congruent (Romero et al. 2012; Richardson et al. 2009). The
benefit of multisensory information can be seen with all children demonstrating
improved coordination and compared to unimodal conditions regardless of their
age (Figure 4.14). The multisensory conditions showed slightly better coordination
(Figure 4.8) compared to visual but they also showed greater stability of
coordination (Figure 4.13) during multisensory conditions. This should seem to
suggest that the integration of multiple sensory stimuli are combined to improve

75
coordination even in children of a young age. Research in adults suggests that the
benefits of multisensory can only be seen in the most difficult conditions
(Armstrong & Issartel 2014; Armstrong et al. 2013). This suggests that unimodal
information is sufficient to meet the needs of the participant for most conditions
(Armstrong & Issartel 2014; Armstrong et al. 2013; Sinnett et al. 2008). The benefit
of multisensory information in children suggests that multiple forms of sensory
information are combined in order to make up for the shortfalls in children's lack of
efficiency to integrate unisensory forms of information (Hillock et al. 2011).
If we look at Auditory conditions in isolation (Figure 4.15) we see a number of key
relationships demonstrating the effect of age and frequency on coordination levels.
Children tended to have the best levels of coordination for the preferred
frequencies. When the frequency was altered, children's coordination levels
dropped with the youngest children being most affected as a result of their inability
to adapt. The level of coordination for the oldest children demonstrates much less
variation presumably as their integration ability has become more efficient as a
result of the maturation process. Therefore the older children tended to benefit
less from the multisensory conditions than the younger children (Figure 4.14).

76
Chapter 6. CONCLUSION
The current study has shown that the level of fine motor proficiency in Irish children
among 6-8 year olds is reaching the expected levels. This suggests that young
children are receiving sufficient opportunities for practice and appropriate levels of
fine motor task stimulation during infancy till the early years of primary school..
This is likely a combination of the high availability of children's toys designed to
stimulate infants physical and cognitive development, appropriate early childhood
education curricula such as the Áistear framework (National Council for Curriculum
and Assessment 2009). However beyond first class, children seem to be falling
behind that of the expected level for children of the same age (See Figure 4.3).
These children are at risk of developing lower levels of motor competence and self
efficacy which can drastically affect their participation in PA throughout their youth
and into adulthood. The reasons why children fall behind the expected rate of
progression are currently poorly understood but are likely to be as a result of a
complex interaction between biological, environmental, social and cultural factors
(Malina & Little 2008; Cintas 1995; Dewey & Wilson 2001b). In additon this study
also demonstrated children's preference for visual stimuli compared to audio
stimuli. We found that younger children relied more on visual information
compared to their older peers. This is likely as a result of their inefficient processing
ability of information which improves with maturation. The study highlighted the
benefit of multiple forms of sensory information for the coordination process in
children. This finding suggests multisensory integration can improve coordination
particularly in more difficult conditions or when children's unisensory process
ability is not yet at a mature level.

77
Chapter 7. LIMITATIONS/FUTURE STUDIES
Our study was the first that we are aware of to investigate fine motor skill in Irish
children. However the power of the research is limited by the number of children
we were able to test (N=139). In addition this sample was also limited to 3 age
cohorts between the ages of 6-12 years. As such it only provides a small
representation for the state of fine motor skill proficiency in Irish primary school
children. Our study was able to provide an accurate measure of fine motor skill
proficicency in children however it lacks the ability to accurately measure the
impact on activities of daily life and functioning such as hand writing or
participation in PA (WHO 2001). Future studies could follow the approaches of
Cairney et al. (2005) and objectively measure PA levels as well as predictors of PA
such as self efficacy. The use of more than a single measure of motor skill
competence would also serve to build a clearer picture of the extent to which
motor skill difficulties affect the quality of life of children and adults (Magalhães et
al. 2011). The effect of weight status on motor skill ability and coordination ability is
one area which warrants future study. The weight status of children could act as a
potential confounding factor influencing the amount of participation in PA and
motor skill development of children (Hendrix et al. 2014). Reviews of the current
research in motor skill disorders such as DCD has shown the need for longitudinal
studies of the effect of DCD on PA in addition to other effects on cognitive and
emotional development (Hendrix et al. 2014; Visser 2003; Magalhães et al. 2011;
Rivilis et al. 2011b). This study was also the first of our knowledge to test young
children's coordination ability through a pendulum task. This subtest demonstrated
how the integration of sensory information improves with age. The study is limited
once more by the small sample size (N=72). In addition to the lack of similar work to
which performance can be compared against. The ability for young children to pay
attention for prolonged periods of time warrants further investigation before this
measure can be accepted as a developmentally appropriate form of assessment.
Future studies should seek to expand the variables to be assessed to provide finer
grain analyses of the complexities behind sensory integration during motor
performance and the coordination process overall.

78
Chapter 8. REFERENCES
Ajuriaguerra, de J. & Hecaen, H., 1964. Le cortex cerebral: Etude neuropsychopathologique, Paris: Masson.
Aken, K. Van et al., 2007. Motor development in school-aged children with 22q11 deletion DiGeorge syndrome. Developmental Medicine & Child Neurology, (2), pp.210–213.
Albaret, J. et al., 1995. Hétérogénéité des dyspraxies de développement: tentative de classification. ANAE, (32), pp.61–70.
APA, 2002. Diagnostic and Statistical manual of mental health disoders 4th Ed tex., Washington DC: American Psychiatric Association.
Armstrong, A. et al., 2013. The supplementation of spatial information improves coordination. Neuroscience letters, 548, pp.212–216.
Armstrong, A. & Issartel, J., 2014. Sensorimotor synchronization with audio-visual stimuli: limited multisensory integration. Experimental brain research.
Ayres, A., 1985. Developmental dyspraxia and adult-onset apraxia, Torrance, CA: Sensory Integration International.
Ayres, A., 1972. Sensory integration and learning disorders., Los Angeles, CA: Western Psychological Services.
Barnett, L.M. et al., 2009. Childhood motor skill proficiency as a predictor of adolescent physical activity. The Journal of adolescent health : official publication of the Society for Adolescent Medicine, 44(3), pp.252–259.
Barnett, L.M. et al., 2010. Gender Differences in Motor Skill Proficiency From Childhood to Adolescence. Research Quarterly for Exercise and Sport, 81(2), pp.162–170.
Barnett, L.M. et al., 2012. Use of Electronic Games By Young Children and Fundamental Movement Skills? 1 , 2. Perceptual and Motor Skills, 114(3), pp.1023–1034.

79
Barnett, L.M., Kooistra, L. & Henderson, S., 1998. “Clumsiness” as Syndrome and Symptom. Human Movement Science, 17(4-5), pp.435–447.
Barnhart, R.C. et al., 2003. Developmental coordination disorder. Physical therapy, 83(8), pp.722–731.
Bart, O. et al., 2011. How do young children with DCD participate and enjoy daily activities? Research in developmental disabilities, 32(4), pp.1317–1322.
Batey, C. et al., 2013. Self-efficacy toward physical activity and the physical activity behavior of children with and without Developmental Coordination Disorder. Human movement science, 36(1), pp.258–271.
Beek, P., Peper, C. & Daffertshofer, A., 2002. Modeling rhythmic interlimb coordination: Beyond the Haken-Kelso-Bunz model. Brain and Cognition, 48(1), pp.149–165.
Bejerot, S. et al., 2013. Poor motor skills: a risk marker for bully victimization. Aggressive behavior, 39(6), pp.453–461.
Belton, S. et al., 2014. Youth-Physical Activity Towards Health: evidence and background to the development of the Y-PATH physical activity intervention for adolescents. BMC public health, 14, pp.122–145.
Bernie, C. & Rodger, S., 2004. Cognitive strategy use in school-aged children with developmental coordination disorder. Physical & occupational therapy in pediatrics, 24(4), pp.23–45.
Beunen, G. & Thomis, M., 2000. Muscular strength development in children and adolescents. Pediatric exercise science, 12, pp.174–197.
Biddle, S.J.H., Gorely, T. & Stensel, D.J., 2004. Health-enhancing physical activity and sedentary behaviour in children and adolescents. Journal of sports sciences, 22(8), pp.679–701.
Blakemore, J., Berenbaum, S. & Liben, L., 2009. Gender Development, New York: Psychology Press.

80
Blakemore, S.J., Wolpert, D.M. & Frith, C.D., 2002. Abnormalities in the awareness of action. Trends in cognitive sciences, 6(6), pp.237–242.
Bo, J. & Lee, C.-M., 2013. Motor skill learning in children with Developmental Coordination Disorder. Research in developmental disabilities, 34(6), pp.2047–2055.
Bos, A.F. et al., 2013. Development of fine motor skills in preterm infants. Developmental medicine and child neurology, 55 Suppl 4, pp.1–4.
Bouffard, M., 1996. A test of the activity deficit hypothesis with children with movement difficulties. Adapted Physical Activity Quarterly, 13(1), pp.61–73.
Brainard, D., 1997. The Psychophysics Toolbox. Spatial Vision, 100, pp.433–436.
Breslin, G. et al., 2012. The effect of teachers trained in a fundamental movement skills programme on children’s self-perceptions and motor competence. European Physical Education Review, 18(1), pp.114–126.
Brookes, R.L., Nicolson, R.I. & Fawcett, A.J., 2007. Prisms throw light on developmental disorders. Neuropsychologia, 45(8), pp.1921–1930.
Bruininks, R.H., 1978. Bruininks-Oseretsky Test of Motor Proficiency: Examiners Manual, Circle Pines, MN: American Guidance Service.
Bruininks, R.H. & Bruininks, B.D., 2005. Bruininks-Oseretsky Test of Motor Proficiency 2nd Edition(BOT-2): Examiners Manual 2nd ed., Minnesota: Pearson.
Van der Burg, E. et al., 2008. Pip and pop: nonspatial auditory signals improve spatial visual search. Journal of experimental psychology. Human perception and performance, 34(5), pp.1053–1065.
Burton, A. & Miller, D., 1998. Movement Skill Assessment, Champaign, Illinois: Human Kinetics.
Cairney, J. et al., 2009. Comparing probable case identification of developmental coordination disorder using the short form of the

81
Bruininks-Oseretsky Test of Motor Proficiency and the Movement ABC. Child: care, health and development, 35(3), pp.402–408.
Cairney, J. et al., 2005. Developmental coordination disorder and overweight and obesity in children aged 9-14 y. International journal of obesity (2005), 29(4), pp.369–372.
Cairney, J. et al., 2007. Developmental coordination disorder and reported enjoyment of physical education in children. European Physical Education Review, 13(1), pp.81–98.
Cairney, J. et al., 2012. Developmental Coordination Disorder, gender, and body weight: examining the impact of participation in active play. Research in developmental disabilities, 33(5), pp.1566–1573.
Cairney, J. et al., 2005. Developmental coordination disorder, generalized self-efficacy toward physical activity, and participation in organized and free play activities. The Journal of pediatrics, 147(4), pp.515–520.
Cairney, J., Hay, J. a, Veldhuizen, S., et al., 2010. Developmental coordination disorder, sex, and activity deficit over time: a longitudinal analysis of participation trajectories in children with and without coordination difficulties. Developmental medicine and child neurology, 52(3), pp.e67–72.
Cairney, J., Hay, J., Veldhuizen, S., et al., 2010. Trajectories of relative weight and waist circumference among children with and without developmental coordination disorder. CMAJ: Canadian Medical Association journal, 182(11), pp.1167–1172.
Cairney, J., Hay, J. & Faught, B., 2006. Developmental coordination disorder, age, and play: a test of the divergence in activity-deficit with age hypothesis. Adapted Physical Activity Quarterly, 23(3), pp.261–276.
Cairney, J., Veldhuizen, S. & Szatmari, P., 2010. Motor coordination and emotional-behavioral problems in children. Current opinion in psychiatry, 23(4), pp.324–329.

82
Calvert, G. a & Thesen, T., 2004. Multisensory integration: methodological approaches and emerging principles in the human brain. Journal of physiology, Paris, 98(1-3), pp.191–205.
Cantell, M.H., 1994. Clumsiness in adolescence: Educational, motor, and social outcomes of motor delay detected at 5 years. Adapted Physical Activity Quarterly, 11, pp.115–129.
Cantell, M.H., Crawford, S.G. & Tish Doyle-Baker, P.K., 2008. Physical fitness and health indices in children, adolescents and adults with high or low motor competence. Human movement science, 27(2), pp.344–362.
Cantell, M.H., Smyth, M.M. & Ahonen, T.P., 2003. Two distinct pathways for developmental coordination disorder: Persistence and resolution. Human Movement Science, 22(4-5), pp.413–431.
Cermak, S. & Larkin, D., 2002. Developmental Coordination Disorder, San Diego, CA: Singular Press.
Chen, A., 2013. Motor skills matter to physical activity – At least for children. Journal of Sport and Health Science, 2(1), pp.58–59.
Chen, C. et al., 2013. Potential predictors of changes in gross motor function during various tasks for children with cerebral palsy: a follow-up study. Research in developmental disabilities, 34(1), pp.721–728.
Chen, C.-M. et al., 2011. Motor factors associated with health-related quality-of-life in ambulatory children with cerebral palsy. American journal of physical medicine & rehabilitation / Association of Academic Physiatrists, 90(11), pp.940–947.
Cho, H. et al., 2014. Motor function in school-aged children with attention-deficit/hyperactivity disorder in Korea. Psychiatry investigation, 11(3), pp.223–227.
Chui, M., Ng, A. & Fong, A., 2007. Differences in the fine motor performance of children in Hong Kong and the United States on the Bruininks-Oseretsky Test of Motor Proficiency. Hong Kong Journal of Occupational Therapy, 17(1), pp.1–9.

83
Cintas, H., 1995. Cross-cultural similarities and differences in development and the impact of parental expectations on motor behavior. Pediatric physical therapy, 7, pp.103–111.
Cliff, D.P. et al., 2011. Movement skills and physical activity in obese children: randomized controlled trial. Medicine and science in sports and exercise, 43(1), pp.90–100.
Cliff, D.P. et al., 2009. Relationships between fundamental movement skills and objectively measured physical activity in preschool children. Pediatric exercise science, 21(4), pp.436–449.
Cole, T.J. et al., 2008. Establishing A Standard Definition For Child Overweight And Obesity Worldwide: International Survey. Bmj, 320(7244), pp.1240–1243.
Cools, W. et al., 2009. Movement skill assessment of typically developing preschool children: a review of seven movement skill assessment tools. Journal of sports science & medicine, 8(2), pp.154–168.
Coulter, M. & Woods, C.B., 2012. Primary teachers’ experience of a physical education professional development programme. Irish Educational Studies, 31(3), pp.329–343.
Cousins, M. & Smyth, M.M., 2003. Developmental coordination impairments in adulthood. Human Movement Science, 22(4-5), pp.433–459.
Crawford, S.G., Wilson, B.N. & Dewey, D., 2001. Identifying developmental coordination disorder: consistency between tests. Physical & occupational therapy in pediatrics, 20(2-3), pp.29–50.
Cuisinier, R. et al., 2011. Reweighting of sensory inputs to control quiet standing in children from 7 to 11 and in adults. PloS one, 6(5), pp.1–5.
D’Hondt, E. et al., 2011. Postural balance under normal and altered sensory conditions in normal-weight and overweight children. Clinical biomechanics, 26(1), pp.84–89.

84
Del-Monte, J. et al., 2013. Social motor coordination in unaffected relatives of schizophrenia patients: a potential intermediate phenotype. Frontiers in behavioral neuroscience, 7, pp.1–10.
Dewey, D. & Wilson, B.N., 2001a. Developmental coordination disorder: What is it. Physical and Occupational Therapy in Pediatrics, 20(2), pp.5–27.
Dewey, D. & Wilson, B.N., 2001b. Developmental coordination disorder: What is it. Physical and Occupational Therapy in Pediatrics, 20(2), pp.5–27.
Doll, E., 1946. The Oseretsky Tests of Motor Proficiency, Minnesota: American Guidance Service.
Duda, J., 1987. Toward a developmental theory of children’s motivation in sport. Journal of sport psychology, 9, pp.130–145.
Düger, T. et al., 1999. The assessment of Bruininks-Oseretsky test of motor proficiency in children. Pediatric rehabilitation, 3(3), pp.125–131.
Dunford, C. et al., 2005. Children’s Perceptions of the Impact of Developmental Coordination Disorder on Activities of Daily Living. The British Journal of Occupational Therapy, 68(5), pp.207–214.
Dwyer, C. & McKenzie, B.E., 1994. Impairment of visual memory in children who are clumsy. Adapted Physical Activity Quarterly, pp.179–189.
Eaton, D.K. et al., 2012. Youth risk behavior surveillance - United States, 2011. Morbidity and mortality weekly report. Surveillance summaries, 61(4), pp.1–162.
Eijsermans, R.M. et al., 2004. Motor performance, exercise tolerance, and health-related quality of life in children on dialysis. Pediatric nephrology, 19(11), pp.1262–1266.
Faught, B.E. et al., 2005. Increased risk for coronary vascular disease in children with developmental coordination disorder. The Journal of adolescent health, 37(5), pp.376–380.

85
Faught, B.E. et al., 2008. Screening for motor coordination challenges in children using teacher ratings of physical ability and activity. Human movement science, 27(2), pp.177–189.
Fetsch, C.R. et al., 2009. Dynamic reweighting of visual and vestibular cues during self-motion perception. The Journal of neuroscience: the official journal of the Society for Neuroscience, 29(49), pp.15601–15612.
Fink, P. et al., 2000. Local and global stabilization of coordination by sensory information. Experimental Brain Research, 134(1), pp.9–20.
Fitzpatrick, D.A. & Watkinson, E.J., 2003. The Lived Experience of Physical Awkwardness : Adults ’ Retrospective Views. Adapted Physical Activity Quarterly, 20, pp.279–297.
Fitzpatrick, P. et al., 2013. Dynamical methods for evaluating the time-dependent unfolding of social coordination in children with autism. Frontiers in integrative neuroscience, 7, pp.1–13.
Fletcher, T. & Mandigo, J., 2012. The primary schoolteacher and physical education: a review of research and implications for Irish physical education. Irish Educational Studies, 31(3), pp.363–376.
Fong, S.S.M., Lee, V.Y.L. & Pang, M.Y.C., 2011. Sensory organization of balance control in children with developmental coordination disorder. Research in developmental disabilities, 32(6), pp.2376–2382.
Gale, C.R. et al., 2009. Psychomotor coordination and intelligence in childhood and health in adulthood--testing the system integrity hypothesis. Psychosomatic medicine, 71(6), pp.675–681.
Gallahue, D. & Ozmun, J., 2006. Understanding Motor Development: Infants, Children, Adolescents, Adults. 6th ed., New York: Mc Graw Hill.
Garcia, C., 1994. Gender differences in young children’s interactions when learning fundamental motor skills. Research Quarterly in Exercise and Sport, 65(3), pp.213–225.

86
Gentile, 1992. The nature of skill acquisition: therapeutic implications for children with movement disorders. In H. Forssberg & H. Hirschfeld, eds. Movement Disorders in children(Medicine and Sport Science, Vol36. Basel, Switzerland: S Karger AG, Medical and Scientific Publishers, pp. 31–40.
Gersten, J.W. et al., 1975. Effectiveness of aides in a perceptual motor training program for children with learning disabilities. Archives of Physical Medicine and Rehabilitation, 56(3), pp.104–110.
Geuze, R. & Börger, H., 1993. Children who are clumsy: Five years later. Adapted Physical Activity Quarterly, 10, pp.10–21.
Ghaziuddin, M. & Butler, E., 1998. Clumsiness in autism and Asperger syndrome: A further report. Journal of Intellectual Disability, 42, pp.43–48.
Gibbs, J., Appleton, J. & Appleton, R., 2007. Dyspraxia or developmental coordination disorder? Unravelling the enigma. Archives of disease in childhood, 92(6), pp.534–539.
Gibson, E. & Pick, A., 2000. Perceptual learning and development: An ecological approach to perceptual learning and development, Oxford: Oxford University Press.
Gillberg, C. et al., 2004. Co-existing disorders in ADHD -- implications for diagnosis and intervention. European child & adolescent psychiatry, 13 Suppl 1, pp.180–192.
Gillberg, C., 1998. Hyperactivity, inattention and motor control problems: prevalence, comorbidity and background factors. Folia Phoniatrica et Logopaedica, 50(3), pp.107–117.
Gillberg, C. & Kadesjö, B., 2003. Why bother about clumsiness? The implications of having developmental coordination disorder (DCD). Neural plasticity, 10(1-2), pp.59–68.
Graf, C. et al., 2004. Correlation between BMI, leisure habits and motor abilities in childhood (CHILT-project). International journal of obesity and related metabolic disorders : journal of the International Association for the Study of Obesity, 28(1), pp.22–26.

87
Green, D. et al., 2011. The risk of reduced physical activity in children with probable Developmental Coordination Disorder: a prospective longitudinal study. Research in developmental disabilities, 32(4), pp.1332–1342.
Gubbay, S., 1978. The Clumsy Child, London: Saunders.
Gwynne, K. & Blick, B., 2004. Motor performance checklist for 5-year-olds: a tool for identifying children at risk of developmental co-ordination disorder. Journal of paediatrics and child health, 40(7), pp.369–373.
Haibach, P., Reid, G. & Collier, D., 2011. Motor Learning and Development, Champaign, Illinois: Human Kinetics.
Hajnal, A. et al., 2009. Location but not amount of stimulus occlusion influences the stability of visuo-motor coordination. Experimental brain research, 199(1), pp.89–93.
Hands, B. & Larkin, D., 2002. DCD and Physical Fitness. In S. Cermak & D. Larkin, eds. Developmental Coordination Disorder. San Diego, CA: Singular Press.
Hardy, L.L. et al., 2010. Fundamental movement skills among Australian preschool children. Journal of science and medicine in sport / Sports Medicine Australia, 13(5), pp.503–508.
Hatzitaki, V. et al., 2002. Perceptual-motor contributions to static and dynamic balance control in children. Journal of motor behavior, 34(2), pp.161–170.
Haywood, K.M. & Getchell, N., 2009. Life Span Motor Development 5th ed., Champaign, Illinois: Human Kinetics.
Henderson, S. & Sugden, D., 1992. Movement Assessment Battery for Children, Kent: Therapy Skill Builders.
Henderson, S., Sugden, D. & Barnett, A., 2007. Movement Assessment Battery for Children - 2 Examiners Manual 2nd ed., London: Harcourt Assessment.

88
Hendrix, C.G., Prins, M.R. & Dekkers, H., 2014. Developmental coordination disorder and overweight and obesity in children: a systematic review. Obesity reviews : an official journal of the International Association for the Study of Obesity, 15(5), pp.1–16.
Hillock, A.R., Powers, A.R. & Wallace, M.T., 2011. Binding of sights and sounds: age-related changes in multisensory temporal processing. Neuropsychologia, 49(3), pp.461–467.
Hoare, D., 1994. Subtypes of developmental coordination disorder. Adapted Physical Activity Quarterly, 11, pp.158–169.
Horn, T. & Hasbrook, C., 1987. Psychological characteristics and the criteria children use for self-evaluation. Journal of Sport Psychology, 9, pp.208–221.
Hume, C., Okely, A. & Bagley, S., 2008. Does weight status influence associations between children’s fundamental movement skills and physical activity? Research Quarterly for Exercise and Sport, 79(2), pp.158–165.
Huys, R., Williams, a M. & Beek, P.J., 2005. Visual perception and gaze control in judging versus producing phase relations. Human movement science, 24(3), pp.403–428.
Iivonen, K.S. et al., 2013. Relationship between fundamental motor skills and physical activity in 4-year-old preschool children. Perceptual and motor skills, 117(2), pp.627–646.
Iloeje, S.O., 2008. Developmental Apraxia Among Nigerian Children in Enugu, Nigeria. Developmental Medicine & Child Neurology, 29(4), pp.502–507.
Irish National Teachers Organisation, 2007. Physical Education in primary school. In A consultative conference on education. Dublin, pp. 1–135.
Jarus, T. et al., 2011. Participation patterns of school-aged children with and without DCD. Research in developmental disabilities, 32(4), pp.1323–1331.

89
Jeka, J. & Kelso, J., 1989. The dynamic pattern approach to coordinated behavior: A tutorial review. In Perspectives on Coordination of Movement. Holland: Elsevier Science Publishers B.V.
Johnson, B. et al., 2010. Motor proficiency in children with neurofibromatosis type 1. Pediatric physical therapy, 22(4), pp.344–348.
Kadesjo, B. & Gillberg, C., 1999. Developmental Coordination Disorder in Swedish 7-Year-Old Children. Journal of the American Academy of Child & Adolescent Psychiatry, 38(7), pp.820–828.
Kaplan, B.J. et al., 2001. The Term Comorbidity Is of Questionable Value in Reference to Developmental Disorders: Data and Theory. Journal of Learning Disabilities, 34(6), pp.555–565.
Kaplan, B.J. & Wilson, B.N., 1998. DCD may not be a discrete disorder. Human movement science, 17, pp.471–490.
Kaplan, H., Sadock, B. & Sadock, V., 2007. Kaplan & Sadock’s synopsis of psychiatry: behavioural sciences/clinical psychiarty 10th ed., Philadelphia: Lippincott Williams & Wilkins.
Katartzi, E.S. & Vlachopoulos, S.P., 2011. Motivating children with developmental coordination disorder in school physical education: the self-determination theory approach. Research in developmental disabilities, 32(6), pp.2674–2682.
Kelly, G., 2004. Pediatric occupational therapy in the 21st century: A survey of UK practice. National Association of Paediatric Occupational Therapy Journal, 8(3), pp.17–19.
Kennedy, C.H. et al., 2007. Children with severe developmental disabilities and behavioral disorders have increased special healthcare needs. Developmental medicine and child neurology, 49(12), pp.926–930.
Keogh, J., Griffin, N. & Spector, R., 1981. Observer perceptions of movement confidence. Research Quarterly in Exercise and Sport, 52(4), pp.465–473.

90
King, B.R. et al., 2011. Statistically characterizing intra- and inter-individual variability in children with Developmental Coordination Disorder. Research in developmental disabilities, 32(4), pp.1388–1398.
King, C. & Dunn, J., 1989. Classroom teachers’ accuracy in observing students' motor performance. Adapted Physical Activity Quarterly, 6, pp.52–57.
Kiphard, E. & Shilling, F., 2007. Korperkoordinationtest fur Kinder 2, uberarbeitete und erganzte Auflage 2nd ed., Weinheim: Beltz test.
Kirby, A. & Drew, S., 2010. Guide to Dyspraxia and Developmental Co-ordination Disorder Epidemiology for Health Promotion and Disease Prevention Professionals, London: David Fulton Publishers.
Kirby, A., Sugden, D. & Edwards, L., 2010. Developmental co-ordination disorder (DCD): more than just a movement difficulty. Journal of Research in Special Educational Needs, 10(3), pp.206–215.
Klein, S., Erickson, L. & James, K., 2008. Effectiveness of a computer skills program to improve written communication in children with developmental coordination disorder. Physical & occupational therapy in pediatrics, 28(1), pp.6–23.
Kleiner, M., Brainard, D. & Pelli, D., 2007. “Whats new in Psychtoolbox-3?” In Percept 36 ECVP Abstr. Suppl.
Knight, E. et al., 1992. Clumsy at six - Still clumsy at sixteen: The educational and soical consequences of having motor difficulties in school. In T. Williams, L. Almond, & A. Sparkes, eds. Sport and Physical Activity: Moving toward excellence. London: Chapman and Hall, pp. 249–259.
Kooistra, L. et al., 2005. Motor correlates of ADHD: contribution of reading disability and oppositional defiant disorder. Journal of learning disabilities, 38(3), pp.195–206.
Kurtz, L.A., 2007. Undersanding Motor Skills in Children with Dyspraxia, ADHD, Autism and Other Learning Disabilities, London and Philadelphia: Jessica Kingsley Publishers.

91
Kwan, M.Y.W. et al., 2013. Understanding physical activity and motivations for children with developmental coordination disorder: an investigation using the theory of planned behavior. Research in developmental disabilities, 34(11), pp.3691–3698.
Lalanne, C. & Lorenceau, J., 2004. Crossmodal integration for perception and action. Journal of physiology, Paris, 98(1-3), pp.265–79.
Lam, H.M.Y., 2011. Assessment of preschoolers’ gross motor proficiency: revisiting Bruininks–Oseretsky Test of Motor Proficiency. Early Child Development and Care, 181(2), pp.189–201.
Lam, H.M.Y., 2008. Can Norms Developed in One Country Be Applicable to Children of Another Country?. Australian Journal of Early Childhood, 33(4), pp.17–24.
Landgren, M., Kjellman, B. & Gillberg, C., 1998. Attention deficit disorder with developmental coordination disorders. Archives of disease in childhood, 79(3), pp.207–212.
Laszlo, J.I. & Bairstow, P.J., 1983. Kinaesthesis: Its measurement, training and relationship to motor control. The Quarterly Journal of Experimental Psychology Section A, 35(2), pp.411–421.
Lee, I.-M. et al., 2012. Effect of physical inactivity on major non-communicable diseases worldwide: an analysis of burden of disease and life expectancy. Lancet, 380(9838), pp.219–229.
Li, Y.-C. et al., 2011. Motor coordination and health-related physical fitness of children with developmental coordination disorder: a three-year follow-up study. Research in developmental disabilities, 32(6), pp.2993–3002.
Van der Linde, B.W. et al., 2013. A systematic review of instruments for assessment of capacity in activities of daily living in children with developmental co-ordination disorder. Child: care, health and development, (Criterion II), pp.1–12.
Lingam, R. et al., 2009. Prevalence of developmental coordination disorder using the DSM-IV at 7 years of age: a UK population-based study. Pediatrics, 123(4), pp.693–700.

92
Loh, P.R., Piek, J.P. & Barrett, N.C., 2011. Comorbid ADHD and DCD: examining cognitive functions using the WISC-IV. Research in developmental disabilities, 32(4), pp.1260–1269.
Lopes, V.P. et al., 2011. Motor coordination as predictor of physical activity in childhood. Scandinavian journal of medicine & science in sports, 21(5), pp.663–669.
Lopes, Ví.P. et al., 2012. Motor coordination, physical activity and fitness as predictors of longitudinal change in adiposity during childhood. European Journal of Sport Science, 12(4), pp.384–391.
Lopresti-Goodman, S.M. et al., 2008. Period basin of entrainment for unintentional visual coordination. Journal of Motor Behavior, 40(1), pp.3–10.
Lorås, H. et al., 2014. Individual differences in timing of discrete and continuous movements: a dimensional approach. Psychological research, 78(2), pp.289–299.
Lord, R. & Hulme, C., 1987. Perceptual judgments of normal and clumsy children. Developmental Medicine & Child Neurology, 29(2), pp.250–257.
Losse, A. et al., 1991. Clumsiness in children--do they grow out of it? A 10-year follow-up study. Developmental Medicine and Child Neurology, 33(1), pp.55–68.
Lucas, B.R. et al., 2013. The Bruininks-Oseretsky Test of Motor Proficiency-Short Form is reliable in children living in remote Australian Aboriginal communities. BMC pediatrics, 13(1), p.135.
Macnab, J.J., Miller, L.T. & Polatajko, H.J., 2001. The search for subtypes of DCD: is cluster analysis the answer? Human movement science, 20(1-2), pp.49–72.
Maeland, A., 1992. Identification of children with motor coordination problems. Adapted Physical Activity Quarterly, pp.330–343.
Magalhães, L.C., Cardoso, a a & Missiuna, C., 2011. Activities and participation in children with developmental coordination disorder:

93
a systematic review. Research in developmental disabilities, 32(4), pp.1309–1316.
Maitland, C. et al., 2013. A place for play? The influence of the home physical environment on children’s physical activity and sedentary behaviour. The international journal of behavioral nutrition and physical activity, 10, pp.99–120.
Malina, R.M. & Little, B.B., 2008. Physical activity: the present in the context of the past. American journal of human biology : the official journal of the Human Biology Council, 20(4), pp.373–391.
Mandich, A. et al., 2001. Treatment of children with Developmental Coordination Disorder: what is the evidence? Physical & occupational therapy in pediatrics, 20(2-3), pp.51–68.
Mandich, A., Polatajko, H.J. & Rodger, S., 2003. Rites of passage: Understanding participation of children with developmental coordination disorder. Human Movement Science, 22(4-5), pp.583–595.
McCartney, J., 2002. Rethinking the Computer Music Language: SuperCollider. Computer Music Journal, 26(4), pp.61–68.
McDermott, J.H., Schemitsch, M. & Simoncelli, E.P., 2013. Summary statistics in auditory perception. Nature neuroscience, 16(4), pp.493–498.
Miguel, H.D.O., 2011. Online control of handwriting in children with Developmental Coordination Disorder. Iowa State University.
Missiuna, C. et al., 2011. A staged approach for identifying children with developmental coordination disorder from the population. Research in developmental disabilities, 32(2), pp.549–559.
Missiuna, C. et al., 2007. A Tracjectory of Trouble: Parents Impressions of the impact of developmental coordination disorder. Physical & occupational therapy in pediatrics, 27(1), pp.81–101.
Missiuna, C., 1999. Children with developmental coordination disorder: at home and in the classroom., Hamilton: Centre for Childhood Disability Research.

94
Missiuna, C. et al., 2008. Life experiences of young adults who have coordination difficulties. Canadian journal of occupational therapy, 75(3), pp.157–166.
Missiuna, C. & Polatajko, H., 1994. Developmental dyspraxia by any other name: are they all just clumsy children? The American journal of occupational therapy, 49(7), pp.619–627.
Missiuna, C., Rivard, L. & Bartlett, D., 2003. Early identification and risk management of children with developmental coordination disorder. Pediatric physical therapy, 15(1), pp.32–38.
Missiuna, C., Rivard, L. & Bartlett, D., 2006. Exploring assessment tools and the target of intervention for children with developmental coordination disorder. Physical & occupational therapy in pediatrics, 26, pp.71–89.
Miyahara, M., 1994. Subtypes of students with learning disabilities based upon gross motor functions. Adapted physical activity quarterly, 11, pp.368–382.
Morano, M., Colella, D. & Caroli, M., 2011. Gross motor skill performance in a sample of overweight and non-overweight preschool children. International Journal Of Pediatric Obesity: IJPO: An Official Journal Of The International Association For The Study Of Obesity, 6 Suppl 2, pp.42–46.
Morgan, P.J. et al., 2013. Fundamental movement skill interventions in youth: a systematic review and meta-analysis. Pediatrics, 132(5), pp.1361–1383.
Murphy, F. & O’Leary, M., 2012. Supporting primary teachers to teach physical education: continuing the journey. Irish Educational Studies, 31(3), pp.297–310.
Nakai, A. et al., 2011. Evaluation of the Japanese version of the Developmental Coordination Disorder Questionnaire as a screening tool for clumsiness of Japanese children. Research in developmental disabilities, 32(5), pp.1615–1622.

95
National Association for Sport and Physical Education & American Heart Association, 2006. 2006 Shape of the Nation Report: Status of physical education in the USA, Reston, VA.
National Association for Sport and Physical Education & American Heart Association, 2010. 2010 Shape of the Nation Report: Status of physical education in the USA, Reston, VA: National Association for Sport and Physical Education.
National Association for Sport and Physical Education & American Heart Association, 2012. 2012 Shape of the Nation Report: Status of physical education in the USA, Reston, VA.
National Council for Curriculum and Assessment, 2009. Aistear: The early childhood curriculum framework.
Neistadt, M.E. et al., 1993. An analysis of a board game as a treatment activity. The American journal of occupational therapy : official publication of the American Occupational Therapy Association, 47(2), pp.154–160.
Nilsson, a et al., 2009. Between- and within-day variability in physical activity and inactivity in 9- and 15-year-old European children. Scandinavian journal of medicine & science in sports, 19(1), pp.10–18.
Noda, W. et al., 2013. Examining the relationships between attention deficit/hyperactivity disorder and developmental coordination disorder symptoms, and writing performance in Japanese second grade students. Research in developmental disabilities, 34(9), pp.2909–2916.
Okely, A.D. & Booth, M.L., 2004. Mastery of fundamental movement skills among children in New South Wales: prevalence and sociodemographic distribution. Journal of Science and Medicine in Sport, pp.358–372.
Okely, A.D., Booth, M.L. & Patterson, J.W., 2001. Relationship of physical activity to fundamental movement skills among adolescents. Medicine and science in sports and exercise, 33(11), pp.1899–1904.

96
De Oliveira, R.F. & Wann, J.P., 2010. Integration of dynamic information for visuomotor control in young adults with developmental coordination disorder. Experimental brain research. Experimentelle Hirnforschung. Expérimentation cérébrale, 205(3), pp.387–94.
Ormrod, J., 2006. Educational psychology: Developing learners 5th ed., Upper Saddle River, N.J: Pearson/Merril Prentice Hall.
Orton, S., 1937. Reading, writing and speech problems in children, New York: W.W Norton.
Osika, W. & Montgomery, S.M., 2008. Physical control and coordination in childhood and adult obesity: longitudinal birth cohort study. Britisch Medical Journal, 337, pp.449–452.
Oullier, O. et al., 2008. Social coordination dynamics: measuring human bonding. Social neuroscience, 3(2), pp.178–192.
Pelli, D., 1997. The VideoToolbox software for visual psychophysics: Transforming numbers into movies. Spatial Vision, 10, pp.437–442.
Pelligrini, A. & Smith, P., 1998. Physical Activity Play: Consensus and Debate. Child Development, 69(3), pp.609–610.
Van Pelt, M. & Kalish, R. a, 1983. Motor proficiency in children with psychosis. Physical therapy, 63(2), pp.194–199.
Peters, J.M., Barnett, a L. & Henderson, S.E., 2001. Clumsiness, dyspraxia and developmental co-ordination disorder: how do health and educational professionals in the UK define the terms? Child: care, health and development, 27(5), pp.399–412.
Piek, J.P., 2006. Infant Motor Development, Champaign, Illinois: Human Kinetics.
Piek, J.P. et al., 2008. The role of early fine and gross motor development on later motor and cognitive ability. Human movement science, 27(5), pp.668–681.
Piek, J.P., Baynam, G.B. & Barrett, N.C., 2006. The relationship between fine and gross motor ability, self-perceptions and self-worth in

97
children and adolescents. Human movement science, 25(1), pp.65–75.
Piek, J.P. & Edwards, K., 1997. The identification of children with developmental coordination disorder by class and physical education teachers. The British journal of educational psychology, 67, pp.55–67.
Pikovsky, A.S., Rosenblum, M.G. & Kurtz, L.A., 2003. Synchronization: A Universal Concept in Nonlinear Sciences., New York: Cambridge Univeristy Press.
Pinheiro, R.C., Martinez, C.M.S. & Fontaine, A.M.G.V., 2014. Visual motor integration and overall development of preterm and at term children at the beginning of schooling. Journal of Human Growth and Development, 24(2), pp.181–187.
Pitcher, T.M., Piek, J.P. & Hay, D. a, 2003. Fine and gross motor ability in males with ADHD. Developmental medicine and child neurology, 45(8), pp.525–535.
Plimpton, C. & Regimbal, C., 1992. Differences in motor proficiency according to gender and race. Perceptual and Motor Skills, 74(2), pp.399–402.
Polatajko, H.J., Kaplan, B.J. & Wilson, B.N., 1992. Sensory integration treatment for children with learning disabilities: its status 20 years later. Occupational Therapy Journal of Research, 12(6), pp.323–339.
Poulsen, A. et al., 2005. Boys with developmental coordination disorder: loneliness and team sports participation. The American journal of occupational therapy, 61(4), pp.451–462.
Poulsen, A., Ziviani, J. & Cuskelly, M., 2008. Leisure time physical activity energy expenditure in boys with developmental coordination disorder: The role of peer relations self-concept perceptions. Occupational Therapy Journal of Research, 28(1), pp.30–40.
Poulsen, A., Ziviani, J. & Cuskelly, M., 2007. Perceived freedom in leisure and physical co-ordination ability: impact on out-of-school
98
activity participation and life satisfaction. Child: care, health and development, 33(4), pp.432–440.
Poulsen, A., Ziviani, J.M. & Cuskelly, M., 2006. General self-concept and life satisfaction for boys with differing levels of physical coordination: the role of goal orientations and leisure participation. Human movement science, 25(6), pp.839–860.
Repp, B.H., 2005. Sensorimotor synchronization: A review of the tapping literature. Psychonomic Bulletin & Review, 12(6), pp.969–992.
Repp, B.H. & Penel, A., 2004. Rhythmic movement is attracted more strongly to auditory than to visual rhythms. Psychological Research, 68(4), pp.252–270.
Richardson, M.J. et al., 2007. Rocking together: Dynamics of intentional and unintentional interpersonal coordination. Human Movement Science, 26(6), pp.867–891.
Richardson, M.J., Campbell, W.L. & Schmidt, R.C., 2009. Movement interference during action observation as emergent coordination. Neuroscience letters, 449(2), pp.117–122.
Richardson, M.J., Marsh, K.L. & Schmidt, R.C., 2005. Effects of visual and verbal interaction on unintentional interpersonal coordination. Journal of Experimental Psychology: Human Perception and Performance, 31(1), p.62.
Rivard, L.M. et al., 2007. Understanding teachers’ perceptions of the motor difficulties of children with developmental coordination disorder (DCD). The British journal of educational psychology, 77, pp.633–648.
Rivilis, I. et al., 2012. A prospective cohort study comparing workload in children with and without developmental coordination disorder. Research in developmental disabilities, 33(2), pp.442–448.
Rivilis, I. et al., 2011a. Physical activity and fitness in children with developmental coordination disorder: a systematic review. Research in developmental disabilities, 32(3), pp.894–910.

99
Rivilis, I. et al., 2011b. Physical activity and fitness in children with developmental coordination disorder: a systematic review. Research in developmental disabilities, 32(3), pp.894–910.
Rodger, S. et al., 2003. Motor and functional skills of children with developmental coordination disorder: A pilot investigation of measurement issues. Human Movement Science, 22(4-5), pp.461–478.
Roerdink, M., 2008. Anchoring: moving from theory to therapy.
Roerdink, M. et al., 2008. Visual and musculoskeletal underpinnings of anchoring in rhythmic visuo-motor tracking. Experimental Brain Research, 184(2), pp.143–156.
Romero, V. et al., 2012. Movement coordination or movement interference: visual tracking and spontaneous coordination modulate rhythmic movement interference. PloS one, 7(9), pp.1–9.
Rose, B., Larkin, D. & Berger, B., 1997. Coordination and gender influences on the perceived competence of children. Adapted Physical, 14, pp.210–221.
Rosenblum, S. & Josman, N., 2003. The relationship between postural control and fine manual dexterity. Physical & occupational therapy in pediatrics, 23(4), pp.47–60.
De Rugy, A. et al., 2006. A neuro-mechanical model for interpersonal coordination. Biological cybernetics, 94(6), pp.427–43.
De Rugy, A., Oullier, O. & Temprado, J.J., 2008. Stability of rhythmic visuo-motor tracking does not depend on relative velocity. Experimental Brain Research, 184(2), pp.269–273.
Sahlander, C., Mattsson, M. & Bejerot, S., 2008. Motor function in adults with Asperger’s disorder: a comparative study. Physiotherapy theory and practice, 24(2), pp.73–81.
Sallis, J.E. et al., 1997. The Effects of a 2-Year Physical Education Program (SPARK) on Physical Activity and Fitness in Elementary School Students. American Journal of Public Health, 87(8), pp.1328–1335.

100
Scharoun, S.M. et al., 2013. Motor skills in Czech children with attention-deficit/hyperactivity disorder and their neurotypical counterparts. Research in developmental disabilities, 34(11), pp.4142–4153.
Schmidt, R. et al., 1992. Dynamical aspects of learning an interlimb rhythmic movement pattern. Journal of Motor Behavior, 24(1), pp.67–83.
Schmidt, R. et al., 1991. Dynamical substructure of coordinated rhythmic movements. Journal of Experimental Psychology: Human Perception and Performance, 17(3), p.635.
Schmidt, R., Carello, C. & Turvey, M., 1990. Phase transitions and critical fluctuations in the visual coordination of rhythmic movements between people. Journal of Experimental Psychology: Human Perception and Performance, 16(2), pp.227–247.
Schmidt, R. & O’Brien, B., 1997. Evaluating the dynamics of unintended interpersonal coordination. Ecological Psychology, 9(3), pp.189–206.
Schmidt, R.. & Lee, T.., 2005. Motor Control and Learning 4th ed., Champaign, Illinois: Human Kinetics.
Schmidt, R.C. et al., 1998. A comparison of intra- and interpersonal interlimb coordination: coordination breakdowns and coupling strength. Journal of experimental psychology. Human perception and performance, 24(3), pp.884–900.
Schmidt, R.C. et al., 2007. Visual tracking and entrainment to an environmental rhythm. Journal of Experimental Psychology: Human Perception and Performance, 33(4), pp.860–870.
Schoemaker, M. & Kalverboer, A., 1994. Social and affective problems of children who are clumsy: How early do they begin? Adapted Physical Activity Quarterly, 11, pp.130–140.
Schott, N. et al., 2007. Physical Fitness in Children With Developmental Coordination Disorder. Research quarterly for exercise and sport, 78(5), pp.438–450.

101
Sigmundsson, H., 2005. Disorders of motor development (clumsy child syndrome). Journal of neural transmission. Supplementum, (69), pp.51–68.
Sinnett, S., Soto-Faraco, S. & Spence, C., 2008. The co-occurrence of multisensory competition and facilitation. Acta psychologica, 128(1), pp.153–161.
Skinner, R.A. & Piek, J.P., 2001. Psychosocial implications of poor motor coordination in children and adolescents. Human movement science, 20(1-2), pp.73–94.
Smits-Engelsman, B.C.M. et al., 2013. Efficacy of interventions to improve motor performance in children with developmental coordination disorder: a combined systematic review and meta-analysis. Developmental medicine and child neurology, 55(3), pp.229–37.
Smoll, F., 1974. Motor impairment and social development. American Corrective Therapy Journal, 28(1), pp.4–7.
Spironello, C. et al., 2010. Concurrent and construct validation of the short form of the Bruininks-Oseretsky Test of Motor Proficiency and the Movement-ABC when administered under field conditions: implications for screening. Child: care, health and development, 36(4), pp.499–507.
Stodden, D.F. et al., 2008. A Developmental Perspective on the Role of Motor Skill Competence in Physical Activity: An Emergent Relationship. Quest, 60(2), pp.290–306.
Sugden, D. a & Chambers, M.E., 2003. Intervention in children with Developmental Coordination Disorder: the role of parents and teachers. The British journal of educational psychology, 73(4), pp.545–561.
Sugden, D. & Dunford, C., 2007. Intervention and the role of theory, empiricism and experience in children with motor impairment. Disability and rehabilitation, 29(1), pp.3–11.
Summers, J., Larkin, D. & Dewey, D., 2008a. Activities of daily living in children with developmental coordination disorder: dressing,

102
personal hygiene, and eating skills. Human movement science, 27(2), pp.215–229.
Summers, J., Larkin, D. & Dewey, D., 2008b. What Impact does Developmental Coordination Disorder have on Daily Routines? International Journal of Disability, Development and Education, 55(2), pp.131–141.
Tal-Saban, M. et al., 2012. The functional profile of young adults with suspected Developmental Coordination Disorder (DCD). Research in developmental disabilities, 33(6), pp.2193–2202.
Temprado, J.-J. & Laurent, M., 2004. Attentional load associated with performing and stabilizing a between-persons coordination of rhythmic limb movements. Acta Psychologica, 115(1), pp.1–16.
Thomas, J.R., 2000. 1999 C. H. McCloy Research Lecture: Children’s Control, Learning, and Performance of Motor Skills. Research Quarterly for Exercise and Sport, 71(1), pp.1–9.
Thomas, J.R. & French, K.E., 1985. Gender differences across age in motor performance a meta-analysis. Psychological bulletin, 98(2), pp.260–282.
Touwen, B., 1979. Examination of the child with minor neurological dysfunction. Clinics in Developmental Medicine, 71, pp.1–23.
Tsai, C.-L., Wilson, P.H. & Wu, S.K., 2008. Role of visual-perceptual skills (non-motor) in children with developmental coordination disorder. Human movement science, 27(4), pp.649–664.
Tseng, M.-H. et al., 2007. Cooccurrence of problems in activity level, attention, psychosocial adjustment, reading and writing in children with developmental coordination disorder. International journal of rehabilitation research, 30(4), pp.327–332.
Ulrich, D., 2000. Test of Gross Motor Development, 2nd Edition. Examiners Manual 2nd ed., Austin, Texas: Pro-ED. Inc.
Vaivre-Douret, L., 2014. Developmental coordination disorders: state of art. Clinical neurophysiology, 44(1), pp.13–23.

103
Varlet, M., Marin, L., Issartel, J., et al., 2012. Continuity of visual and auditory rhythms influences sensorimotor coordination. PloS one, 7(9), pp.1–10.
Varlet, M., Marin, L., Raffard, S., et al., 2012. Impairments of social motor coordination in schizophrenia. PloS one, 7(1), pp.1–8.
Vedul-Kjelsås, V. et al., 2012. The relationship between motor competence, physical fitness and self-perception in children. Child: care, health and development, 38(3), pp.394–402.
Venetsanou, F. et al., 2007. Use of the Bruininks-Oseretsky Test of Motor Proficiency for identifying children with motor impairment. Developmental medicine and child neurology, 49(11), pp.846–848.
Visser, J., 2003. Developmental coordination disorder: a review of research on subtypes and comorbidities. Human Movement Science, 22(4-5), pp.479–493.
Visser, J., Geuze, R. & Kalverboer, A., 1998. Relationship between physical growth, the level of activity and the development of motor skills in adolescence: Differences between children with DCD and controls. Human Movement Science, 17(4-5), pp.573–608.
Wallen, M. & Walker, R., 1995. Occupational therapy practice with children with perceptual motor dysfunction: findings of a literature review and survey. Australian Occupational Therapy Journal, 42, pp.15–25.
Wang, T.-N. et al., 2009. Functional performance of children with developmental coordination disorder at home and at school. Developmental medicine and child neurology, 51(10), pp.817–825.
Wheat, J. & Glazier, P., 2005. Measuring coordination and variability in coordination. In K. Davids, S. J. Bennett, & K. M. Newell, eds. Movement system variability. Champaign, Illinois: Human Kinetics, pp. 167–182.
WHO, 2001. International classification of functioning disability and health(ICF), Geneva, Switzerland: WHO.

104
Williams, H.G. et al., 2008. Motor skill performance and physical activity in preschool children. Obesity, 16(6), pp.1421–1426.
Wilson, B.N. et al., 2009. Psychometric properties of the revised Developmental Coordination Disorder Questionnaire. Physical & occupational therapy in pediatrics, 29(2), pp.182–202.
Wilson, B.N. et al., 1995. Use of the Bruininks-Oseretsky test of motor proficiency in occupational therapy. The American journal of occupational therapy : official publication of the American Occupational Therapy Association, 49(1), pp.8–17.
Wilson, P.H. & McKenzie, B.E., 1998. Information processing deficits associated with developmental coordination disorder: a meta-analysis of research findings. Journal of child psychology and psychiatry, and allied disciplines, 39(6), pp.829–840.
Wolpert, D.M., Doya, K. & Kawato, M., 2003. A unifying computational framework for motor control and social interaction. Philosophical transactions of the Royal Society of London. Series B, Biological sciences, 358(1431), pp.593–602.
Woods, C., Tannehill, D. & Walsh, J., 2011. The children’s sport participation and physical activity study (CSPPA) - Volunteer Study, Research Report No 2., Dublin.
Wright, H.C. & Sugden, D.A., 1996. The Nature of Developmental Coordination Disorder: Inter- and lntragroup Differences. Adapted Physical Activity Quarterly, (1992), pp.357–371.
Wrotniak, B.H. et al., 2006. The relationship between motor proficiency and physical activity in children. Pediatrics, 118(6), pp.1758–1765.
Wuang, Y.-P. & Su, C.-Y., 2009. Reliability and responsiveness of the Bruininks-Oseretsky Test of Motor Proficiency-Second Edition in children with intellectual disability. Research in developmental disabilities, 30(5), pp.847–855.
Ziviani, J., Poulsen, A. & O’Brien, A., 1982. Correlation of the Bruininks-Oseretsky Test of Motor Proficiency with the Southern California Sensory Integration Tests. The American journal of occupational

105
therapy: official publication of the American Occupational Therapy Association, 36(8), pp.519–523.

106
Chapter 9. APPENDICES

9.1 APPENDIX A:
Bruininks-Oseretsky Test of Motor Proficiency 2nd Edition
(BOT-2) FINE MOTOR TEST KIT
107

108

109

110

111

112

113

114

115

9.2 APPENDIX B:
Bruininks-Oseretsky Test of Motor Proficiency 2nd Edition
(BOT-2) FINE MOTOR RECORD FORM
116

117

118

119

9.3 APPENDIX C:
Pendulum Experimental Set Up
120

121

122

123

9.4 APPENDIX D:
BOT-2 Fine Motor Composite Percentile Rank Conversion
Table
124

125