findings from the 2010 new intelligent enterprise...
TRANSCRIPT

ReseaRch RepoRt
Fall 2010
Analytics: The New Path to ValueHow the Smartest Organizations Are Embedding Analytics to Transform Insights Into ActionBy MIT Sloan Management Review and the IBM Institute for Business Value
Findings From the 2010 new intelligent enterprise global executive study and research project
In collaboration with IBM Institute for Business Value
Copyright (©) Massachusetts Institute of Technology, 2010. All rights reserved.
The six IBM case studies and the chart titled “Introducing the PADIE technique” are © IBM 2010, used by permission.
For more information or permission to reprint, please contact MIT SMR at:E-mail: [email protected]: +1 818-487-4550, attention MIT SMR/PermissionsPhone: 818-487-2064Mail: MIT Sloan Management Review
PO Box 15955 North Hollywood, CA 91615
AuThors
sTEvE LAvALLE
is the global
strategy leader for
IBM’s Business
Analytics and
Optimization
service line,
where he leads a
global team of
consultants and
practitioners
focused on
helping clients
optimize their
results through
the application of
insights, analytics
and business
process improve-
ments. He can
be contacted at
steve.lavalle@us.
ibm.com.
MIChAEL s. hoPkIns
is editor-in-chief
of MIT Sloan
Management
Review, which
brings ideas from
the world of
thinkers to the
executives and
managers who
use them to build
businesses. He
can be reached
at mhopkins@
mit.edu.
ErIC LEssEr
is the research
director and
North American
leader of the IBM
Institute for Busi-
ness Value, where
he oversees the
fact-based
research IBM
undertakes to
develop its
thought leader-
ship. He can
be contacted
at elesser@us.
ibm.com.
rEBECCA shoCkLEy
is the business
analytics and op-
timization global
lead for the IBM
Institute for Busi-
ness Value, where
she conducts fact-
based research to
develop thought
leadership for
senior executives.
She can be
reached at
rshock@us.
ibm.com.
nInA krusChwITz
is an editor and
the special
projects manager
at MIT Sloan
Management
Review, where
she coordinates
the publication’s
editorial and
innovation hub
activities. She
can be reached at
Fred Balboni, GBS Global Leader: Business Analytics and Optimization (BAO), IBM
Dr. Michael Haydock, GBS Global Leader: Customer Analytics, IBM
Deborah Kasdan, Writer: GBS Corporate Communications, IBM
Christine Kinser, Global Leader: GBS Strategic Communications, IBM
Katharyn White, Vice President of Marketing, IBM
ConTrIBuTors
sPonsors

Chapter 1: Findings of The New Intelligent enterprise study 3 The competitive push for analytics-driven management
4 Top performers say analytics is a differentiator
5 Three levels of capabilities have emerged, each with distinct opportunities
6 Data is not the biggest obstacle
6 Information must become easier to understand and act upon CAse: Analytics, not best guesses, drive ad decisions
7 What leaders can do to make analytics pay off — a new methodology
Chapter 2: The Five recommendations 7 recommendation 1: Focus on the biggest and highest value opportunities
CAse: Tackling healthcare fraud leads to sweeping reforms FoCus: Introducing the PADIE technique for operationalizing analytics
9 recommendation 2: within each opportunity, start with questions, not data CAse: Shifting gears from vehicle-centric to customer-centric marketing
10 recommendation 3: embed insights to drive actions and deliver value CAse: A beverage company makes the case
12 recommendation 4: keep existing capabilities while adding new ones CAse: Bridging business and analytics skills across the organization
13 recommendation 5: use an information agenda to plan for the future CAse: Insurer limits risk by establishing an agenda for today and tomorrow FoCus: How analytics propagates across functions
Chapter 3: how to set yourself up for success 15 Techniques to get started
16 Make analytics pay off
Chapter 4: The survey — Questions and responses17 Questionnaire and overall results of the 2010 New Intelligent Enterprise
Global Executive Survey
CoNTeNTs
IBM INSTITUTE FOR BUSINESS VALUE • MIT sLoAN MANAGeMeNT reVIew 1
reseArCh rePorT FALL 2010
2 Executive Summary
17 About the Research
22 Acknowledgments & Related Publications

s p e c i a l R e p o R t a N a l y t i c s : t h e N e w p a t h t o v a l u e
IBM INSTITUTE FOR BUSINESS VALUE • MIT sLoAN MANAGeMeNT reVIew 2
executive summaryAs the well-documented “data deluge” deepens,
many executives have shifted from feeling over-
whelmed (60% say they “have more information
than we can effectively use”) to recognizing that the
smartest organizations are already capitalizing on in-
creased information richness and analytics to gain
competitive advantage.
To understand better how all organizations are at-
tempting to capitalize on information and apply
analytics today and in the future, MIT Sloan Manage-
ment Review in collaboration with the IBM Institute
for Business Value conducted a study that included a
survey of nearly 3,000 executive managers worldwide,
as well as in-depth interviews with leading researchers.
Among the top-line survey findings:Top performers view analytics as a differentiator:
Top-performing companies are three times more
likely than lower performers to be sophisticated users
of analytics, and are two times more likely to say that
their analytics use is a competitive differentiator.
The biggest obstacle is not the data: Despite the
enormous challenge felt by most organizations to “get
the data right,” that’s not what executives name as the
key barrier to achieving the competitive advantage that
“big data” can offer — the top two barriers are “lack of
understanding of how to use analytics to improve the
business” and “lack of management bandwidth.”
Where are the leaders headed? Toward making
information “come alive”: Over the next 24
months, executives say they will focus on supple-
menting standard historical reporting of data with
emerging approaches that convert information into
scenarios and simulations that make insights easier
to understand and to act on.
Based on data from our survey, case studies and inter-
views with experts, we have identified a new,
five-point methodology for successfully implement-
ing analytics-driven management and for rapidly
creating value. This report describes that emerging
methodology and its five critical recommendations.
�Focus on the biggest opportunities first. Attack
one big important problem that can demonstrate
value and catalyze the organization toward action.
�Start with questions, not data. Understand the
problem — and the insights needed to solve it — be-
fore working on the data that will yield the insights.
�Embed insights to drive action. Ensure end-re-
sult impact by making information come to life,
articulating use cases and expressing data-driven
insights in ways that even nonexperts can under-
stand and act upon.
�Keep existing capabilities while adding new ones.
Even as centralized analytics oversight grows, keep
distributed, localized capabilities in place.
�Build the analytics foundation according to an
information agenda. Opportunistic application
of analytics can create value fast, but it must be
part of an enterprise-wide information-and-ana-
lytics plan.

s p e c i a l R e p o R t a N a l y t i c s : t h e N e w p a t h t o v a l u e
IBM INSTITUTE FOR BUSINESS VALUE • MIT sLoAN MANAGeMeNT reVIew 3
The combination of an increasingly complex world, the vast proliferation of data and the pressing
need to stay one step ahead of the competition has sharpened focus on using analytics within orga-
nizations. To understand better how organizations are applying analytics today, prioritizing their
future investments and transforming insights into action, MIT Sloan Management Review in
collaboration with the IBM Institute for Business Value surveyed a global sample of nearly 3,000
executives, managers and analysts. Based on our analysis of survey results, combined with inter-
views with academic and subject matter experts, this study offers recommendations on how
organizations can bolster their analytics capabilities to achieve long-term advantage.
At organizations in every industry, in every part of the world, senior leaders
wonder whether they are getting full value from the massive amounts of
information they already have within their organizations. New technolo-
gies are collecting more data than ever before, yet many organizations are
still looking for better ways to obtain value from their data and compete in
the marketplace. Their questions about how best to achieve value persist.
Are competitors obtaining sharper, more timely insights? Are they able to regain market
advantage neglected while focusing on expenses during the past two years? Are they correctly
interpreting new signals from the global economy — and adequately assessing the impact on
their customers and partners? Knowing what happened and why it happened are no longer
adequate. Organizations need to know what is happening now, what is likely to happen next
and what actions should be taken to get the optimal results.
To help organizations understand the opportunity provided by information and advanced
analytics, MIT Sloan Management Review partnered with the IBM Institute for Business Value
to conduct a survey of nearly 3,000 executives, managers and analysts working across more
than 30 industries and 100 countries (see “About the Research”).
Among our key findings: Top-performing organizations use analytics five times more than
lower performers (see Figure 1). Overall, our survey found widespread belief that analytics of-
fers value. Half of our respondents said that improvement of information and analytics was a top
Analytics: The New Path to ValueHow the smartest organizations are embedding analytics to transform insights into action

4 MIT sLoAN MANAGeMeNT reVIew • IBM INSTITUTE FOR BUSINESS VALUE
s p e c i a l R e p o R t a N a l y t i c s : t h e N e w p a t h t o v a l u e
priority in their organizations. And more than one in
five said they were under intense or significant pres-
sure to adopt advanced information and analytics
approaches.
The source of the pressure is not hard to ascertain.
Six out of 10 respondents cited innovating to achieve
competitive differentiation as a top business challenge.
The same percentage also agreed that their organization
has more data than it can use effectively. Organizational
leaders want analytics to exploit their growing data and
computational power to get smart, and get ahead, in
ways they never could before.
Senior executives now want businesses run on
data-driven decisions. They want scenarios and
simulations that provide immediate guidance on
the best actions to take when disruptions occur —
disruptions ranging from unexpected competitors
or an earthquake in a supply zone to a customer sig-
naling it may switch providers. Executives want to
understand optimal solutions based on complex
business parameters or new information, and they
want to take action quickly.
These expectations can be met — but with a caveat.
For analytics-driven insights to be consumed — that
is, to trigger new actions across the organization —
they must be closely linked to business strategy, easy
for end users to understand and embedded into or-
ganizational processes in order to take action at the
right time. That’s no small task. It requires painstak-
ing focus on the way insights are infused into
everything from manufacturing and new product
development to credit approvals and call center in-
teractions.
Top Performers say Analytics Is a Differentiator
Our study clearly connects performance and the
competitive value of analytics. We asked respon-
dents to assess their organization’s competitive
position. Those who selected “substantially outper-
form industry peers” were identified as top
performers, while those who selected “somewhat or
substantially underperforming industry peers” were
grouped as lower performers.1
We found that organizations that strongly agreed
that the use of business information and analytics dif-
ferentiates them within their industry were twice as
likely to be top performers as lower performers.
Top performers approach business operations
differently from their peers. Specifically, they put
analytics to use in the widest possible range of deci-
sions, large and small. They were twice as likely to
use analytics to guide future strategies and twice as
likely to use insights to guide day-to-day operations
(see Figure 2). They make decisions based on rigor-
ous analysis at more than double the rate of lower
performers. The correlation between performance
FIGure 2Top performing organizations were twice as likely to use analytics to guide day-to-day operations and future strategies as lower performers.
45%
20%
53%
27%
Top Performers
Lower Performers
Use insights to guide future strategies
Use insights to guide day-to-day operations
Percent of respondents whose organizations do these activities well or very well.
Tendencyto ApplyAnalytics
Tendencyto Apply
Intuition
Top PerformersLower Performers
0
Financial management and budgeting
Operations and production
Strategy and business development
Sales and marketing
Customer service
Product research and development
General management
Risk management
Customer experience management
Brand or market management
Work force planning and allocation
Overall Average
1 4 73 6 82 5
22.1
FIGure 1The tendency for top-performing organizations to apply analytics to particular activities across the organiza-tion, as compared to lower performers. A likelihood of 1.0 indicates an equal likelihood that the organizations will use either analytics or intuition.

s p e c i a l R e p o R t a N a l y t i c s : t h e N e w p a t h t o v a l u e
IBM INSTITUTE FOR BUSINESS VALUE • MIT sLoAN MANAGeMeNT reVIew 5
and analytics-driven management has important
implications to organizations whether they are seek-
ing growth, efficiency or competitive differentiation.
Three Levels of Capabilities emerged, each with Distinct opportunities
Organizations that know where they are in terms of
analytics adoption are better prepared to turn chal-
lenges into opportunities. We segmented respondents
based on how they rated their organization’s analytics
prowess, specifically how thoroughly their organiza-
tions had been transformed by better uses of analytics
and information. Three levels of analytics capability
emerged — Aspirational, Experienced and Trans-
formed — each with clear distinctions (see Figure 3).
Aspirational. These organizations are the far-
thest from achieving their desired analytical goals.
Often they are focusing on efficiency or automation
of existing processes, and searching for ways to cut
costs. Aspirational organizations currently have few
of the necessary building blocks — people, pro-
cesses or tools — to collect, understand, incorporate
or act on analytic insights.
Experienced. Having gained some analytic ex-
perience — often through successes with efficiencies
at the Aspirational phase — these organizations are
looking to go beyond cost management. Experi-
enced organizations are developing better ways to
effectively collect, incorporate and act on analytics
so they can begin to optimize their organizations.
Transformed. These organizations have sub-
stantial experience using analytics across a broad
range of functions. They use analytics as a competi-
tive differentiator and are already adept at organizing
people, processes and tools to optimize and differ-
entiate. Transformed organizations are less focused
on cutting costs than Aspirational and Experienced
AsPIrATIoNAL exPerIeNCeD TrANsForMeD
Motive •Use analytics to justify actions •Use analytics to guide actions • Use analytics to prescribe actions
Functional proficiency
•Financial management and budgeting•Operations and production•Sales and marketing
•All Aspirational functions•Strategy / business development•Customer service•Product research / development
• All Aspirational and Experienced functions
•Risk management•Customer experience•Work force planning / allocation•General management•Brand and market management
Business challenges
• Competitive differentiation through innovation
•Cost efficiency (primary)•Revenue growth (secondary)
• Competitive differentiation through innovation
•Revenue growth (primary)•Cost efficiency (secondary)
• Competitive differentiation through innovation
•Revenue growth (primary)• Profitability acquiring / retaining customers (targeted focus)
key obstacles
• Lack of understanding how to leverage analytics for business value
•Executive sponsorship• Culture does not encourage sharing information
• Lack of understanding how to leverage analytics for business value
•Skills within line of business• Ownership of data is unclear or governance is ineffective
• Lack of understanding how to leverage analytics for business value
• Management bandwidth due to competing priorities
•Accessibility of the data
Data management
• Limited ability to capture, aggregate, analyze or share information and insights
• Moderate ability to capture, aggregate and analyze data
• Limited ability to share information and insights
• Strong ability to capture, aggregate and analyze data
• Effective at sharing information and insights
Analytics in action
• Rarely use rigorous approaches to make decisions
• Limited use of insights to guide future strategies or guide day-to-day operations
• Some use of rigorous approaches to make decisions
• Growing use of insights to guide future strategies, but still limited use of insights to guide day-to-day operations
• Most use rigorous approaches to make decisions
• Almost all use insights to guide future strategies, and most use insights to guide day-to-day operations
FIGure 3Three capability lev-els — Aspirational, experienced, and Transformed — were based on how respondents rated their organization’s analytic prowess.

6 MIT sLoAN MANAGeMeNT reVIew • IBM INSTITUTE FOR BUSINESS VALUE
s p e c i a l R e p o R t a N a l y t i c s : t h e N e w p a t h t o v a l u e
organizations, possibly having already automated
their operations through effective use of insights.
They are most focused on driving customer profit-
ability and making targeted investments in niche
analytics as they keep pushing the organizational
envelope.
Transformed organizations were three times more
likely than Aspirational organizations to indicate
they substantially outperform their industry peers.
This performance advantage illustrates the potential
rewards of higher levels of analytics adoption.
While our findings showed that organizations tend
to wait until they have gained some experience before
they apply analytics to growth objectives, this may be
more a common practice than a “best practice.” Our
experience indicates that analytics, applied wisely to
an organization’s operational capabilities, can be used
to accelerate a broad range of business objectives, even
at the earliest stages of analytics adoption.
Data Is Not the Biggest obstacle
Despite popular opinion, getting the data right is not a
top challenge organizations face when adopting analyt-
ics. Only about one out of five respondents in our survey
cited concern with data quality or ineffective data gover-
nance as a primary obstacle (see Figure 4).
The adoption barriers organizations face most are
related to management and culture rather than being
related to data and technology. The leading obstacle to
widespread analytics adoption is lack of understanding
of how to use analytics to improve the business, according
to almost four of 10 respondents. More than one in three
cite lack of management bandwidth due to competing
priorities. Organizations that use analytics to tackle their
biggest challenges are able to overcome seemingly in-
tractable cultural challenges and, at the same time, refine
their data and governance approaches.
Information Must Become easier to understand and Act upon
Executives want better ways to communicate com-
plex insights so they can quickly absorb the meaning
of the data and take action on it. Over the next two
years, executives say they will focus on supplement-
ing standard historical reporting with emerging
approaches that make information come alive. These
include data visualization and process simulation, as
well as text and voice analytics, social media analysis,
and other predictive and prescriptive techniques.
New tools like these can make insights easier to
understand and to act on at every point in the orga-
nization, and at every skill level. They transform
numbers into information and insights that can be
readily put to use instead of relying on further inter-
pretation or leaving them to languish due to
uncertainty about how to act.
executives have long been accustomed to a degree of im-precision and uncertainty when making decisions critical to their growth — and survival. For some companies, like con-sumer electronics retailer Best Buy, their “best guess” was no longer good enough; hard facts were needed.
In an industry where the optimal allocation of advertis-ing dollars is top of mind, and
in a time when new digital media outlets are emerging al-most daily, Best Buy decided to augment its traditional ad-vertising-mix assessment with a new analytical approach — exploiting widely sourced customer data and new mod-els for predicting behavior.
The answers Best Buy dis-covered were surprising. The one medium that everyone knew was waning — televi-
sion — turned out to be an important one for its target customers. As a result, the company ended up shifting its investment from newspaper inserts to television — a deci-sion that paid off handsomely.
executives at Best Buy acted on new insights that defied their initial expectations. “we already have 80 to 90 percent of what we need to know about a cus-tomer somewhere in the
system,” Bill hoffman, senior vice president for customer in-sight, told us. It was important, however, to get analytics-driven insights out to where they were needed. “The power plants were up, but the lines were down.”
No longer. Adopting an an-alytic approach to decisions, Best Buy exemplifies the new data-driven management practices emerging in leading organizations.
IBM CAse sTuDy: Analytics, Not Best Guess, Drive Ad Decisions

s p e c i a l R e p o R t a N a l y t i c s : t h e N e w p a t h t o v a l u e
IBM INSTITUTE FOR BUSINESS VALUE • MIT sLoAN MANAGeMeNT reVIew 7
what Leaders Can Do to Make Analytics Pay off — A New Methodology
It takes big plans followed by discrete actions to gain the
benefits of analytics. But it also takes some very specific
management approaches. Based on data from our sur-
vey, our engagement experience, case studies and
interviews with experts, we have been able to identify a
new, five-point methodology for successfully imple-
menting analytics-driven management and for rapidly
creating value. The recommendations in the following
pages are designed to help organizations understand
this “new path to value” and how to travel it. While each
recommendation presents different pieces of the infor-
mation-and-analytics value puzzle, each one meets all
of these three critical management needs:
Reduced time to value. Value creation can be
achieved early in an organization’s progress to analyt-
ics sophistication. Contrary to common assumptions,
it doesn’t require the presence of perfect data or a full-
scale transformation to be complete.
Increased likelihood of transformation that’s
both significant and enduring. The emerging meth-
odology we’ve identified enables and inspires lasting
change (strategic and cultural) by tactically overcom-
ing the most significant organizational impediments.
Greater focus on achievable steps. The approach
being used by the smartest companies is powerful in
part because each step enables leaders to focus their ef-
forts and resources narrowly, rather than implementing
universal changes. This makes every step easier to ac-
complish with an attractive return on investment.
Whether pursuing the best channel strategy, the best
customer experience, the best portfolio or the best process
innovation, organizations embracing this approach will
be first in line to gain business advantage from analytics.
recommendation 1 Focus on the Biggest and highest Value opportunities
Does attacking the biggest challenge carry
the biggest risk of failure? Paradoxically,
no — because big problems command
attention and incite action. And as survey
participants told us, management bandwidth is a top
obstacle. When the stakes are high, the best talent will
leap at the opportunity to get involved.
It’s extraordinarily hard for people to change from
making decisions based on personal experience to
making them from data — especially when that data
counters the prevailing common wisdom. But upset-
ting the status quo is much easier when everyone can
see how it could contribute to a major goal. With a
potential big reward in sight, a significant effort is
easier to justify, and people across functions and lev-
els are better able to support it.
A sharp focus on major opportunities can excite
an organization with new possibilities. “Where are
the best places to advertise to get consumers into our
store?” was the looming, time-critical challenge for
Best Buy. “How can we reduce the fraud and abuse
that are draining scarce money and resources?” is a
common refrain among government agencies around
the globe.
Conversely, don’t start doing analytics without
strategic business direction, as these efforts are likely
to stall. Not only does it waste resources, it risks cre-
ating widespread skepticism about the real value of
analytics.
In our discussions with business executives, we
have repeatedly heard that analytics aligned to a sig-
FIGure 4The adoption barriers organiza-tions face most are managerial and cultural rather than related to data and technology.
Percentage of respondents
0
Lack of understanding of how to use analytics to improve the business
Lack of management bandwidth due to competing priorities
Lack of skills internally in the line of business
Ability to get the data
Existing culture does not encourage sharing information
Ownership of data is unclear or governance is ineffective
Lack of executive sponsorship
Concerns with the data
Perceived costs outweigh projected benefits
No case for change
Don't know where to start
10% 20% 30% 40%
Respondents were asked to select three obstacles to the widespread adoption of analytics in their organization.
8 MIT sLoAN MANAGeMeNT reVIew • IBM INSTITUTE FOR BUSINESS VALUE
s p e c i a l R e p o R t a N a l y t i c s : t h e N e w p a t h t o v a l u e
nificant organizational challenge makes it easier to
overcome a wide range of obstacles. Respondents
cited many challenges, and none can be discounted
or minimized: Executive sponsorship of analytics
projects, data quality and access, governance, skills
and culture all matter and need to be addressed in
time. But when overtaken by the momentum of a
single big idea and potentially game-changing in-
sight, obstacles like these get swept into the wake of
change rather than drowning the effort.
A process for inspiring change Despite analytics
opportunities that are as close as the nearest data
warehouse, the inability to understand how analytics
can solve business challenges is the most daunting ob-
stacle to adoption. And with management attention
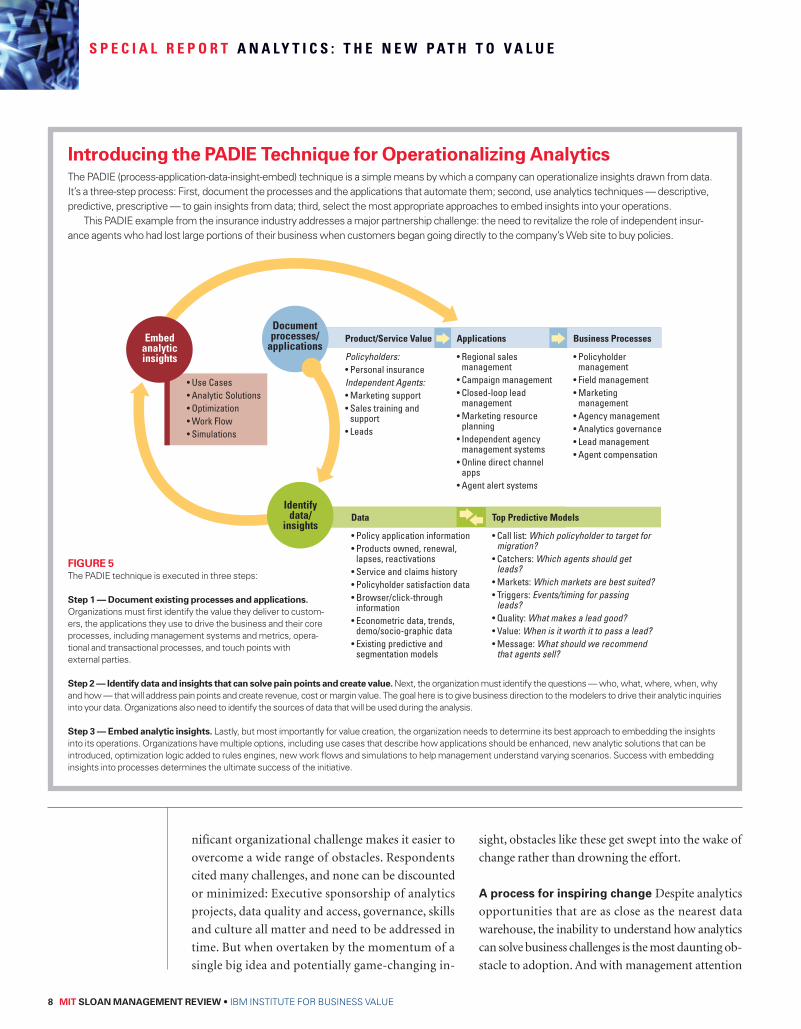
Introducing the PADIe Technique for operationalizing AnalyticsThe PADIE (process-application-data-insight-embed) technique is a simple means by which a company can operationalize insights drawn from data. It’s a three-step process: First, document the processes and the applications that automate them; second, use analytics techniques — descriptive, predictive, prescriptive — to gain insights from data; third, select the most appropriate approaches to embed insights into your operations.
This PADIE example from the insurance industry addresses a major partnership challenge: the need to revitalize the role of independent insur-ance agents who had lost large portions of their business when customers began going directly to the company’s Web site to buy policies.
Product/Service Value
Policyholders:• Personal insurance Independent Agents:• Marketing support• Sales training and
support• Leads
Applications
• Regional sales management
• Campaign management• Closed-loop lead
management• Marketing resource
planning• Independent agency
management systems• Online direct channel
apps• Agent alert systems
Data
• Policy application information• Products owned, renewal,
lapses, reactivations• Service and claims history• Policyholder satisfaction data• Browser/click-through
information• Econometric data, trends,
demo/socio-graphic data• Existing predictive and
segmentation models
Top Predictive Models
• Call list: Which policyholder to target for migration?
• Catchers: Which agents should get leads?
• Markets: Which markets are best suited?• Triggers: Events/timing for passing
leads?• Quality: What makes a lead good? • Value: When is it worth it to pass a lead? • Message: What should we recommend
that agents sell?
Business Processes
• Policyholder management
• Field management• Marketing
management • Agency management• Analytics governance• Lead management• Agent compensation
Document processes/
applications
Identify data/
insights
Embed analytic insights
• Use Cases • Analytic Solutions • Optimization • Work Flow • Simulations
FIGure 5The PADIE technique is executed in three steps:
step 1 — Document existing processes and applications. Organizations must first identify the value they deliver to custom-ers, the applications they use to drive the business and their core processes, including management systems and metrics, opera-tional and transactional processes, and touch points with external parties.
step 2 — Identify data and insights that can solve pain points and create value. Next, the organization must identify the questions — who, what, where, when, why and how — that will address pain points and create revenue, cost or margin value. The goal here is to give business direction to the modelers to drive their analytic inquiries into your data. Organizations also need to identify the sources of data that will be used during the analysis.
step 3 — embed analytic insights. Lastly, but most importantly for value creation, the organization needs to determine its best approach to embedding the insights into its operations. Organizations have multiple options, including use cases that describe how applications should be enhanced, new analytic solutions that can be introduced, optimization logic added to rules engines, new work flows and simulations to help management understand varying scenarios. Success with embedding insights into processes determines the ultimate success of the initiative.

s p e c i a l R e p o R t a N a l y t i c s : t h e N e w p a t h t o v a l u e
IBM INSTITUTE FOR BUSINESS VALUE • MIT sLoAN MANAGeMeNT reVIew 9
focused on other priorities, valuable analytics oppor-
tunities can be crowded out by business as usual.
The single greatest opportunity — and chal-
lenge — to speed adoption of analytics is to embed
them into daily operations. Organizations that use
analytics to answer big, make-it-or-break-it challenges
have the greatest opportunity to meet their business
goals. The answer needs to be simple and unambigu-
ous to work for time-pressed managers. Based on our
analysis, we recommend the process-application-data-
insight-embed technique (see Figure 5). It is a simple
means by which an organization can operationalize
insights drawn from data.
The PADIE technique helps users across the or-
ganization understand from the start the full
initiative as it applies to a specific business chal-
lenge. This technique enables business and analytic
teams to work together to create analytic models
based on use cases that show analytics in action.
recommendation 2 within each opportunity, start with Questions, Not Data
Traditionally, organizations are tempted to
start by gathering all available data before
beginning their analysis. Too often, this
leads to an all-encompassing focus on data
management — collecting, cleansing and converting
data — that leaves little time, energy or resources to
understand its potential uses. Actions they do take, if
any, might not be the most valuable ones (see Figure
6). Instead, organizations should implement analytics
by first defining the insights and questions needed to
meet the big business objective and then identify those
pieces of data needed for answers.
By defining the desired insights first, organizations
can target specific subject areas, and use readily avail-
able data in the initial analytic models. The insights
delivered through these initial models will illuminate
gaps in the data infrastructure and business processes.
Time that would have been spent cleaning up all data
can be redirected toward targeted data needs and spe-
cific process improvements identified by the insights,
enabling iterations with increasing levels of value.
Companies that make data their overriding pri-
ority often lose momentum long before the first
insight is delivered. By narrowing the scope of these
tasks to the specific subject areas needed to answer
key questions, value can be realized more quickly,
while the insights are still relevant.
Organizations that start with the data or process
change first often end up with unintended conse-
quences — such as data that is not extensible or
processes that are ultimately eliminated — that re-
quire rework and additional resources to solve.
speeding insights into business operations Compared with other respondents, Transformed or-
ganizations are good at data capture (see Figure 7).
IBM CAse sTuDy: Tackling health Care Fraud Leads to sweeping reforms with healthcare costs spiraling, the North Carolina Department of health and human services resolved to curb suspected fraud and abuse. After an analytics pilot of the state’s Medicaid records revealed numerous anomalies, the state moved quickly to deploy an advanced mathematical model to detect Medicaid problems within its system of two million users.2 A new “Medicaid swAT team” of special investigators is beginning to review cases flagged as suspi-cious by the analytic models.3
Legislative budget officials estimated that the state could recoup $37 million in the program’s first year, which easily offset its initial investment several times over. while most of the money would be reimbursed to Medicaid, the penalties would add needed dollars to North Carolina public schools.4
The state is now mobilizing resources to pursue the unexpectedly large volume of fraud and abuse cases uncovered. Prompted by the results, the gov-ernor announced plans for a full suite of anti-fraud moves, including tougher laws, a public awareness campaign to encourage people to report fraud and abuse, and funding to increase the state’s staff of investigators.5
FIGure 6organizations should start by pinpointing the insights to be leveraged, then use readily available data to test the analytic models. Actions based on those insights will help define the next set of insights and data needed. The traditional approach of starting with a comprehensive data program creates too much lag time before insights can be put into action.
Actions
Traditional FlowRecommended Flow
Data
Insights
10 MIT sLoAN MANAGeMeNT reVIew • IBM INSTITUTE FOR BUSINESS VALUE
s p e c i a l R e p o R t a N a l y t i c s : t h e N e w p a t h t o v a l u e
Additionally, Transformed organizations are much
more adept at data management. In these areas, they
outpaced Aspirational organizations up to 10-fold
in their ability to execute.
Enterprise processes have many points where
analytic insights can boost business value. The op-
erational challenge is to understand where to apply
those insights in a particular industry and organiza-
tion. When a bank customer stops automatic payroll
deposits or remittance transfers, for example, who
in the organization should be alerted and tasked
with finding out whether the customer is changing
jobs or planning to switch banks? Where customer
satisfaction is low, what insights are needed and how
should they be delivered to prevent defections?
To keep the three gears moving together — data,
insights and timely actions — the overriding busi-
ness purpose must always be in view. That way, as
models, processes and data are tested, priorities for
the next investigation become clear. Data and models
get accepted, rejected or improved based on business
need. New analytic insights — descriptive, predictive
and prescriptive — are embedded into increasing
numbers of applications and processes, and a virtu-
ous cycle of feedback and improvement takes hold.
recommendation 3 embed Insights to Drive Actions and Deliver Value
New methods and tools to embed informa-
tion into business processes — use cases,
analytics solutions, optimization, work
flows and simulations — are making in-
sights more understandable and actionable.
Respondents identified trend analysis, forecasting and
standardized reporting as the most important tools they
use today. However, they also identified tools that will
have greater value in 24 months. The downswings in
“as-is” methods accompanied by corresponding up-
swings in “to-be” methods were dramatic (see Figure 8).
Today’s staples are expected to be surpassed in
the next 24 months by:
1. Data visualization, such as dashboards and
scorecards
2. Simulations and scenario development
3. Analytics applied within business processes
4. Advanced statistical techniques, such as regres-
sion analysis, discrete choice modeling and
mathematical optimization.
Organizations expect the value from these emerg-
ing techniques to soar, making it possible for
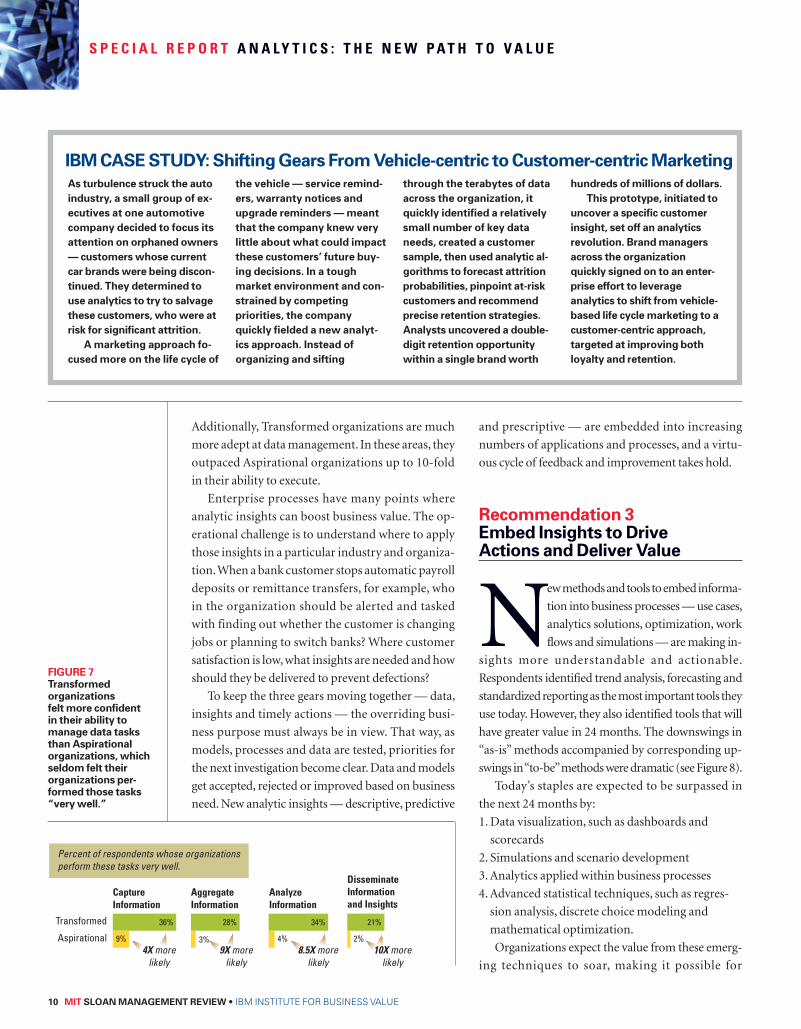
FIGure 7Transformed organizations felt more confident in their ability to manage data tasks than Aspirational organizations, which seldom felt their organizations per-formed those tasks “very well.”
Capture Information
AggregateInformation
AnalyzeInformation
DisseminateInformation and Insights
Percent of respondents whose organizations perform these tasks very well.
36%
9%
28%
3%
34%
4%
21%
2%
Transformed
Aspirational4X more
likely9X more
likely8.5X more
likely10X more
likely
As turbulence struck the auto industry, a small group of ex-ecutives at one automotive company decided to focus its attention on orphaned owners — customers whose current car brands were being discon-tinued. They determined to use analytics to try to salvage these customers, who were at risk for significant attrition.
A marketing approach fo-cused more on the life cycle of
the vehicle — service remind-ers, warranty notices and upgrade reminders — meant that the company knew very little about what could impact these customers’ future buy-ing decisions. In a tough market environment and con-strained by competing priorities, the company quickly fielded a new analyt-ics approach. Instead of organizing and sifting
through the terabytes of data across the organization, it quickly identified a relatively small number of key data needs, created a customer sample, then used analytic al-gorithms to forecast attrition probabilities, pinpoint at-risk customers and recommend precise retention strategies. Analysts uncovered a double-digit retention opportunity within a single brand worth
hundreds of millions of dollars.This prototype, initiated to
uncover a specific customer insight, set off an analytics revolution. Brand managers across the organization quickly signed on to an enter-prise effort to leverage analytics to shift from vehicle-based life cycle marketing to a customer-centric approach, targeted at improving both loyalty and retention.
IBM CAse sTuDy: shifting Gears From Vehicle-centric to Customer-centric Marketing

s p e c i a l R e p o R t a N a l y t i c s : t h e N e w p a t h t o v a l u e
IBM INSTITUTE FOR BUSINESS VALUE • MIT sLoAN MANAGeMeNT reVIew 11
data-driven insights to be used at all levels of the orga-
nization. Innovative uses of this type of information
layering will continue to grow as a means to help indi-
viduals across the organization consume and act upon
insights derived through complex analytics that
would otherwise be hard to piece together. For exam-
ple, GPS-enabled navigation devices can superimpose
real-time traffic patterns and alerts onto navigation
maps and suggest the best routes to drivers.
Similarly, in oil exploration, three-dimensional
renderings combine data from sensors in the field
with collaborative and analytical resources accessi-
ble across the enterprise. Production engineers can
incorporate geological, production and pipeline in-
formation into their drilling decisions.
Beyond 3D, animated maps and charts can simu-
late critical changes in distribution flow, or projected
changes in consumption and resource availability. In
the emerging area of analytics for unstructured data,
patterns can be visualized through verbal maps that
pictorially represent word frequency, allowing mar-
keters to see how their brands are perceived.
New techniques and approaches transform in-sights into actions New techniques to embed
insights will gain in value by generating results that
can be readily understood and acted upon:
�Dashboards that now reflect actual last quarter
sales will also show what sales could be next quar-
ter under a variety of different conditions — a
new media mix, a price change, a larger sales team,
even a major weather or sporting event.
�Simulations evaluating alternative scenarios will au-
tomatically recommend optimal approaches — such
After fast growth through ac-quisitions and mergers, executives in a global bever-age company were hampered by a complex array of data sets that limited their ability to make timely and fact-based decisions. solving this prob-lem required a standardized platform that would enable a global view of information while supporting their rules-driven, exception-based
process for making decisions. But executives knew that
they needed more than just the facts; they needed to model scenarios to understand the impact of prospective deci-sions. The organization settled on a global key performance in-dicator dashboard to help users visualize relevant data and model decisions, based on key dimensions like geography, unit, brand, profitability, costs
or channel. But first, to attain funding for the new platform and drive adoption, the dash-board needed wide support within the executive ranks.
To make the business case for the new approach, organiza-tion executives threw out the customary spreadsheets and in-stead gave executives an interactive prototype that mim-icked the visual displays and functionality of the proposed
dashboard. The prototype de-picted the key elements of the business case, including busi-ness value and technology requirements. But, most impor-tantly, it gave executives a taste for the proposed user experi-ence. executives then rallied to support the new interactive dashboard, which when imple-mented became a strategic part of how decisions were modeled and made in the company.
IBM CAse sTuDy: A Beverage Company Makes the Case
FIGure 8organizations expect that the ability to visualize data differently will be the most valuable technique in two years. other techniques and activities that are currently delivering the most value today will still be done, but will be of less value.
Today In 24 Months
Respondents were asked to identify the top three analytic techniques creating value for the organization, and predict which three would be creating the most value in 24 months.
Historic trend analysis and forecasting
Standardized reporting
Data visualization
Analytics applied within business processes
Simulations and scenario development
Clustering and segmentation
Regression analysis, discrete choice modeling and
mathematical optimization
Historic trend analysisand forecasting
Standardized reporting
Data visualization
Analytics applied withinbusiness processes
Simulations andscenario development
Clustering andsegmentation
Regression analysis, discrete choice modeling andmathematical optimization

12 MIT sLoAN MANAGeMeNT reVIew • IBM INSTITUTE FOR BUSINESS VALUE
s p e c i a l R e p o R t a N a l y t i c s : t h e N e w p a t h t o v a l u e
as which is the best media mix to introduce a specific
product to a particular segment, or what is the ideal
number of sales professionals to assign to a particu-
lar new territory.
�Use cases will illustrate how to embed insights
into business applications and processes. For the
direct-channel to agent-channel migration illus-
trated in Figure 5, automated work flows include
initial communication with prospective insur-
ance policyholders, timed to take place before
leads are sent to the agent. In that way, permission
is secured before the agent makes a call, helping to
ensure a smooth channel transition and a supe-
rior customer experience.
New methods will also make it possible for deci-
sion makers more fully to see their customers’
purchases, payments and interactions. Businesses
will be able to listen to customers’ unique wants and
needs about channel and product preferences. In
fact, making customers, as well as information, come
to life within complex organizational systems may
well become the biggest benefit of making data-
driven insights real to those who need to use them.
recommendation 4 keep existing Capabilities while Adding New ones
When executives first realize their
need for analytics, they tend to
turn to those closest to them for
answers. Over time, these point-
of-need resources come together in local line of
business units to enable sharing of insights. Ulti-
mately, centralized units emerge to bring a shared
enterprise perspective — governance, tools, meth-
ods — and specialized expertise. As executives use
analytics more frequently to inform day-to day deci-
sions and actions, this increasing demand for insights
keeps resources at each level engaged, expanding
analytic capabilities even as activities are shifted for
efficiencies (see Figure 9).
Sophisticated modeling and visualization tools,
as we have noted, will soon provide greater business
value than ever before. But that does not mean that
spreadsheets and charts should go away. On the
contrary: New tools should supplement earlier ones,
or continue to be used side by side, as needed.
There are other ways that capabilities grow and
deepen within an organization. Disciplines like fi-
nance and supply chain are inherently data intensive,
and are often where analytics first take root. En-
couraged by early successes, organizations begin
expanding analytic decision making to more disci-
plines. (See “How Analytics Propagates Across
Functions.”) In Transformed organizations, reus-
ability creates a snowball effect as models from one
function are repurposed into another with minimal
modifications.
Over time, data-driven decision making branches
out across the organization. As experience and usage
grow, the value of analytics increases, which enables
business benefits to accrue more quickly.
Add value with an enterprise analytics unit Or-
ganizations that first experience the value of
analytics in discrete business units or functions are
IBM CAse sTuDy: Bridging Business and Analytics skills Across the organization As is often the case, analytics success raises the bar to do more. As de-mand for useful insights has grown, a leading big-box retailer developed a sophisticated analytics environment, in which each layer — enterprise, business unit and point of need — complements rather than duplicates the specialized skills each location delivers.
Determined to leverage the structures already in place, but push them to the next level, the retailer set out to strengthen both the analytics and business skills of its practitioners. Already, analysts were working within the lines of business, knowledgeable enough to supply timely answers to ad hoc queries raised by business executives. An enterprise-wide unit also provided complex computational skills as needed, created common data definitions and crafted analytics approaches that could be duplicated across the business units.
The central unit housed the advanced analytics skills, but it was the analysts in the business units who had the advanced business knowledge and a deep understanding of the operations, objectives and economic le-vers required to run the business. still lacking was the ability to bridge these two domains.
Business unit analysts now rotate into the enterprise unit, partnering with high-tech analysts to provide the business knowledge that fuels new analytics models and working collaboratively to analyze and interpret re-sults that will be meaningful to business. At the end of the rotation, business unit analysts return with a standardized tool kit to create consis-tency and rigor in analysis and facilitate sharing.

S p e c i a l R e p o R t a N a l y t i c S : t h e N e w p a t h t o v a l u e
IBM INSTITUTE FOR BUSINESS VALUE • MIT SLOAN MANAGEMENT REVIEW 13
likely soon to seek a wider range of capabilities —
and more advanced use of existing ones. A
centralized analytics unit, often called either a “cen-
ter of excellence” or “center of competency,” makes
it possible to share analytic resources efficiently and
effectively. It does not, however, replace distributed
and localized capabilities; rather, the central unit is
additive, built upon existing capabilities that may
have already developed in functions, departments
and lines of business.
We found that 63 percent more Transformed or-
ganizations than Aspirational organizations use a
centralized enterprise unit as the primary source of
analytics. A centralized analytics unit can provide a
home for more advanced skills to come together
within the organization, providing both advanced
models and enterprise governance by establishing
priorities and standards by:
�Advancing standard methods for identifying
business problems to be solved with analytics
�Facilitating identification of analytic business
needs while driving rigor into methods for em-
bedding insights into end-to-end processes
�Promoting enterprise-level governance on priori-
tization, master data sources and reuse to capture
enterprise efficiencies
�Standardizing tools and analytic platforms to en-
able resource sharing, streamline maintenance
and reduce licensing expenses.
In three distinct areas — application of analytic
tools, functional use of analytics and location of
skills — we found that adding capabilities without
detracting from existing ones offers a fast path to
full benefits from analytics-driven management.
Recommendation 5 Use an Information Agenda to Plan for the Future
Big data is getting bigger. Information is
coming from instrumented, intercon-
nected supply chains transmitting
real-time data about fluctuations in ev-
erything from market demand to the weather.
Additionally, strategic information has started ar-
riving through unstructured digital channels: social
media, smart phone applications and an ever-in-
creasing stream of emerging Internet-based
gadgets. It’s no wonder six out of 10 respondents
said the organization has more data than it knows
how to use effectively.
All this data must be molded into an informa-
tion foundation that is integrated, consistent and
trustworthy, which were the leading data priorities
cited by our respondents (see Figure 10). Every
phase of implementation needs to align the data
foundation to an overall information agenda. The
information agenda accelerates the organization’s
ability to share and deliver trusted information
across all applications and processes. It sets up in-
formation to serve as a strategic asset for the
organization.
The information agenda identifies foundational
information practices and tools while aligning IT
and business goals through enterprise information
plans and financially justified deployment road
maps. This agenda helps establish necessary links
between those who drive the priorities of the orga-
nization by line of business and set the strategy, and
those who manage data and information.
A comprehensive agenda also enables analytics
to keep pace with changing business goals. An ex-
ecutive at one company, for example, told us it
had it down to a science when it came to under-
standing the impact of price changes on single
products and single channels. But the company
0%
20%
40%
60%
80%
100%
Where analytics performed
Centralized analytic units
At point of need
Line of business analytic units
IT department
Aspirational Experienced Transformed
Percent using analytics frequently
FIGURE 9The frequency with which analytics is used to support decisions increases as organizations transition from one level of analytic capability to the next. At the same time, analytics mi-grate toward more centralized units, first at the local line of business level and then at the enter-prise level, while the portion of analytics performed at points-of-need and with IT remain stable.

14 MIT sLoAN MANAGeMeNT reVIew • IBM INSTITUTE FOR BUSINESS VALUE
s p e c i a l R e p o R t a N a l y t i c s : t h e N e w p a t h t o v a l u e
was blindsided when it shifted to a customer-cen-
tric strategy, restructuring around bundled
products and dynamic pricing across channels.
Because its data marts had been developed de facto
over time, the company found itself struggling to
understand which tools and information were
needed to go forward.
Lastly, building the analytic foundation under
the guidance of a forward-looking information
agenda enables organizations to keep pace with ad-
vances in mathematical sciences and technology.
Without an enterprise-wide information agenda,
units are likely to explore these new developments
independently and adopt them inconsistently, a dif-
ficult path for gaining full business benefits from
analytics.
outline for an information agenda The informa-
tion agenda provides a vision and high-level road
map for information that aligns business needs to
growth in analytics sophistication with the underly-
ing technology and processes spanning:
�Information governance policies and tool kits —
from little oversight to fully implemented policies
and practices
�Data architecture — from ad hoc to optimal
physical and logical views of structured and un-
structured information and databases
�Data currency — from only historical data to a
real-time view of all information
�Data management, integration and middleware —
from subject area data and content in silos to
enterprise information that is fully embedded
into business processes with master content and
master data management
�Analytical tool kits based upon user needs —
from basic search, query and reporting to
advanced analytics and visualization.
The information agenda is a key enabler of ana-
lytic initiatives by providing the right information
and tools at the right times based upon business-
driven priorities.
FIGure 10organizations want data that is integrated, consistent and trustworthy, which were the leading data priorities cited by our respondents.
under pressure from increas-ing competition, a financial firm recognized that growth — and survival — depended upon gaining a better understand-ing of its business quickly. For this, it needed an analytic foundation for strategic sub-ject areas — first finance, then operations, then customers.
The firm completed a series of tightly scoped projects to in-crease analytic capabilities over
time, with each wave realizing value to help fund the next. Business needs determined the order in which enterprise data would be reported to the ana-lytic warehouse. To speed the efforts and time to value, busi-ness users assessed precisely which data elements were needed most. Common data definitions were negotiated to create a language across prod-uct lines and business units.
The organization took a phased approach to building its data environment. For fi-nance and operations, this meant selecting data that supported an enterprise-wide set of kPIs. All other data was put on hold. To decide which customer data was most im-portant, the organization determined which questions they most needed to answer, first by business unit and
then across the enterprise — to find those with the greatest organizational over-lap. Again, all other data would have to wait.
In this way, the organiza-tion was able to fast-track development of a robust data warehouse. As early projects produced a return on their in-vestments and more resources became available, the data warehouse could grow.
IBM CAse sTuDy: Insurer Limits risk by establishing an Agenda for Today and Tomorrow
Percentage of respondents
0
Integration
Consistency/Standardization
Trustworthiness
Simplification
Timeliness
Protection
Cost efficiency
Granularity
Breadth
Access
10% 20% 30% 50%40%
Respondents were asked to select their top three highest data priorities for their organization.

s p e c i a l R e p o R t a N a l y t i c s : t h e N e w p a t h t o v a l u e
IBM INSTITUTE FOR BUSINESS VALUE • MIT sLoAN MANAGeMeNT reVIew 15
set yourself up for success
Aware that analytics-driven opportuni-
ties are central to growth and success,
organizations seek to capture the value.
They want to find the best place to
begin, but for many, that entry point is elusive.
If you are Aspirational: Assemble the best peo-
ple and resources to make the case for investments
in analytics. To get sponsorship for initial projects,
identify the big business challenges that can be ad-
dressed by analytics and find the data you have that
fits the challenge.
If you are Experienced: Make the move to enter-
prise analytics and manage it by keeping focus on
the big issues that everyone recognizes. Collaborate
to drive enterprise opportunities without compro-
mising departmental needs while preventing
governance from becoming an objective unto itself.
If you are Transformed: Discover and champion
improvements in how you are using analytics.
You’ve accomplished a lot already with analytics,
but are feeling increased pressure to do more. Focus
your analytics and management bandwidth to go
deeper rather than broader, but recognize it will be
critical to continue to demonstrate new ways of how
analytics can move the business toward its goals.
Techniques to Get started
Pick your spots. Search for your organization’s big-
gest and highest priority challenge, and create a
PADIE diagram to describe it. Show available data
sources, models to be built, and processes and ap-
plications where analytics will have an impact.
how Analytics Propagates Across FunctionsTypically, organizations begin with efficiency goals, then ad-dress growth objectives, and lastly, design finely tuned approaches to the most complex business challenges. As this occurs, adoption both spreads and deepens. This con-tributes to a predictable pattern of analytics adoption by function (see Figure 11). Specifically, we found the following:
Aspirational. About one-half used analytics for financial management, about one-third each for operations, and sales and marketing. These selections reflect the traditional path of adopting analytics in inherently data-intensive areas.
experienced. Analytics used for all of the above, and at greater levels. For example, the proportion of respondents likely to use it for finance increased from one-half to two-thirds. New functions, such as strategy, product research and customer service, emerged. Growth and efficiency were both met with analytics approaches.
Transformed. Analytics was used for all the same functions as above — and more, as the branching pattern spread within organizations. Fine-grained revenue and effi-ciency usage of analytics emerged, such as customer experience, to build on customer service and marketing capabilities.
These patterns suggest that success in one area stimulates adoption where analytics had not previously been considered or attempted. That is, in fact, how organizations increase their level of sophistication. Successful initiatives in supply chain functions, for example, encourage the human resources function to institute a pilot for data-driven work force planning and allocation.
While these findings describe the typical path, they are not necessarily the best or only one. Analytic leaders may want to advance their organization’s capabilities more quickly using nontradi-tional routes.
34%
45%
54%
54%
57%
67%
43%
55%
55%
56%
59%
61%
63%
63%
72%
69%
70%
80%
35%
49%
Percent who stated their organization performs these functional analytics “well” and “very well.”
Aspirational Experienced Transformed
Brand and market management
General management
Work force planning and allocation
Customer experience
Risk management
Product research and development
Customer service
Strategy and business development
Sales and marketing
Operations and production
Financial management
FIGure 11Analytic adoption spreads through organizations in a predictable pattern, as all respondents gained proficiency with functional analyt-ics in the same order. The rate of adoption, as shown through profi-ciency, increases steadily and threshold levels support the ana-lytic capability tiers.

16 MIT sLoAN MANAGeMeNT reVIew • IBM INSTITUTE FOR BUSINESS VALUE
s p e c i a l R e p o R t a N a l y t i c s : t h e N e w p a t h t o v a l u e
Create multiple diagrams if you’re selecting from a
strong list of possible initiatives. Keep in mind that
your biggest problems, such as customer retention,
anti-fraud efforts or advertising mix, are also your
biggest opportunities. Change is hard for most, so
select an initiative worthy of sustained focus that
can make the biggest difference in meeting your
most important business goals. Remember that
focus is critical during these initial efforts. Do not
get distracted once the targeted area is identified.
Prove the value. With your PADIE diagram in
hand, use reason and benchmarks for initial execu-
tive sponsorship, but use a proof-of-value pilot to
keep sponsors engaged. Estimate how much revenue
can be gained, how much money can be saved and
how much margins can be improved. Employ tech-
niques to embed analytics to illustrate and prioritize
the types of organizational changes that are needed
to achieve the value. Pull it all together using an im-
plementation road map with a clear starting point
and a range of options for future opportunities.
Roll it out for the long haul. The challenge
should be big, the model insightful and the business
vision complete. However, the first implementation
steps can be small, as long as they fit your agenda.
Reduce your rework by using business analytic and
process management tools that you have selected
for the long haul — information governance, busi-
ness analytics and business rules. As you make
progress, don’t forget to analyze feedback and busi-
ness outcomes to determine where your analytics
model and business vision can be improved.
Make Analytics Pay off
It takes big plans followed by discrete actions to gain
the benefits of analytics. But it also takes some very
specific management approaches. Each of our recom-
mendations meets three critical management needs:
�Reduced time to value
�Increased likelihood of transformation that’s
both significant and enduring
�Greater focus on achievable steps.
To start on the fastest path to value, keep every-
one focused on the big business issues and select the
challenges that analytics can solve today within an
agenda for the future. Build on the capabilities you
already have. And always keep pressing to embed
the insights you’ve gained into business operations.
reFereNCes
1. In the performance self-assessment, other respondent options included “somewhat outperforming industry peers” and “on par with industry peers.”
2. R. Christenson, “N.C. and IBM Team up to Ferret out Medicaid Fraud,” March 25, 2010, http://www.newsobserver.com/2010/03/25/405666/ nc-and-ibm-team-up-to-ferret-out.html.
3. “Perdue Begins Medicaid Fraud, Waste Prevention Ef-fort,” March 24, 2010, http://www.wral.com/news/state/story/7291729/.
4. B. Balfour, “Ten Recommendations for North Carolina’s Budget Reform and Advisory Commission (BRAC),” John W Pope Civitas Institute, February 10, 2010, http://www.nccivitas.org/media/ publication-archive/policy-brief/ten-recommendations-north-carolinas-budget-reform-and-advisor
5. “Perdue Begins Medicaid Fraud, Waste Prevention Effort.”
For more information about this study, The New Intelligent Enterprise initiative and additional interviews, you may contact MIT Sloan Management Review at [email protected] or visit the MIT SMR Web site: sloanreview.mit.edu/tnie
For more information about this study, you may contact the IBM Institute for Business Value at [email protected], or visit the IBM IBV Web site: ibm.com/gbs/bao

s p e c i a l R e p o R t a N a l y t i c s : t h e N e w p a t h t o v a l u e
IBM INSTITUTE FOR BUSINESS VALUE • MIT sLoAN MANAGeMeNT reVIew 17
s p e c i a l R e p o R t a N a l y t i c s : t h e N e w p a t h t o v a l u e
The survey: Questions and responses
Percentage of respondents
0
Innovating to achieve competitive differentiation
Growing revenue
Reducing costs and increasing efficiencies
Profitably acquiring and retaining customers
Increasing operating speed and adaptability
Managing regulatory compliance
Managing risk or reducing fraud
10% 20% 30% 50%40% 60%
10%
14%
35%
45%
46%
50%
61%
About the researchTo understand the challenges and opportunities associ-ated with the use of business analytics, MIT Sloan Manage-ment Review, in collaboration with the IBM Institute for Busi-ness Value, conducted a survey of more than 3,000 business execu-tives, managers and analysts from organi-zations located around the world. The survey captured insights from individuals in 108 countries and more than 30 industries, and involved organiza-tions of various sizes. The sample was drawn from a number of different sources, including MIT alumni and MIT Sloan Man-agement Review subscribers, IBM cli-ents and other interested parties.
In addition to these survey results, we also interviewed academic experts and subject matter experts from a number of industries and disciplines to un-derstand the practical issues facing organiza-tions today. Their insights contributed to a richer understand-ing of the data, and the development of recommendations that respond to strategic and tactical questions senior executives address as they operationalize analytics within their organizations. we also drew upon a number of IBM case studies to illustrate further how organi-zations are leveraging business analytics and illuminate how real or-ganizations are putting our recom-mendations into action in different or-ganizational settings.
Q1. what are the primary challenges facing your organization in the next two years? (Please select your top three.)
How are organizations using information and analytics? (Results from the 2010 New Intelligent Enterprise Global Executive Survey.)
Q2. how well do the following statements describe your organization? (Please rate on a scale of 1 to 5, where 1 = strongly disagree and 5 = strongly agree)
Business information and analytics differentiate us within the industry
Improving our information and analytics capability is a top priority in our organization
Employees are encouraged to challenge current practices and approaches
The organization predicts and prepares for the future by proactively evaluating scenarios or potential trade-offs
The organization makes decisions based on rigorous analytic approaches (e.g., quantitative modeling, simulation)
The organization has more data than it knows how to use effectively
The organization manages data to enable the ability to share and aggregate data across departments or business units
12%
25% 26% 23%
14%
5%
18%
27% 29%21%
7%
18%24%
32%
19%
7%
23%27% 30%
13%
15%
30% 27%
19%
9%
9%
24%30%
25%
12%
6%14%
19%
29% 31%
Strongly Disagree
Strongly Agree
Strongly Disagree
Strongly Agree
12%
25% 26% 23%
14%
5%
18%
27% 29%21%
7%
18%24%
32%
19%
7%
23%27% 30%
13%
15%
30% 27%
19%
9%
9%
24%30%
25%
12%
6%14%
19%
29% 31%
Strongly Disagree
Strongly Agree
Strongly Disagree
Strongly Agree
12%
25% 26% 23%
14%
5%
18%
27% 29%21%
7%
18%24%
32%
19%
7%
23%27% 30%
13%
15%
30% 27%
19%
9%
9%
24%30%
25%
12%
6%14%
19%
29% 31%
Strongly Disagree
Strongly Agree
Strongly Disagree
Strongly Agree
12%
25% 26% 23%
14%
5%
18%
27% 29%21%
7%
18%24%
32%
19%
7%
23%27% 30%
13%
15%
30% 27%
19%
9%
9%
24%30%
25%
12%
6%14%
19%
29% 31%
Strongly Disagree
Strongly Agree
Strongly Disagree
Strongly Agree
12%
25% 26% 23%
14%
5%
18%
27% 29%21%
7%
18%24%
32%
19%
7%
23%27% 30%
13%
15%
30% 27%
19%
9%
9%
24%30%
25%
12%
6%14%
19%
29% 31%
Strongly Disagree
Strongly Agree
Strongly Disagree
Strongly Agree
12%
25% 26% 23%
14%
5%
18%
27% 29%21%
7%
18%24%
32%
19%
7%
23%27% 30%
13%
15%
30% 27%
19%
9%
9%
24%30%
25%
12%
6%14%
19%
29% 31%
Strongly Disagree
Strongly Agree
Strongly Disagree
Strongly Agree
12%
25% 26% 23%
14%
5%
18%
27% 29%21%
7%
18%24%
32%
19%
7%
23%27% 30%
13%
15%
30% 27%
19%
9%
9%
24%30%
25%
12%
6%14%
19%
29% 31%
Strongly Disagree
Strongly Agree
Strongly Disagree
Strongly Agree

18 MIT sLoAN MANAGeMeNT reVIew • IBM INSTITUTE FOR BUSINESS VALUE
s p e c i a l R e p o R t a N a l y t i c s : t h e N e w p a t h t o v a l u e
Q3. To what extent does your organization apply analytics to the following activities?
1 & 2 (Low)34 & 5 (High)
0
Strategy and business development
Financial management and budgeting
Risk management
Brand or market management
Customer experience management
Sales and marketing
Work force planning and allocations
Product research and development
Customer service
General management
Operations and production
10% 40%30% 60%20% 50%
28%
23%14%
34%
37%
27%
34%
37%
23%
49%
64%
29%
37%
36%
29%
35%30%
35%
24%26%
50%
32%26%
42%
28%29%
43%
28%37%
35%
21%26%
52%
Q4. how well does your business unit or department perform the following information and analytic tasks?(Please rate on a scale of 1 to 5, where 1 = Poorly and 5 = Very well)
Ability to perform data management functions
4% 6%
7%10%
15%20%
21%26%
31%35%
31% 34%
33%28%
28%22%
17%11%
13%8%
Capture information Aggregate information
Analyze informationDisseminate information
and insights
Poorly Very Well
Ability to apply insights
9% 9%
26%23%
34%29%
23%28%
8%11%
Use insights to guide day-to-day operations
Use insights to guide future strategies
Poorly Very Well
Q5. what are the highest data priorities for your organization? (Please select up to three.)
Percentage of respondents
0
Integration (connecting disparate data sources)
Consistency/Standardization (defined similarly throughout organization)
Simplification (reducing complexity of data environment)
Trustworthiness (confidence in the data)
Timeliness (freshness of data at point of use)
Protection (security of the data)
Cost efficiency (reducing cost of data management)
Depth (more granularity of the types of data we collect today)
Breadth (new types of information we don’t collect today)
Access (enabling more business users)
10% 20% 30% 50%40%
44%
39%
34%
34%
32%
22%
21%
20%
19%
19%
Q6. where are analytics primarily performed within your organization? (Please select one.)
IT department
19%
36%
35%
10%
Centralized analytics unit at the enterprise level
Analytic units within departments or business units
At point of need
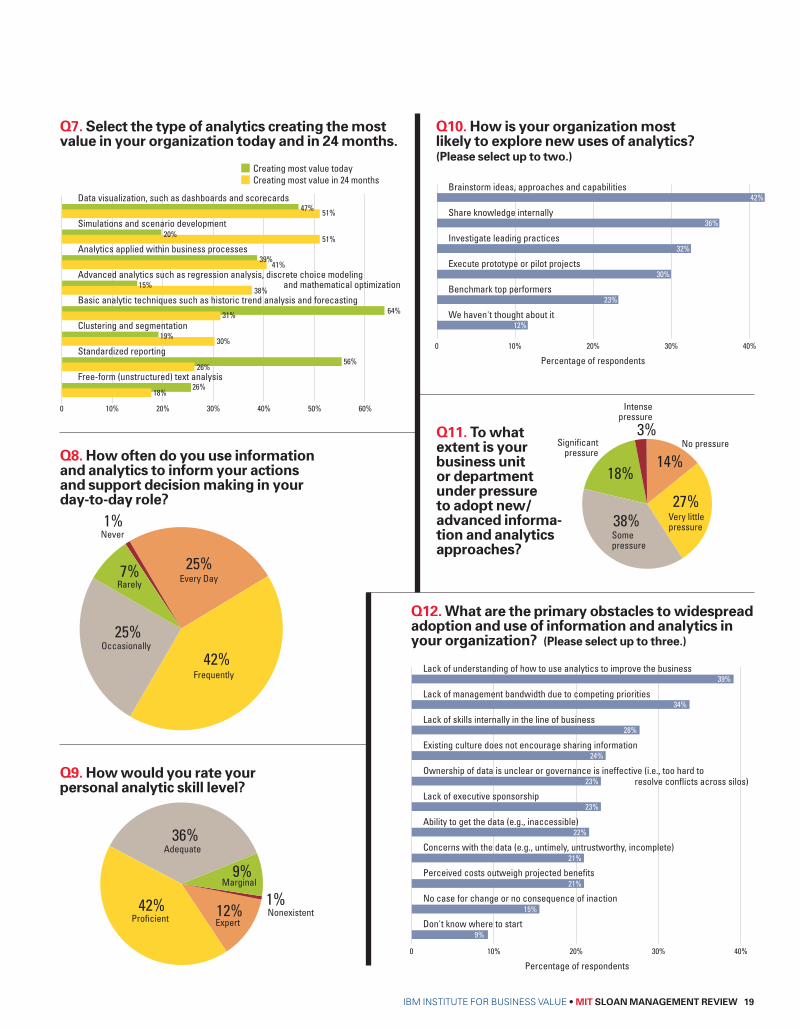
s p e c i a l R e p o R t a N a l y t i c s : t h e N e w p a t h t o v a l u e
IBM INSTITUTE FOR BUSINESS VALUE • MIT sLoAN MANAGeMeNT reVIew 19
Creating most value todayCreating most value in 24 months
and mathematical optimization
47%
20%
39%
15%
64%
19%
56%
26%
51%
51%
41%
38%
31%
30%
26%
18%
0
Data visualization, such as dashboards and scorecards
Simulations and scenario development
Analytics applied within business processes
Advanced analytics such as regression analysis, discrete choice modeling
Basic analytic techniques such as historic trend analysis and forecasting
Clustering and segmentation
Standardized reporting
Free-form (unstructured) text analysis
10% 40% 70%30% 60%20% 50%
Q7. select the type of analytics creating the most value in your organization today and in 24 months.
Q8. how often do you use information and analytics to inform your actions and support decision making in your day-to-day role?
25%
42%
7%
1%
Every Day
Frequently
Rarely
Never
25%Occasionally
Q9. how would you rate your personal analytic skill level?
Q10. how is your organization most likely to explore new uses of analytics? (Please select up to two.)
12%42%
36%
9%
1%ExpertProficient
Adequate
Marginal
Nonexistent
Percentage of respondents
0
Brainstorm ideas, approaches and capabilities
Share knowledge internally
Investigate leading practices
Execute prototype or pilot projects
Benchmark top performers
We haven't thought about it
10% 20% 30% 40%
42%
36%
32%
30%
23%
12%
Q11. To what extent is your business unit or department under pressure to adopt new/ advanced informa-tion and analytics approaches?
Q12. what are the primary obstacles to widespread adoption and use of information and analytics in your organization? (Please select up to three.)
Percentage of respondents
0
Lack of understanding of how to use analytics to improve the business
Lack of management bandwidth due to competing priorities
Lack of skills internally in the line of business
Existing culture does not encourage sharing information
Ownership of data is unclear or governance is ineffective (i.e., too hard to
Lack of executive sponsorship
Ability to get the data (e.g., inaccessible)
Concerns with the data (e.g., untimely, untrustworthy, incomplete)
Perceived costs outweigh projected benefits
No case for change or no consequence of inaction
Don't know where to start
10% 20% 30% 40%
24%
23%
23%
22%
21%
21%
15%
28%
34%
39%
9%
resolve conflicts across silos)
14%
27%38%
18%
3%No pressure
Very little pressure
Somepressure
Significantpressure
Intensepressure

20 MIT sLoAN MANAGeMeNT reVIew • IBM INSTITUTE FOR BUSINESS VALUE
s p e c i a l R e p o R t a N a l y t i c s : t h e N e w p a t h t o v a l u e
Percentage of respondents
0
Board member
CEO/President/Managing Director
CFO/Treasurer/Comptroller
CIO/Technology Director
Other C-level executive or equivalent
Senior VP/VP/Director
Head of business unit or department
Manager
Expert/Specialist
Analyst
Office/Operations worker
Other, please describe
5% 10% 15% 20%
2%
13%
2%
3%
5%
14%
10%
21%
13%
7%
3%
7%
Percentage of respondents
0
Customer service
Finance
General management
Human resources
Information technology
Marketing
Operations
Product development
Research and development
Risk management
Sales
Supply chain operations management
5% 10% 15% 20%
3%
6%
22%
5%
12%
12%
13%
8%
9%
2%
5%
4%
Q13. Imagine an organization transformed by better ways to collect, analyze and be prescriptively guided by information. how close are you to that ideal? (Please rate on a scale of 1 to 10, where 1 = Not at all close and 10 = Very close)
Q16. which of the following best describes your role?
Q17. what is your main functional area?Q18. which of the following best describes the activities involved in your day-to-day role?
Execute the activities determined by managers and decision makers
33%
36%
13%
12%6%
Evaluate and make strategic decisions
Identify opportunities and recommendactions to decision makers
Manage implementation
and execution of decisions made
by others
Develop information and
analytics needed for others to
make decisions
(TexT resPoNses)Q14. where do you think the greatest oppor-tunities with analytics lie for your function, organization or industry?
Q15. May we contact you further about your answer to this question? (If yes, you’ll be asked to give us your contact information at the end of the survey.)
4%
12%
19%
16%
13%
16%
11%
6%
2%1%
Not at all close1
Very close10
5

s p e c i a l R e p o R t a N a l y t i c s : t h e N e w p a t h t o v a l u e
IBM INSTITUTE FOR BUSINESS VALUE • MIT sLoAN MANAGeMeNT reVIew 21
Percentage of respondents
0
Aerospace and Defense
Agriculture and Agribusiness
Automotive
Chemicals
Construction and Real Estate
Consumer Goods
Education
Energy and Natural Resources
Entertainment, Media and Publishing
Financial Services – Banking
Financial Services – Insurance
Financial Services – Investment Management
Government/Public Sector – Federal/Central
Government/Public Sector – City/Local
Health Care Services – Payer
Health Care Services – Provider
IT and Technology
Logistics and Distribution
Manufacturing
Pharmaceuticals and Biotechnology
Professional Services
Retailing
Telecommunications
Transportation, Travel and Tourism
5% 10% 15%
0%
3%
1%
2%
2%
3%
4%
5%
4%
5%
2%
3%
4%
1%
1%
4%
16%
2%
10%
3%
16%
3%
3%
2 %
Q19. what is your primary industry? Q20. what is your organization’s global annual revenue in u.s. dollars?
Q21. how would your describe your organization’s competitive position?
Q22. In which geographic region are you personally located?
$500 millionor less
$500 million to$1 billion
$1 billion to$5 billion
$5 billion to$10 billion
$10 billionor more
51%
10%
14%
7%
18%
Substantially underperforming
industry peers
18%
35%29%
15%
3% Substantially outperforming industry peers
Slightly outperforming industry peers
On par with industry peers
Slightly underperforming
industry peers
North America
Asia-Pacific
Western Europe
Eastern Europe
LatinAmerica
Middle Eastand Africa
57%
16%
13%
2% 7%5%

ACkNowLeDGMeNTs
John Armstrong, IBM; Marc Berson, IBM; Eric Brynjolfsson, MIT; Dr. Steve Buckley,
IBM; William Fuessler, IBM; Bill Hoffman, Best Buy; Christer Johnson, IBM; Richard
Lawrence, IBM; Thomas W. Malone, MIT; Andrew McAfee, MIT; Dwight McNeill,
IBM; Chris Moore, IBM; Mychelle Mollot, IBM; Mark Ramsey, IBM; Will Reilly, IBM;
Jeanne W. Ross, MIT; Michael Schrage, MIT; Michael Schroeck, IBM; Marc Teerlink,
IBM; David Turner, IBM; Bruce Tyler, IBM; Andy Warzecha, IBM; Peter Weill, MIT; and
Katharyn White, IBM.
Additional support for this study was provided by:
Attivio, Inc. Attivio’s unified information access software combines enterprise search,
BI, data warehousing and analytic capabilities for an integrated view of content and
data, regardless of source or format. http://www.attivio.com/.
Dassault Systèmes. Dassault Systèmes, a leader in 3D and product lifecycle manage-
ment solutions, enables everyone — from designers to consumers and their
communities — to create, share and experience in 3D. http://www.3ds.com/.
M.S. Hopkins, S. Lavalle, and F. Balboni, “10 Insights: A First Look at the New Intelli-
gent Enterprise Survey on Winning with Data,” MIT Sloan Management Review 52,
no.1 (fall 2010), http://sloanreview.mit.edu/x/52115.
N. Kruschwitz and R. Shockley, “10 Data Points: Information and Analytics at Work,” MIT
Sloan Management Review 52, no. 1 (fall 2010), http://sloanreview.mit.edu/x/52115.
M.S. Hopkins, “The Four Ways IT Is Revolutionizing Innovation: An Interview
with Erik Brynjolfsson,” MIT Sloan Management Review 51, no. 3 (spring 2010),
http://sloanreview.mit.edu/x/51330.
M.S. Hopkins, “Putting the Science in Management Science: An Interview with
Andrew McAfee,” MIT Sloan Management Review 51, no. 4 (summer 2010),
http://sloanreview.mit.edu/x/51414.
IBM Corporation, “Capitalizing on Complexity: Insights from the Global CEO Study,”
IBM Institute for Business Value, May 2010, www.ibm.com/gbs/ceostudy.
S. LaValle, “Breaking Away with Business Analytics and Optimization: New Intelligence
Meets Enterprise Operations,” IBM Institute for Business Value, November 2009, ftp://
public.dhe.ibm.com/common/ssi/ecm/en/gbe03263usen/GBE03263USEN.PDF.
S. LaValle, “Business Analytics and Optimiziation for the Intelligent Enterprise,” IBM
Institute for Business Value, December 2009, ftp://public.dhe.ibm.com/common/ssi/
ecm/en/gbe03211usen/GBE03211USEN.PDF.
reLATeD PuBLICATIoNs
IBM INSTITUTE FOR BUSINESS VALUE • MIT sLoAN MANAGeMeNT reVIew 22
