findings and recommendations: supply-side scan of...
TRANSCRIPT

Findings and Recommendations:
Supply-Side Scan of Microenterprise Financing October 2005
Prepared for the Aspen Institute FIELD Program
By Patty Grossman, Ellen Chen and Paige Chapel
Authors’ Note The Aspen Institute engaged the consultants to conduct a literature scan to 1) identify and quantify, to the extent possible, current microcredit providers in the for-profit sector; and 2) determine how the for-profit sector’s products and services compare to those offered by the microenterprise industry. Findings and conclusions included in this document are devices used to organize the myriad materials reviewed and do not reflect the authors' perspectives/opinions on the state of the microenterprise lending industry en parcel or whole. Conclusions stated in this document are general observations based on the literature review and should not be universally applied or held to be true in all markets and circumstances.

Supply-Side Scan of Microenterprise Financing Page 1 of 17 ©FIELD/The Aspen Institute All rights reserved. Printed in the United States of America
Findings and Recommendations: Aspen Institute FIELD Program
Supply-Side Scan of Microenterprise Financing October 2005
Introduction This document summarizes findings and conclusions about microcredit providers in the for-profit sector, the potential size of the industry, trends in the industry that affect the availability of credit for microentrepreneurs, and implications for nonprofit microcredit providers. Our findings and conclusions are summarized in the first two pages, followed by detailed, referenced supporting information for each core finding. APPENDIX A includes a list of non-bank, for-profit credit providers by type; APPENDIX B provides a comparison summary of for-profit and nonprofit microcredit providers; APPENDIX C summarizes the characteristics of “watch list” businesses; and APPENDICES D and E include a bibliography and list of interviews conducted for this research.
Findings Overview 1) For-profit providers of microcredit have fragmented over the last decade with banks, finance
companies, asset-based lenders, factors and credit cards companies all combining and sharing market and product sets. Banks are the primary suppliers to the micromarket and have increased their presence to approximately 86% of the market since deregulation, although sources vary on the exact percentage. (See APPENDIX A for list of representative non-bank, for-profit credit providers by type.)
2) Primary and secondary data sources on market size, industry size and market share use
different definitions of “small business,” none of which meet or even approximate FIELD’s definition (less than $50,000 in annual sales/number of employees under five). We found no data on companies that specifically track median annual revenues of $26,000 or employee size under five. In general, the for-profit sector relates to small businesses in terms of loan size rather than annual revenues or employee size. This difference in definitions may explain certain statistical discrepancies, including size of total small business borrowings and small business borrowing by type of credit product.
3) Credit scoring has become so precise in predicting repayment probability that it is the primary
methodology used by for-profit providers of small business loans (primarily banks, finance companies and credit card providers) to determine who is approved for credit.
4) For-profit providers of commercial loans of less than $35,000 are aggressively reaching
“down market” by using credit cards as the primary product vehicle and credit scoring as the decision-making methodology.
5) The profile of a successful applicant for microcredit from a for-profit provider is fluid because
providers are actively refining credit scoring algorithms. 6) “Gaps” still exist in credit availability for small businesses that nonprofit microlenders can fill;
however, borrowers in this niche are increasingly marginal and risky.

Supply-Side Scan of Microenterprise Financing Page 2 of 17 ©FIELD/The Aspen Institute All rights reserved. Printed in the United States of America
Conclusions 1) Banks and the other for-profit providers of commercial microcredit will continue their down-
market drive using credit scoring to reach increasingly “riskier” borrowers. They are increasingly aggressive in exploiting the borrower segment served by nonprofit lenders, pushing nonprofit portfolios further to the margin. Only the very riskiest borrowers will be left for nonprofit lenders in a perfect information market.
2) The correct way to think of product differentiation is not through product attributes such as pricing, loan amounts, or terms, but through underwriting criteria. Credit scoring has driven portfolio growth, not through increased risk tolerance, but by adherence to acceptable levels of predictable loss based on a credit scoring algorithm tied to underwriting criteria.
3) Credit cards appear to be the product of choice for banks and other lenders in targeting “marginal” small business borrowers (those who have one or more of the characteristics described under finding #6 below). There are a number of ways the nonprofit microcredit industry could respond including (but not limited to): 1) compete directly by building a credit scoring algorithm that facilitates high volume lending; 2) expand market research, marketing efforts and develop customer-oriented technologies such as on-line applications; 3) provide business packaging services to help borrowers who are not otherwise eligible for bank debt better access to for-profit lenders; and/or, 4) provide value-added technical assistance as a mission-driven focus to enhance business performance.
Credit cards should not be the product of choice for businesses with variable cash flow that need to be price sensitive, although many businesses in this category choose convenience over price. Microcredit providers will need to reeducate borrowers about the hazards of unsecured, high-priced credit, especially with recent changes in bankruptcy laws. In addition, nonprofit lenders will need to improve their ability to offer convenience while stressing the value of personal service. Over time, nonprofit lenders that do not offer technical assistance and business support services will be increasingly challenged by credit scoring and the convenience of credit cards.
4) This has profound implications for the nonprofit microcredit industry. If microlenders choose
to compete through high volume lending, they will require more equity in their capital structure to support potential losses associated with higher levels of risk. The greater need for equity and flexible debt in an increasingly difficult capital market may change the discussion regarding the march to scale for this segment of the nonprofit lending industry.
5) If a nonprofit microlender chooses to provide technical assistance to address borrowers’
weaknesses in their credit profiles, operating capital requirements will increase. The focus on self-sufficiency needs to be recast. Funder education and expectations need to change on numerous fronts: operating self-sufficiency and minimal losses may no longer be appropriate objectives for the sector.
6) Partnerships between nonprofit and for-profit providers of microcredit will become more
important and will need to be based on a thorough understanding of the parameters of the credit scoring model employed by the for-profit sector. For example, current partnerships tend to focus on the back end of a credit transaction, after formal rejection by a bank lender. Partnerships may be more optimally focused on the front-end of a relationship whereby a nonprofit microlender helps a bank partner penetrate a market segment by preparing certain borrowers for a banking relationship through deposit, remittance and other services. To be effective, the nonprofit must understand the credit scoring parameters used to exclude certain borrowers. Potential borrowers may be counseled on banking products including the correct use of credit cards.
Supply-Side Scan of Microenterprise Financing Page 3 of 17 ©FIELD/The Aspen Institute All rights reserved. Printed in the United States of America
Findings and Supporting References
Finding #1: For-profit providers of microcredit have fragmented over the last decade with banks, finance companies, asset-based lenders, factors and credit cards companies all combining and sharing market and product sets. Banks are the primary suppliers to the micromarket and have increased their presence to approximately 86% of the market since deregulation, although sources vary on the exact percentage. Support: A. Comparison of traditional lenders and finance companies Definitions: All debt instruments are either lines or loans (or leases, which are a type of loan). Lines are credit approvals for a maximum amount of credit that the business can draw down and pay back daily, if they so desire, to exactly match their credit need and decrease their interest costs. Commitments to fund lines of credit must be renewed every year by the lender. A loan is a fixed amount of money extended to a borrower in one lump sum that the borrower typically pays back over a year or longer at a predetermined monthly amount. There are varia-tions on the loan theme, of course, with the sum disbursed in “stepped” amounts and not one lump sum; and with repayment at variable times or amounts to fit a borrower’s cash streams. Attributes of lines and loans generally relate to price, term, required collateral coverage (including personal guarantees for corporations and LLCs or extrapolated guarantees1), repayment schedule (whether periods of interest only are allowed); and allowed purpose. Factors: Factoring is selling accounts receivable (AR), invoices or purchase orders to receive money today, instead of waiting one to three months or more to be paid. Factoring is an important finance tool for small companies since it does not create debt, nor does it require company owners to relinquish any equity in their company. Factoring fees are paid in the form of a percentage discount, deducted after all of the invoices have been paid to the factor. Companies who do not qualify for traditional lines or loans are the major users of factors because the credit decision is made on the company that will pay the AR, not the company to which the AR is owed. The amount of discount depends on the length of time it takes to collect on invoices, anywhere from 2% to 10% of the face value of the AR. When converted to an annual interest rate to compare this credit facility to a traditional line of credit, the factoring rate averages over 30%. Factoring U.S. Market Size: According to the Commercial Finance Association (CFA), in 1998, factoring market volume was $75.5 billion in the U.S. The players in the U.S. market for factoring services can be divided into two different categories: small and large. There are less than a dozen factors that can claim to have greater than $1 billion in annual turnover, and hundreds of smaller players. Asset-Based Lenders: In the small business realm, asset-based lenders are lending at prime plus 50 to 800 basis points, depending on the specifics of a deal. The underwriting for this loan is done on the borrowing company, not on the borrowing company’s debtors, as in factoring. Asset- 1 An extrapolated guarantee is one from an individual other than the small business owner (s).

Supply-Side Scan of Microenterprise Financing Page 4 of 17 ©FIELD/The Aspen Institute All rights reserved. Printed in the United States of America
based lenders typically charge more than banks since they lend to companies that are asset (collateral) rich but have weak cash flow. Banks require strength in both areas. (In contrast, factors are cash flow lenders as are SBA lenders.) Asset-based lenders target companies that have difficulty accessing bank financing. These are companies experiencing:
Rapid growth Turnaround Recapitalization Seasonal sales Short operating history Acquisition and merger Shareholder buyout Chapter 11 bankruptcy (debtor-in-possession)
Consumer Finance Companies: The Consumer Bankers Association lists the following products offered by its members: sub-prime, small business, auto, student, and home equity. The non-consumer loan category traditionally covers loans made for the following purposes: commercial, equipment, real estate and asset based, i.e., AR and inventory, or purchase order. Finance companies and asset-based lenders offer a similar product: A term loan (a loan with a term longer than one year) priced at prime plus 50 to 800 basis points, depending on the specifics of the deal. The underwriting for this loan is done on the borrowing company, not on the borrowing company’s debtors, as in factoring. And a finance company will tolerate additional weaknesses over a bank, whose regulators will not allow banks to jeopardize the principal on taxpayer insured loans. The expansion of the industry is illustrated by the very existence of a “Consumer Bankers Association” which has a “subprime” product. Regulators would not have allowed such a product twenty years ago. Advanta, one of the largest non-bank lenders in the U.S., is both an asset-based lender and a consumer finance company.2 The consumer finance company’s small business product is similar to the asset-based lender product; however, these companies also extend consumer products to their business borrowers including auto, home, student and home equity loans. Credit Cards: Credit cards are unsecured lines of credit. Credit card companies, which charge prime plus 500 basis points at the lowest end of the pricing spectrum, are experiencing explosive growth. Credit card providers are newly motivated to extend credit ever further because the new U.S. bankruptcy law makes the expunging of personal debts much more difficult. Charles Tansey of the SBA reported that Banc One planned to launch a direct mail campaign in Fall 2005, sending one million pieces of mail each month for business card prospects. Credit cards compete with traditional loans by offering convenience and benefits, such as:
Electronic reporting options Rewards programs Group purchasing programs
2 Please refer to APPENDIX A for lists of consumer finance companies, asset-based lenders, factors, and credit card companies.

Supply-Side Scan of Microenterprise Financing Page 5 of 17 ©FIELD/The Aspen Institute All rights reserved. Printed in the United States of America
Although traditionally, business use of credit cards had been limited to travel and entertainment, the American Express OPEN network reported the results of a survey in which they noted the increased use of credit cards for working capital to buy inventory and pay rent. B. Increased volume of lending by banks The number of microbusiness loans (loans under $100,000) made by U.S. banks jumped by 45% in 2001-2002, primarily the result of increased promotion and use of small business credit cards. [SBA Office of Advocacy, “Small Business and Micro Business Lending in the United States for Data Years 2002-2003”] Banks control 83.5% of all micromarket loan balances, and 91.2% of small business loan balances. [Informa] In the small business market, banks have a larger share of lead loan-relationships (94%) than in the micromarket (86%). [Informa] Top-20 banks (those with more than $50 billion in assets) have one-third of all small business loan relationships, compared with 27% in the micromarket. [Informa] Lending by commercial banks increased in the 2002-2003 period: small business loans outstanding (loans under $1 million) totaled $495 billion as of June 2003, an increase of $11.1 billion or 2.3 percent between June 2002 and June 2003, compared with an overall increase of 5.1 percent over the previous period. [Haynes, 2005; and Mitchell and Pearce, 2005] Multi-billion-dollar banks and bank holding companies dominate the market for the smallest loans, with the percentage market share having increased since deregulation. [2002 Federal Reserve Report to Congress] C. Positioning Vis-à-Vis SBA’s Community Express Program The SBA launched the Community Express Program (CE) in 1999 in partnership with the National Community Reinvestment Coalition. CE is the latest in a long line of initiatives by the SBA to meet the credit needs of smaller and not as yet “bankable” companies. As a subset of the 7(a) program, CE is managed by lenders who are approved 7(a) lenders (please see APPENDIX D for a list of the 48 providers as of September 30, 2005). CE uses standard 7(a) underwriting guidelines, with two major differences: credit extensions under $25,000 can be unsecured and the provision of technical assistance accompanies credit extensions. These providers will continue to be in direct competition with nonprofit microcredit providers since they can disburse guaranteed loans as small as $5,000 up to a maximum of $250,000, with turnaround time from application to decision in less than 36 hours. To date, only 21.2% of Community Express loans have been microloans (less than $50,000) although the average loan size is just less than $33,000 (out of the $256 million in disbursements from 1999 through September 30, 2004. (Please see APPENDIX D for program loan statistics.) Some for-profit providers of Community Express and other more aggressive credit programs have done an excellent job providing credit and necessary support to unbankable microentrepreneurs. Historically these for-profit programs have been plagued by short life spans often caused by a change in the regulatory imperatives governing a given for-profit provider or the promotion or departure of dedicated management or staff. D. Scale and prominence of “non-bank” credit providers Bank Holding Companies (BHCs): A huge trend in small business finance is the joining of BHCs and finance companies – and other combinations. Continued deregulation has enabled com-mercial banks to consolidate and expand. As a result, banking assets have increased signifi-

Supply-Side Scan of Microenterprise Financing Page 6 of 17 ©FIELD/The Aspen Institute All rights reserved. Printed in the United States of America
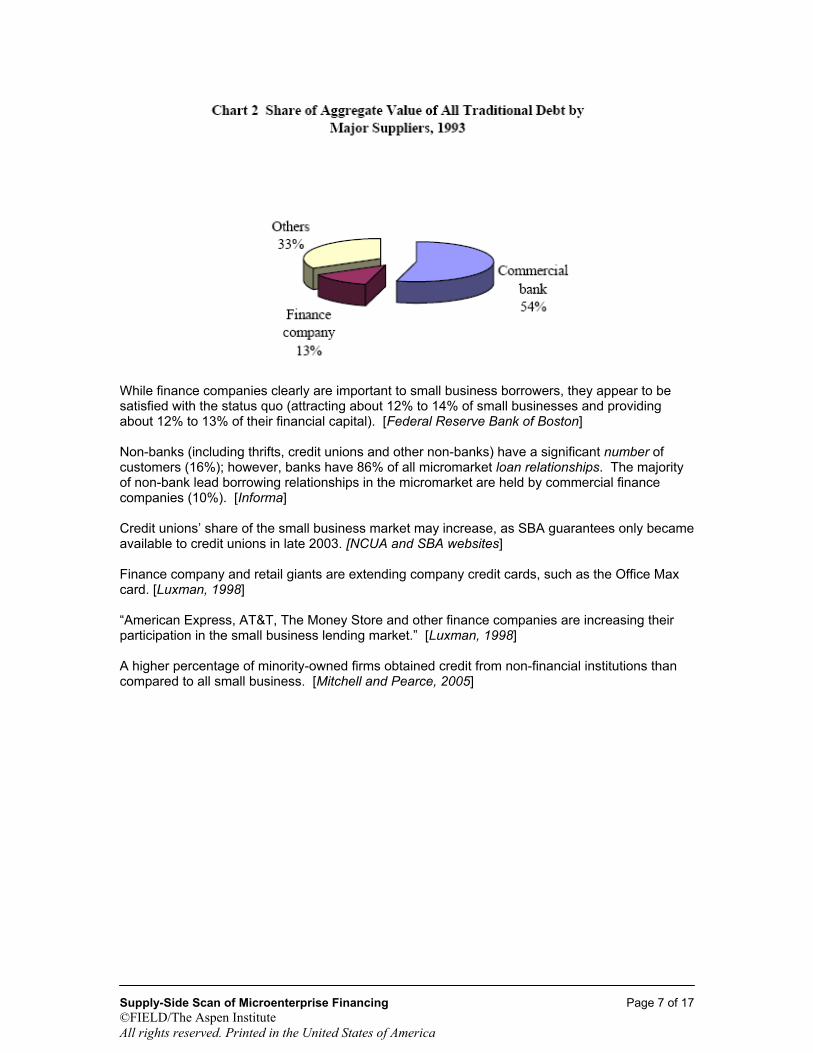
cantly during the past decade and have been concentrated in the hands of giant banks, especially bank holding companies. Large multi-billion-dollar banks owned by BHCs made 5.3 million microbusiness loans valued at $73 billion in 2002, compared with 4.9 million loans valued at $62 billion in 2001. The incidence of loans from depositor institutions increased with borrower size: 22% to firms with no employees to 78% to firms with over 100 employees [Fed Survey 1998] Commercial Finance Companies: Commercial finance companies, which primarily provide financing to support commercial asset acquisition, are the second most important provider of credit to microbusinesses, but are a distant second to banks at 10.8% to 14% of the market, depending on the time periods and definitions used of small business. [George Haynes, “Finance Companies and Small Business Borrowers: Evidence from the 1993 and 1998 Surveys of Small Business Finances,” and Informa Research Services] According to a 1998 Fed survey, finance companies accounted for 13.3% of loans in 1993 (number of relationships), representing an aggregate value of 12.3% of total debt in 1998 while the value of borrowings held by banks increased dramatically from 54% to 65% during the same period. The charts below show the proportion of small businesses borrowing from each credit source in 1993 and 1998. [Federal Reserve Board’s Survey of Small Business Finances, 1998]
Supply-Side Scan of Microenterprise Financing Page 7 of 17 ©FIELD/The Aspen Institute All rights reserved. Printed in the United States of America
While finance companies clearly are important to small business borrowers, they appear to be satisfied with the status quo (attracting about 12% to 14% of small businesses and providing about 12% to 13% of their financial capital). [Federal Reserve Bank of Boston] Non-banks (including thrifts, credit unions and other non-banks) have a significant number of customers (16%); however, banks have 86% of all micromarket loan relationships. The majority of non-bank lead borrowing relationships in the micromarket are held by commercial finance companies (10%). [Informa] Credit unions’ share of the small business market may increase, as SBA guarantees only became available to credit unions in late 2003. [NCUA and SBA websites] Finance company and retail giants are extending company credit cards, such as the Office Max card. [Luxman, 1998] “American Express, AT&T, The Money Store and other finance companies are increasing their participation in the small business lending market.” [Luxman, 1998] A higher percentage of minority-owned firms obtained credit from non-financial institutions than compared to all small business. [Mitchell and Pearce, 2005]

Supply-Side Scan of Microenterprise Financing Page 8 of 17 ©FIELD/The Aspen Institute All rights reserved. Printed in the United States of America
Finding #2: Primary and secondary data sources on market size, industry size, and market share use different definitions of “small business,” none of which meet FIELD’s definition (less than $50,000 in annual sales). We found no data on companies that specifically track median annual revenues of $26,000. In general, the for-profit sector relates to small businesses in terms of loan size rather than annual revenues. This difference in definitions may explain certain statistical discrepancies, including size of the total small businesses borrowings and small business borrowing by type of credit product. Support: A. Definitional issues From Informa Research Services, Inc., “2002 Survey for the Consumer Bankers Association”: The micromarket, defined as companies with annual sales between $50 thousand and $999.9 thousand, totaled 8 million in 2002. In comparison, small businesses are defined as companies with annual sales between $1 million and $9.9 million, totaling 870,000 companies in 2002. About one-fourth (22%) of the micromarket (of 8 million per Dun and Bradstreet) and nearly
one-third (31%) of the small business market plan to borrow during any given year. [Informa] Twice as many businesses (40% in the micromarket and 59% in the small business market)
have outstanding loans. [Informa] This is compared to the SBA/Federal Reserve’s “Survey of Small Business Finances” 1998, which states that 82.5% of small businesses have outstand-ing debt, where small businesses are defined as companies with less than 500 employees.
The rest of the market does not borrow, or relies on financing alternatives, such as leasing,
and tapping into personal credit facilities to finance a business. (The statistics in the table below include business credit card use.)

Supply-Side Scan of Microenterprise Financing Page 9 of 17 ©FIELD/The Aspen Institute All rights reserved. Printed in the United States of America
B. Market Size for Loans and Lines of Credit The vast majority of businesses in the United States are microbusinesses, so it is no surprise that the micromarket accounts for the majority (60%) of total outstanding business loans. However, due to lower average balances ($62,800 in the micromarket versus $263,700 in the small business market), the micromarket’s contribution to total outstanding loans is out of proportion to its share of the business population (90%). [Informa] Loans and Lines of Credit Usage Trends: Micromarket usage of certain types of loans grew slightly from 2001 to 2002, including unsecured lines of credit (12% in 2001, 17% in 2002) and term loans (7% in 2001, 11% in 2002). [Informa] Usage of most other loan products has remained steady during the 2001-2002 period. These numbers do point towards total market growth in the number of companies that have business loans, from 34% of the micromarket in 2001 to 40% of the micromarket in 2002. [Informa] In 2001, there were 2,635,000 micromarket companies that had outstanding loans; in 2002, there were 3,175,000 companies with loans -- 540,000 new borrowers during that two-year period.3 [Informa]
N.B. The above types include credit cards.
3 It should be noted that part of this increase is due to both growth in the number of companies in the micro-market that have loans and growth in the total micro-market business population.

Supply-Side Scan of Microenterprise Financing Page 10 of 17 ©FIELD/The Aspen Institute All rights reserved. Printed in the United States of America
C. Current market size and share: data issues and contradictory evidence
Major public sources of primary data
a. The Internal Revenue Service - Estimates there were 27 million business tax returns (Schedule C, corporate, LLC returns and partnerships) in 2003.
b. U.S. Census Data - 5.7 million firms with employees and 17 million without employees in
2000. AEO’s MEES and MBES projects estimate that 87% of these businesses are microenterprises, i.e., businesses with five or fewer employees.
c. U.S. Department of Labor – Bureau of Labor Statistics (BLS) - Uses a 23.7 million figure
(extrapolated from employee data). Small firms with less than 500 employees represent 99.7 percent of the 23.7 million businesses. DOL’s Bureau of Labor Statistics estimates that there were 12.2 million self-employed, nonagricultural business owners in 2003.
d. The 1998 Survey of Small Business Finances (SSBF), commissioned by the Federal
Reserve, did not include estimates of need or size of market.
The survey gathered details on the characteristics of each business and its primary owner, the firm’s income statement and balance sheet, and details of the use and sources of financial services. The Federal Reserve’s Report to Congress on the Availability of Small Business Credit, September 2002, is based on a 1998 survey. (The 2003 survey, upon which a new report will be issued to Congress, is due in 2006.) The 1998 SSBF gathered data for fiscal year 1998 from 3,561 firms selected to be representative of small businesses operating in the United States in December 1998.
Major private sources of primary data - usually based on surveys:
a. Informa: 8 million micro; 870,000 small (Dun and Bradstreet numbers). Informa
defines micro as businesses with annual revenues between $50,000 and $250,000; and small as between $250,000 and $1,000,000.
b. The National Federation of Independent Businesses (NFIB)
c. Informa Research Services for the Consumer Bankers Association
d. Goldman Sachs
e. Dun & Bradstreet
Major points of inconsistency
a. Source data differences Comprehensive data that directly measure the financing activities of small businesses do not exist [Fed Survey 1998], but the Fed Survey does try to fill the gap.
CDFI Data Project reports the following volumes for microloans (under $35,000) and small business loans (over $35,000) made by nonprofit lenders and a handful of for-profit CDFIs in FY 2003. Micro: 6,923 financed in FY2003; small- and medium-size: 2,288 businesses financed in FY 2003. The 2002 Fed Report to Congress (based on the 1998 Survey) states:

Supply-Side Scan of Microenterprise Financing Page 11 of 17 ©FIELD/The Aspen Institute All rights reserved. Printed in the United States of America
“Defining what is meant by “small business” is the first step in conducting a policy relevant analysis of the financing needs of small business; it is also difficult. The financing needs are very different for a “mom and pop” grocery store, a microenterprise in the inner city, a start-up high-tech firm, a business that is ready to expand from early stage growth to the next higher level, or a business that has neared the point of issuing public debt or equity. Yet the term “small business” encompasses all of these. According to a broad guideline used by the Small Business Administration (SBA), a small business is a firm or enterprise with fewer than 500 employees. This definition encompasses more than 99 percent of all businesses in the United States. The vast majority of small businesses are modest in size. The 1998 Survey of Small Business Finances (SSBF), which is representative of more than 5 million nonfarm, nonfinancial businesses with fewer than 500 workers, estimates that over 91 percent of these businesses have fewer than twenty employees (including working owners) and that almost two-thirds have fewer than five.”
ACCION’s assertion that 10 million microentrepreneurs have unmet credit needs may be true, although impossible to verify. Nonetheless, the lending volume of nonprofit and for-profit mission-driven institutions is so small relative to the potential market that even one- twentieth of ACCION’s projection represents a large unserved market of entrepreneurs. b. Revenue size
One of the problems with all the primary data sets is that they define “small business” differently than how the microenterprise field defines “microbusinesses.” Informa uses $50,000 in annual revenues as the smallest data point. SSBF and AEO use employee size. Gross revenues cannot be accurately correlated with employee size.
c. Estimates based on the borrowing market
Volume estimates for total market size using SSBF and SBA say 82.5% of firms borrow. Informa reports only 40%. The 82.5% figure represents firms with fewer than 200 employees, the Federal Reserve definition of a small business; while Informa's 40% refers to businesses with total revenues under $10 million. (A second frequently used federal definition is businesses that cannot access public credit markets and must rely upon bank credit. A third is, of course, the SBA definition, which uses employee size under 500.) [2002 Fed Report to Congress]
Volume estimates for credit card use also differ markedly, and may be due to the same data set difference. d. Other characteristics
Other issues that affect the consistency of data include:
Variations in underwriting used by finance companies, Issues for rural businesses related to physical proximity to banks and a
business owner’s ability to establish and maintain a banking (credit) relationship. There was data supporting the fact that credit scoring has led to greater market reach into select Low/Moderate Income Areas [Frame, Padhi and Woosley, 2001] that are rural; but practitioners report anemic reach into rural areas. [Luxman, 1998] Please see Finding 3(D).

Supply-Side Scan of Microenterprise Financing Page 12 of 17 ©FIELD/The Aspen Institute All rights reserved. Printed in the United States of America
Finding #3: Credit scoring has become so precise in predicting repayment probability that it is the primary methodology used by for-profit providers of small business loans (primarily banks, finance companies and credit card providers) to determine who is approved for credit. Support: A. Prevalence of credit scoring in all small business lending Twenty-two of the 25 biggest players in the small-business loan market use a credit scoring system, according to Fair, Isaac & Co., a pioneer in the development of credit-scoring software. Almost any loan of $50,000 or less issued by a national financial services company will have gone through a credit scoring system. The increased prevalence of credit scoring has dramatically reduced underwriting costs for both small and large banks. According to Charles Tansey, Wells Fargo or Banc One (he could not remember which) stated that credit scoring has reduced the operating costs of soliciting and underwriting small loans by 97%. B. Process By using computers instead of loan officers, credit scoring has:
a. Sped up the loan process b. Cut costs to providers c. Lowered prices to higher scoring applicants while reducing risks to providers d. Provided credit to applicants who never would have been offered credit before,
although at higher prices.
Algorithm variables currently in use include: a. Collateral - equity in home; retirement accounts b. On time bill paying percentage, both business and personal c. Legal form of business d. Average monthly bank balances e. Business successful collections history f. “Overrides” factors that produce a denial even if the score is high enough –
includes bankruptcies C. Is “relationship lending” more or less important? Finance companies are new competitors with smaller banks and are expanding into the SBA lending arena, which puts them in more direct competition with smaller local banks. SBA certified-lender status is based on volume of loans underwritten and loan loss experience, making it very difficult for smaller banks to obtain. “It’s rare for a small community bank to be granted [SBA] certified lender status. That’s really a tremendous marketing advantage...giving these finance companies a tremendous ability to compete against local banks." [Luxman, 1998] With small business owners becoming more comfortable with remote communications, such as the Internet, finance companies may begin to erode the traditional "relationship banking" edge of small local banks. "The big advantage of local banks is their ability to provide a one-on-one focus and their understanding of the small business client. But we [finance companies] are providing that one-

Supply-Side Scan of Microenterprise Financing Page 13 of 17 ©FIELD/The Aspen Institute All rights reserved. Printed in the United States of America
on-one focus and understanding better than the local banks," explains Advanta’s Noles. "Small businesses," he continues, "are more and more disenchanted with what they get from their local bank. In many cases their local bank is now part of a larger institution and the focus on small business lending may suffer." [Luxman, 1998] The implication of the emphasis on credit scoring is the decoupling of physical presence and underwriting efficacy. For instance, Wells Fargo has at least 5% of the small business lending market (under $250,000 in credit extension) in many markets where they lack any physical presence. D. The effect of credit scoring on small business lending in low- and moderate-
income areas and rural areas Large banks using small business credit scoring lend on average $16.4 million more to small businesses located in LMI census tracts than non-scorers in the same area. Credit scoring increases small business lending by decreasing information gaps. LMI areas benefit from technological advances and they benefit more than higher income areas. [Frame, Padhi and Woosley, 2001] Wells Fargo commands significant market share in rural areas where they have no physical presence. This expansion into areas where Wells has no physical presence is a relatively new focus for the bank, and includes some experimenting in rural areas. Line bankers report that reach into rural areas has been anemic. [Multiple Interviews]
Supply-Side Scan of Microenterprise Financing Page 14 of 17 ©FIELD/The Aspen Institute All rights reserved. Printed in the United States of America
Finding #4: For-profit providers of commercial loans of less than $35,000 are aggressively reaching “down market”) by using credit cards as the primary product vehicle and credit scoring as the decision-making methodology. Support: A. Size and share of the credit cards market In the last decade, banks have seriously stepped up their small-business lending by making credit cards available to a larger pool of businesses, thanks in part to better credit-scoring methods. [Charles Ou, Senior Economist for the SBA Office of Advocacy, quoted in CEO Magazine, “House of Plastic,” July 2005.] Credit cards have made capital dramatically more accessible for many entrepreneurs. The $500 billion corporate credit card industry includes corporate (travel and entertainment) cards, purchasing cards, and fleet cards, as well as new products such as payroll cards, prepaid corporate cards, and corporate debit cards. [Market Research.com, 2004 Report] There are over 48 million cards in circulation with 13 million business card users. Transaction volume hit $495 billion in 2004 and is expected to approach $1.5 trillion in 2009. [Market Research.com. 2004 Report] “Competition Shifts from Fortune 500 to Small Business,” is a chapter in a report (available for $3,000 from Marketresearch.com, entitled “U.S. Market for Corporate Credit Cards and Purchasing Cards - 4th Edition, 2004 “) that provides data currently not available in the public realm, such as estimated market size and market share of the business credit card market. Data on credit card use by micro- and small businesses is inconsistent:
According to the 1998 Fed Survey, 45% of small business owners used a personal credit card for business and 33% had a designated business card. Credit card use by small businesses jumped 10% between 2001 and 2002. (Mitchell and Pearce, May 2005).
NFIB: 82% of business owners used a credit card to finance their business, and of that, 15% used personal cards as a primary source of working capital.
The number of micro and small businesses that use credit cards as a source of funding is surprisingly small—14% in the micromarket and only 6% in the small business market. The number of small businesses that use cards for borrowing has actually declined significantly over the last two years, from 11% in 2001 to 6% in 2002. [Informa]
Regardless of the actual market size, the numbers indicate that credit cards – both personal cards and business cards – provide small businesses with an important source of funding. Reasons for credit card popularity: For small loans, credit cards offer less rigorous application requirements in exchange for higher interest rates. The main reason cited by microbusinesses is easier access to credit [Informa]:
33% identified time savings, simplicity, or convenience 33% 12% preferred the option of making a single payment 55% believed credit cards provide easier access to credit
Companies have a preference for institutional banking relationships that can grow as the business matures. As the complexity of a company’s credit needs grows and varies depending

Supply-Side Scan of Microenterprise Financing Page 15 of 17 ©FIELD/The Aspen Institute All rights reserved. Printed in the United States of America
on the object of the financing, companies choose their lead credit provider based mainly on price (rates and fees), but are price insensitive when choosing credit card convenience. The 2004 Advanta Annual Report claimed that finance companies compete with credit cards by emphasizing a different value proposition to the borrower, evidenced by the volume of lending.
“Value proposition” means correct product attributes priced correctly. We can’t argue with the volumes other than to say that the rush to credit cards for business looks like a definition of poor financial literacy in this country, combined with a lack of obvious and easy alternatives.” [Luxman, 1998]
Ninety percent of Advanta’s business card market is firms with 20 or fewer employees and sales of $1 million or less and that have been in business for at least two years. Advanta extends unsecured lines of credit of up to $30,000 at an average rate of prime plus 700 basis points. [2004 Advanta Annual Report] Advanta is decoupling the purpose of the loan from the term of the loan. Historically, companies who needed working capital loans were required to reapply for the loan (usually structured as a line) after one year. Equipment loans could be five to seven years. Today, for-profit business lenders do not associate loan purpose and loan term. This means that entrepreneurs can be using credit card debt for short-term assets, but paying for them long after they have left the entrepreneur’s balance sheet. This was formerly not a permissible act for bankers because it puts entrepreneurs in a more precarious financial situation. E. Credit cards are the product used for the riskier “down market” borrowers as a
Source of Business Credit
Credit Type Total Small Business* Woman Owned Minority and Hispanic Owned
Any Credit 82.5% 78.2% 76.9%
Traditional Credit 55.0 46.1 49.0
Business Credit Cards 34.1 28.8 28.6
Personal Credit Cards 46.0 47.5 45.5
* Small business is defined as businesses with fewer than 500 employees. Source: Tabulation from Federal Reserve Board’s Survey of Small Business Finances, 1998. NB: Data from the Federal Reserve Board Survey of Small Businesses Finances, 2003 are
currently being prepared. Credit card usage is more prevalent in younger and smaller firms, which are less likely to have an established banking relationship. [Luxman, 1998] According to NFIB, 34% of firms less than 4 years old rely on credit cards, while only 16% of firms over 35 years old relied on them.

Supply-Side Scan of Microenterprise Financing Page 16 of 17 ©FIELD/The Aspen Institute All rights reserved. Printed in the United States of America
Finding #5: The profile of a successful applicant for microcredit from a for-profit provider is fluid. Support: Banks continue to refine credit scoring methodology and the reason for declinations. Most acceptances will continue to be for credit cards, although credit cards are not an appropriate vehicle for low-income populations given the expense and punitive terms and conditions, which have been made more unforgiving by the new bankruptcy law. Bank underwriting for a small business often combines the credit score with other factors to create a new, proprietary score. For instance, the credit score is combined with minimum net worth4 (3:1 debt to worth), minimum profitability (such as 1.15 historical debt service coverage), and minimum collateral requirements (a score for each of the traditional five “c” categories). If the borrower fails any of these tests, they are denied a loan. Loan approvals on the basis of credit scoring have increasingly separated the risk tied to a single credit test and the borrower’s potential to default on his/her obligations. Factors included in a scoring matrix differ from lender to lender and the intended purpose of the loan (e.g., whether it is for personal or commercial use). Lenders may also vary the scoring threshold for approval pending the intended use of credit. The revolution in small business credit card lending has occurred because, as credit scoring models have improved in predicting repayment probability, banks have found that the credit scores alone are sufficient for making a loan decision. Credit cards are unsecured loans, but they are so profitable that lenders tolerate higher default rates in this niche. Today, lenders are making decisions on these higher risk credit vehicles based on a limited assessment of risk and no knowledge of borrower circumstances, other than the borrower’s past credit history. Loan decision-making has become more fluid as lenders experiment with credit scoring models. For example, lenders may experiment with the repayment history of renters with otherwise good credit scores. Historically, being a renter rather than a homeowner automatically triggered a declination in most lenders’ proprietary scoring systems. Lenders will continue to experiment with factors that have traditionally been negative, such as renting, or the frequency or reason for a bankruptcy, and will discover the healthier gaps that microlenders have been filling (medical costs as a reason for a bankruptcy, for instance). Reasons for declinations will continue to shrink over time as the credit risks in these market segments is better understood by mainstream, for-profit lenders. [Interview with Susan Streich, Capital One] Credit extensions will continue to grow for high cost, highly punitive credit cards. The costs can run higher than stated rates since terms and conditions of credit card are structured to give preference to the lender. For instance, if a credit card holder is late on paying any other credit card or debt, a credit card company can increase the interest rate on the credit cards not affected by the late payment at will and without notice. Also, with the new bankruptcy law, credit card debt, although easy to obtain, will be difficult to forgive. Non-profit providers could benefit from either partnering with a for-profit provider who will reveal their reasons for declinations (as the bank members of Lenders for Community Development in San Jose, CA, have) or developing their own proficiency in credit scoring to cut operating costs.
4 Although lenders interviewed for this research did not reveal the specific value of this ratio, it has been a traditional metric used in the industry.

Supply-Side Scan of Microenterprise Financing Page 17 of 17 ©FIELD/The Aspen Institute All rights reserved. Printed in the United States of America
Finding #6: “Gaps” still exist in credit availability for small businesses that non-profit microlenders can fill; however, borrowers in this niche are increasingly marginal and risky. Support: The banking industry wants to work with more microbusinesses and some banks plan to add targeted advertising for their services, said James Ballentine, director of community and economic development of the American Bankers Association. But he noted that banks typically have stricter standards for collateral than microlenders. [ABC News, June 15, 2005] Since finance companies rely more heavily on credit scoring and analysis of commercial credit reports through Dun & Bradstreet (because of their inability to closely monitor a local borrower), potential borrowers who are marginally creditworthy or seeking to finance start-up ventures may not be adequately served. [Luxman, 1998] Potential credit gaps:
a) Start-ups – Defined as borrowers with insufficient operating history. The number of months needed to establish operating history varies by source anywhere from twelve to 24 months. (Entrepreneurs often borrow with personal credit cards or against the equity in their homes during the start-up phase of their business.)
b) Borrowers with FICO credit scores (FICO is the most frequently used, but there are
hundreds of different credit scoring methodologies) below 680
c) Borrowers with no credit history and therefore no credit score
d) Businesses of types on the “watch list” See watch list data below.
e) Business owners with no wealth and no collateral, who fail the net worth standards of various banks (although banks won’t reveal the standard they use, this usually means a debt to worth ratio of less than 4:1)
f) Borrowers whose credit scores create paperwork problems or other bottlenecks for the
lenders’ systems, such as a discrepancy between phone numbers reported on a loan application and in a credit report (This is a “fraud alert” that currently disqualifies the applicant.)
g) Borrowers requiring a high level of one-on-one service or with language or cultural
barriers, such as refugees, asylees and immigrants
h) Borrowers needing under $50,000
i) Borrowers with “overrides” or factors that turn a positive credit score (above 680) into a denial. These include bankruptcies, renters instead of homeowners, and fraud alerts (mismatched social security numbers from different sources, for instance).
j) Borrowers who require a longer repayment period than is typically provided for the type of
loan (e.g. requiring a longer repayment period for a working capital loan) k) Borrowers with physical challenges

Supply-Side Scan of Microenterprise Financing APPENDIX A - 1 ©FIELD/The Aspen Institute All rights reserved. Printed in the United States of America
APPENDIX A – List of Non-Bank For-Profit Credit Providers Factoring Companies Thousands of small factors operate in the U.S. Among larger factors, consolidation and concentration rule. It is thought that the CIT Group, GMAC Credit Corporation (formerly Bank of New York’s factoring division), and Bank of America, together, control up to $55 billion of the total American market of $300 billion. Other large factors include Capital Factors Inc., Century Business Credit, The Finova Group, First Factors (GE Capital), Heller Financial Inc., (import/export factoring only), Republic Business Credit, and SunTrust Bank. America’s major banks either wholly or partially own the majority of these larger factors. Asset-Based Lending Asset-based lenders lend to larger companies (small = unprofitable) who may have uneven cash flow, and thus be challenged to repay a loan from the business’ cash flow, the traditional primary source of repayment, but tend to be collateral rich. Asset-based lenders rely on a borrower’s assets as the primary source of repayment, not the cash flow of the business. The larger, public asset-based lenders are: Advance America, Cash Advance Centers, Inc. Advanta Corp. AeroCentury Corp. American Asset Management Corporation American Business Financial Services, Inc. American Express Company American Express Credit Corporation American General Finance Corporation AmeriCredit Corp. Anza Capital Inc. Asset Acceptance Capital Corp. Asta Funding, Inc. Birch Financial, Inc. Bluegreen Corporation Boeing Capital Corporation California First National Bancorp Capital One Financial Corporation CapitalSource Inc. Cash America International, Inc. Caterpillar Financial Services Corporation
(equipment only) CIT Group Inc. Comdisco Holding Company, Inc. (equipment) CompuCredit Corporation Consumer Portfolio Services, Inc. Cornerstone Ministries Investments, Inc. Credit Acceptance Corporation Cronos Group Delta Financial Corporation Discover Bank Dollar Financial Corp. E-LOAN, Inc. Encore Capital Group, Inc.
First Investors Financial Services Group, Inc. FirstCity Financial Corporation Fog Cutter Capital Group Inc. Franklin Credit Management Corporation GATX Financial Corporation General Electric Capital Corporation General Electric Capital Services Inc. General Motors Acceptance Corporation HSBC Finance Corporation International Lease Finance Corporation
(equipment) Interpool, Inc. Marlin Business Services Corp. MBNA Corporation McGrath RentCorp Metris Companies, Inc. MicroFinancial Incorporated Navistar Financial Corporation Nelnet, Inc. Nicholas Financial, Inc. Ocean West Holding Corporation Ocwen Financial Corporation Ofek Capital Corp. PACCAR Financial Corporation (equipment
only) Paragon Financial Corporation PHH Corporation Portfolio Recovery Associates, Inc. Providian Financial Corporation QC Holdings, Inc. Resource America, Inc. Ryder System, Inc. SLM Corporation
Supply-Side Scan of Microenterprise Financing APPENDIX A - 2 ©FIELD/The Aspen Institute All rights reserved. Printed in the United States of America
ePlus Inc. EquiFin, Inc. Equitex Inc. EZCORP, Inc. Farm Credit System Federal Agricultural Mortgage Corporation Financial Federal Corporation FINOVA Group Inc. First Cash Financial Services, Inc. First Chesapeake Financial Corporation First Financial Corporation
Textron Financial Corporation Transnational Financial Network, Inc. United PanAm Financial Corp. Washtenaw Group, Inc. Wells Fargo WFS Financial Inc. White River Capital, Inc. Williams Scotsman International, Inc. World Acceptance Corporation Xerox Credit Corporation (equipment only) Xponential, Inc.
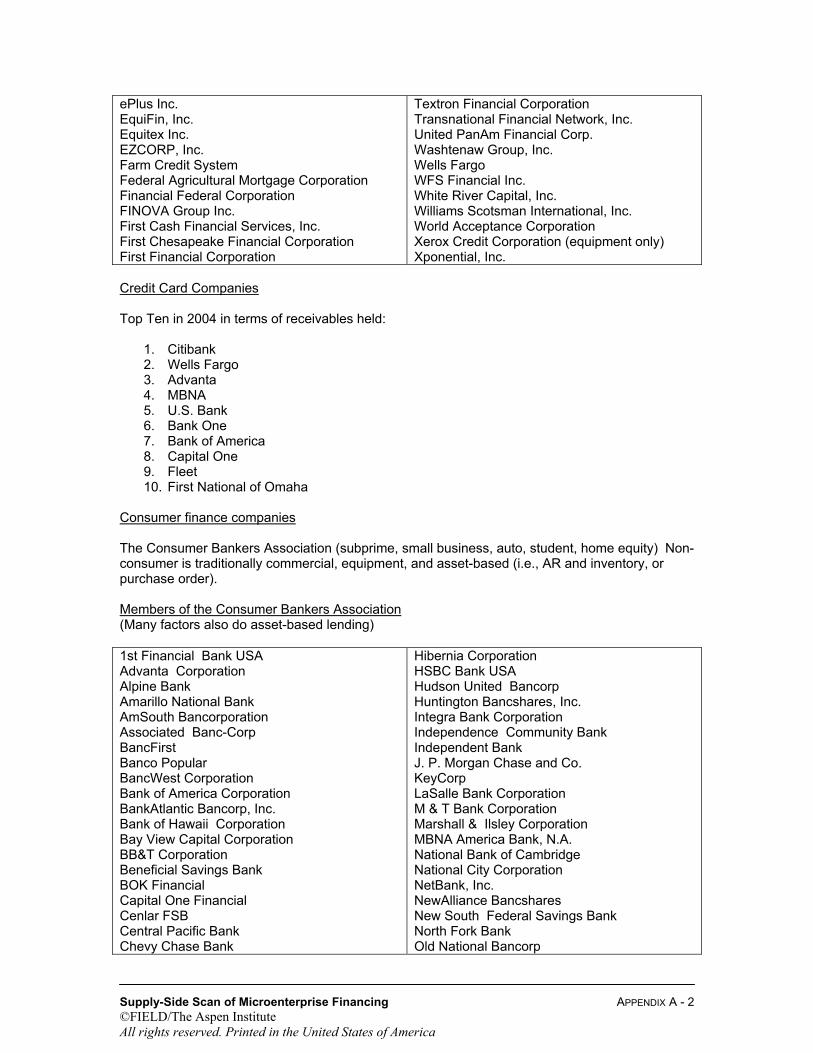
Credit Card Companies Top Ten in 2004 in terms of receivables held:
1. Citibank 2. Wells Fargo 3. Advanta 4. MBNA 5. U.S. Bank 6. Bank One 7. Bank of America 8. Capital One 9. Fleet 10. First National of Omaha
Consumer finance companies The Consumer Bankers Association (subprime, small business, auto, student, home equity) Non-consumer is traditionally commercial, equipment, and asset-based (i.e., AR and inventory, or purchase order). Members of the Consumer Bankers Association (Many factors also do asset-based lending) 1st Financial Bank USA Advanta Corporation Alpine Bank Amarillo National Bank AmSouth Bancorporation Associated Banc-Corp BancFirst Banco Popular BancWest Corporation Bank of America Corporation BankAtlantic Bancorp, Inc. Bank of Hawaii Corporation Bay View Capital Corporation BB&T Corporation Beneficial Savings Bank BOK Financial Capital One Financial Cenlar FSB Central Pacific Bank Chevy Chase Bank
Hibernia Corporation HSBC Bank USA Hudson United Bancorp Huntington Bancshares, Inc. Integra Bank Corporation Independence Community Bank Independent Bank J. P. Morgan Chase and Co. KeyCorp LaSalle Bank Corporation M & T Bank Corporation Marshall & Ilsley Corporation MBNA America Bank, N.A. National Bank of Cambridge National City Corporation NetBank, Inc. NewAlliance Bancshares New South Federal Savings Bank North Fork Bank Old National Bancorp

Supply-Side Scan of Microenterprise Financing APPENDIX A - 3 ©FIELD/The Aspen Institute All rights reserved. Printed in the United States of America
Cigna Financial Services Citigroup Inc. Citizens Financial Group, Inc. Comerica Incorporated Commerce Bancorp, Inc. Commerce Bancshares, Inc. Compass Bancshares, Inc. Cullen/Frost Bankers Inc. Delaware Place Bank Discover Financial Services, Inc. Eastern Bank E*Trade Bank Fidelity Bank Fifth Third Bancorp First American Bank First Citizens BankShares, Inc. First Community CU First Merit Corporation First National of Nebraska, Inc. First Signature Bank & Trust First Tennessee National Corp. First United Bank & Trust Fort Knox National Company GMAC Bank Guaranty Bank, S.S.B. Harris Bankcorp
PNC Financial Services Group Provident Bankshares Corporation Providian Financial Corporation RBC Centura Banks, Inc. Regions Financial Corporation Rockland Trust Company San Antonio Federal Credit Union Sky Financial Sovereign Bancorp, Inc Stock Yards Bank & Trust SunTrust Banks, Inc. TCF Financial Corporation T. D. BankNorth Group, Inc. Tompkins Trustco Trustmark Corporation U.S. Bancorp UnionBanCal Corporation United Bankshares USAA Federal Savings Bank Wachovia Corporation Washington Federal Savings Washington Mutual, Inc. Wells Fargo and Company, Inc. Webster Financial Wilmington Trust Company Zions Bancorp

Supply-Side Scan of Microenterprise Financing APPENDIX B - 1 ©FIELD/The Aspen Institute All rights reserved. Printed in the United States of America
APPENDIX B - Comparison of For-Profit and Nonprofit Microlenders A. A note on pricing for small commercial loans (not lines). With the prime rate in the 6.5%
to 7% range, the following prices are decent references for purposes of comparison (in reality, they should all be thought of in terms 8.5% of spreads over prime, or whatever index they are attached to):
Source Rate Term Collateral Relevant terms and conditions
Banks 8.5%, usually variable unless a real estate loan
Depends on purpose: working capital one year, equipment, 5 years
100% plus coverage required
SBA guaranteed loans
11.5%, can be fixed
Equipment 7 years SBA guarantee can take the place of the collateral, but not in practice always used appropriately
Nonprofit micro lender
12.5% Can mismatch purpose and term
varies
Business credit cards
20%, variable Indeterminate, rolling
none Punitive conditions such as the lender’s right to unilaterally raise interest rates if the borrower defaults on anything reported on the credit report Offer rewards programs
Asset-based lender
8.5% to 20% Can be fixed, variable or rolling
Collateral requirements are usually stringent because cash flow required is weak
Cash flow can be weak
Factor 30% and up NA Conversion of collateral to cash is what repays
Loan Shark 150% Don’t’ ask for an extension!
Payday Lender 400% NA
B. Interviews revealed that both banks and non-bank lenders are targeting the smallest
commercial loans only via credit cards. Other deliveries and more moderately priced products are not profitable enough and there has been no resistance to the high rates.
C. Advantages and disadvantages relative to the nonprofit microlending sector.
Microlenders cannot easily offer revolving lines of credit, which is a distinct disadvantage since credit cards act like a line of credit, can be drawn on an as-need basis, and repaid as cash flow permits. For a company that is using credit cards for working capital and carrying

Supply-Side Scan of Microenterprise Financing APPENDIX B - 2 ©FIELD/The Aspen Institute All rights reserved. Printed in the United States of America
balances, it can be a very expensive mismatch of purpose and term. This is a gap for nonprofit microlenders.
Nonprofit microlenders are not sensitive to borrower needs for convenience. Compared to credit card companies, nonprofit microlenders require borrowers to bare their souls. Nonprofit microlenders have not addressed the issue of price comprehensively. There is much confusion and disagreement in the community around price and a rational pricing strategy. Some microlenders contend that the price is not the issue – that an extra 400 basis points for a small loan should not make the difference between success and failure and that cash flow problems should be handled in other ways such as interest-only periods. A rationale for not matching risk and return or for mismatching purpose and term would further conversations with for-profit lenders. Nonprofit lenders will need to educate funders about how higher pricing strategies support the optimal use of philanthropic dollars. Consistently, consumer practice has proven that customers are not price sensitive when price is hidden, or de-emphasized when compared to convenience and friendliness. Availability, accessibility and convenience and not price of credit appear to be the primary drivers, as stated by Informa; and implied by volume

Supply-Side Scan of Microenterprise Financing APPENDIX C - 1 ©FIELD/The Aspen Institute All rights reserved. Printed in the United States of America
APPENDIX C - “Watch List” Businesses There are two types of “watch list” businesses:
1. Businesses with which banks have had statistically high loss rates and that they now avoid; and
2. Businesses that the SBA will not finance because of restrictions arising from the use of
public funds versus an inherent risk in the industry. Type 1: High Loss Experience Watch List Restaurants Dry Cleaners Farming or Ranching Gift Shops, depending on location (e.g., the middle of West Yosemite, Wyoming might not be
a problem) Mining Fishing vessels or fishing businesses Medical Facilities and Clinics Franchises are problematical
Type 2: SBA Ineligible Businesses Multi-Sales Distribution Gambling Real estate investment or lending Charitable or religious institutions

Supply-Side Scan of Microenterprise Financing APPENDIX D - 1 ©FIELD/The Aspen Institute All rights reserved. Printed in the United States of America
Appendix D – Lenders Participating in the Community Express Program in Fiscal Year 2005; and Community Express Program Loan Statistics from Program Launch through FYE 2004 (6/1/99 – 9/30/04) 1. American National Bank (Nebraska) 25. First National Bank of Omaha 2. American Savings Bank, FSB 26. Fremont National Bank and Trust Company 3. Banco Popular North America 27. Great Western Bank 4. Bank of Bennington 28. Gulf Coast Bank 5. Bank of Hawaii 29. Heritage Bank 6. Bank of Kremlin 30. Innovative Bank 7. Bank of the Sierra 31. JPMorgan Chase Bank, National Assn 8. Bank of the West (El Paso) 32. Kishacoquillas Valley National Bank 9. Bank One, National Association (Ohio) 33. LaSalle Bank, National Association 10. BankFirst (NE) 34. Louisville Community Development Bank 11. Business Loan Center, LLC 35. M&I Marshall & Ilsley Bank 12. Central Pacific Bank 36. NebraskaLand National Bank 13. Central Valley Community Bank 37. Pacific Capital Bank, NA 14. Citizens Bank of Massachusetts 38. Passumpsic Savings Bank 15. CoBiz Bank, National Association 39. Platte Valley State Bank & Trust Company 16. Commerce Bank, National Association (NJ) 40. S & C Bank 17. County Bank 41. State Bank, The 18. Dollar Bank, a Federal Savings Bank 42. TierOne Bank 19. Emporia State Bank and Trust Company 43. U.S. Bank National Association 20. Enterprise Bank 44. Union Bank and Trust Company (NE) 21. First Commercial Bank 45. Visalia Community Bank 22. First Commonwealth Bank 46. Wells Fargo Bank, National Association 23. First Community Bank (KS) 47. Western Commerce Bank 24. First National Bank (California) 48. Woodforest National Bank
Supply-Side Scan of Microenterprise Financing APPENDIX D - 2 ©FIELD/The Aspen Institute All rights reserved. Printed in the United States of America
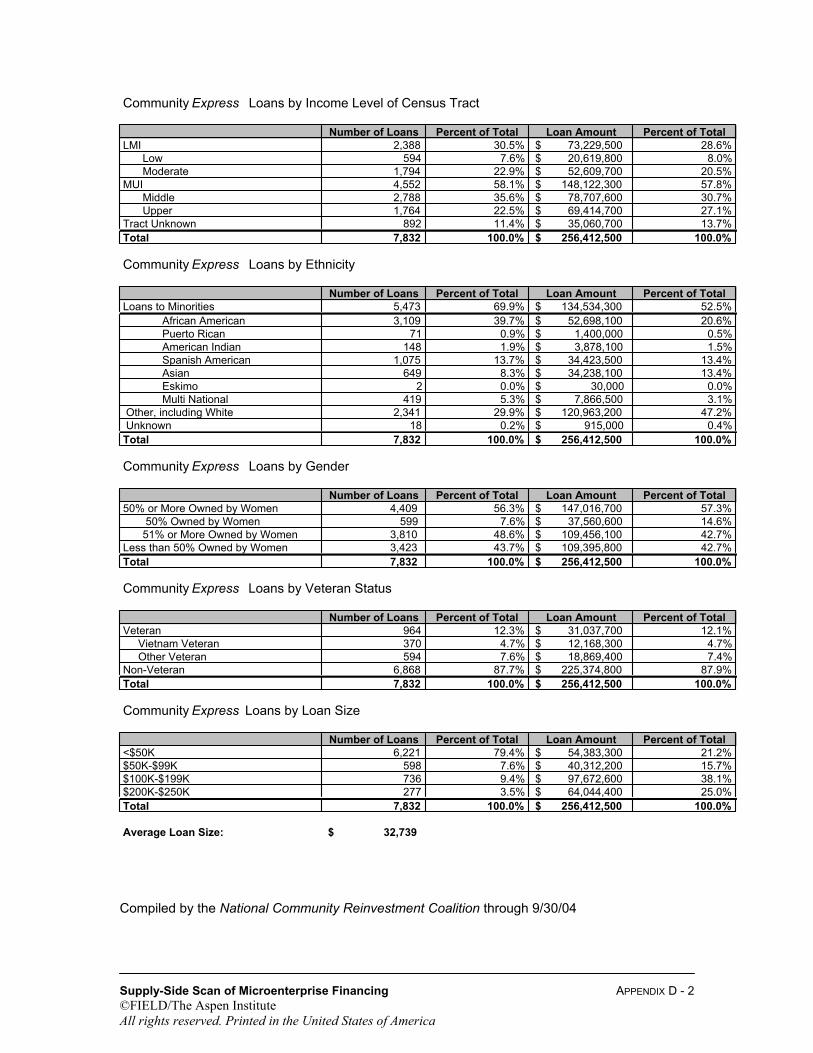
Community Express Loans by Income Level of Census Tract
Number of Loans Percent of Total Loan Amount Percent of TotalLMI 2,388 30.5% 73,229,500$ 28.6%
Low 594 7.6% 20,619,800$ 8.0%Moderate 1,794 22.9% 52,609,700$ 20.5%
MUI 4,552 58.1% 148,122,300$ 57.8%Middle 2,788 35.6% 78,707,600$ 30.7%Upper 1,764 22.5% 69,414,700$ 27.1%
Tract Unknown 892 11.4% 35,060,700$ 13.7%Total 7,832 100.0% 256,412,500$ 100.0%
Community Express Loans by Ethnicity
Number of Loans Percent of Total Loan Amount Percent of TotalLoans to Minorities 5,473 69.9% 134,534,300$ 52.5%
African American 3,109 39.7% 52,698,100$ 20.6%Puerto Rican 71 0.9% 1,400,000$ 0.5%American Indian 148 1.9% 3,878,100$ 1.5%Spanish American 1,075 13.7% 34,423,500$ 13.4%Asian 649 8.3% 34,238,100$ 13.4%Eskimo 2 0.0% 30,000$ 0.0%Multi National 419 5.3% 7,866,500$ 3.1%
Other, including White 2,341 29.9% 120,963,200$ 47.2% Unknown 18 0.2% 915,000$ 0.4%Total 7,832 100.0% 256,412,500$ 100.0%
Community Express Loans by Gender
Number of Loans Percent of Total Loan Amount Percent of Total50% or More Owned by Women 4,409 56.3% 147,016,700$ 57.3%
50% Owned by Women 599 7.6% 37,560,600$ 14.6%51% or More Owned by Women 3,810 48.6% 109,456,100$ 42.7%
Less than 50% Owned by Women 3,423 43.7% 109,395,800$ 42.7%Total 7,832 100.0% 256,412,500$ 100.0%
Community Express Loans by Veteran Status
Number of Loans Percent of Total Loan Amount Percent of TotalVeteran 964 12.3% 31,037,700$ 12.1% Vietnam Veteran 370 4.7% 12,168,300$ 4.7% Other Veteran 594 7.6% 18,869,400$ 7.4%Non-Veteran 6,868 87.7% 225,374,800$ 87.9%Total 7,832 100.0% 256,412,500$ 100.0%
Community Express Loans by Loan Size
Number of Loans Percent of Total Loan Amount Percent of Total<$50K 6,221 79.4% 54,383,300$ 21.2%$50K-$99K 598 7.6% 40,312,200$ 15.7%$100K-$199K 736 9.4% 97,672,600$ 38.1%$200K-$250K 277 3.5% 64,044,400$ 25.0%Total 7,832 100.0% 256,412,500$ 100.0%
Average Loan Size: 32,739$ Compiled by the National Community Reinvestment Coalition through 9/30/04

Supply-Side Scan of Microenterprise Financing APPENDIX D - 3 ©FIELD/The Aspen Institute All rights reserved. Printed in the United States of America
Community Express Loans by State
State Number of Loans Loan AmountAlabama 12 164,000$ Alaska 0 -$ Arizona 133 11,786,400$ Arkansas 8 484,000$ California 1,757 69,211,700$ Colorado 78 5,448,500$ Connecticut 14 1,820,000$ Delaware 23 172,000$ District of Columbia 224 1,485,000$ Florida 257 1,961,900$ Georgia 159 1,241,000$ Hawaii 190 1,462,000$ Idaho 2 10,000$ Illinois 276 8,984,600$ Indiana 7 691,500$ Iowa 16 694,900$ Kansas 52 470,000$ Kentucky 52 3,073,900$ Louisiana 246 9,574,600$ Maine 0 -$ Maryland 751 5,463,000$ Massachusetts 53 4,195,600$ Michigan 189 6,615,300$ Minnesota 37 1,875,800$ Mississippi 35 415,000$ Missouri 33 1,838,500$ Montana 71 680,000$ Nebraska 166 11,651,400$ Nevada 179 1,822,500$ New Hampshire 0 -$ New Jersey 13 310,400$ New Mexico 16 937,700$ New York 88 3,193,300$ North Carolina 157 1,046,000$ North Dakota 1 5,000$ Ohio 101 8,820,100$ Oklahoma 168 2,539,200$ Oregon 9 51,000$ Pennsylvania 275 14,077,500$ Rhode Island 4 245,000$ South Carolina 16 140,400$ South Dakota 8 208,000$ Tennessee 8 365,000$ Texas 1,472 59,714,400$ Utah 0 -$ Vermont 8 1,071,800$ Virginia 300 2,912,000$ Washington 9 550,300$ West Virginia 58 415,000$ Wisconsin 101 6,517,300$ Wyoming 0 -$ Total 7,832 256,412,500$
Compiled by the National Community Reinvestment Coalition through 9/30/04

Supply-Side Scan of Microenterprise Financing APPENDIX D - 4 ©FIELD/The Aspen Institute All rights reserved. Printed in the United States of America
Community Express State Rankings
State Number State AmountCalifornia 1,757 California 69,211,700$ Texas 1,472 Texas 59,714,400$ Maryland 751 Pennsylvania 14,077,500$ Virginia 300 Arizona 11,786,400$ Illinois 276 Nebraska 11,651,400$ Pennsylvania 275 Louisiana 9,574,600$ Florida 257 Illinois 8,984,600$ Louisiana 246 Ohio 8,820,100$ District of Columbia 224 Michigan 6,615,300$ Hawaii 190 Wisconsin 6,517,300$ Total 5,748 Total 206,953,300$ All Other States 2,084 All Other States 49,459,200$ Grand Total 7,832 Grand Total 256,412,500$
Number of Loans Loan Amount
CommunityExpress State Rankings by Number of Loans
California
Texas
Maryland
Virginia
Illinois
Pennsylvania
Florida
Louisiana
District of Columbia
Hawaii
0 500 1,000 1,500 2,000
Stat
e
Number
Compiled by the National Community Reinvestment Coalition through 9/30/04
Supply-Side Scan of Microenterprise Financing APPENDIX D - 5 ©FIELD/The Aspen Institute All rights reserved. Printed in the United States of America
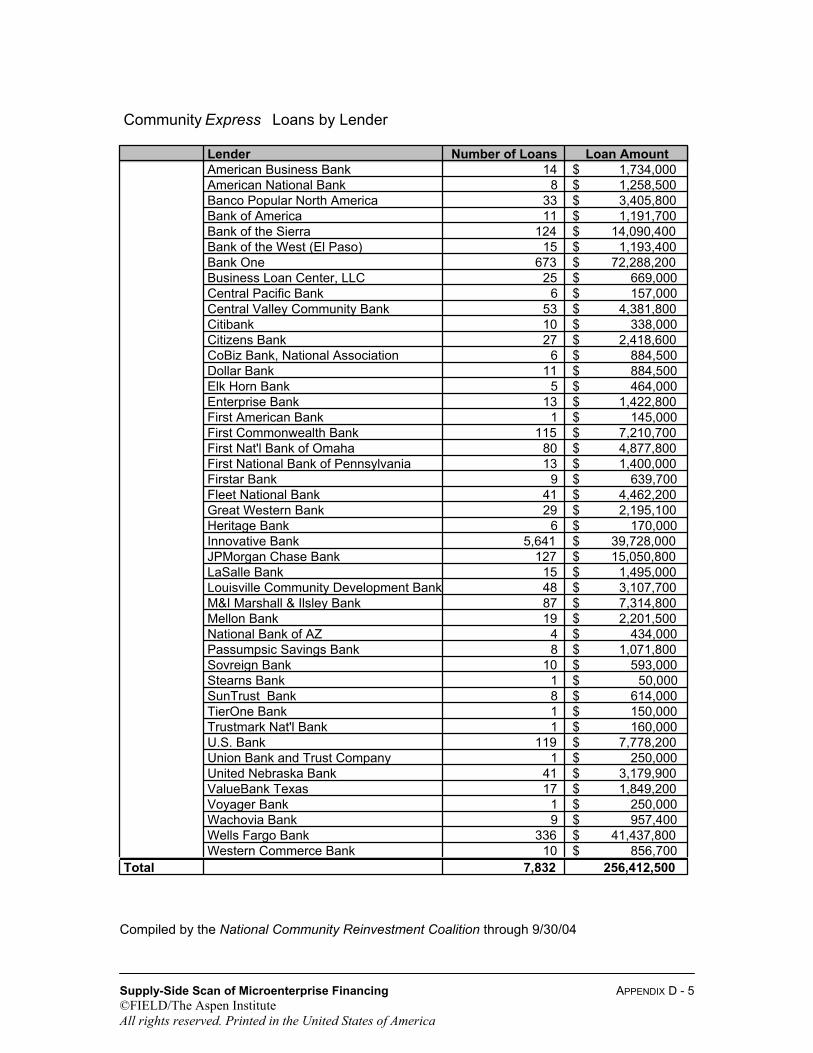
Community Express Loans by Lender
Lender Number of Loans Loan AmountAmerican Business Bank 14 1,734,000$ American National Bank 8 1,258,500$ Banco Popular North America 33 3,405,800$ Bank of America 11 1,191,700$ Bank of the Sierra 124 14,090,400$ Bank of the West (El Paso) 15 1,193,400$ Bank One 673 72,288,200$ Business Loan Center, LLC 25 669,000$ Central Pacific Bank 6 157,000$ Central Valley Community Bank 53 4,381,800$ Citibank 10 338,000$ Citizens Bank 27 2,418,600$ CoBiz Bank, National Association 6 884,500$ Dollar Bank 11 884,500$ Elk Horn Bank 5 464,000$ Enterprise Bank 13 1,422,800$ First American Bank 1 145,000$ First Commonwealth Bank 115 7,210,700$ First Nat'l Bank of Omaha 80 4,877,800$ First National Bank of Pennsylvania 13 1,400,000$ Firstar Bank 9 639,700$ Fleet National Bank 41 4,462,200$ Great Western Bank 29 2,195,100$ Heritage Bank 6 170,000$ Innovative Bank 5,641 39,728,000$ JPMorgan Chase Bank 127 15,050,800$ LaSalle Bank 15 1,495,000$ Louisville Community Development Bank 48 3,107,700$ M&I Marshall & Ilsley Bank 87 7,314,800$ Mellon Bank 19 2,201,500$ National Bank of AZ 4 434,000$ Passumpsic Savings Bank 8 1,071,800$ Sovreign Bank 10 593,000$ Stearns Bank 1 50,000$ SunTrust Bank 8 614,000$ TierOne Bank 1 150,000$ Trustmark Nat'l Bank 1 160,000$ U.S. Bank 119 7,778,200$ Union Bank and Trust Company 1 250,000$ United Nebraska Bank 41 3,179,900$ ValueBank Texas 17 1,849,200$ Voyager Bank 1 250,000$ Wachovia Bank 9 957,400$ Wells Fargo Bank 336 41,437,800$ Western Commerce Bank 10 856,700$
Total 7,832 256,412,500 Compiled by the National Community Reinvestment Coalition through 9/30/04
Supply-Side Scan of Microenterprise Financing APPENDIX D - 6 ©FIELD/The Aspen Institute All rights reserved. Printed in the United States of America
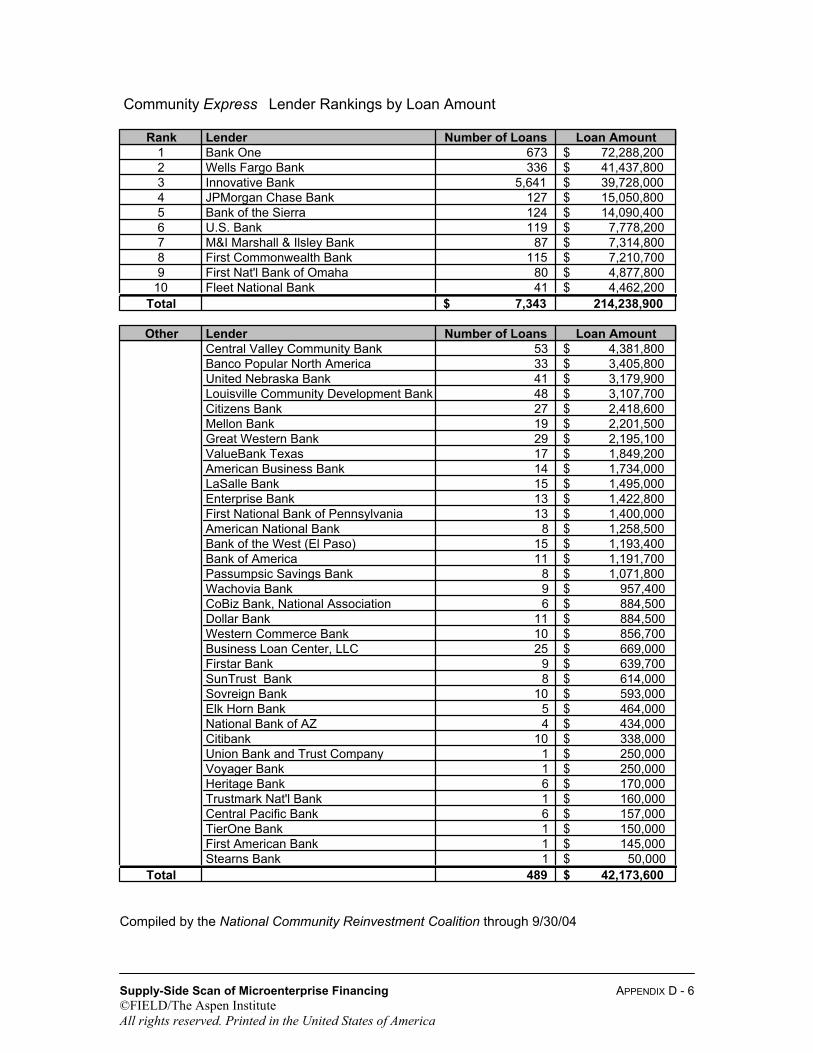
Community Express Lender Rankings by Loan Amount
Rank Lender Number of Loans Loan Amount1 Bank One 673 72,288,200$ 2 Wells Fargo Bank 336 41,437,800$ 3 Innovative Bank 5,641 39,728,000$ 4 JPMorgan Chase Bank 127 15,050,800$ 5 Bank of the Sierra 124 14,090,400$ 6 U.S. Bank 119 7,778,200$ 7 M&I Marshall & Ilsley Bank 87 7,314,800$ 8 First Commonwealth Bank 115 7,210,700$ 9 First Nat'l Bank of Omaha 80 4,877,800$
10 Fleet National Bank 41 4,462,200$ Total 7,343$ 214,238,900
Other Lender Number of Loans Loan AmountCentral Valley Community Bank 53 4,381,800$ Banco Popular North America 33 3,405,800$ United Nebraska Bank 41 3,179,900$ Louisville Community Development Bank 48 3,107,700$ Citizens Bank 27 2,418,600$ Mellon Bank 19 2,201,500$ Great Western Bank 29 2,195,100$ ValueBank Texas 17 1,849,200$ American Business Bank 14 1,734,000$ LaSalle Bank 15 1,495,000$ Enterprise Bank 13 1,422,800$ First National Bank of Pennsylvania 13 1,400,000$ American National Bank 8 1,258,500$ Bank of the West (El Paso) 15 1,193,400$ Bank of America 11 1,191,700$ Passumpsic Savings Bank 8 1,071,800$ Wachovia Bank 9 957,400$ CoBiz Bank, National Association 6 884,500$ Dollar Bank 11 884,500$ Western Commerce Bank 10 856,700$ Business Loan Center, LLC 25 669,000$ Firstar Bank 9 639,700$ SunTrust Bank 8 614,000$ Sovreign Bank 10 593,000$ Elk Horn Bank 5 464,000$ National Bank of AZ 4 434,000$ Citibank 10 338,000$ Union Bank and Trust Company 1 250,000$ Voyager Bank 1 250,000$ Heritage Bank 6 170,000$ Trustmark Nat'l Bank 1 160,000$ Central Pacific Bank 6 157,000$ TierOne Bank 1 150,000$ First American Bank 1 145,000$ Stearns Bank 1 50,000$
Total 489 42,173,600$ Compiled by the National Community Reinvestment Coalition through 9/30/04

Supply-Side Scan of Microenterprise Financing APPENDIX D - 7 ©FIELD/The Aspen Institute All rights reserved. Printed in the United States of America
CommunityExpress Lender Rankings by Loan Amount
Bank One
Wells Fargo Bank
Innovative Bank
JPMorgan Chase Bank
Bank of the Sierra
U.S. Bank
M&I Marshall & Ilsley Bank
First Commonwealth Bank
First Nat'l Bank of Omaha
Fleet National Bank
$- $20,000,000 $40,000,000 $60,000,000 $80,000,000
Lend
er
Value ($)
Compiled by the National Community Reinvestment Coalition through 9/30/04

Supply-Side Scan of Microenterprise Financing APPENDIX D - 8 ©FIELD/The Aspen Institute All rights reserved. Printed in the United States of America
Percentage of CommunityExpress Loans byCensus Tract Income
Tract Unknown11.4%
Upper22.5%
Middle35.6%
Moderate22.9%
Low7.6%
Percentage of CommunityExpress Loans by Ethnicity
Other, including White30.8%
Multi National4.7%
Asian8.8% Spanish
American13.9%
American Indian1.9%
Puerto Rican0.9%
African American38.8%
Unknown0.2%
Compiled by the National Community Reinvestment Coalition through 9/30/04

Supply-Side Scan of Microenterprise Financing APPENDIX D - 9 ©FIELD/The Aspen Institute All rights reserved. Printed in the United States of America
Percentage of CommunityExpress Loans by Gender
Less than 50% Owned by Women
43.7%
51% or More Owned by Women
48.4%
50% Owned by Women7.9%
Percentage of CommunityExpress Loans by Veteran Status
Other Veteran7.6%
Non-Veteran87.6%
Vietnam Veteran
4.8%
Compiled by the National Community Reinvestment Coalition through 9/30/04

Supply-Side Scan of Microenterprise Financing APPENDIX D - 10 ©FIELD/The Aspen Institute All rights reserved. Printed in the United States of America
Percentage of CommunityExpress Loans by Loan Size
$100K-$199K9.4%
$200K-$250K3.5%
<$50K79.4%
$50K-$99K7.6%
Compiled by the National Community Reinvestment Coalition through 9/30/04

Supply-Side Scan of Microenterprise Financing APPENDIX E - 1 ©FIELD/The Aspen Institute All rights reserved. Printed in the United States of America
APPENDIX E - Bibliography Research Papers from the SBA Office of Advocacy in Chronological Order: Mitchell and Pearce, May 2005, “Availability of Financing to Small Firms Using the Survey of Small Business Finances,” Karlyn Mitchell and Douglas K. Pearce. Haynes, April 2005, “Finance Companies and Small Business Borrowers: Evidence from the 1993 and 1998 Surveys of Small Business Finances,” George W. Haynes. Ou, March 2005, “Banking Consolidation and Small Business Lending: A Review of Recent Research,” Charles Ou. KeyPoint, March 2005, “The Effects of Mergers and Acquisitions on Small Business Lending by Large Banks,” KeyPoint Consulting LLC. March 2005 – “Small Business and Micro Business Lending in the United States, for Data Years 2002-2003,” prepared annually by the Office of Advocacy using Call Report and CRA data from the Federal Reserve Board (historical versions 1994 - 2001). Craig and Hardee, February 2004, “The Impact of Bank Consolidation on Small Business Credit Availability,” Dr. Steven G. Craig and Dr. Pauline Hardee. Kolari, May, 2003, “Assessing the Profitability and Riskiness of Small Business Lenders in the Banking Industry,” James W. Kolari, Texas A&M University, College Station, TX. September 2003, “Financing Patterns of Small Firms: Findings from the 1998 Survey of Small Business Finance.” Zinman, November 2002, “The Real Effects of Liquidity on Behavior: Evidence from Regulation and Deregulation of Credit Markets,” Jonathan Zinman Ou, November 2002, “Small Business Lending in the United States, 2001 Edition”,” Charles Ou. October 2002, “Small Business Lending in the United States for 1994 through 2001” identifies the nation's top small business lending. Includes some farm and rural lending studies prepared by U.S. Small Business Administration’s Office of Advocacy. August 2002, “MicroBusiness-Lending Study 2001” (historical versions 2000, 1999, 1998 (PDF files), 1997, 1996 (HTML Files). This report uses Call Report and Community Reinvestment Act (CRA) data to identify the microbusiness-friendly with significant lending activity in loans under $100,000. 1999, ,“Small Business Lending in the United States, 1998 Edition,” Office of Advocacy, U.S. Small Business Administration, Washington, D.C.. Other Sources in Alphabetical Order, excluding websites: ABC News, June 15, 2005, piece on Credit Availability Ando, Faith. 1988. "Capital Issues and Minority-Owned Business," Review of Black Political Economy 16 (4): 77-109.

Supply-Side Scan of Microenterprise Financing APPENDIX E - 2 ©FIELD/The Aspen Institute All rights reserved. Printed in the United States of America
Blanchflower, David G., Phillip B. Levine, and David J. Zimmerman. 1998. “Discrimination in the Small Business Credit Market,” National Bureau of Economic Research Working Paper No. 6840. Bostic, Raphael W. and Glenn B. Canner. 1998. "New Information on Lending to Small Businesses and Small Farms: The 1996 CRA Data," Federal Reserve Bulletin 84 (1): 1-21. Bureau of Labor Statistics, “Why Size Class Methodology Matters in Analyses of Net and Gross Job Flows,” at www.bls.gov/opub/mlr/mlrhome.htm. Business Employment Dynamics data are available from www.bls.gov/bdm/home.htm. Business Week, May 2002, Credit Scoring Series Cavalluzzo, Ken S., Linda C. Cavalluzzo, and John D. Wolken. 1999. “Competition, Small Business Financing, and Discrimination: Evidence from a new Survey,” in Jackson L. Blanton, Alicia Williams, and Sherrie L. W. Rhine (ed.) Business Access to Capital and Credit Washington, D.C.: Federal Reserve System. CEO Magazine, “House of Plastic,” July 2005. Federal Financial Institutions Examination Council. 1996. "Community Reinvestment Act Interagency Questions and Answers Regarding Community Reinvestment," Richmond: Federal Reserve Bank of Richmond, October 21. ___ ------------. 1997. "Findings from Analysis of Nationwide Summary Statistics for 1996 CRA Data Fact Sheet," Washington, D.C.: Federal Financial Institutions Examination Council. September 1997. ----------. 2000. “Availability of Data on Small Business, Small Farm, and Community Development Lending,” Washington, D.C.: Federal Financial Institutions Examination Council. August 2000. Federal Reserve System, “Report to Congress on the Availability of Credit to Small Businesses,.” September 2002, Report to Congress by the Board of Governors of the Federal Reserve System. _______, "Remarks by Chairman Alan Greenspan at a Community Forum on Community Reinvestment and Access to Credit: California's Challenge, Los Angeles, California," January 12, 1998, http://www.bog.frb.fed.us/boarddocs/speeches/19980112.htm. Immergluck, Daniel and Marti Wiles. 2000. “Where Banks do Business: Small Business Lending Patterns in the Chicago Area, 1996-1998.” Chicago: The Woodstock Institute. Informa Research Services, Inc., 2002 Micro and Small Business Market Study. Luxman, Nathan, “Enterprising,” Federal Reserve Bank of Boston, Communities and Banking Newsletter, Fall 1998. Marcus, Marnie, “Are Small Businesses Concerned about Credit,” Federal Reserve Bank of Boston, Communities and Banking, Fall 2004 MarketResearch.com, “U.S. Market for Corporate Credit Cards and Purchasing Cards - 4th Edition, 2004,” available at http://www.marketresearch.com/product/display.asp?productid=972915 Marsico, Richard D. "The New Community Reinvestment Act Regulations: An Attempt to Implement Performance-Based Standards," Clearinghouse Review March 1996: 1021-1030. Nieman, Kimbra, Survey of Small Business Lending Products, 2003, Woodstock Institute
Supply-Side Scan of Microenterprise Financing APPENDIX E - 3 ©FIELD/The Aspen Institute All rights reserved. Printed in the United States of America
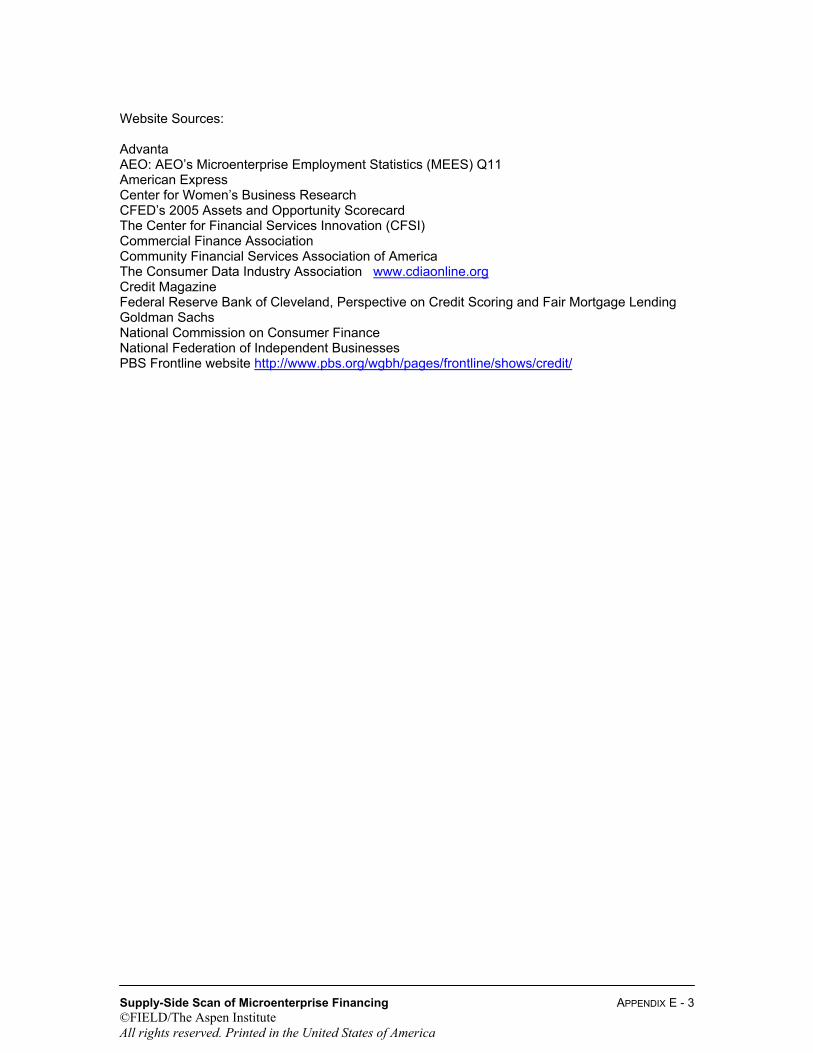
Website Sources: Advanta AEO: AEO’s Microenterprise Employment Statistics (MEES) Q11 American Express Center for Women’s Business Research CFED’s 2005 Assets and Opportunity Scorecard The Center for Financial Services Innovation (CFSI) Commercial Finance Association Community Financial Services Association of America The Consumer Data Industry Association www.cdiaonline.org Credit Magazine Federal Reserve Bank of Cleveland, Perspective on Credit Scoring and Fair Mortgage Lending Goldman Sachs National Commission on Consumer Finance National Federation of Independent Businesses PBS Frontline website http://www.pbs.org/wgbh/pages/frontline/shows/credit/

Supply-Side Scan of Microenterprise Financing APPENDIX F - 1 ©FIELD/The Aspen Institute All rights reserved. Printed in the United States of America
APPENDIX F – Interviews
1. Ruth Salzman, SVP, Commercial Lending Unit, Community Development, JP Morgan Chase
2. Dorothy Cheung, Regional Sales? (Not sure of her title but responsible for small business
lending for NJ, FLA and PA for Chase)
3. Susan Streich, SBA Business and Relationship Manager, Capital One
4. Dorothy Broadman, Director of Corporate Citizenship, Capital One
5. Kathleen Moore, Communications Manager, Consumer Bankers Association
6. Seeung Kin, Head of SOHO (Small Office/Home Office) Lending, Innovative Bank
7. David Birnbaum, Executive Director, Center for Economic Justice
8. Donald Percival, Professor of Statistics, University of Washington
9. Sam Miller, Senor Vice President, Commercial Lending, Union Bank of California
10. Anonymous, Senior Vice-President, Commercial Lending, Wells Fargo
11. Linda Roy, Sales Executive, Informa Research Services
12. Mike Marselli, President, Informa Research Services
13. Jeff Wells, Chief Credit Officer, Lenders for Community Development
14. Kathleen Burton, Chief Credit Officer, Cascadia Revolving Fund
15. Tina Vlasaty, Senior Credit Officer, Cascadia Revolving Fund
16. Anonymous SVP, head of small business lending, HSBC
17. Anonymous, Economist, Wells Fargo