finding security threats that matter: an industrial case study
TRANSCRIPT

Finding Security Threats That Matter: An Industrial Case StudyKatja Tuma †, Christian Sandberg, Urban Thorsson, Mathias Widman, Riccardo Scandariato †
† University of Gothenburg and Chalmers University of TechnologyAB Volvo
Gothenburg, [email protected],christian.sandberg,urban.thorsson,[email protected],[email protected]
ABSTRACT
Recent trends in the software engineering (i.e., Agile, DevOps) have
shortened the development life-cycle limiting resources spent on
security analysis of software designs. In this context, architecture
models are (often manually) analyzed for potential security threats.
Risk-last threat analysis suggests identifying all security threats
before prioritizing them. In contrast, risk-first threat analysis sug-
gests identifying the risks before the threats, by-passing threat
prioritization. This seems promising for organizations where de-
veloping speed is of great importance. Yet, little empirical evidence
exists about the effect of sacrificing systematicity for high-priority
threats on the performance and execution of threat analysis. To
this aim, we conduct a case study with industrial experts from
the automotive domain, where we empirically compare a risk-first
technique to a risk-last technique. In this study, we consciously
trade the amount of participants for a more realistic simulation
of threat analysis sessions in practice. This allows us to closely
observe industrial experts and gain deep insights into the industrial
practice. This work contributes with: (i) a quantitative comparison
of performance, (ii) a quantitative and qualitative comparison of
execution, and (iii) a comparative discussion of the two techniques.
We find no differences in the productivity and timeliness of dis-
covering high-priority security threats. Yet, we find differences in
analysis execution. In particular, participants using the risk-first
technique found twice as many high-priority threats, developed
detailed attack scenarios, and discussed threat feasibility in detail.
On the other hand, participants using the risk-last technique found
more medium and low-priority threats and finished early.
KEYWORDS
Threat analysis, Risk analysis, STRIDE, Case study, Empirical soft-
ware engineering
ACM Reference Format:
Katja Tuma †, Christian Sandberg, Urban Thorsson, Mathias Widman, Ric-
cardo Scandariato †. 2019. Finding Security Threats That Matter: An Indus-
trial Case Study. In Proceedings of ACM Conference (Conference’17). ACM,
New York, NY, USA, 11 pages. https://doi.org/10.1145/nnnnnnn.nnnnnnn
Permission to make digital or hard copies of all or part of this work for personal or
classroom use is granted without fee provided that copies are not made or distributed
for profit or commercial advantage and that copies bear this notice and the full citation
on the first page. Copyrights for components of this work owned by others than ACM
must be honored. Abstracting with credit is permitted. To copy otherwise, or republish,
to post on servers or to redistribute to lists, requires prior specific permission and/or a
fee. Request permissions from [email protected].
Conference’17, July 2017, Washington, DC, USA© 2019 Association for Computing Machinery.
ACM ISBN 978-x-xxxx-xxxx-x/YY/MM. . . $15.00
https://doi.org/10.1145/nnnnnnn.nnnnnnn
1 INTRODUCTION
Security threats to software systems are a great concern in many
organizations. A recent survey by Ernst & Young [9] shows that 53%
of organizations have increased their cybersecurity budget in the
last year, and further 65% of organizations foresee a further increase
in the coming year. Increased investments in security come as a
response to recent changes in legislation regarding data privacy
(GDPR) and upcoming security standards (e.g., ISO 21434). Studies
have shown [1, 13] that compliance is a key factor for investing in
security. For example, Cavusoglu et al. [1] investigate the influence
of institutional pressures on security investment. The authors find
that aside from normative pressure (manifested from the state-of-
practice), coercive pressure (manifested by perceived pressure from
business partners and pressure from regulations) is one of the key
factors impacting investments in security resources.
Security-by-design techniques help planning for security early
in the design phase where little is known about the system [11]. In
this context, architectural design models are analyzed for security
[5]. Threat analysis techniques facilitate a systematic analysis of the
attacker’s profile, vis-a-vis the assets of value to the organization
[18]. For instance, STRIDE is a well-known threat analysis tech-
nique that is also used in the automotive domain. This technique
has the tendency to produce a high volume of threats [15, 19]. Many
threats are later-on discarded due to a low risk value (a combina-
tion of impact and likelihood). In this respect, STRIDE is a risk-last
approach, where risk is considered only after the threats have beenanalyzed. Note that this way of working is inefficient, as significant
time and effort is spent on discussing unimportant threats.
Many organizations have undergone cultural change and adopted
to agile development practices, cross-functional teams, continuous
integration (CI), development and operations (DevOps), and the
like [3]. Recent trends in software engineering and development
have the ambition to shorten the software development life-cycle.
Release cycles are often shortened to days, or even a few hours. Yet,
analysis of software design for security often requires security ex-
pertise and is time-consuming. Therefore, in this context, software
design is often neither documented nor analyzed for potential secu-
rity issues. Further, practices such as prototyping and refactoring
require repeating entire analysis sessions to determine the impact
of new design decisions on security. Such practices would require
more efficient security-by-design approaches.
The recently proposed eSTRIDE [20] is a risk-first threat analysis
approach. This approach is accompanied by an extended model
notation (eDFD). The model is extended with information about
important assets, security assumptions, and existing security mech-
anisms. These extensions are leveraged during diagram analysis
arX
iv:1
910.
0342
2v1
[cs
.SE
] 8
Oct
201
9
Conference’17, July 2017, Washington, DC, USA Katja Tuma †, Christian Sandberg, Urban Thorsson, Mathias Widman, Riccardo Scandariato †
to focus on critical parts of the architecture, by-passing threat pri-
oritization all together. This seems promising for organizations
with development speed requirements. Yet, little empirical evidence
exists about the effect of sacrificing systematicity for high-priority
threats on threat analysis performance and execution.
The purpose of this study is to gather evidence about the sim-
ilarities and differences between a risk-first and a risk-last threat
analysis technique in an industrial setting. To this aim, we conduct
a case study with industrial participants from the automotive do-
main. The case study is designed to simulate the industrial practice
as much as possible. For instance, the industrial case is selected
by co-authors, who participate in threat analysis sessions of real
cases on a daily basis. Further, we simulate time-constraints that
are present in practice by limiting the amount of available time
to our participants (in total 6 hours for the complete analysis ses-
sion). Finally, this study observes two teams (7 participants in total)
to compare the analysis performance and execution. This design
choice was made explicitly because it allowed us to better monitor
the teams (in total, 9 hours of transcribed recordings) and gain deep
insights about the analysis execution.
The contributions of this work are three-fold: (i) a quantitative
comparison of technique performance, (ii) a quantitative and quali-
tative comparison of technique execution, and (iii) a comparative
discussion of the benefits and shortcomings of two techniques, in
a realistic setting. This study shows no significant differences in
productivity and timeliness of discovering high-priority security
threats. But, we find differences in analysis execution. Specifically,
participants using the risk-first technique found twice asmany high-
priority threats, developed detailed attack scenarios, and discussed
threat feasibility in greater detail. On the other hand, participants
using the risk-last technique found more medium and low-priority
threats and finished early.
The rest of the paper is structured as follows. In Section 2 we
describe the treatments, and in Section 3 we provide the research
questions and design of the case study. Section 4 presents the re-
sults of this work, while Section 5 discusses them. In Section 6 we
position our work in the context of related work. Section 7 discusses
the limitations of this work, and Section 8 gives the concluding
remarks.
2 BACKGROUND
STRIDE is a methodology developed to help people identify the
types of attacks their software systems are exposed to, especially
because of design-level flaws. The name itself is an acronym that
stands for the threat categories of Spoofing, Tampering, Repudia-
tion, Information Disclosure, Denial of Service and Elevation of Priv-
ilege. For the definition of threat categories, we refer the reader to
the documentation of STRIDE [16]. Our study compares two flavors
of STRIDE. The first technique is an example of a risk-last threat
analysis technique, STRIDE-per-element [16] (hereafter Stride).
The second is an example of a risk-first technique, the extended
STRIDE [20] (hereafter eStride). The techniques differ in the model
that is used for the analysis, and in the procedure of the analysis.
In Stride threats are first identified and then prioritized (there-
fore risk-last). The first step is to create a graphical representation
of the system architecture as a Data Flow Diagram (DFD). A DFD
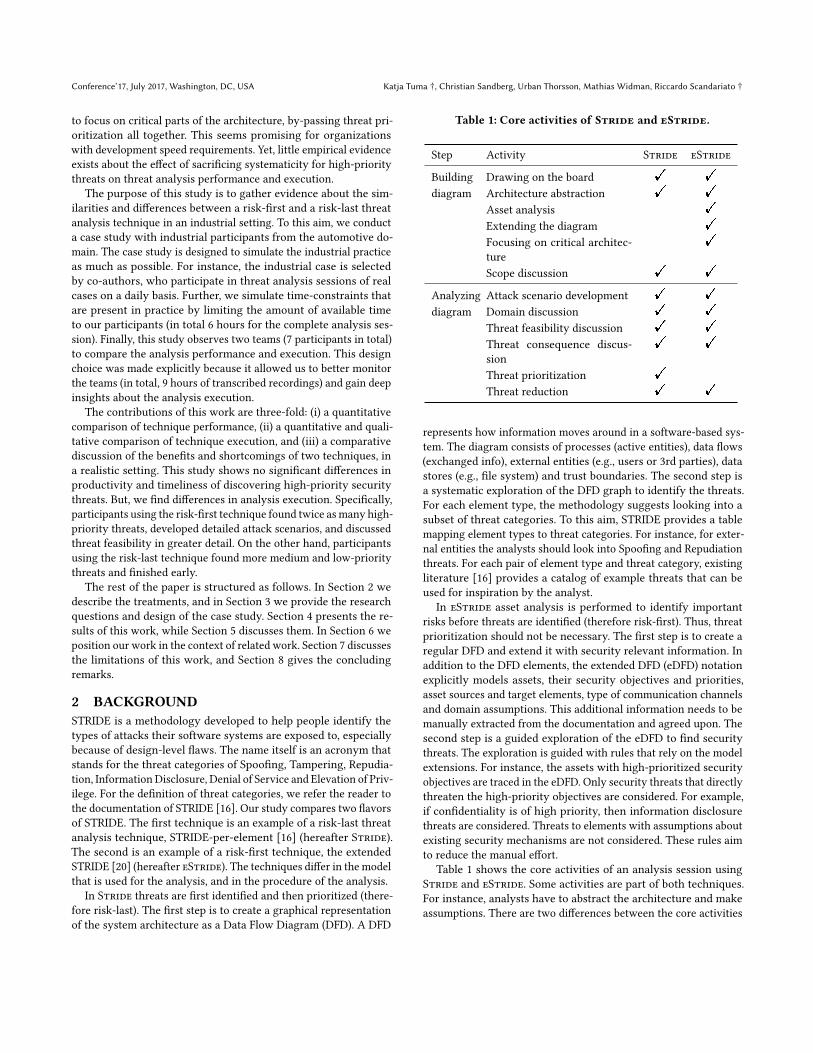
Table 1: Core activities of Stride and eStride.
Step Activity Stride eStride
Building Drawing on the board ! !
diagram Architecture abstraction ! !
Asset analysis !
Extending the diagram !
Focusing on critical architec-
ture
!
Scope discussion ! !
Analyzing Attack scenario development ! !
diagram Domain discussion ! !
Threat feasibility discussion ! !
Threat consequence discus-
sion
! !
Threat prioritization !
Threat reduction ! !
represents how information moves around in a software-based sys-
tem. The diagram consists of processes (active entities), data flows
(exchanged info), external entities (e.g., users or 3rd parties), data
stores (e.g., file system) and trust boundaries. The second step is
a systematic exploration of the DFD graph to identify the threats.
For each element type, the methodology suggests looking into a
subset of threat categories. To this aim, STRIDE provides a table
mapping element types to threat categories. For instance, for exter-
nal entities the analysts should look into Spoofing and Repudiation
threats. For each pair of element type and threat category, existing
literature [16] provides a catalog of example threats that can be
used for inspiration by the analyst.
In eStride asset analysis is performed to identify important
risks before threats are identified (therefore risk-first). Thus, threat
prioritization should not be necessary. The first step is to create a
regular DFD and extend it with security relevant information. In
addition to the DFD elements, the extended DFD (eDFD) notation
explicitly models assets, their security objectives and priorities,
asset sources and target elements, type of communication channels
and domain assumptions. This additional information needs to be
manually extracted from the documentation and agreed upon. The
second step is a guided exploration of the eDFD to find security
threats. The exploration is guided with rules that rely on the model
extensions. For instance, the assets with high-prioritized security
objectives are traced in the eDFD. Only security threats that directly
threaten the high-priority objectives are considered. For example,
if confidentiality is of high priority, then information disclosure
threats are considered. Threats to elements with assumptions about
existing security mechanisms are not considered. These rules aim
to reduce the manual effort.
Table 1 shows the core activities of an analysis session using
Stride and eStride. Some activities are part of both techniques.
For instance, analysts have to abstract the architecture and make
assumptions. There are two differences between the core activities

Finding Security Threats That Matter: An Industrial Case Study Conference’17, July 2017, Washington, DC, USA
of Stride and those of eStride. First, eStride carries out three ad-
ditional activities (i.e., asset analysis, extending diagram, focusing
on critical architecture) during the first step of the analysis. Second,
eStride does not prioritize threats after finding them (i.e., after
diagram analysis).
3 DESIGN OF STUDY
We conduct a case study where we compare the Stride analysis
to the eStride analysis technique. In what follows, we present
the research questions, industrial case used in this study, and our
participants. We also describe the task given to the participants,
the study execution, and the applied data collection methods and
measures.
3.1 Research questions
This study answers research questions about the differences in the
analysis outcomes (RQ1, RQ2) and procedure (RQ3) for the studied
techniques.
RQ1. What are the differences between a risk-last and a risk-firstanalysis technique in terms of productivity?
Risk-last threat analysis prioritizes threats at the end of the
analysis procedure. In contrast, risk-first analysis aims to by-pass
threat prioritization by analyzing the high risks first. The purpose
of the first research question is to understand whether by-passing
threat prioritization in such a way helps to increase the amount
of correctly identified threats per time unit. In this respect, this
research question is focused on investigating the differences in the
analysis outcomes.
RQ2. What are the differences between a risk-last and a risk-firstanalysis technique with respect to the timeliness and amount of dis-covered high-priority threats?
In realistic circumstances, threat analysis sessions are pressed for
time. In this context, achieving complete coverage with a manual
analysis is challenging. Often threats are overlooked [15, 19] even
if having strived for coverage during the analysis. It seems reason-
able to ‘knowingly’ overlook less-important threats as compared to
high-priority threats. The purpose of the second research question
is to investigate whether risk-first analysis leans important threats
faster (and in a larger quantity) when compared to the risk-last
analysis technique. Similarly to RQ1, the second research question
is focused on investigating the differences in the analysis outcomes.
RQ3.What are the differences between a risk-last and a risk-first anal-ysis technique with respect to the timeliness and amount of activitiesand activity patterns?
Apart from the core activities (see Table 1), we observe impor-
tant events and support activities taking place during the threat
analysis session. For instance, updating the diagram, or making an
assumption. Support activities include pointing at the board, taking
a break, documenting, referring to case documentation, etc. Due
to the repetitive nature of manual threat analysis [15, 19], these
activities tend to re-occur. We are interested to investigate which
activities appear more often or sooner in both techniques. In addi-
tion, we observe combinations of activities, or activity patterns to
understand which technique better facilitates constructive thinking.
Therefore, the purpose of the third research question is to inves-
tigate the differences in the appearance of activities and activity
patterns of the studied techniques. Unlike RQ1 and RQ2, the third
research question is focused on investigating the differences in the
analysis procedure.
3.2 Industrial case
The industrial case used in this work is a reference architecture for
an Electronic Control Unit (ECU) update using a mobile application
in a vehicular setting. The reference architecture was provided by
an automotive company. This software is developed to reduce the
vehicle downtime due to workshop visits. The software is compat-
ible with Android and Apple devices and is downloaded from the
Application Store. It is installed on a mobile device controlled by a
driver or a technician. A WiFi dongle is connected to the On-board
diagnostics (OBD) port. The mobile device connects to theWiFi don-
gle to update the ECUs. Device owners (drivers and technicians) are
able to use the mobile app to download ECU software updates from
a remote software repository and install them on the ECUs of their
vehicle. The mobile app follows a procedure before updating the
ECU software (e.g., checking the preconditions, such as device bat-
tery level, vehicle at rest, etc.). Device owners are also able to use the
mobile app to configure certain ECU parameters (depending on their
level of authorization). Similarly, a specific procedure is executed
before updating the ECU parameters. With respect to the confiden-
tiality concerns we omit further details about the industrial case.
3.3 Participants
The participants are industrial experts with experience in threat
analysis. We assembled two teams with 3 (Stride) and 4 members
(eStride). The eStride team had an additional member, a threat
analysis trainee. The authors made sure that the level of expertise
was comparable in the two teams. Each team member had an as-
signed role according to their expertise. We include three roles in
our case study: facilitator, security expert, and domain expert. The
trainee in eStride was assigned the role of a security expert, given
the background of the participant.
Facilitatorswere required to have an understanding of the STRIDEtechnique. They were responsible for leading the session by fol-
lowing the prescribed procedure. The facilitators also drew the
diagrams and handled the documentation.
Security expertswere required to have technical knowledge aboutsecurity mechanisms and attacks associated with critical infras-
tructure systems (e.g., banking and finance, telecommunications,
transportation systems) [4]. They were responsible to extract rel-
evant information from the domain expert and formulate attack
scenarios.
Domain experts were required to have a good over-all under-
standing of the system design and specialized knowledge about
part(s) of the architecture [4]. They were responsible to contribute
with relevant information for finding security threats. Our domain
experts have been employed by the organization for about ten years.
3.4 Task
The two teams were presented with the same task: perform a threat
analysis on the industrial case using the prescribed technique. The
task was divided into two sub-tasks: participants were asked to (1)

Conference’17, July 2017, Washington, DC, USA Katja Tuma †, Christian Sandberg, Urban Thorsson, Mathias Widman, Riccardo Scandariato †
build a diagram based on the provided architectural documenta-
tion of the industrial case and (2) analyze the diagram according
to the assigned technique. The first sub-task required building a
diagram (DFD for the Stride and eDFD for the eStride team). The
second sub-task required an analysis (systematic for the Stride and
guided for the eStride team) of the created diagrams according
to the steps described in Section 2. The analysis results had to be
documented with a report and submitted electronically. The report
had to contain a list of identified threats, their location, attack sce-
narios, and estimated priority of the threat. The participants were
given a template for the report. The purpose of the template is to
simplify and standardize the analysis of the reports. The template
consisted of a unique ID of the diagram element, threat category,
attack scenario, and threat priority.
3.5 Execution
Figure 1 depicts the execution of the case study. The workshops
were split into three hour sessions taking place on three separate
days during the same week. The authors supervised all sessions
that took place. All the material (i.e., architectural documentation
of the industrial case, training material, description of task, report
template) was shared with the participants a week in advance. Their
were strongly encouraged to read all the material (about 20 pages)
before the start of the case study.
Day 1: Training. On the first day, the teams were separated and
trained (3h) to accomplish their task. The training consisted of
brushing up basic security concepts, building DFDs (or eDFDs), and
performing STRIDE (or eSTRIDE). In a separate training session,
we warned both facilitators to monitor the progress and speed up
the discussion, if necessary.
Day 2: Building diagram. On the second day, the teams were
given printed copies of all the material and worked on their task.
The participants were allowed to continue with the second sub-task
(diagram analysis) in case they finished the first sub-task. With
respect to complexity of the industrial case, we alloted only three
hours per day to simulate realistic time constraints. The authors
observed and recorded the sessions, but did not participate in the
discussion.
Day 3: Analyzing the diagram. On the third day, the teams were
given the same printed material, and the diagram they had created
the previous day. The teams continued working on their task until
they were either finished or ran out of time. One participant of the
Stride team was 30 minutes late on the third day of the case study.
3.6 Data collection and measures
We adopted a mixed methodology of qualitative and quantitative
data analysis as suggested by Creswell et al. [2]. First, we describe
how the qualitative data (i.e., recordings of threat analysis sessions)
were collected and what measures we adopted for the analysis.
Second, we describe the quantitative data (i.e., participant hand-ins)
collection and measures.
Qualitative measures.We qualitatively analyzed the recorded ses-
sions to answer RQ3. The recordings were manually transcribed by
the first author using software for qualitative analysis of interview
data1. The manual transcription process helped the researchers
1https://www.qsrinternational.com/nvivo/home
Table 2: Code hierarchy for observing analysis activities and
events. Codes for events are marked by the † symbol.
Level 0 Level 1: Level 2
Building Drawing on the board
diagram Architecture abstraction
Asset analysis: Asset trace, Security concern,
Concern value
Extending the diagram
Focusing on critical architecture
Scope discussion
Making an assumption†Analyzing Attack scenario development
diagram Domain discussion
Threat feasibility: Importance, Attack scenario
and surface
Threat consequence
Threat prioritization
Threat reduction
Using assumption†Updating diagram†High-priority threat found†Low or Medium-priority threat found†
Support Pointing at board†activities Referring to task description†
Referring to assumptions†Referring to case document†Referring to training material†Break†Unsure
Documenting
Detour Chatting
Difference in opinion
Terminology
gain a deeper understanding of the recorded material. After hav-
ing a thorough understanding of the recordings, the first author
coded the transcriptions. Coding is a technique for systematically
marking chunks of transcriptions. The analysis of code occurrences
reveals trends and supports a qualitative analysis. We used coding
guidelines described byWohlrab et al. [21] to ensure the correctness
of this step. Table 2 depicts an iteratively developed hierarchy of
codes. We coded activities related to diagram building, analysis ofdiagram, support activities, and detour activities. We used the same
codes for coding activities in both teams. With respect to diagram
building, we coded architecture abstraction, assets analysis, making
assumptions, scope discussion, etc. Regarding diagram analysis, we
coded attack scenario development, threat feasibility discussion,
threat consequence, and the like. After assessing the participants’
hand-ins (described in Quantitative measures), we also marked im-
portant events (marked with † in Table 2) in the transcriptions. For
instance, a correct discovery of a high-priority threat. Regarding
detour activities, we coded terminology discussion, difference in
opinion, and chatting. Finally, we coded supporting activities (e.g.,

Finding Security Threats That Matter: An Industrial Case Study Conference’17, July 2017, Washington, DC, USA
Create DFD
STRIDE session
eSTRIDE session
Identified threats
CreateeDFD
Documentation
Security expert
Facilitator
Domain expert
Training
Training
Documentation
Day 2 Day 3Day 1
Figure 1: The execution of the case study.
drawing on the board). These codes were manually inserted in the
transcriptions.
Quantitative measures. We quantitatively analyze the reports
handed in by our participants to answer RQ1 and RQ2. The first
author assessed the participant hand-ins and assigned priorities to
the reported threats (high, medium, low). The hand-ins included
pictures of the created diagrams, list of assumptions, and a list of
identified threats (documented according to the provided template).
This assessment was validated by the industrial experts. This mea-
surement allows us to identify differences between the two groups
across the priority classes.
This work refers to a true positive (TP) as a correctly identified
threat. This means that: (a) the participants found the threat in
the correct diagram location, (b) the participants found a realistic
attack scenario for the security threat or the participants found a
security vulnerability, and (c) the threat is correct with respect to
the assumptions the participants made.
We refer to a false positive (FP) as an incorrectly identified
security threat. This means that the participants found the security
threat in the wrong location or the threat is not correct with respect
to the assumptions the participants have made.
In addition, we marked security threats that might be correct, but
could not be assessed as correct due to insufficient information (I I ).The reported threats were marked with insufficient information if
(a) the participants found the security threat in the right location
of the diagram, and (b) the threat is correct with respect to the
assumptions the participants have made, but (c) the participants
neither found a realistic attack scenario nor identified a security
vulnerability.
Precision (P = T PT P+F P ) was measured as the ratio between
correctly identified threats and all identified threats. Productivity
(Prod = T Ph ) was measured as the amount of correctly identified
threats per hour.
In addition, we quantitatively analyzed the transcribed record-
ings to answer RQ3. As mentioned before (seeQualitative measures),coding transcriptions enabled us to track the exact location (e.g.,
index in the text where the activity starts) of a particular activity in
the transcript. We analyze the recordings by observing activity code
locations (and the distance between them) in the transcriptions.
There is an element of time in the distances between activities.
For instance, two activities can be close in the transcription, but
in reality, there may have been a pause in the conversation. Time
is not considered explicitly in our distance measure. We do not
use timestamps to measure the distance because, even is inserted
often, timestamps can only provide a coarse-grained estimation
of the distance between activities. Instead, we normalize the aver-
age distance with the length of the transcription. In this way, we
implicitly consider time in our distance measure. Therefore, the spa-
tial distance (i.e., amount of characters in text) between activities
works as a proxy of the temporal distance. The average distance
was measured as the average number of characters separating the
starting indexes of the code occurrences. Let A be a code occurring
n times in transcription TR, and let B represent a different code oc-
curringm times in transcription TR (m,n ∈ N, and m,n > 0). Thenumber of characters contained in TR is denoted by len(TR). Letalso o be some occurrence in transcription TR and let indexo f (c)be the index of the first character of the occurrence in TR. Then,the average distance dist between code A and B was obtained as
follows:
dist =
∑m,ni, j=0(| indexo f (o
Ai ) − indexo f (oBj )|) × 100
i × j × len(TR) (1)
In other words, dist betweenA and B shows the average percentage
of the transcription chuck separating the code pair. For instance
in Stride, the code threat consequence and threat prioritization
are on average separated by 2.23 % of the entire transcription (see
Table 4).
4 RESULTS
This section reports the results of the quantitative and qualitative
analysis of the collected data.
4.1 RQ1: Productivity
Table 3 shows the results obtained from assessing the hand-ins of
the participants. Overall, the Stride team documented 27 threats,
whereas the eStride team documented only 13 threats. This is not
surprising, considering that eStride guides the analysis towards
threat reduction. Neither Stride not eStride team documented
incorrect threats (FPs). The amount of TPs is not different for the
compared techniques (Stride: 12, eStride: 13). Further, no big

Conference’17, July 2017, Washington, DC, USA Katja Tuma †, Christian Sandberg, Urban Thorsson, Mathias Widman, Riccardo Scandariato †
Table 3: A quantitative assessment of the hand-ins.
Stride eStride Common
Correct threats (TP) H 4 8 4
M 2 1 0
L 6 4 2
Total 12 13 6
Incorrect threats (FP) 0 0 -
Insufficient info (I I ) 15 0 -
Precision TP/(TP + FP) 1 1
Productivity TP/h 3 2.6
differences were observed in the productivity of the compared tech-
niques (Stride: 3 vs eStride: 2.6).
All the threats that were marked with I I were thoroughly dis-
cussed with the co-authors from the automotive industry. Note that
the authors tried to be conservative with discarding threats. As
per the measures mentioned before (Section 3), the authors only
marked threats with I I if the participants failed to identify an attack
scenario or a security vulnerability. To verify this, all the collected
data were examined (i.e., hand-ins, and recordings). We discuss this
matter further in Section 5. About half of the documented threats
(15) from the Stride team were marked with insufficient informa-
tion (I I ). A deeper analysis of the hand-ins revealed differences in
the level of detail each identified threat was described. For instance,
the eStride team documented an information disclosure threat to
the mobile app as:
“Data collection of . . . , which can be used to access . . .withoutbeing connected to . . . ”
On the other hand, the Stride team documented the same threat
as:
“We can lose the credentials. The phone can be hacked.”Further, the recordings showed that the eStride team developed
and discussed a feasible attack scenario where such data collection
could occur. On the other hand, the Stride team agreed that the
phone can be hacked, yet did not discuss how this can occur. For
this reason, such a threat was marked with I I . Note that, the Strideteam did not perform a careless analysis, despite having a very
quick pace.
4.2 RQ2. Discovering high-priority threats
Figure 2 depicts when the teams discovered high-priority threats.
The Stride team discovered 4 high-priority threats, three of which
they discovered already during the first day. The last high-priority
threat was discovered by the Stride team about 40 minutes into
the second day. Note that, the Stride team started analyzing the
diagram one hour into the first day. The eStride team discovered
8 high-priority threats, most of them during the second day. Yet,
they discovered one high-priority threat already during the first
day while discussing security objectives of assets and their values.
The eStride team started analyzing the diagram on the second
day. Compared to the Stride team, the eStride team did not find
high-priority threats faster.
4.3 RQ3. Focus of activities and activity
patterns
We investigate similarities and differences in activity focus, time-
lines of activities, and activity patterns to answer RQ3. First, we
report on the focus of activities by presenting the code coverage
of the transcriptions. Second, we present a detailed time-line of
activities. Finally, we report on the activity pairs by presenting their
average distance in the transcriptions.
Focus of activities. Figure 3 shows the percentage of coding
references for high-level activities extracted from NViVo. During
the first day the Stride team did not focus on one particular activ-
ity due to having started with the second step of the analysis (see
Section 2) quite early. Diagram analysis covered 27% of the recorded
session (mainly discussing the domain and developing attack sce-
narios). Building the diagram covered 28% of the transcription. The
team detoured often from the prescribed procedure (13%). Finally,
the Stride team was involved in more support activities during
the first day (32%). The eStride team did not start with the second
step of the analysis. Rather, they analyzed assets when extending
the diagram (sec Section 2). Similarly, the eStride team detoured
often during the first day (11%). In contrast to Stride, the support
activities covered only 19% of the transcription during the first day.
Further, the eStride team focused on diagram building (45%).
During the second day, the Stride team focused on diagram
analysis (70%). Support activities covered a quarter of the Stride
transcription (25%). The team made minor changes to the diagram
(5%) but did not detour from the analysis. Similarly, during the
second day the eStride team focused on diagram analysis (58%)
and support activities (26%) andmademinor changes to the diagram
(4%). In contrast, the eStride team detoured (12%) from the analysis
procedure during the second day.
Time-line of activities. We analyzed time-lines of code occur-
rences to answer RQ3. Figure 4 depicts the time-lines of activities
for both teams. The time-lines show the aggregated number of code
occurrences per ten-minute time frame. Note that, the Stride tran-
scription is almost half the size of the eStride transcription (90,612
vs 151,907 characters). This explains the different proportion of
code occurrences in the time-lines. In what follows, we discuss the
similarities and differences in activities during the first day and the
second day.
Similarities (Day 1). In the first 15 minutes both teams focused
on building the diagram. In particular, both teams focused on ab-
stracting the architecture, discussing the domain, discussing the
scope, and drawing on the board. Other support activities in this
time-window include referring to the case documentation. In the
span of the entire session, both teams sometimes detoured from
the instructed analysis procedure. The detours during the first day
are fairly evenly distributed across teams. Both teams made the
assumptions during the first day, and made one last assumption
about one hour into the second day.
Differences (Day 1). About an hour into the first day, both teams
focused on support activities (i.e., referring to case documenta-
tion). The Stride team finished building the diagram after about an
hour. They read parts of the case documentation aloud to validate
the diagram before they started to analyze it. On the other hand,

Finding Security Threats That Matter: An Industrial Case Study Conference’17, July 2017, Washington, DC, USA
0h00' 0h28' 0h57' 1h26' 1h55' 2h24' 2h52' 0h00' 0h28' 0h57' 1h26' 1h55' 2h24' 2h52'
0h00' 0h28' 0h57' 1h26' 1h55' 2h24' 2h52'
Day 1
0h00' 0h28' 0h57' 1h26' 1h55' 2h24' 2h52'
Day 2
STRIDE
eSTRIDE
Figure 2: High-priority threats discovered by the Stride (top) and eStride (bottom) team.
27%
28%13%
32%70%5%
25%
25%
45%
11%
19%
58%4%
12%
26%
STRIDE
eSTRIDE
Day 1 Day 2
AnalyzingBuildingDetourSupport
Figure 3: Percentage of coding references for Stride (top)
and eStride (bottom).
the eStride team started extending the diagram with domain as-
sumptions after about an hour. They verified each assumption by
reading the case documentation aloud. The eStride team started
looking for threats only on the second day. In contrast to Stride,
the eStride team made over-all less assumptions and documented
them early-on. The Stride team agreed upon some assumptions
but did not document them.
Similarities (Day 2). As instructed, both teams performed activities
related to diagram analysis which are accompanied by support ac-
tivities (mainly, documenting threats). Roughly speaking, the partic-
ipants alternated between analyzing the diagram and documenting
threats. This pattern is more apparent in Figure 4 (eStride team), as
the Stride teamwas very quick in documenting threats. Both teams
had a strong focus on diagram analysis in two time-frames (Stride
01:10:00-01:15:00 and 01:20:00-01:25:00, eStride 01:20:00-01:25:00
and 02:00:00-02:05:00). In all four cases, the teams managed to thor-
oughly analyze one threat in a span of five minutes. This entailed
developing attack scenario, using an assumption, discussing threat
consequence, determining feasibility, and finding a correct threat.
Differences (Day 2). Compared to the first day, both teams detoured
less from the instructed analysis procedure. In particular, the Stride
team did not detour at all. In fact, the Stride team finished about
one hour earlier. Compared to eStride, the Stride team focused
less on feasibility analysis during the second day and attack sce-
nario development. The Stride team often updated their diagram
during the second day. Specifically, the team merged data flows and
removed one external entity and three data stores.
In summary, during the first day the eStride team spent more
time building the diagram and during the second day, the Stride
Table 4: The differences between activity distances in
Stride and eStride. In case of a small difference, activity
codes A and B have a similar average distance in both teams.
Code A & Code B Stride eStride ∆ dist
Threat reduction & Ref. to as-
sumptions
close close 0.10
Terminology & Domain discus-
sion
close close 1.70
High-priority threat found & At-
tack scenario or vulnerability
close close 1.84
Asset analysis & Updating dia-
gram
far close 29.0
Ref. to training material & Unsure close far 38.38
Scope discussion & Updating dia-
gram
far close 38.24
team did not detour from the analysis procedure. We further discuss
this in Section 5.
Distance between activity pairs. We calculated average dis-
tances between all activity pairs for both teams. Table 4 depicts
the difference (∆) between the activity pair distances of Stride and
eStride. We omit some entries from Table 4 due to space limita-
tions. For example, in both teams drawing on the board was close
to architecture abstraction, as expected, and therefore omitted. We
discuss the similarities (smallest differences in the top part of Table
4) and differences (largest differences in the bottom part) between
teams. In addition, we analyzed the distances between single activi-
ties in relation to all other activities for both teams. For instance,
Figure 5 shows the average distance between finding a high-priority
threat and other activity codes for both teams.
Similarities. Both teams referred to their assumptions during threat
reduction to make sure the reductions do not lead to overlooked
threats (∆dist = 0.10). When the teams referred to assumptions,
they read the assumption out loud. This is interesting, as the ex-
perimenters did not instruct them to perform this step. In addition,
both teams engaged in a domain discussion while clarifying the
terminology. Finally, both teams found high-priority threats while
developing attack scenarios or identifying vulnerabilities.
Figure 5 shows, that the average distance between using assump-
tions and finding high-priority threats is small in the transcriptions
of both teams. The teams used assumptions to justify their rea-
soning for a threat or vulnerability existence. The eStride team
also read the assumptions out loud. Therefore, the average distance

Conference’17, July 2017, Washington, DC, USA Katja Tuma †, Christian Sandberg, Urban Thorsson, Mathias Widman, Riccardo Scandariato †
DetourAnalyzingBuildingSupport
0h00' 0h15' 0h30' 0h45' 1h00' 1h15' 1h30' 1h45' 2h00' 2h30'
DetourAnalyzingBuildingSupport
0h00' 0h15' 0h30' 0h45' 1h00' 1h15' 1h30' 1h45' 2h00' 2h30'
Day 1
STRIDE
eSTRIDE
13 1610 10
5 50 0
0h00' 0h15' 0h30' 0h45' 1h00' 1h15' 1h30' 1h45' 2h00' 2h30'
28 2520 2010 10
0 00h00' 0h15' 0h30' 0h45' 1h00' 1h15' 1h30' 1h45' 2h00' 2h30'
Day 2
Figure 4: Time-lines of code occurrences for the Stride (top) and eStride team (bottom).
0
20
40
60
Drawing on boardArchitecture abstraction
Asset analysis
Extending the diagram
Scope discussion
Making an assumption
Attack or vulnerability
Domain discussionFeasibility analysis
Threat consequenceThreat prioritization
Using an assumption
Updating the diagram
Pointing at board
Ref. to task description
Ref. to assumptions
Ref. to documentationRef. to training material
STRIDE eSTRIDE
Figure 5: The average distance between finding a high-
priority threat and other activities for both teams. The
smaller the distance, the closer the activity to finding a high-
priority threat.
between referring to assumptions and a finding high-priority threat
is small in the eStride transcriptions.
Differences. In contrast to Stride, the eStride team performed an
asset analysis and iteratively updated the diagram with the extra
security information (∆dist = 29.0). In addition, the eStride team
discussed the scope of the analysis while updating the diagram. For
instance, they discussed which parts of the system can be left out of
the analysis (assumed as trusted). This was not discussed at length
in the Stride team. During the first day, Stride team referred to
the training material when unsure.
Compared to Stride, the average distance between finding im-
portant threats and discussing threat feasibility (and consequence)
is smaller in the eStride transcription (see Figure 5). Further, the
eStride team found the first high-priority threat when analyzing
the assets and extending the diagram in the first day. Compared to
eStride, the average distance between finding important threats
and referring to training and case documentation is smaller in the
Stride transcription. In fact, the Stride team relied more on the
support material, whereas the eStride team relied more on the
domain expert. This may be due to factors of team dynamics, rather
then the differences in the techniques. Finally, the Stride team
made several assumptions during diagram analysis, therefore the
average distance between making assumptions are finding impor-
tant threats is smaller, compared to the eStride transcription.
In summary, for both teams assumptions played an important
role in finding high-priority threats and in reducing threats. In ad-
dition, developing attack scenarios and discussing threat feasibility
supported finding high-priority threats (more so in the eStride
team). However, our analysis indicates that differences in activity
patterns might depend on factors related to team dynamics rather
then the differences in the techniques.
5 DISCUSSION
In this section we discuss the results and answer the research ques-
tions.
5.1 RQ1: Productivity
Our assessments show that most of the I I marked threats (13 out
of 15) of Stride were of low-priority. Yet, half of these threats (8
our of 15) were still discussed in the eStride team. In such cases,
the eStride team identified a possible attack scenario, but found
it infeasible. In one example, a correctly identified a high-priority
threat by the eStride team was marked with I I in the Stride team.
The rest of these threats (6 out of 15) were skipped in the eStride
due to the eStride reductions.
Six security threats were correctly discovered by both teams
(fourth column in Table 3). Four out of those common threats were
high-priority threats, and two were of low-priority. The Stride
team discovered 6 threats that were not discovered by the eStride
team (2 medium and 4 low-priority). In such cases, the eStride
team either skipped this location due to eStride reductions (2 low, 1
medium) or agreed that the attack is not feasible (2 low, 1 medium),
and documented:
“No interesting attack scenario.”The eStride team discovered 5 threats that went unnoticed by
the Stride team. In contrast, these threats were of high (4) and
medium priority (1). In these cases, the Stride team could not find
any vulnerability of attack, and documented, for instance:
“Repudiation is not a problem.”A possible explanation is that the Stride team may not have dis-
cussed threat feasibility enough to find feasible attack scenarios or
that they were simply overlooked.

Finding Security Threats That Matter: An Industrial Case Study Conference’17, July 2017, Washington, DC, USA
We investigated productivity to answer RQ1. We did not ob-
serve a difference in the productivity of the teams. However, the
eStride team has found more threats of high-priority (4) which
were overlooked by the Stride team. In contrast, the Stride
team discovered more threats of low-priority (4) and finished
early. This explains the slightly better productivity in Table 3.
5.2 RQ2: Discovering high-priority threats
Both teams started exploring the diagram from external entities,
where some high-priority threats we located. Therefore, the first
few high-priority threats were correctly discovered by both teams
at the very beginning of diagram analysis. The Stride team chose
to continue the exploration with the processes (this was completed
at the end of the first day). On the second day, the Stride team
systematically explored all the data flows. In contrast, the eStride
team continued the exploration with important assets in an end-to-
end fashion. Possibly, this may have helped in finding more high-
priority threats. Yet, extending the diagram with security-relevant
information required more effort in the beginning of the analysis.
Concerning RQ2, we found that the eStride team found double
the amount of high-priority threats (8) compared to the Stride
team (4). Further, all high-priority threats that were discovered
by the Stride team were also discovered by the eStride team.
In the settings of this case study, the eStride team was more
complete with respect to finding high-priority threats. Yet, we do
not have enough evidence to conclude that eStride can identify
high-priority threats sooner.
5.3 RQ3: Focus of activities and activity
patterns
Sometimes, the teams discussed terminology which lead to a dif-
ference in opinion about threat categories (more so in the Stride
team). In particular the spoofing category was often discussed (in
relation to tampering and repudiation). Detours can be minimized
by the facilitator steering the discussion. The Stride team often
referred to the material to reach consensus, instead. Possibly, this
motivated the team to stay closer to the instructed procedure on the
second day. On the second day, the domain expert was 30 minutes
late, during which the team started working with a high pace. In
the eStride transcription, the distance between detours and threat
feasibility analysis was small. Therefore, feasibility analysis may
have slowed down the analysis. Discussing threat feasibility often
leads to estimating the probability of threat occurrence, which is
difficult and can lead to ‘analysis paralysis’. Yet, the facilitator of
eStride often steered the discussion back on track.
Regarding RQ3, we found that the eStride team took longer to
build the diagram, but managed to capture more high-priority
threats. Compared to Stride, the eStride team discussed threat
feasibility in more detail and developed detailed attack scenarios.
On the other hand, the Stride team performed the analysis with a
quick pace and spent less time on building the diagram. For what
concerns the activity patterns, we found that both teams were
careful when making threat reductions, backing those decisions
by referring to assumptions. In addition, assumptions were used
by both teams to justify the existence of threats (in particular
high-priority). Our analysis indicates that differences in activity
patterns might depend on factors related to team dynamics.
6 RELATEDWORK
Recently, Stevens et al. [17] conducted a case study investigating
the efficacy of threat analysis in an enterprise setting. The authors
develop qualitative measures to determine the efficacy of the Center
of Gravity (CoG) technique. The CoG originated in the 19th century
as a military strategy and is by nature a risk-first technique. The
authors design a six-step protocol (including surveys and classroom
sessions) and involve 25 practitioners in the study. Similarly to
this study, they report a very high accuracy of the results handed-
in by industrial practitioners. In addition, they provide empirical
evidence for a perceived usefulness of threat analysis even after 30
and 120 days, which is very promising. Our study is novel in that it
investigates the timeliness of high-priority threats, and the activity
focus of a risk-first and a risk-last technique.
McGraw conducted a study including 95 companies [12]. The
study reports on the security practices that are in place in these
companies. The BSIMM model does not mention STRIDE per se,
rather it highlights the importance of threat analysis. Microsoft
has not published evidence of the effectiveness of the STRIDE-per-
element technique [16]. Similarly, eSTRIDE (coupled with eDFD)
[20] is a recently proposed technique, evaluated solely on the basis
of an illustration.
Tuma et al. [19] conducted a controlled experiment comparing
the two STRIDE variants, STRIDE-per-element and STRIDE-per-
interaction. Similarly to this work, their study quantitatively mea-
sures the precision, and productivity of both variants. Their study
concludes that there is no statistically significant differences in
precision, recall, and productivity of the two STRIDE variants. Yet,
the authors speculate that enlarging the analysis scope from one
(or two) elements to an end-to-end scenario might have an effect
on performance. Their findings are based on quantitative measures,
while we adopted a mixed methodology, including a qualitative
analysis of recorded sessions.
Scandariato et al. [15] have analyzed STRIDE-per-element and
evaluated the productivity, precision, and recall of the technique
in an academic setting. The purpose of their descriptive study was
to provide an evidence-based evaluation of the effectiveness of
STRIDE. Our study, on the other hand, provides a comparative
evaluation (by means of a controlled experiment) of STRIDE-per-
element and the recently proposed eSTRIDE.
Labunets et al [8] have performed an empirical comparison of
two risk-oriented threat analysis techniques by means of a con-
trolled experiment with students. The aim of the study was to

Conference’17, July 2017, Washington, DC, USA Katja Tuma †, Christian Sandberg, Urban Thorsson, Mathias Widman, Riccardo Scandariato †
compare the effectiveness and perception of a visual technique
with a textual technique. The main finding of this study shows that
the visual method is more effective for identifying threats than the
textual one, while the textual method is slightly more effective for
eliciting security requirements.
Existing literature reports on different measures, such as percep-
tion of techniques compared to misuse cases (MUC). The work of
Karpati, Sindre, Opdahl, and others provide experimental compar-
isons of several techniques. Opdahl et al. [14] measure the effec-
tiveness, coverage and the perception of the techniques. Karpati et
al. [6] present an experimental evaluation of MUC Map diagrams
focusing on identification of not only vulnerabilities but also mit-
igations. Finally, Karpati et al. [7] have experimentally compared
MUCs with mal-activity diagrams in terms of efficiency.
7 THREATS TO VALIDITY
We briefly discuss the main limitations of this study. With respect
to the internal threats to validity, we mention the confounding
factors that may have influenced the results. The most important
confounding factor is team dynamics. The performance of a team
might depend on how well the participants work together. High
performing teams have typically been working together for longer
period of time [10]. The researchers were involved in selecting the
members of the teams thus introducing potential bias in the study.
Further, one team (eStride) consisted of an additional member
(trainee). In light of the circumstances and limited resources, such
a selection was necessary. To mitigate this treat, the authors took
careful notes during the execution of the study. We believe that
this did not significantly impact the performance of the eStride
team. Some participants may have worked together before the case
study, while others might have collaborated less in the past. Another
important confounding factor is different background knowledge
across teams. We control for this factor by dedicating a whole
workshop (3 hours) to training the participants. We also mention
the risk of subjectivity in the data analysis and the authorship of
one of the techniques (eStride). The distance between activities
is measured with a spatial measure, as compared to a temporal
measure, thus this measure is more fine grained. To counter the
possible effect of time, we have normalized the measured distances.
Finally, the participants of the eStride team could have understood
that this is a new technique and felt more motivated. This could
have introduced participant bias.
With respect to the external threats to validity, we consider the
threat to generalizability of the results. The study was not repeated
with other participants or with other industrial cases. In addition,
the number of participants was small and is thus hardly a represen-
tative sample of the population. To mitigate this threat, we focused
on conducting the case study in a realistic setting and relied more
on the qualitative analysis results.
8 CONCLUSION
This study investigates the benefits and shortcomings of perform-
ing a risk-first (eStride [20]) compared to risk-last (Stride [16])
threat analysis in an industrial setting. We conduct a case study
with industrial experts. In this setting, we gather empirical evidence
about the performance and execution of the two techniques. The
contributions of this work are three-fold: (i) a quantitative compar-
ison of performance, (ii) a quantitative and qualitative comparison
of execution, and (iii) a comparative discussion of the benefits and
shortcomings of the two techniques. This study found no differ-
ences in the productivity and timeliness of discovering high-priority
security threats. But, we show differences in analysis execution.
In particular, the team using the risk-first technique found twice
as many high-priority threats, developed detailed attack scenarios,
and discussed threat feasibility in detail. On the other hand, the
team using the risk-last technique found more medium and low-
priority threats and finished early. We plan to replicate the case
study with more participants and different industrial cases. An in-
teresting future direction is also conducting a longitudinal study to
understand whether eStride’s benefits (prioritizing the discovery
of high-priority threats) out-weight the limitations (required effort
to build eDFDs and sacrificed coverage of low-prioritized threats).
REFERENCES
[1] Huseyin Cavusoglu, Hasan Cavusoglu, Jai-Yeol Son, and Izak Benbasat. 2015.
Institutional pressures in security management: Direct and indirect influences on
organizational investment in information security control resources. Information& Management 52, 4 (2015), 385–400.
[2] John W Creswell and J David Creswell. 2017. Research design: Qualitative, quan-titative, and mixed methods approaches. Sage publications.
[3] Tore Dybå and Torgeir Dingsøyr. 2008. Empirical studies of agile software
development: A systematic review. Information and software technology 50, 9-10
(2008), 833–859.
[4] Thomas Hilburn, Mark Ardis, Glenn Johnson, Andrew Kornecki, and Nancy R
Mead. 2013. Software assurance competency model. Technical Report. CARNEGIE-MELLON UNIV PITTSBURGH PA SOFTWARE ENGINEERING INST.
[5] Michael Howard and Steve Lipner. 2006. The security development lifecycle. Vol. 8.Microsoft Press Redmond.
[6] Peter Karpati, Andreas L Opdahl, and Guttorm Sindre. 2011. Experimental
comparison of misuse case maps with misuse cases and system architecture
diagrams for eliciting security vulnerabilities and mitigations. In Availability,Reliability and Security (ARES), 2011 Sixth International Conference on. IEEE,507–514.
[7] Peter Karpati, Guttorm Sindre, and Raimundas Matulevicius. 2012. Comparing
misuse case and mal-activity diagrams for modelling social engineering attacks.
International Journal of Secure Software Engineering (IJSSE) 3, 2 (2012), 54–73.[8] Katsiaryna Labunets, Fabio Massacci, Federica Paci, et al. 2013. An experimental
comparison of two risk-based security methods. In Empirical Software Engineeringand Measurement, 2013 ACM/IEEE International Symposium on. IEEE, 163–172.
[9] Ernst & Young Global Limited. 2018. EY Global Information Security Survey2018–19: Is cybersecurity about more than protection? Technical Report. EYGM
Limited.
[10] Marcial Losada. 1999. The complex dynamics of high performance teams. Math-ematical and computer modelling 30, 9-10 (1999), 179–192.
[11] GaryMcGraw. 2006. Software security: building security in. Vol. 1. Addison-Wesley
Professional.
[12] Gary McGraw, Sammy Migues, and Jacob West. [n.d.]. Building Security In
Maturity Model (BSIMM). https://www.bsimm.com. Accessed: 2017-08-25.
[13] Tyler Moore, Scott Dynes, and Frederick R Chang. 2016. Identifying how firms
manage cybersecurity investment. University of California, Berkeley (2016).
[14] Andreas L Opdahl and Guttorm Sindre. 2009. Experimental comparison of attack
trees and misuse cases for security threat identification. Information and SoftwareTechnology 51, 5 (2009), 916–932.
[15] Riccardo Scandariato, Kim Wuyts, and Wouter Joosen. 2015. A descriptive study
of Microsoft’s threat modeling technique. Requirements Engineering 20, 2 (2015),
163–180.
[16] Adam Shostack. 2014. Threat modeling: Designing for security. John Wiley &
Sons.
[17] R Stevens, D Votipka, and E.M. Redmiles. 2018. The Battle for New York: A Case
Study of Applied Digital Threat Modeling at the Enterprise Level. In SEC’18:Proceedings of the 27th USENIX Conference on Security Symposium. USENIX Asso-
ciation, 621–637.
[18] K Tuma, G Calikli, and R Scandariato. 2018. Threat analysis of software systems: A
systematic literature review. Journal of Systems and Software 144 (2018), 275–294.[19] Katja Tuma and Riccardo Scandariato. 2018. Two Architectural Threat Analysis
Techniques Compared. In European Conference on Software Architecture. Springer,347–363.

Finding Security Threats That Matter: An Industrial Case Study Conference’17, July 2017, Washington, DC, USA
[20] Katja Tuma, Riccardo Scandariato, Mathias Widman, and Christian Sandberg.
2017. Towards Security Threats that Matter. In Computer Security. Springer,47–62.
[21] RebekkaWohlrab, Jan-Philipp Steghöfer, Eric Knauss, SalomeMaro, and Anthony
Anjorin. 2016. Collaborative traceability management: Challenges and opportu-
nities. In 2016 IEEE 24th International Requirements Engineering Conference (RE).IEEE, 216–225.