finding and characterizing regulatory regions in the human genome
TRANSCRIPT
Who's in charge here?
Jim Kent ENCODE Data Coordinating Center (DCC)
University of California Santa Cruz
Finding and characterizing regulatory regions in the human genome.
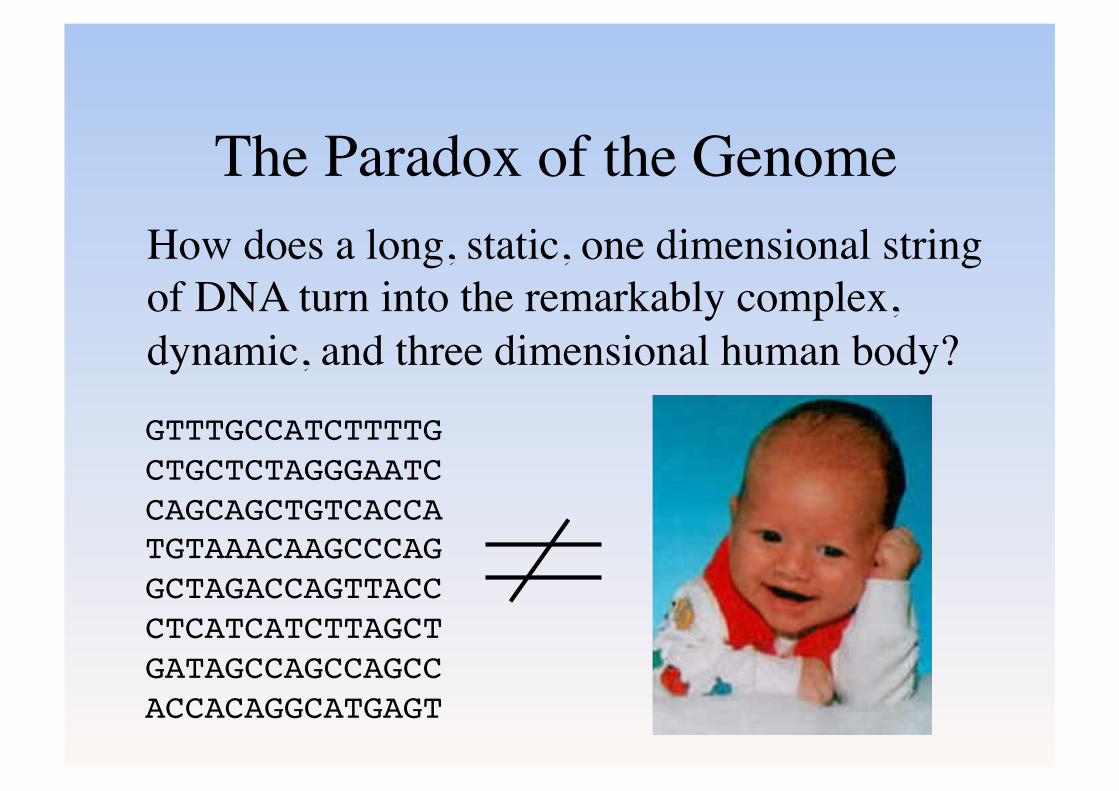
The Paradox of the Genome How does a long, static, one dimensional string of DNA turn into the remarkably complex, dynamic, and three dimensional human body?
GTTTGCCATCTTTTGCTGCTCTAGGGAATCCAGCAGCTGTCACCATGTAAACAAGCCCAGGCTAGACCAGTTACCCTCATCATCTTAGCTGATAGCCAGCCAGCCACCACAGGCATGAGT
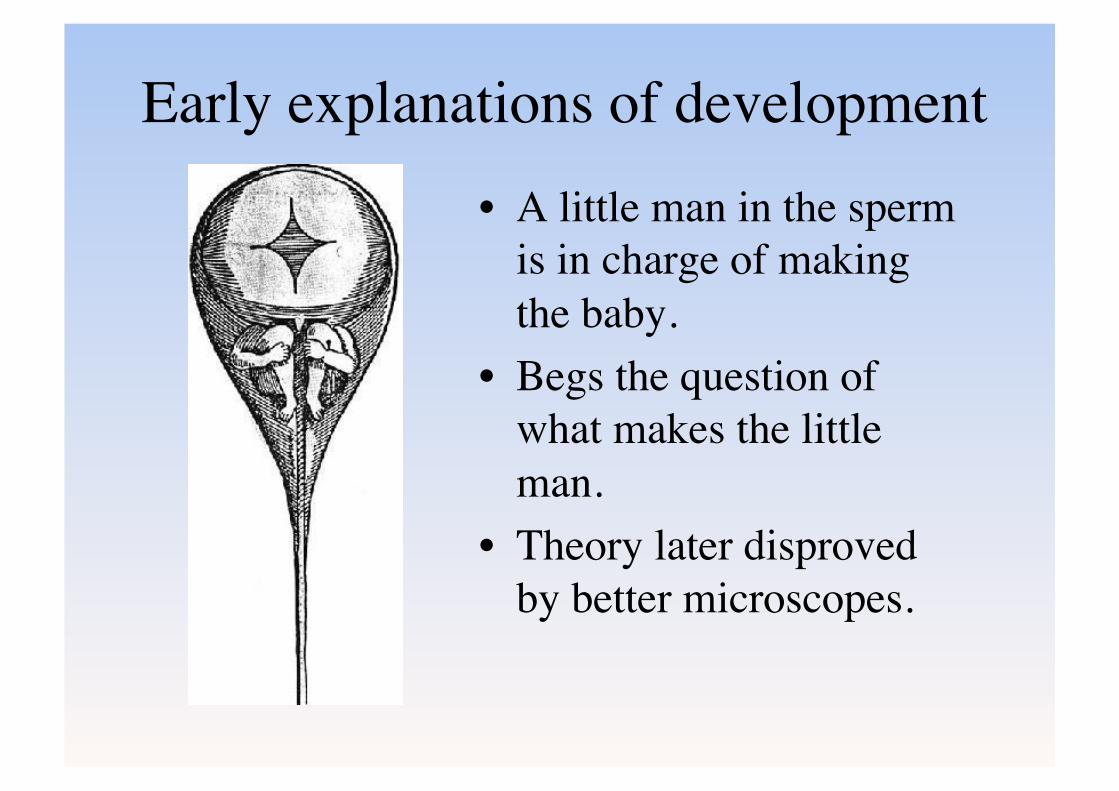
Early explanations of development • A little man in the sperm
is in charge of making the baby.
• Begs the question of what makes the little man.
• Theory later disproved by better microscopes.
More modern thinking • An organism is created by the cooperative/
competitive actions of cells that make it up. • Though all cells (save some specialized
blood cells) share the same DNA, which parts of the DNA are used by cells varies.
• As cells divide they differentiate into different cell types based on signals from other cells, the environment, a bit of randomness, and the cell’s internal state.
• Most of the differentiation decisions ultimately take place in the cell nucleus.
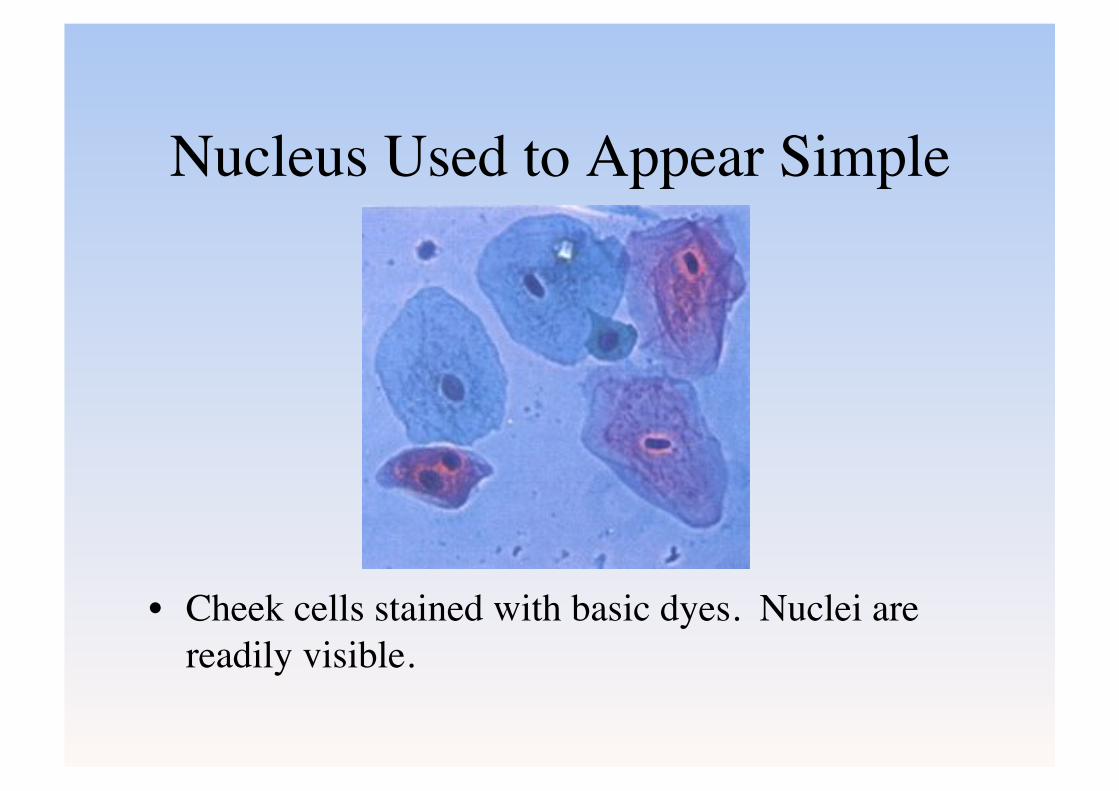
Nucleus Used to Appear Simple
• Cheek cells stained with basic dyes. Nuclei are readily visible.
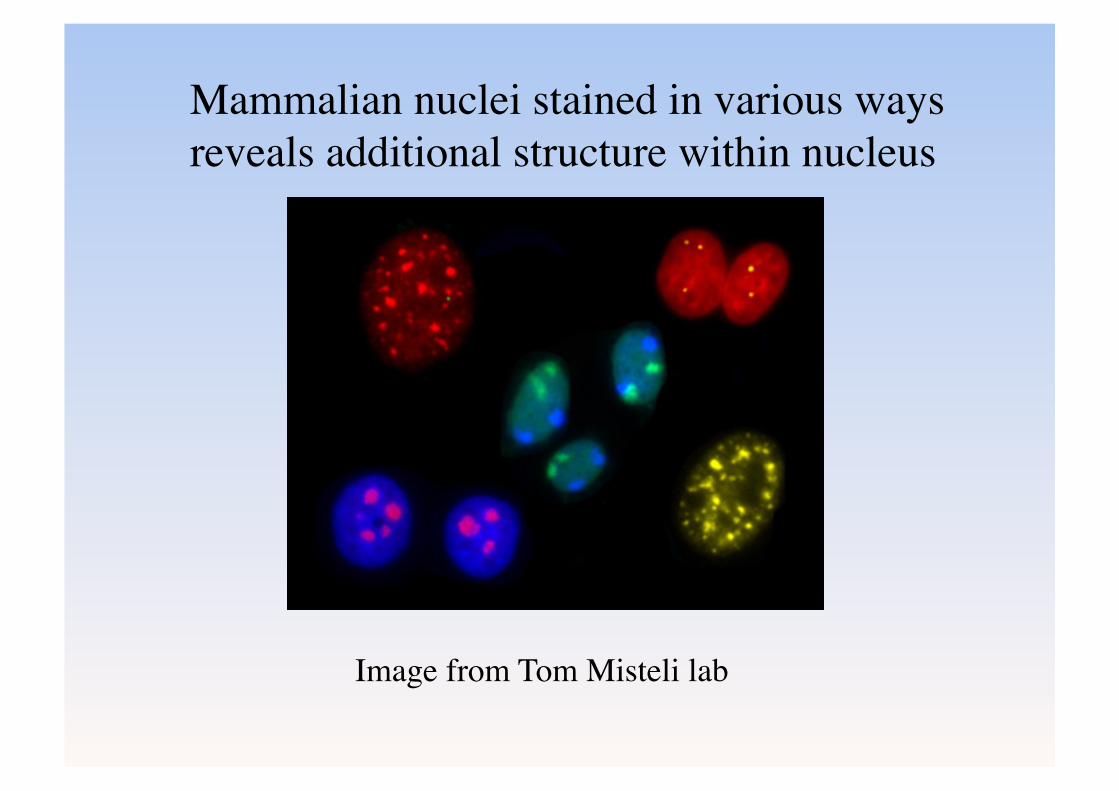
Mammalian nuclei stained in various ways reveals additional structure within nucleus
Image from Tom Misteli lab
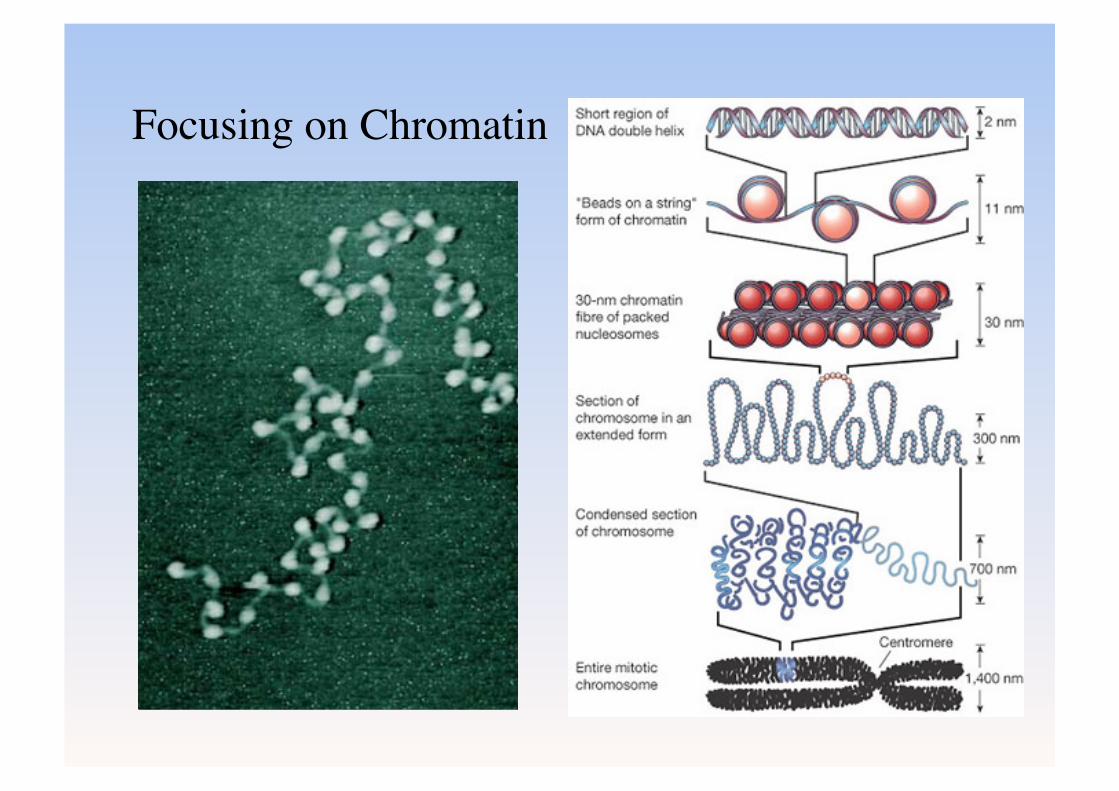
Focusing on Chromatin
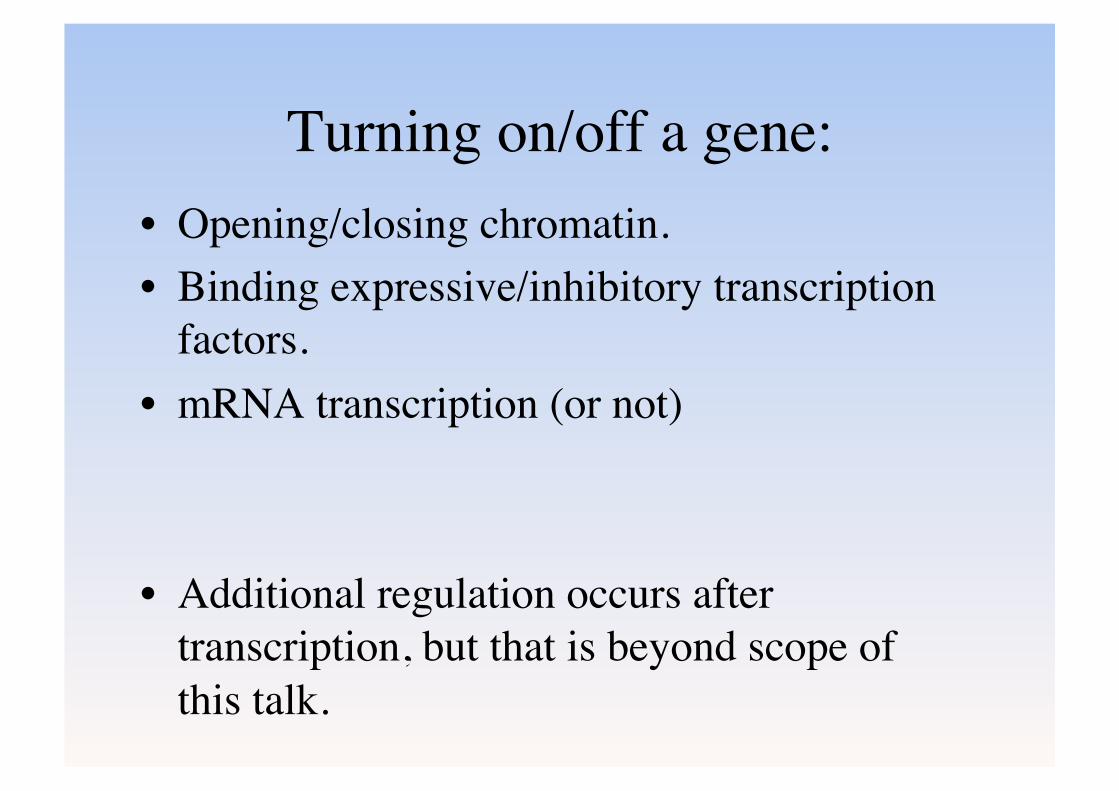
Turning on/off a gene: • Opening/closing chromatin. • Binding expressive/inhibitory transcription
factors. • mRNA transcription (or not)
• Additional regulation occurs after transcription, but that is beyond scope of this talk.
ENCODE Project
• Not to be confused with ENCODE pilot project that just covered 1% of genome.
• 23 biology labs organized into 8 grants, plus an Analysis Working Group and a Data Coordination Center (DCC)
• I’m the principal investigator of the DCC • ENCODE’s overall goal is to identify and characterize all
functional elements of the genome. • ENCODE DCC’s job is to make data accessible and clear, to
put it in UCSC Genome Browser, and to help other databases at NCBI, EBI, and elsewhere import ENCODE data as well.
ENCODE assays on regulation of transcription
• Opening/closing chromatin – DNase hypersensitivity – Chromatin immunoprecipitation & sequencing (ChIP-
seq) of histone marks • Binding expressive/inhibitory transcription factors.
– ChIP-seq of various transcription factors • RNA transcription (or not)
– mRNA sequencing of ENCODE cell lines – Exotic RNA sequencing also (see Tom Gingeras’ talk)
ENCODE DNase Hypersensitivity • Several genome-wide high throughput methods
being used in ENCODE. All involve DNA-seq • Data currently available for >50 cell lines. Plans
for >300 cell lines. • Main artifacts to watch for:
– DNA present in cell in multiple copies: • Mitochondria, centromeric repeats, other repeats • Generally such regions ignored except in “raw”
data. – Sequencing biases (highly g/c rich regions etc.) – In general artifacts easier to work around than those
associated with DNA-chip based assays.
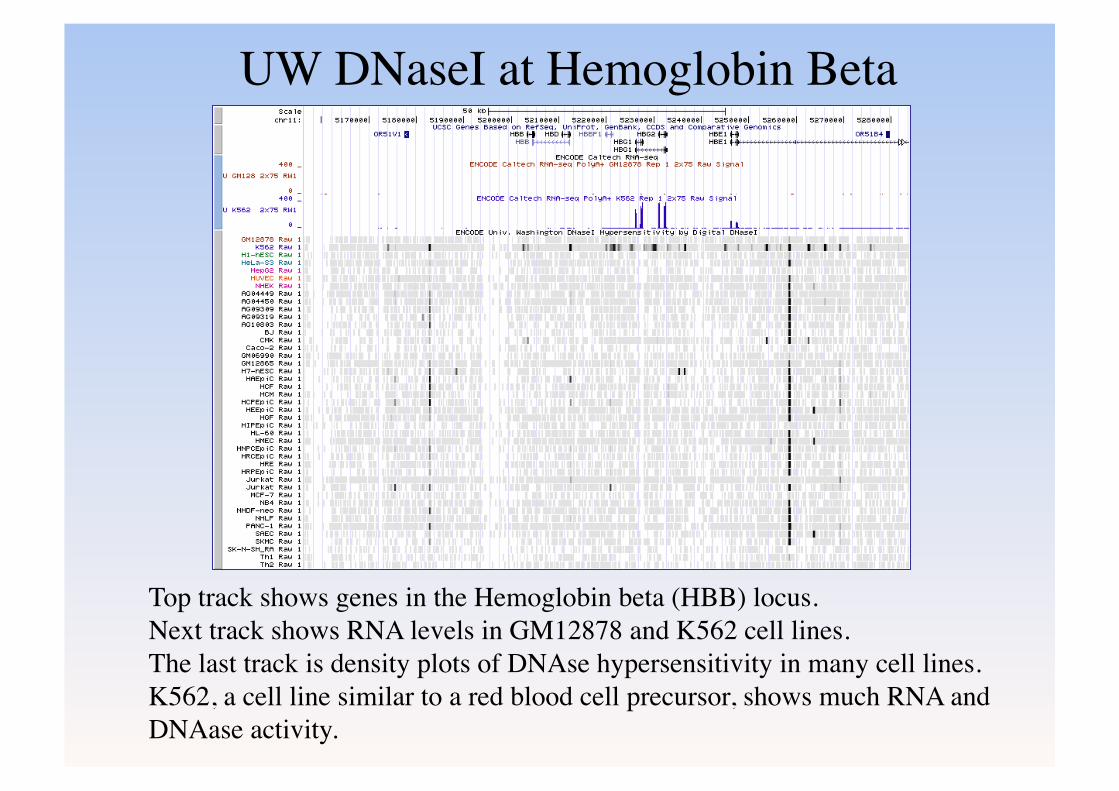
UW DNaseI at Hemoglobin Beta
Top track shows genes in the Hemoglobin beta (HBB) locus. Next track shows RNA levels in GM12878 and K562 cell lines. The last track is density plots of DNAse hypersensitivity in many cell lines. K562, a cell line similar to a red blood cell precursor, shows much RNA and DNAase activity.
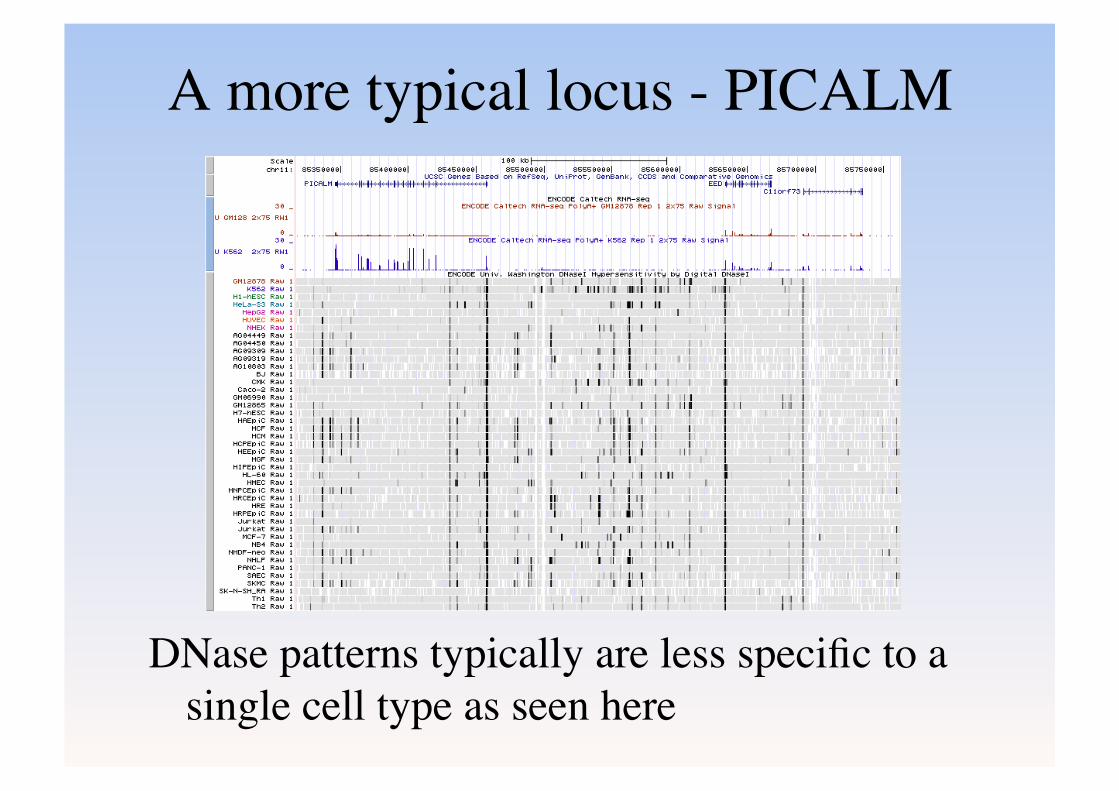
A more typical locus - PICALM
DNase patterns typically are less specific to a single cell type as seen here
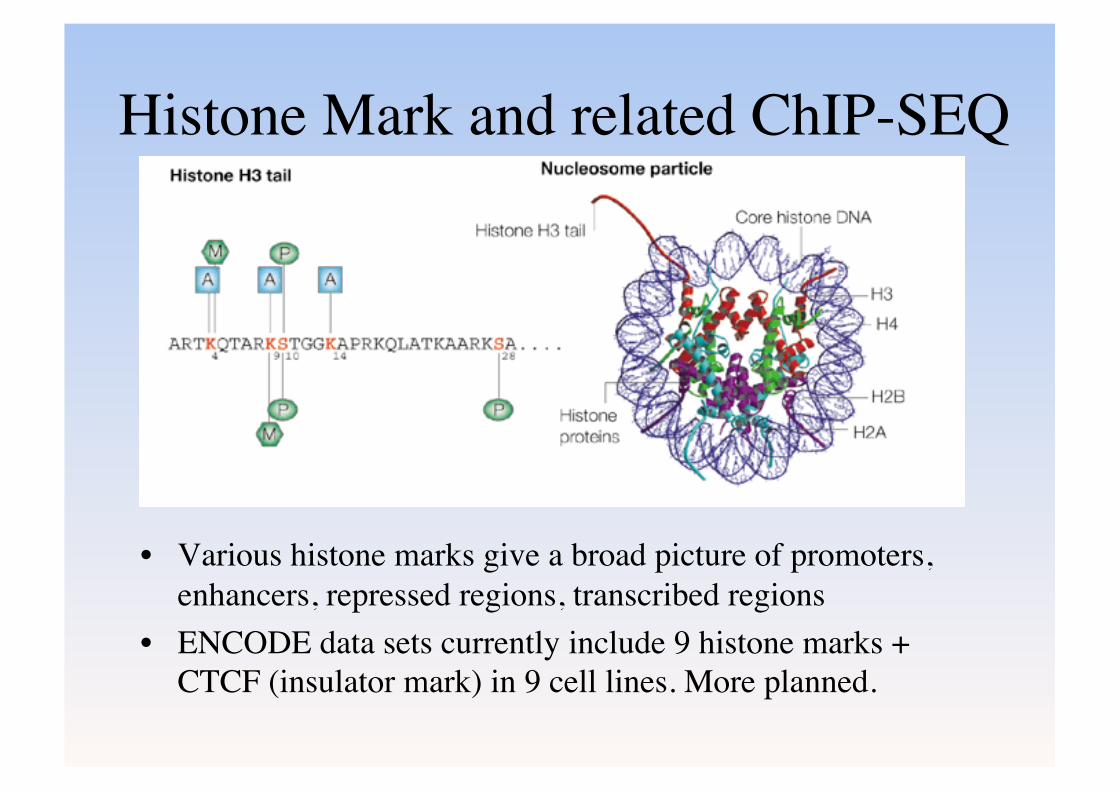
Histone Mark and related ChIP-SEQ
• Various histone marks give a broad picture of promoters, enhancers, repressed regions, transcribed regions
• ENCODE data sets currently include 9 histone marks + CTCF (insulator mark) in 9 cell lines. More planned.
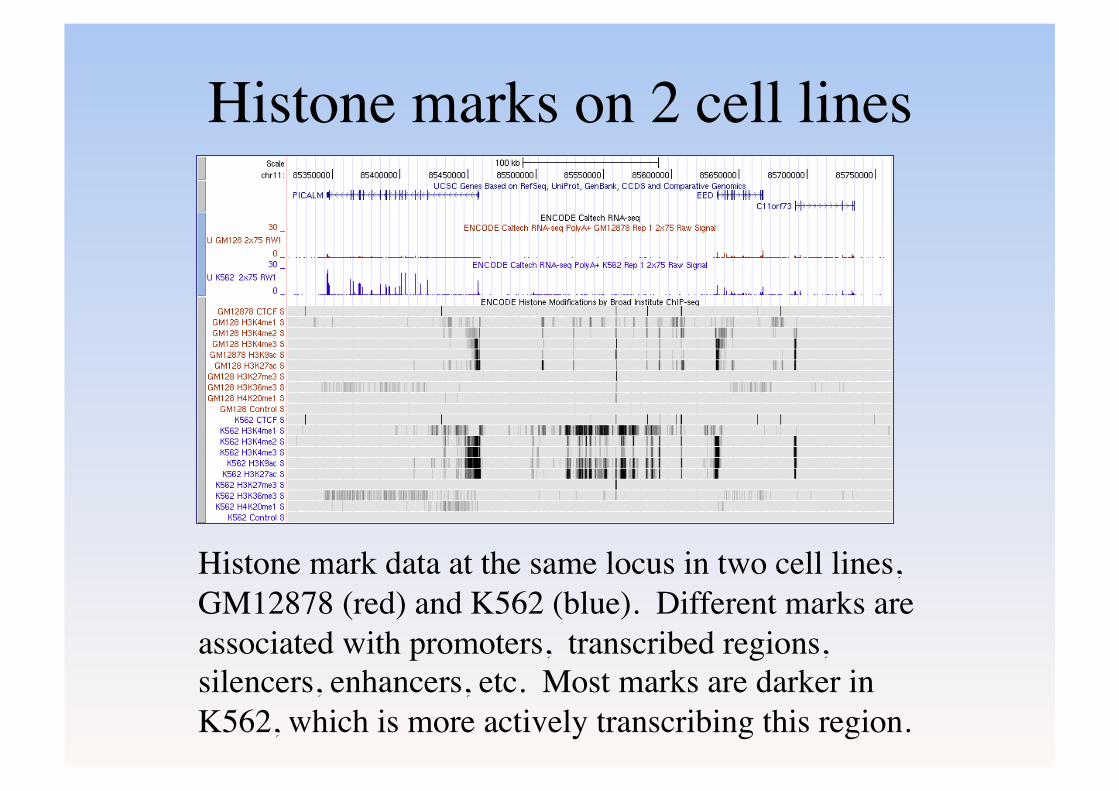
Histone marks on 2 cell lines
Histone mark data at the same locus in two cell lines, GM12878 (red) and K562 (blue). Different marks are associated with promoters, transcribed regions, silencers, enhancers, etc. Most marks are darker in K562, which is more actively transcribing this region.
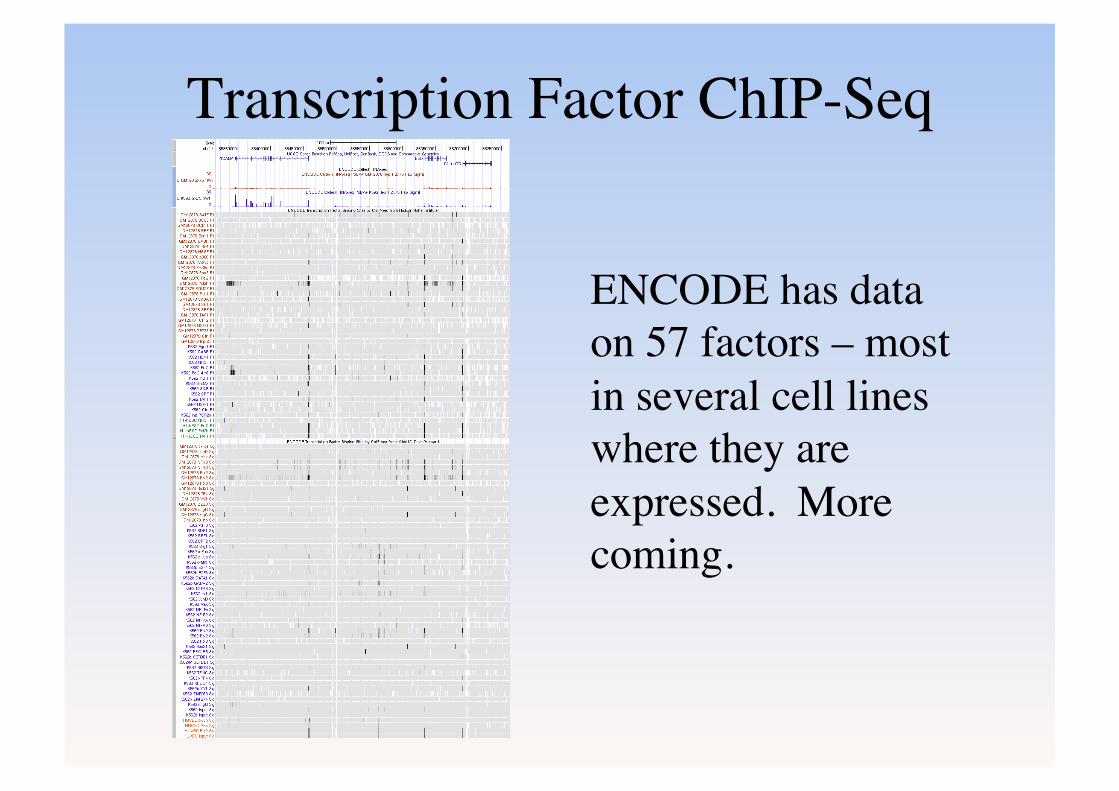
Transcription Factor ChIP-Seq
ENCODE has data on 57 factors – most in several cell lines where they are expressed. More coming.
Making data fit on a single screen
• All of the ENCODE data is excellent, but there is so much of it, it can be hard to know if you’ve seen everything relevant.
• Problem most acute in transcription factor ChIP-SEQ, but really a problem everywhere.
• Lately UCSC has developed several ways of visually summarizing the data.
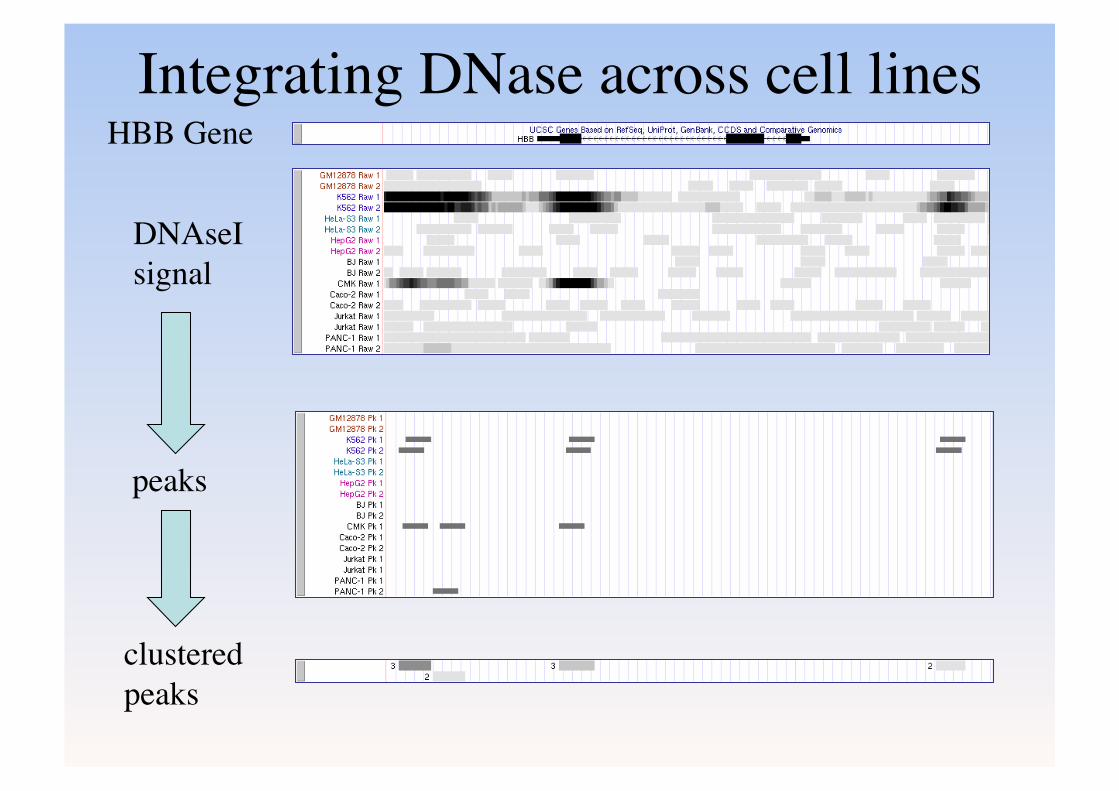
Integrating DNase across cell lines HBB Gene
DNAseI signal
peaks
clustered peaks
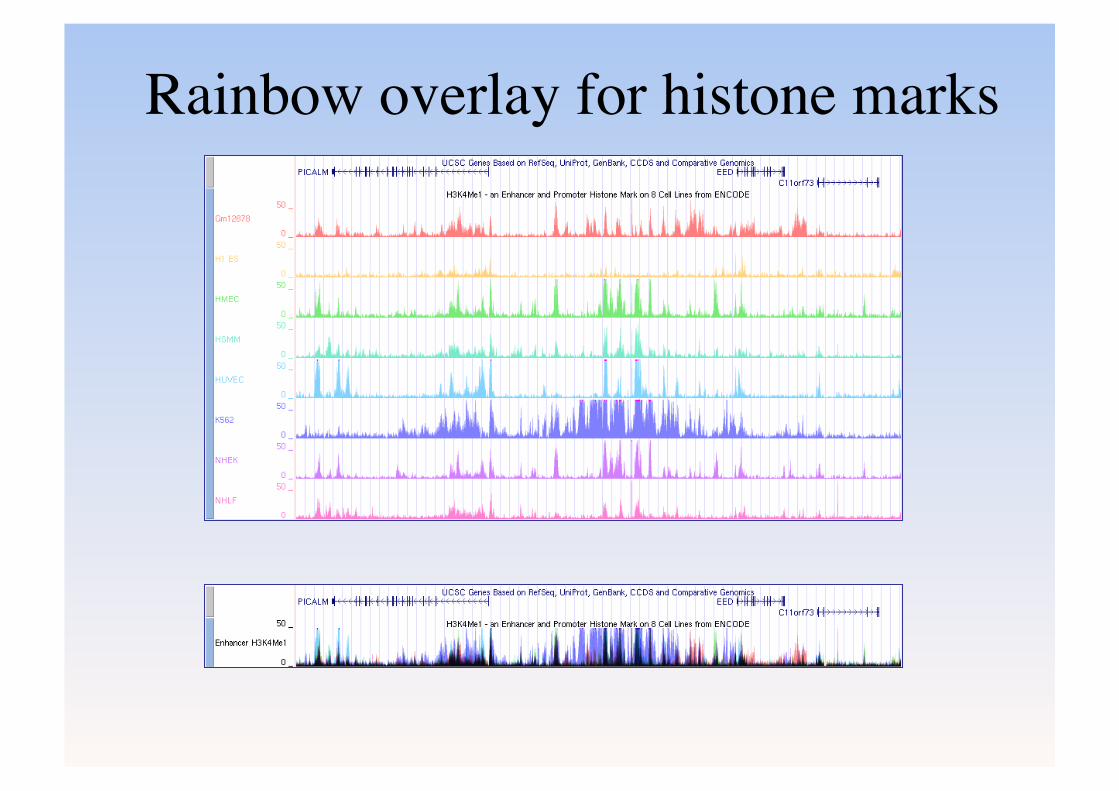
Rainbow overlay for histone marks
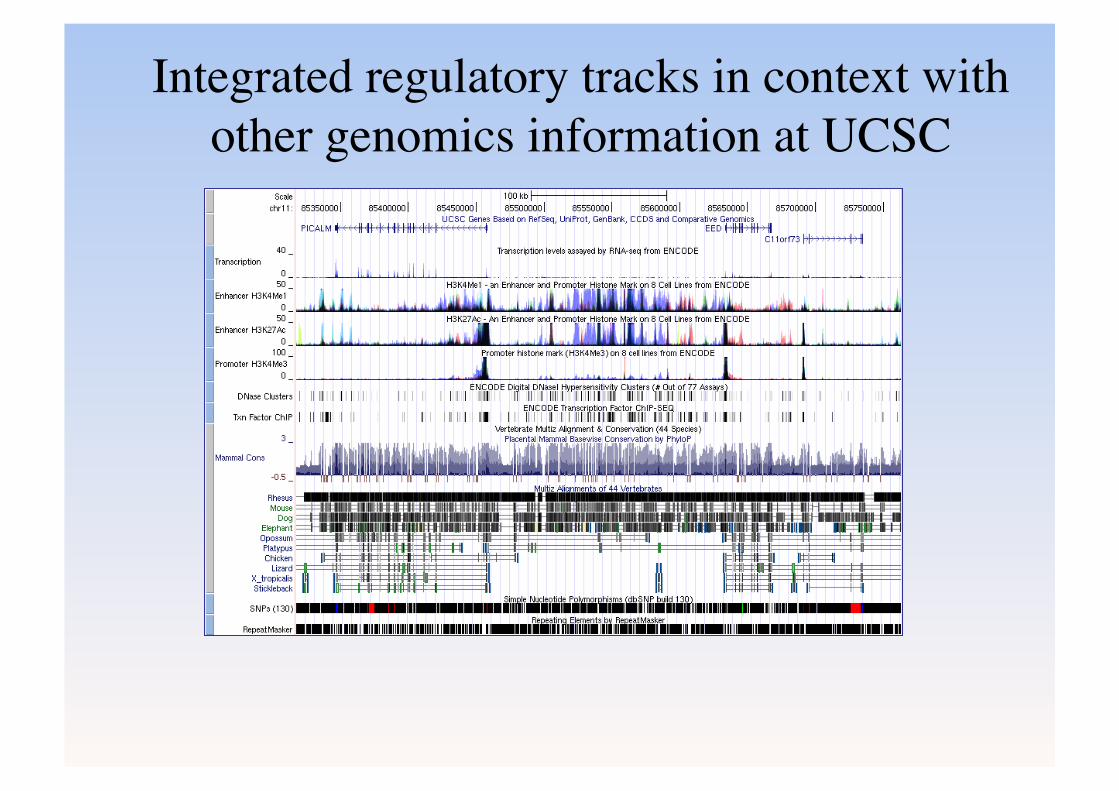
Integrated regulatory tracks in context with other genomics information at UCSC
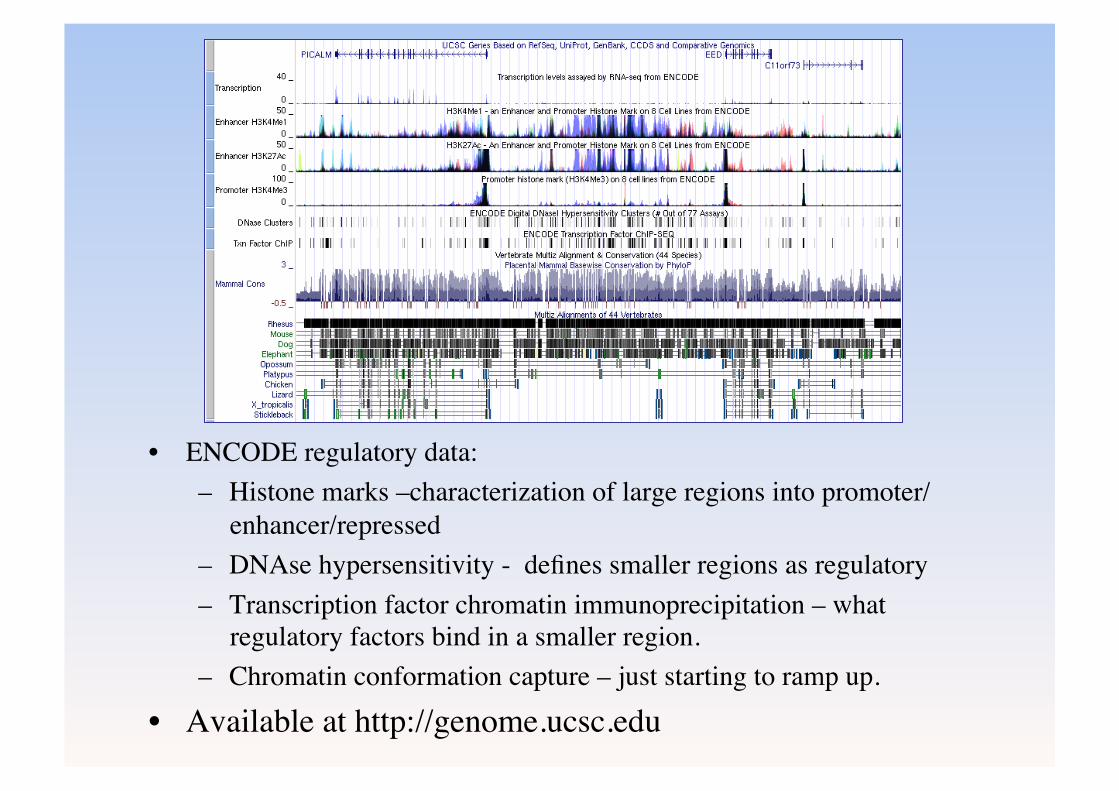
• ENCODE regulatory data: – Histone marks –characterization of large regions into promoter/
enhancer/repressed – DNAse hypersensitivity - defines smaller regions as regulatory – Transcription factor chromatin immunoprecipitation – what
regulatory factors bind in a smaller region. – Chromatin conformation capture – just starting to ramp up.
• Available at http://genome.ucsc.edu
Acknowledgements • Programming – Tim Dreszer, Brian Raney, Galt
Barber • Wrangling – Cricket Sloan, Venkat Malladi,
Melissa Cline • Testing – Katrina Learned and colleagues • Systems –Erich Weiler, Victoria Lin, Jorge Garcia • Cat Herding – Kate Rosenbloom, Jim Kent • Funding – NHGRI, HHMI, QB3
The End